Introduction
Glioma is the most common malignant tumor within the
central nervous system, constituting ~80% of primary brain tumors
(1). Patients with glioblastoma
multiforme have a median survival of ≤15 months (2). Current treatment modalities for
glioma include conventional approaches such as surgical resection,
pharmacological interventions and chemotherapy, as well as emerging
therapies such as immunotherapy and proton therapy. However,
despite technical advancements in these methods, they have not
markedly improved patient survival periods (3-5).
Notably, the propensity of gliomas for local invasion and
metastasis within brain tissue complicates radical resection and
effective local radiotherapy, consequently yielding suboptimal
treatment outcome. Hence, there is an urgent need to elucidate the
molecular mechanisms driving glioma invasion and local metastasis
whilst developing effective therapeutic interventions.
Acetyl-CoA carboxylase 1 (ACC1), the rate-limiting
enzyme in fatty acid synthesis, catalyzes the conversion of
acetyl-CoA to malonyl-CoA (6). As
acetyl-CoA is also a key cofactor for histone acetyltransferases,
ACC1 indirectly influences protein acetylation (7). Elevated ACC1 expression in liver
cancer has been associated with enhanced tumor metastasis via
increased fatty acid synthesis (8). Conversely, ACC1 deficiency in breast
cancer has been associated with invasion and metastasis, attributed
to elevated acetyl-CoA levels that promote protein acetylation and
the upregulation of metastasis-associated gene transcription
(7). These findings suggest that
the role of ACC1 in tumor development exhibits tissue
heterogeneity, likely influenced by signaling pathways triggered by
its regulated metabolites within distinct tissue environments.
Thus, unraveling the underlying regulatory mechanisms of ACC1 may
provide valuable insights into glioma progression.
Our unpublished data demonstrated that ACC1
knockdown promoted U251 glioma cell proliferation, as revealed by
cell density assessment based on phase-contrast images, cell
counting and real-time cell analysis (RTCA). However, MTT assays
revealed lower readouts in ACC1-knockdown cells compared with
controls (Wang et al, unpublished data), suggesting a
discrepancy between assays. Therefore, we hypothesized that MTT may
not accurately reflect ACC1-knockdown cell proliferation.
Furthermore, as MTT relies on succinate dehydrogenase (SDH)
activity to reduce MTT to formazan (9), we hypothesized that ACC1 knockdown
may inhibit SDH activity in glioma cells.
SDH, a mitochondrial complex II enzyme crucial for
electron transport, serves a role in regulating reactive oxygen
species (ROS) levels. Decreased SDH activity has been associated
with elevated ROS and tumor progression in several cancers
(10-12). Increased ROS can activate
signaling pathways that promote cell proliferation, migration and
invasion (13-16). Redox imbalance is also implicated
in glioma progression (17).
The present study aimed to comprehensively
investigate the role of ACC1 in modulating proliferation, migration
and invasion of glioma cells and its clinical relevance. To achieve
this, ACC1 overexpression and knockdown models were employed across
four glioma cell lines (U87, U251, T98G and LN229), and phenotypes
were assessed via functional assays. Based on the observed cell
line-specific responses, U251 cells were selected for mechanistic
studies focusing on regulation of the SDH-ROS axis, DNA
methyltransferase (DNMT)-mediated epigenetic modifications, and
P300-acetyl-CoA crosstalk, validated by inhibitors and small
interfering RNA (siRNA). Clinical correlation was analyzed using
tissue microarray immunohistochemistry and public datasets.
Materials and methods
Cell culture and reagents
The human glioma cell line, U87 MG ATCC (GCPC096821,
glioblastoma of unknown origin), was purchased from Shanghai
Genechem Co., Ltd; U251 (SCSP-559) and T98G (SCSP-5274) cells were
purchased from the China Infrastructure of Cell Line Resources,
Institute of Basic Medical Sciences, Chinese Academy of Medical
Sciences; and LN229 (CBP60302) cells were purchased from Nanjing
Cobioer Biotechnology Co., Ltd. All the cell lines used in the
present study were verified by short tandem repeat analysis,
confirming their identity and purity. U87, U251 and T98G cells were
cultured in MEM (cat. no. SH30024.01; HyClone™; Cytiva)
supplemented with 10% fetal bovine serum (FBS; Shanghai XP BioMed
Ltd.) and 1% penicillin-streptomycin (cat. no. 15140122; Gibco;
Thermo Fisher Scientific, Inc.). LN229 cells were cultured in DMEM
(cat. no. 10-013-CV; Corning, Inc.) with the same supplements. All
cells were maintained at 37°C in a humidified 5% CO2
incubator and passaged at 80-90% confluence. N-acetyl-cysteine
(NAC) was purchased from Beyotime Institute of Biotechnology (cat.
no. S0077). Azacitidine (Aza) (cat. no. S1782) and C646 (cat. no.
S7152) were purchased from Selleck Chemicals. Drug treatments were
performed as follows: NAC (5 mM), Aza (4 μM) and C646 (5
μM) were applied to cells for 48 h at 37°C under standard
culture conditions.
Transfection
The human ACACA plasmid and vector plasmid were
purchased from GeneCopoeia, Inc. Pre-packaged lentiviral particles
for human ACACA knockdown [short hairpin (sh)ACC1] and its scramble
negative control (NC), as well as siRNA targeting P300 and its
siNC, were purchased from Shanghai GenePharma Co., Ltd. siRNA and
shRNA sequences are listed in Table
SI.
Plasmid and siRNA transfections were performed using
Lipofectamine® 2000 (cat. no. 11668019; Invitrogen;
Thermo Fisher Scientific, Inc.) according to the manufacturer's
protocol. Briefly, for U87 cells, 1 μg ACACA or vector
plasmid DNA was complexed with the transfection reagent, whereas
U251 cells were transfected with 20 μM siP300 or siNC. The
complexes were applied to respective cells cultured in 6-well
plates. Transfection mixtures were incubated with cells at 37°C for
6 h, after which the medium was replaced with fresh complete
medium. Functional assays were conducted 48 h post-transfection to
assess phenotypic effects.
For lentiviral transduction, commercially provided
lentiviral particles (third generation system, titer:
1×10⁸ TU/ml) were thawed on ice. U251, T98G and LN229
cells were incubated with lentiviruses at a multiplicity of
infection of 4 in the presence of 5 μg/ml polybrene for 24 h
at 37°C. The viral suspension was then replaced with fresh complete
medium. To establish stable cell lines, transduced cells underwent
selection with 2 μg/ml puromycin starting 72 h
post-transduction for 3 days. Surviving cells were maintained in
medium containing 1 μg/ml puromycin. All subsequent
experiments were performed post-selection.
Western blotting
U87, U251, T98G and LN229 cells were lysed in RIPA
buffer (cat. no. AR0105; Wuhan Boster Biological Technology, Ltd.)
containing 1% protease inhibitor cocktail (cat. no. AR1182; Wuhan
Boster Biological Technology, Ltd.), 1% PMSF (cat. no. P0100,
Beijing Solarbio Science & Technology Co., Ltd.) and 5%
phosphatase inhibitor cocktail (cat. no. 4906845001; Roche
Diagnostics). Protein concentration was quantified using a BCA
assay (cat. no PC0020; Beijing Solarbio Science & Technology
Co., Ltd.). A total of 30 μg protein per sample was
separated by SDS-PAGE on 10% gels and transferred to PVDF membranes
(cat. no. IPVH00010; MilliporeSigma; Merck KGaA). Membranes were
blocked with 5% nonfat dry milk (cat. no. D8340; Beijing Solarbio
Science & Technology Co., Ltd.) at room temperature for 1 h and
incubated overnight at 4°C with primary antibodies against the
following targets: ACC1 (1:1,000; cat. no. 4190), cyclin D1
(1:1,000; cat. no. 2922), p21 (1:1,000; cat. no. 2947), DNMT1
(1:1,000; cat. no. 5032), histone H3 acetylation at lysine 9
(H3K9ac; 1:1,000; cat. no. 9649) and H3 (1:1,000; cat. no. 4499)
purchased from Cell Signaling Technology, Inc.; cyclin B1 (1:1,000;
cat. no. 55004-1-AP), SDHA (1:2,000; cat. no. 14865-1-AP), SDHB
(1:1,000; cat. no. 10620-1-AP), fatty acid synthase (FASN; 1:2,000;
cat. no. 10624-2-AP) and β-actin (1:2,000; cat. no. 20536-1-AP)
purchased from Proteintech Group, Inc.; and fibronectin (1:1,000;
cat. no. WL03677), vimentin (1:500; cat. no. WL01960), plasminogen
activator inhibitor-1 (PAI-1; 1:1,000; cat. no. WL01486), P300
(1:1,000; cat. no. WL01307), sterol regulatory element-binding
protein 1 (SREBP1; 1:1,000; cat. no. WL02093) and GAPDH (1:1,000;
cat. no. WL01114) from Wanleibio Co., Ltd. Membranes were then
incubated with HRP-conjugated anti-rabbit IgG secondary antibodies
(1:5,000; cat. no. bs-0295G-HRP; BIOSS) at room temperature for 1
h. Signals were detected using an ECL substrate (cat. no. PE0010;
Beijing Solarbio Science & Technology Co., Ltd.) and images
were captured using an Amersham Imager 600 system (Cytiva). Band
density semi-quantification was performed using ImageJ software
(version v1.8.0.345; National Institutes of Health).
Transwell migration and invasion
assays
For migration assays, U87, U251, T98G and LN229
cells (2×10⁴ cells) in 200 μl serum-free MEM
(U87, U251 and T98G cells) or DMEM (LN229 cells) were seeded into
the upper chambers of Transwell inserts. The lower chambers
contained 600 μl corresponding medium with 10% FBS. For
invasion assays, inserts were pre-coated with 100 μl
Matrigel (cat. no. 354262; Corning, Inc.) diluted 1:3 in
corresponding serum-free medium. To ensure consistency in Matrigel
coating, standardized protocols recommended by the manufacturer
were followed, including pre-cooling plates to 4°C, dilution with
ice-cold medium and incubation at 37°C for 1 h (18). Additionally, when adding Matrigel,
the culture plate was placed in a tray equipped with a spirit level
to ensure a level surface for sample addition. After 24 h
incubation at 37°C in a 5% CO2 incubator,
non-migrated/non-invaded cells remaining on the upper surface of
the membrane were removed. Migrated/invaded cells that adhered to
the lower surface of the membrane were fixed with 4%
paraformaldehyde for 10 min and stained with crystal violet (cat.
no. C0121; Beyotime Institute of Biotechnology) for 5 min at room
temperature. Cells were counted using an inverted optical
microscope (Nikon Eclipse Ts2; Nikon Corporation) equipped with a
digital camera (DS-Fi1c; Nikon Corporation).
Wound-healing assay
U87, U251, T98G and LN229 cells were seeded in a
6-well plate until ~90% confluency was reached in complete medium
containing 10% FBS. Uniform linear scratches were created by gently
dragging a sterile 200 μl pipette tip across the cell
monolayer in a single, consistent motion. Detached cells and debris
were then removed by washing the monolayer three times with PBS.
The medium was then replaced with low-serum medium (2% FBS in MEM
for U87/U251/T98G or DMEM for LN229). Immediately after scratching,
the initial scratch width was visualized under a microscope (Nikon
Eclipse Ts2; Nikon Corporation) to ensure consistency. After 24 and
48 h of culture in low-serum conditions, images of the cells were
captured under a microscope (Nikon Eclipse Ts2; Nikon Corporation).
Cell migration was assessed by calculating the proportion of the
area occupied by migrated cells within the scratch region relative
to the initial scratch area.
RNA extraction and reverse
transcription-quantitative PCR (RT-qPCR)
Total RNA from U87, U251, T98G and LN229 cells was
extracted using TRIzol™ reagent (cat. no. 15596018; Invitrogen™;
Thermo Fisher Scientific, Inc.) and reverse transcribed into cDNA
using the All-In-One 5X RT MasterMix with AccuRT Genomic DNA
Removal Kit (cat. no. G492; Applied Biological Materials Inc.)
under the following conditions: 42°C for 2 min (gDNA removal),
followed by 25°C for 10 min, 42°C for 15 min and 85°C for 5 min
(cDNA synthesis). qPCR was performed using the BlasTaq™ 2X qPCR
MasterMix with SYBR-like dye (cat. no. G891; Applied Biological
Materials Inc.) on a QuantStudio™ Dx Real-Time PCR Instrument
(Applied Biosystems; Thermo Fisher Scientific, Inc.) with the
following thermocycling conditions: 95°C for 10 min; followed by 40
cycles at 95°C for 15 sec and 60°C for 1 min; and final
dissociation at 95°C for 15 sec and 60°C for 1 min. Relative mRNA
expression was calculated using the 2−ΔΔCq method
(19). Primer sequences are
listed in Table SII. Primers for
DNMT1/3A/3B, SDHA/B/C/D, P300 and GAPDH were purchased from
GenScript Biotech Corporation.
SDH enzyme activity assay
SDH activity was measured using the Complex II
Enzyme Activity Microplate Assay Kit (cat. no. ab109908; Abcam),
according to the manufacturer's instructions. A total of
8×10⁶ U251 cells were used per assay. Samples were
normalized to protein content determined using a BCA assay.
Absorbance was measured at 600 nm using a microplate reader
(Multiskan Spectrum; Thermo Fisher Scientific, Inc.).
Cellular ROS measurement
U251 cells were harvested and stained with 10
μM dihydroethidium (cat. no. KGA7502; Jiangsu KeyGen Biotech
Co., Ltd.) in serum-free medium for 30 min at 37°C in the dark,
with gentle mixing every 5 min. Cells were washed with PBS and
fluorescence of the oxidized DHE-nucleic acid adduct was measured
using the FL2 channel (585/42 nm bandpass filter) on a flow
cytometer (BD FACSCalibur™; BD Biosciences). Data were analyzed
using FlowJo software (version v10.8; BD Biosciences).
Acetyl-CoA measurement
Cellular acetyl-CoA levels were measured using the
Acetyl-Coenzyme A Assay Kit (cat. no. MAK039; Sigma-Aldrich; Merck
KGaA), according to the manufacturer's instructions. A total of
8×10⁶ U251 cells were used per assay. Cell lysates were
deproteinized with perchloric acid, neutralized with potassium
bicarbonate and centrifuged at 1,000 × g for 10 min at 4°C.
Acetyl-CoA levels in the supernatant were determined using
fluorescence (excitation 535 nm, emission 587 nm) using the
SpectraMax Gemini EM Microplate Reader (Molecular Devices,
LLC).
Methylation-specific PCR
Genomic DNA was extracted using the
EasyPure® Genomic DNA Kit (cat. no. EE101; TransGen
Biotech Co., Ltd.) and bisulfite-converted using the EpiArt DNA
Methylation Bisulfite Kit (cat. no. EM101; Vazyme Biotech Co.,
Ltd.). The SDHB promoter region was amplified using
methylation-specific primers and the BlasTaq™ 2X qPCR Master Mix
with SYBR-like dye (cat. no. G891; Applied Biological Materials
Inc.) under the following thermocycling conditions: 95°C for 5 min;
followed by 45 cycles at 95°C for 30 sec, 60°C for 30 sec and 72°C
for 45 sec; and final extension at 72°C for 10 min. Unconverted DNA
was used as a loading control. PCR products were separated on a 2%
agarose gel and visualized using a UVIpro gel imaging system with
UVIband software v2.9.0 (UVItec Ltd.). Primers for the
methylated/unmethylated SDHB promoter regions were purchased from
GenScript Biotech Corporation. Primer sequences are listed in
Table SII.
Immunohistochemical staining
A commercially pre-fixed glioma tissue microarray
(cat. no. HBraG149Su01; Shanghai Outdo Biotech Co., Ltd.),
containing 123 evaluable samples from an original cohort of 149
samples, was used. Samples were excluded due to incomplete tissue
integrity during microarray production or detachment during
staining. Sections were deparaffinized, rehydrated through xylene
twice (10 min each) and graded alcohols (100, 90, 80 and 60%; 5 min
each), then subjected to heat-induced antigen retrieval in citrate
buffer (pH 6.0) at 100°C for 10 min using a water bath. Retrieval
was followed by washing in PBS. Endogenous peroxidase activity was
blocked with 3% H2O2 for 10 min at room
temperature, and cell membranes were permeabilized with 0.2% Triton
X-100 in PBS for 10 min at room temperature. Sections were blocked
with 10% goat serum (cat. no. C0265; Beyotime Institute of
Biotechnology) at room temperature for 1 h, then incubated with
ACC1 antibodies (1:300; cat. no. 67373-1-Ig; Proteintech Group,
Inc.) at 4°C overnight. The ready-to-use HRP-conjugated universal
anti-rabbit/mouse IgG secondary antibody [cat. no. GK500705;
Genetech (Shanghai) Co., Ltd.] was applied and incubated at room
temperature for 1 h. Subsequently, antigen detection was performed
using the DAB chromogen substrate (components A and B of the
GK500705 kit mixed at a 1:1 ratio) for 1 min. Nuclei were
counterstained with hematoxylin (cat. no. C0107; Beyotime Institute
of Biotechnology) at room temperature for 2 min. Whole-slide
scanning of the tissue microarray was conducted using the
Pannoramic DESK scanner (3DHISTECH, Ltd.), with the results viewed
using CaseViewer 2.4 software (3DHISTECH, Ltd.), and
semi-quantitative analysis of ACC1 expression was performed using
Aipathwell v2 software (Wuhan Servicebio Technology Co., Ltd.).
Public database analysis
Transcriptomics data from The Cancer Genome Atlas
(TCGA; https://portal.gdc.cancer.gov/)
glioblastoma cohort (TCGA-GBM) were analyzed via the UALCAN portal
(http://ualcan.path.uab.edu). Proteomics
data were obtained from the Clinical Proteomic Tumor Analysis
Consortium (CPTAC) dataset PDC000204 (https://pdc.cancer.gov/pdc). Additionally,
transcriptomics and clinical data from three Chinese Glioma Genome
Atlas (CGGA) datasets (mRNA_array_301, mRNAseq_325, mRNAseq_693)
were accessed through the CGGA portal (http://www.cgga.org.cn).
Additional experimental methods
Additional experimental methods associated with the
supplementary figures of the present study are detailed in Data S1.
Statistical analysis
Statistical analyses were performed using GraphPad
Prism 8.0 (Dotmatics). Data from three independent experimental
repeats are presented as mean ± standard deviation. Unpaired
Student's t-test and one-way ANOVA followed by Tukey's post hoc
test were used for group comparisons. Spearman's correlation was
applied for correlation analyses. For recurrence risk assessment of
CGGA datasets, univariate Cox proportional hazards regression
analysis was performed to determine the association between ACC1
expression levels (dichotomized as high/low) and recurrence risk.
P<0.05 was considered to indicate a statistically significant
difference.
Results
ACC1 knockdown promotes proliferation,
migration and invasion of glioma cells and selectively inhibits SDH
in U251 cells
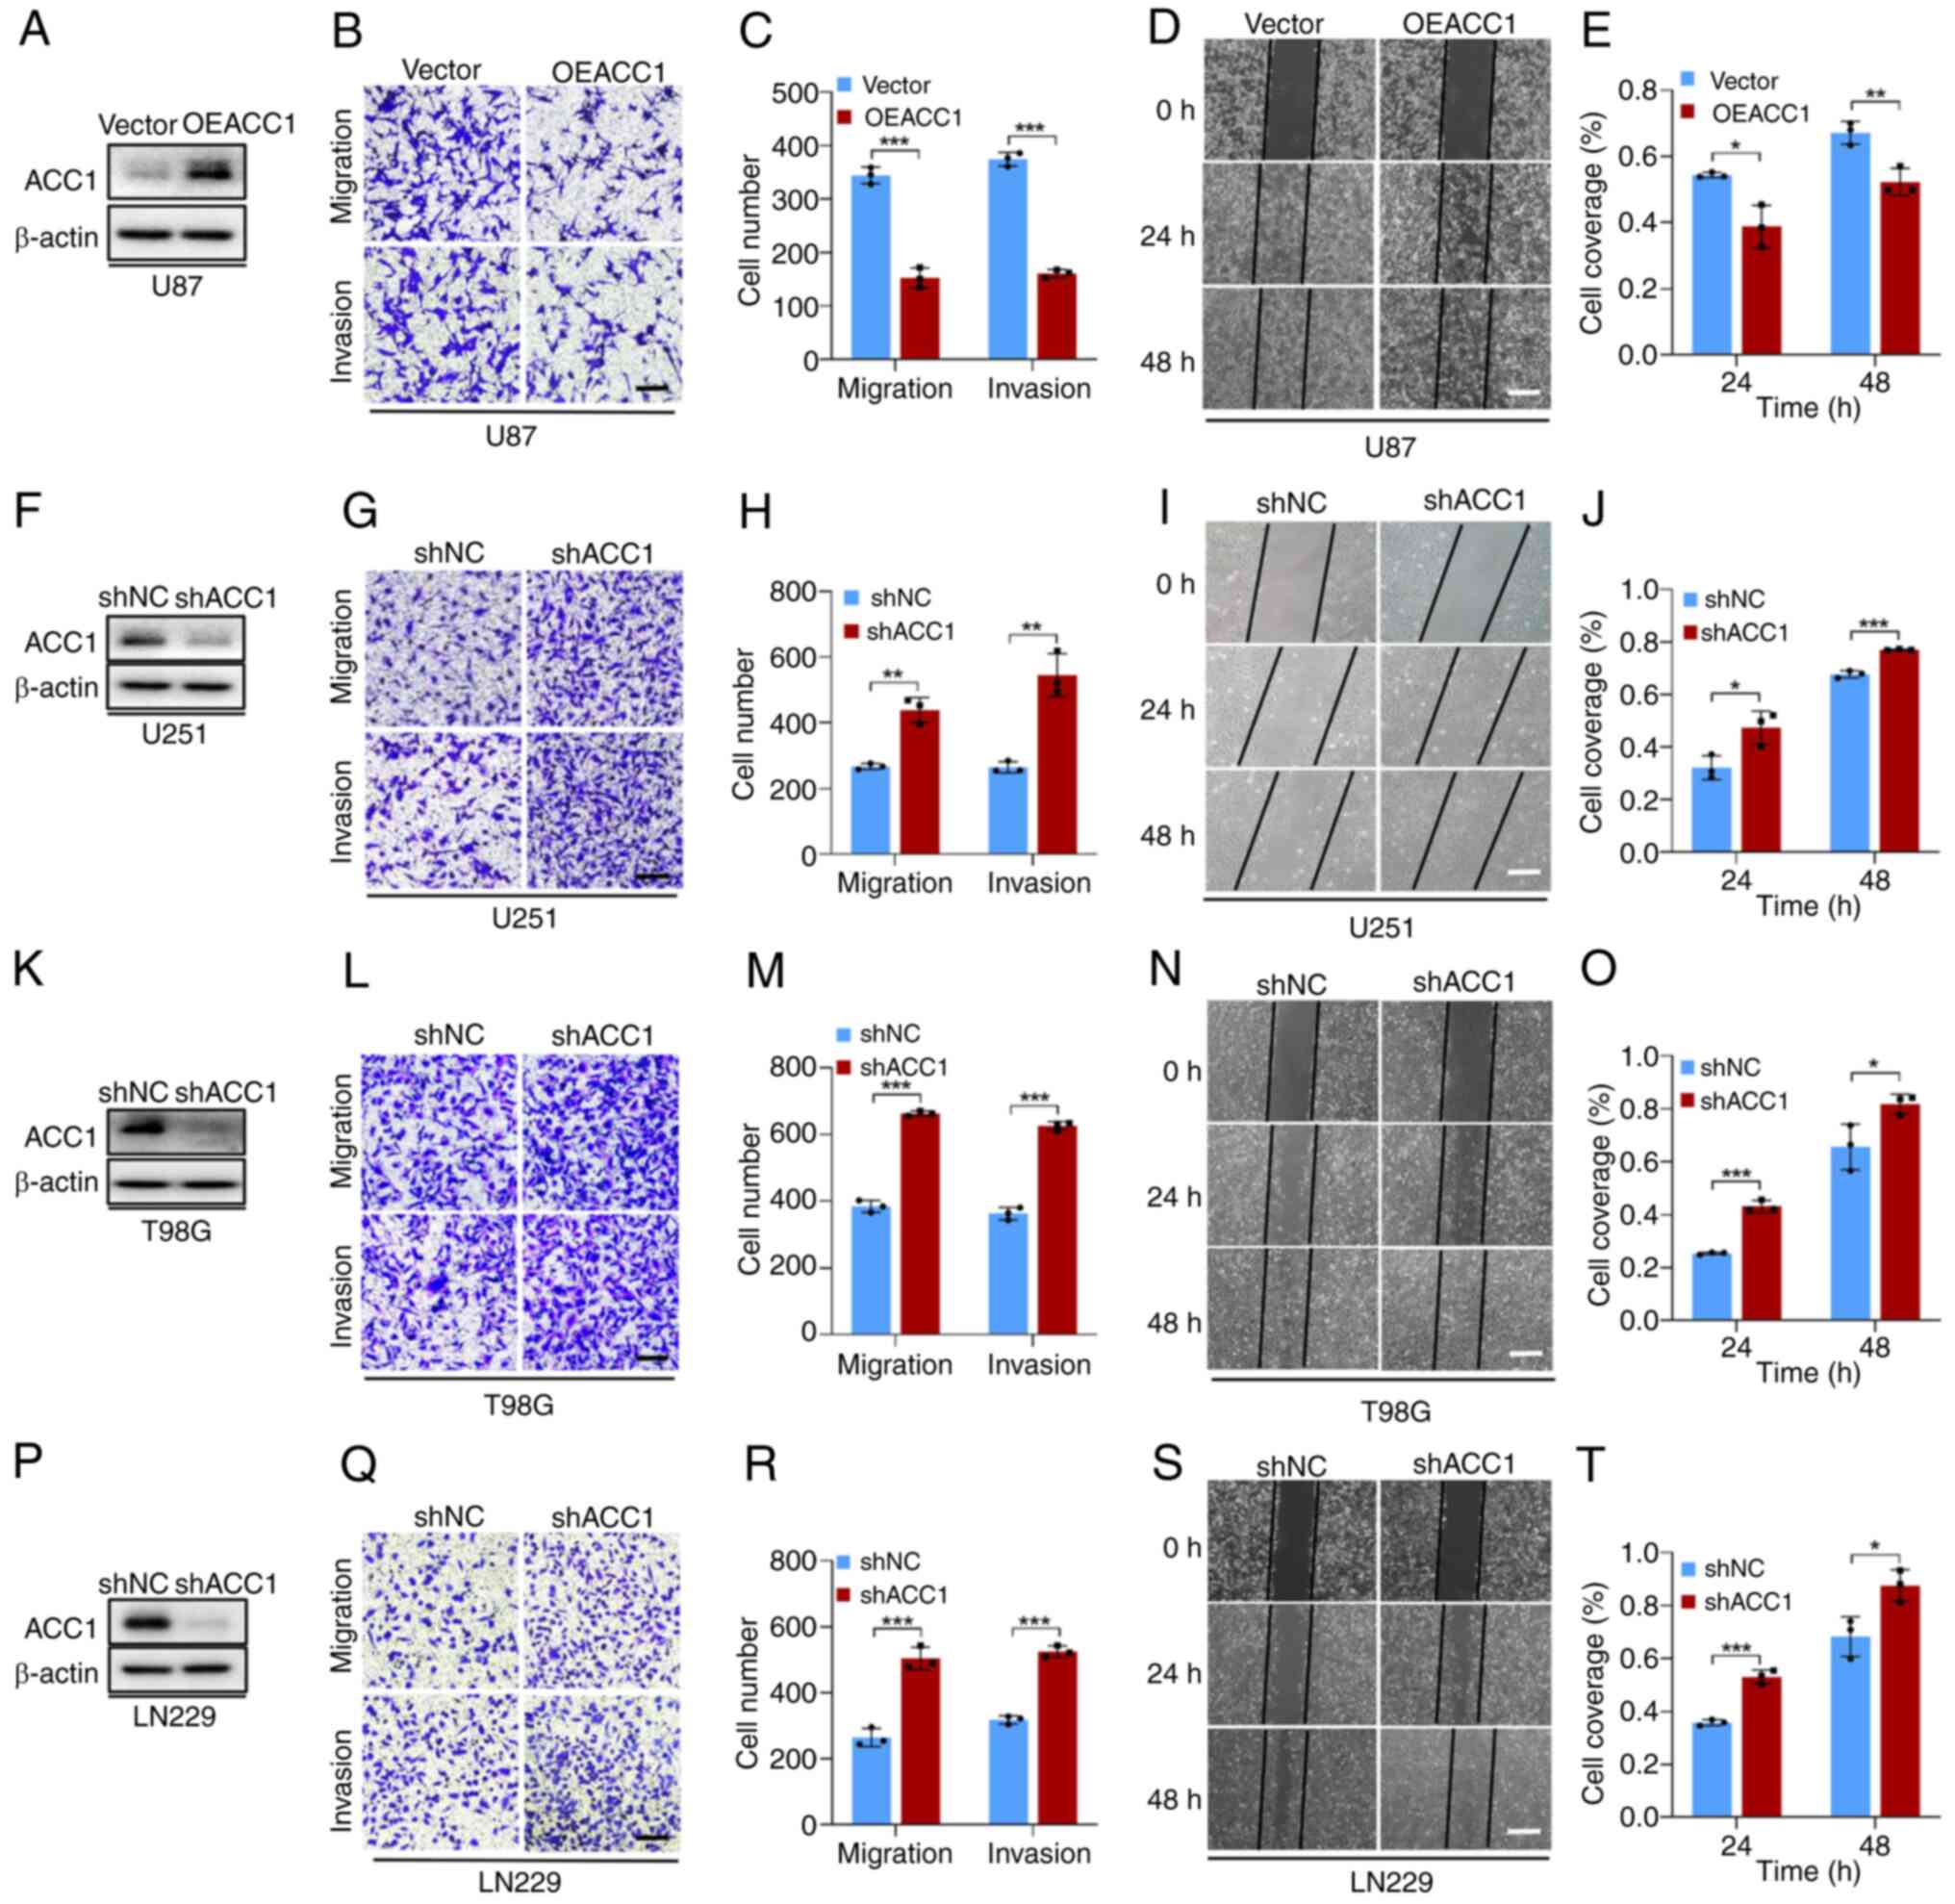
To assess the role of ACC1 in glioma, its protein
expression in four glioma cell lines was first evaluated (Fig. S1A). U87 cells, demonstrating the
lowest ACC1 expression compared with the other cell lines, were
selected for plasmid-mediated overexpression (Fig. 1A). U251, T98G and LN229 cells,
with comparably higher ACC1, underwent lentiviral knockdown
(Fig. 1F, K and P). ACC1
overexpression in U87 cells significantly decreased cell migration
and invasion compared with the control (Fig. 1B-E), whilst ACC1 knockdown
significantly increased these behaviors in U251 (Fig. 1G-J), T98G (Fig. 1L-O) and LN229 (Fig. 1Q-T) cells.
Proliferation analyses revealed a cell line-specific
pattern. MTT assays demonstrated that, compared with controls, ACC1
overexpression significantly inhibited U87 cell proliferation
(Fig. S1B) and ACC1 knockdown
significantly increased proliferation in T98G and LN229 cells
(Fig. S1D and E). By contrast,
ACC1 knockdown in U251 was associated with a significant reduction
in cell proliferation (Fig.
S1C), initially suggesting growth suppression. However, this
finding contradicted multiple independent lines of evidence.
Specifically, microscopic observation of cell density, manual cell
counts and RTCA (detailed methods in Data S1; Fig. S1F-H), together with colony
formation assays (Fig. S1I and
J), cell cycle progression assays (Fig. S1K-N) and 3D tumor-sphere
formation assays (Fig. S1O and
P) consistently demonstrated that ACC1 knockdown significantly
promoted U251 cells proliferation in comparison with controls.
Supporting this, RT-qPCR revealed that ACC1 modulation influenced
SDH subunit transcript levels specifically in U251 cells (Fig. S2B), with no significant changes
observed in the other glioma cell lines (Fig. S2A, C and D). Moreover, western
blot analysis demonstrated that the protein levels of SDHA and
SDHB, the most abundantly expressed subunits of the SDH complex
(20), were significantly reduced
in U251 cells following ACC1 knockdown compared with controls
(Fig. S2E-L), indicating a cell
line-specific regulatory effect.
Taken together, the aforementioned findings indicate
that the reduced proliferation rate observed in U251 cells upon
ACC1 knockdown was due to SDH suppression rather than impaired
proliferation. Given the consistent phenotype of enhanced
proliferation, migration and invasion, along with the unique
metabolic response to ACC1 silencing, U251 cells were selected for
further mechanistic studies. However, additional studies are
warranted to elucidate ACC1-related pathways in other glioma cell
lines.
ACC1 knockdown promotes migration and
invasion of U251 cells by increasing ROS levels
Due to the well-established association between SDH
inhibition and ROS generation (21), the present study aimed to assess
whether the downregulation of ACC1 facilitates glioma cell
migration and invasion by stimulating ROS production through SDH
inhibition. To address this, a series of experiments were
performed, and the experimental results demonstrated that, compared
with controls, ACC1 knockdown significantly decreased SDHA and SDHB
protein levels (Fig. 2A and B)
and SDH enzyme activity (Fig.
2C), leading to significantly elevated intracellular ROS levels
(Fig. 2D and E). Application of 5
mM NAC (Fig. S3A), a free
radical scavenger (22),
effectively prevented the ACC1 knockdown-induced upregulation of
intracellular ROS (Fig. 2F and
G). Moreover, Transwell (Fig. 2H
and I) and wound healing assays (Fig. 2J and K) demonstrated that NAC at
least partially reversed ACC1 knockdown-induced cell migration and
invasion. Western blot results also revealed that NAC application
prevented ACC1 knockdown-induced upregulation of migration-related
markers, fibronectin and vimentin, and the invasion-related marker
PAI-1 (Fig. 2L and M). Moreover,
rescue experiments were performed by reintroducing ACC1 into ACC1
knockdown cells (shACC1 + OEACC1). The findings revealed that,
compared with in the shACC1 + vector group, ACC1 overexpression
significantly attenuated the enhanced cell migration, invasion and
ROS elevation (Fig. S4). These
findings suggest that knockdown of ACC1 promotes the migration and
invasion of U251 cells by increasing intracellular ROS levels
induced by SDH inhibition.
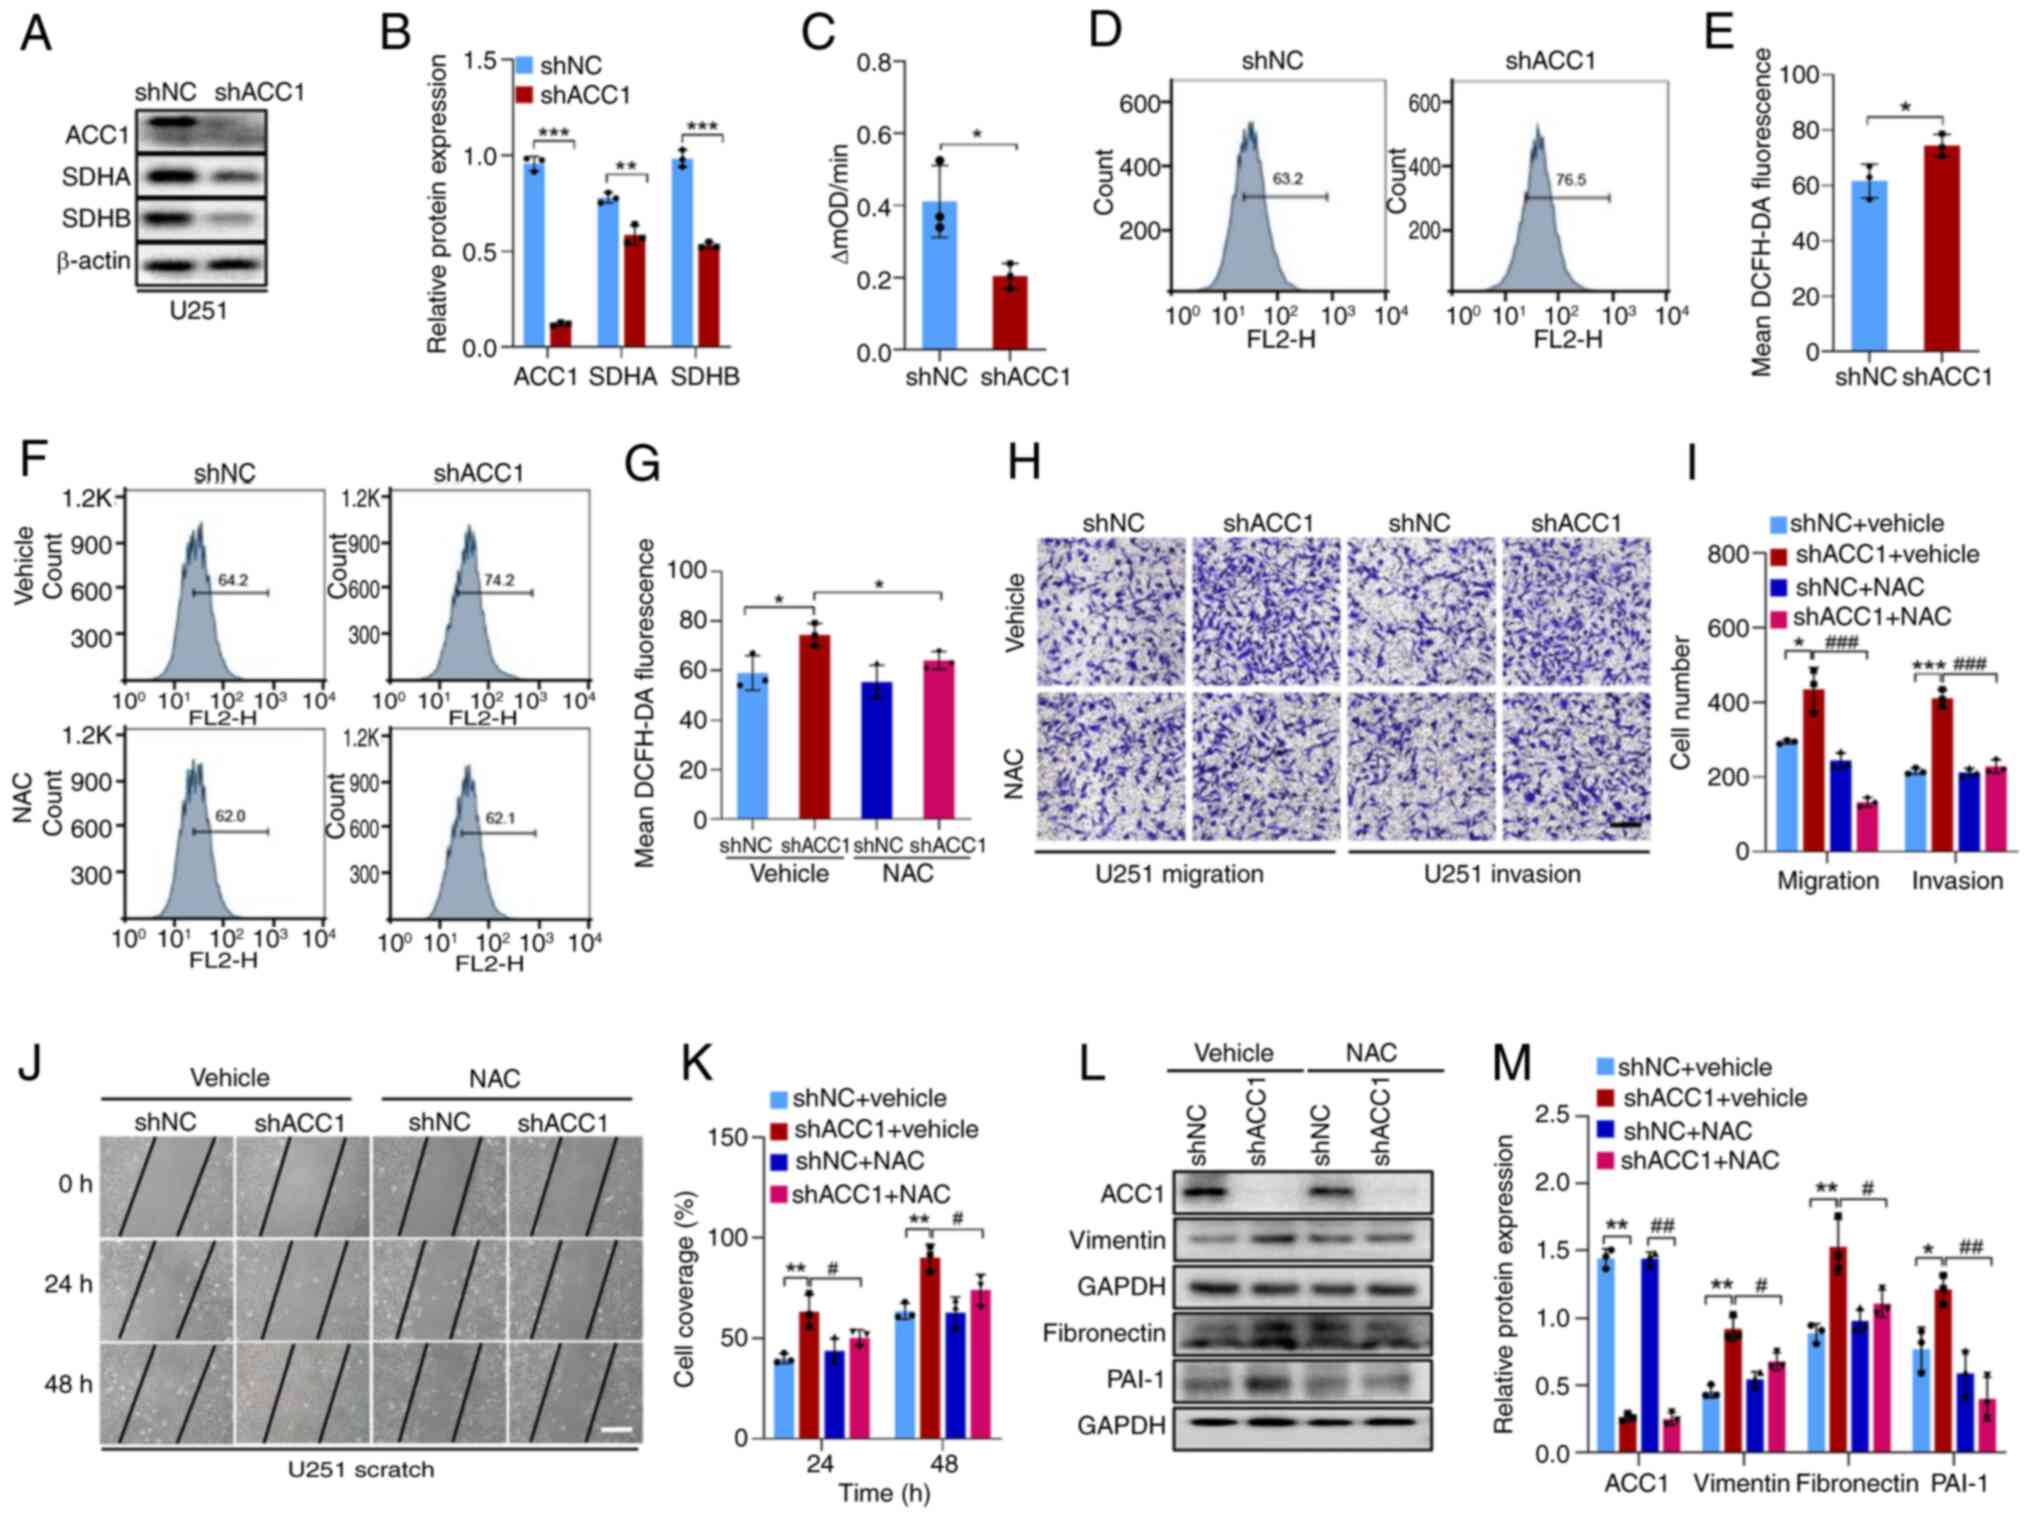 | Figure 2KD of ACC1 in U251 cells promotes
cell migration and invasion by down-regulating SDH and thus
elevating ROS level. (A) WB of ACC1, SDHA and SDHB after ACC1 KD.
(B) Semi-quantification of ACC1, SDHA and SDHB protein levels after
ACC1 KD. (C) Quantification of SDH activity following ACC1 KD. (D)
Flow cytometric analysis of ROS after ACC1 KD. (E) Quantification
of cellular ROS fluorescence signals after ACC1 KD. (F) Flow
cytometric analysis of ROS after NAC treatment. (G) Quantification
of cellular ROS fluorescence signals after NAC treatment. (H)
Images of Transwell migration and invasion assays after NAC
treatment. (I) Quantification of Transwell migration/invasion assay
findings after NAC treatment. (J) Wound-healing images of cells
after NAC treatment. (K) Quantification of wound-healing assay
after NAC treatment. (L) WB of ACC1, vimentin, fibronectin and
PAI-1 after NAC treatment. (M) Semi-quantification of ACC1,
fibronectin, vimentin and PAI-1 protein levels after NAC treatment.
Scale bars, 100 μm. Error bars represent the mean ± standard
deviation from three independent experiments.
*P<0.05; **P<0.01;
***P<0.001. #P<0.05;
##P<0.01; ###P<0.001. ACC1, acetyl-CoA
carboxylase 1; SDH, succinate dehydrogenase; ROS, reactive oxygen
species; NAC, N-acetyl-cysteine; PAI-1, plasminogen activator
inhibitor-1; sh, short hairpin; NC, negative control; OD, optical
density; WB, western blotting; KD, knockdown. |
Increased DNMT1 expression leads to SDH
hypermethylation and ROS upregulation
The primary mechanism underlying gene transcription
inhibition involves DNA methylation, which is mediated by DNMTs
(23). The DNMT family consists
of DNMT1/2/3A/3B/3L (24), with
DNMT2 primarily targeting transfer RNA methylation (25) and DNMT3L lacking catalytic
activity (26). DNMT1/3A/3B are
the main mediators of DNA methyltransferase activity in vivo
(27). Analysis of TCGA database
revealed upregulation of DNMT1/3A/3B mRNA levels in glioma tissues,
compared with in normal tissues (Fig. S5A-C). This trend is consistent
with the elevated protein expression of DNMT1 and DNMT3A observed
in the CPTAC database (28),
although DNMT3B data was unavailable (Fig. S5D and E). CPTAC data also
revealed that all four subunits of SDH (SDHA-D) are downregulated
in glioma tissue compared with in normal tissue (Fig. S5F-I), which is by contrast to the
upregulation of DNMTs. This opposing expression pattern suggests a
possible inverse association between DNMT and SDH levels in
gliomas.
RT-qPCR analysis revealed that, in U251 cells, DNMT1
was predominantly expressed, whereas DNMT2 and DNMT3 exhibited very
low expression levels. Moreover, ACC1 knockdown significantly
increased DNMT1 expression compared with that of controls (Fig. 3A-C). To further evaluate whether
ACC1 knockdown reduces SDH levels by promoting its methylation,
thereby increasing ROS levels to promote cell migration and
invasion, the DNMT inhibitor Aza was utilized to inhibit DNMT
activity and reduce methylation levels. In comparison with
controls, treatment with 4 μM Aza, a concentration that was
demonstrated to not affect cell viability (Fig. S3B), significantly reduced SDH
downregulation caused by ACC1 knockdown (Fig. 3D-F) and hypermethylation of the
SDHB promoter (Fig. 3G and H),
and significantly attenuated the ACC1 knockdown-induced increase in
ROS and cell migration/invasion (Fig.
3I-P). These results collectively indicate that ACC1 knockdown
upregulates DNMT1, leading to the downregulation of SDH, the
increase of ROS levels, and ultimately the promotion of U251 cell
migration and invasion.
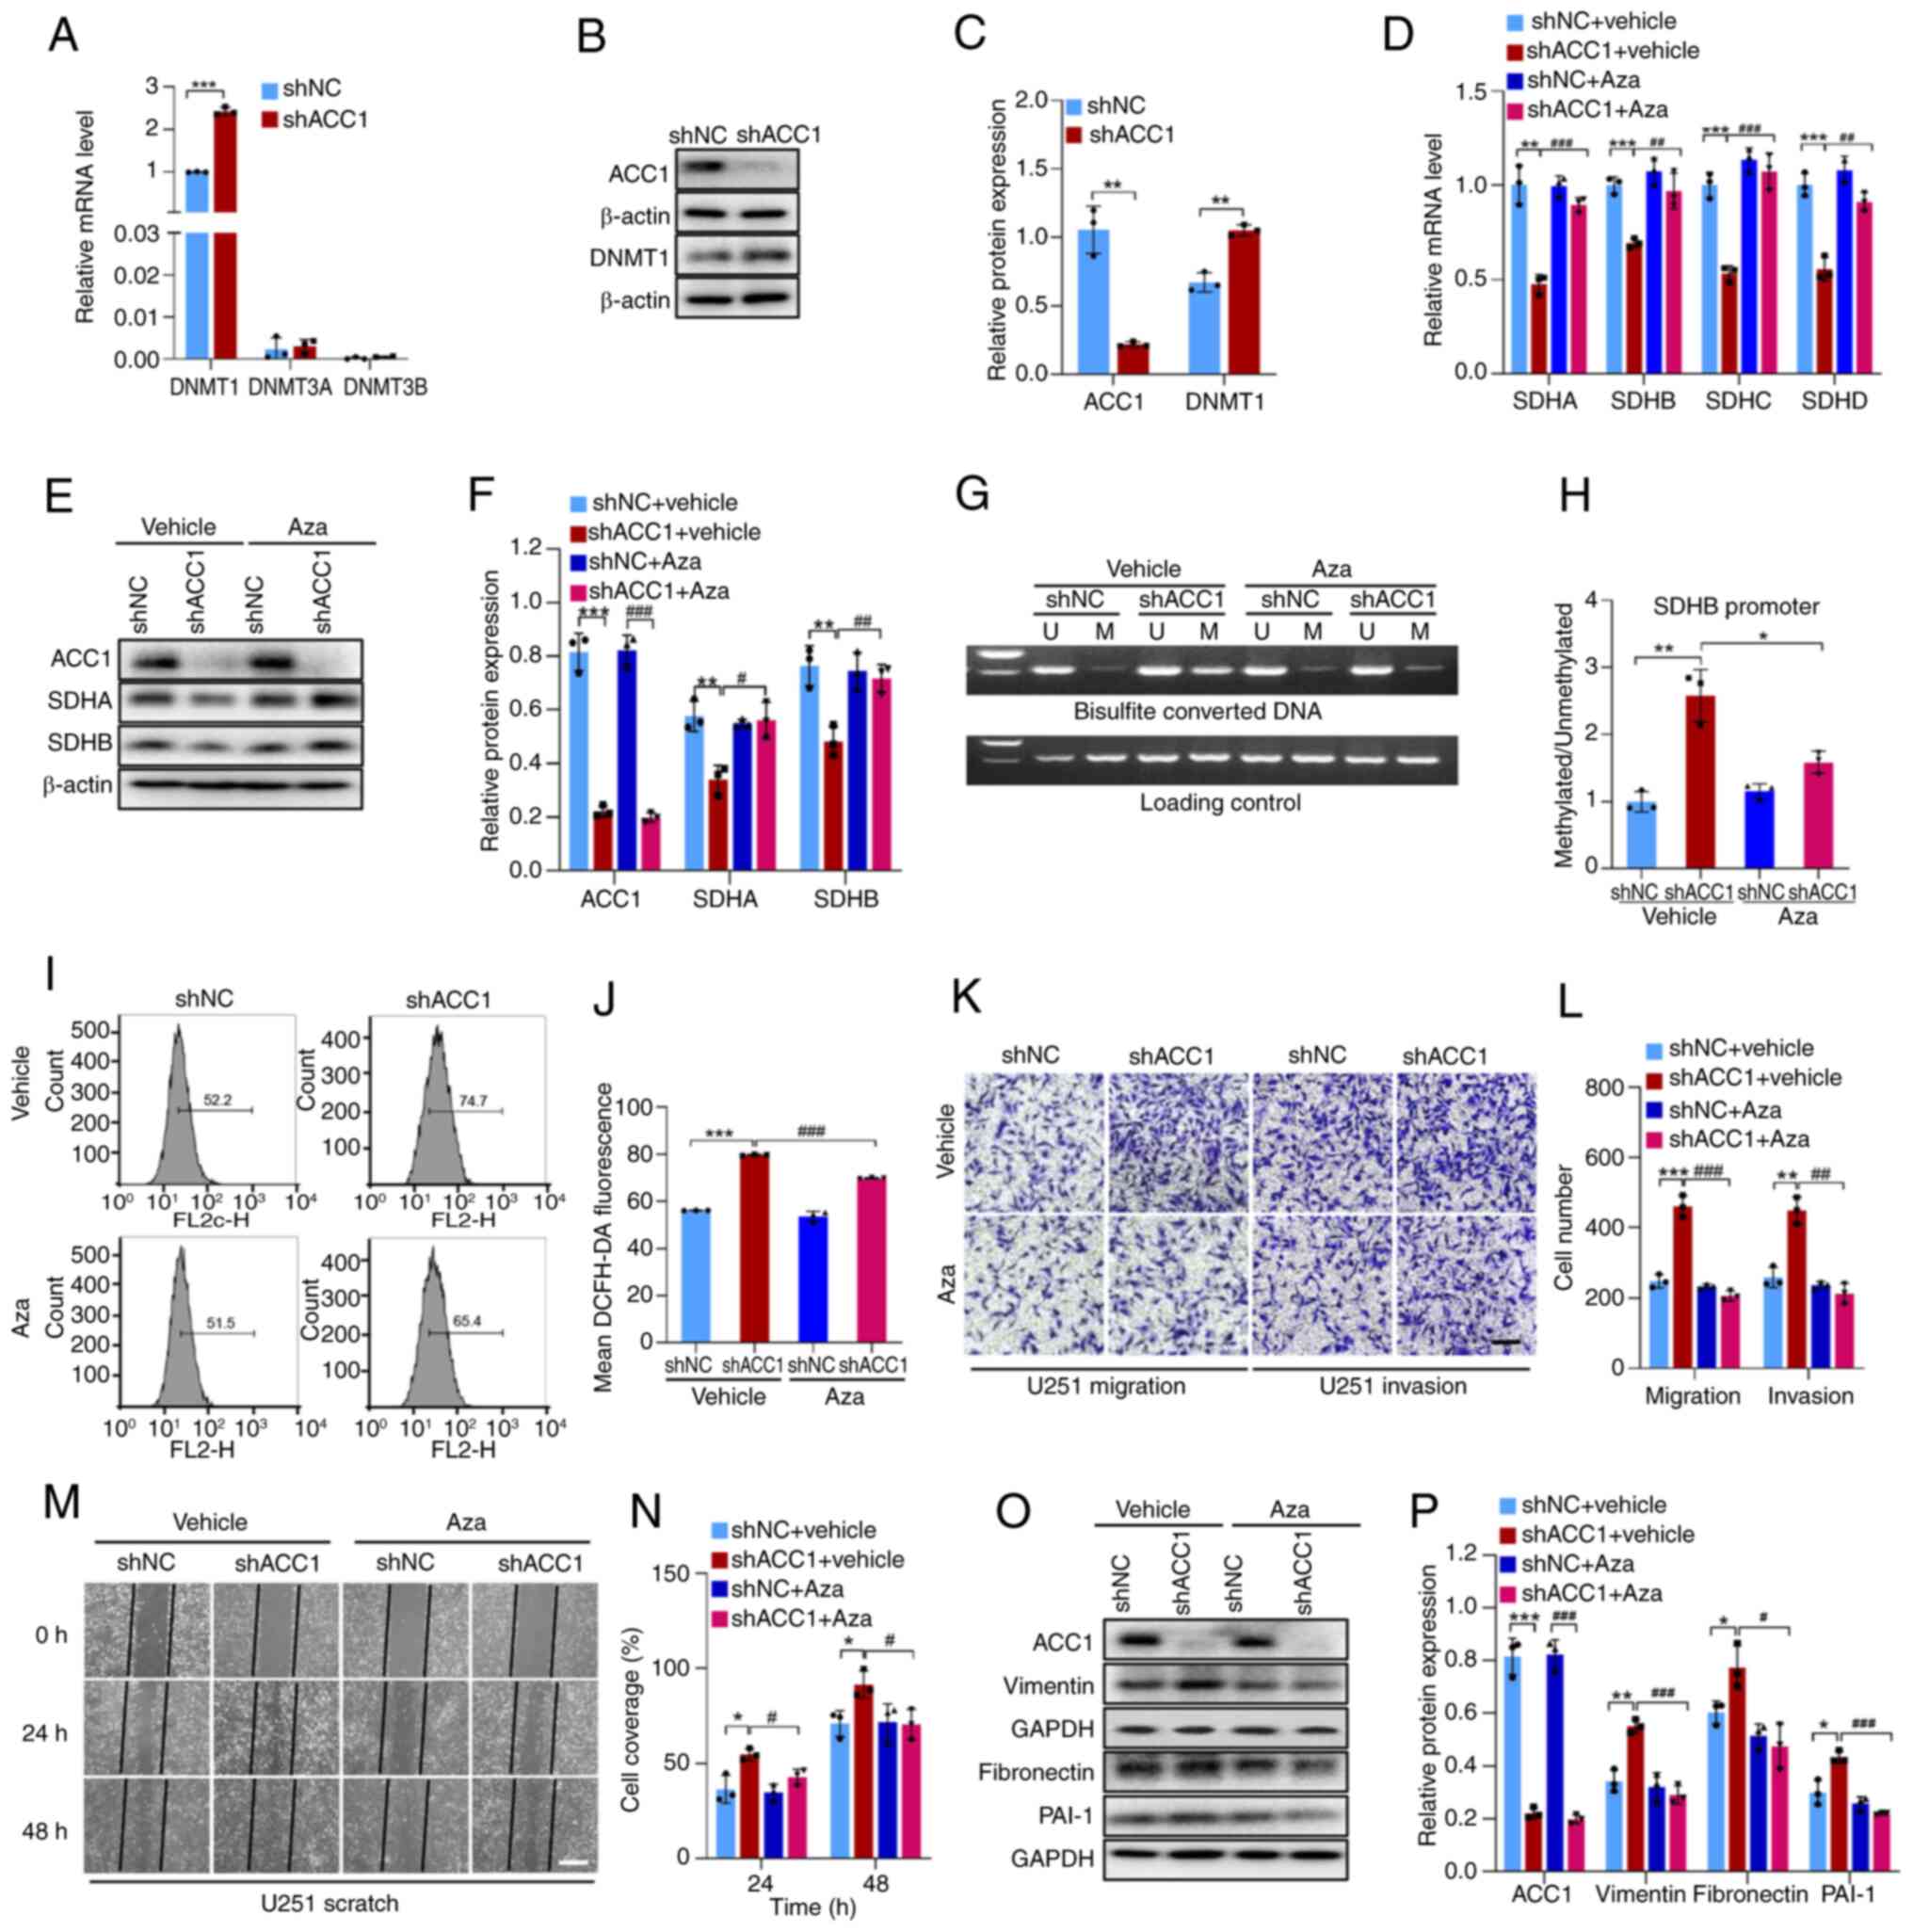 | Figure 3KD of ACC1 in U251 cells increases
DNMT1 expression, leading to hypermethylation of SDH and subsequent
upregulation of ROS levels. (A) RT-qPCR of DNMT1, DNMT3A and DNMT3B
mRNA levels after ACC1 KD. (B) WB of ACC1 and DNMT1 after ACC1 KD.
(C) Semi-quantification of ACC1 and DNMT1 protein levels after ACC1
KD. (D) RT-qPCR of SDHA, SDHB, SDHC and SDHD mRNA levels after
treatment with Aza. (E) WB of ACC1, SDHA and SDHB after Aza
treatment. (F) Semi-quantification of ACC1, SDHA and SDHB protein
levels after Aza treatment. (G) Methylation-specific PCR of SDHB
promoter methylation after Aza treatment. (H) Semi-quantification
of SDHB promoter methylation levels after Aza treatment. (I) Flow
cytometric analysis of ROS after Aza treatment. (J) Quantification
of cellular ROS fluorescence signals after Aza treatment. (K)
Images of Transwell migration and invasion assays after Aza
treatment. (L) Quantification of Transwell migration/invasion
assays after Aza treatment. (M) Wound-healing images after Aza
treatment. (N) Wound-healing assay quantification after Aza
treatment. (O) WB of ACC1, vimentin, fibronectin and PAI-1 after
Aza treatment. (P) Semi-quantification of ACC1, vimentin,
fibronectin and PAI-1 protein levels after Aza treatment. Scale
bars, 100 μm. Error bars represent the mean ± standard
deviation from three independent experiments.
*P<0.05; **P<0.01;
***P<0.001. #P<0.05;
##P<0.01; ###P<0.001. ACC1, acetyl-CoA
carboxylase 1; DNMT, DNA methyltransferase; SDH, succinate
dehydrogenase; ROS, reactive oxygen species; RT-qPCR, reverse
transcription-quantitative PCR; Aza, azacitidine; PAI-1,
plasminogen activator inhibitor-1; U, unmethylated; M, methylated;
WB, western blotting; KD, knockdown; sh, short hairpin; NC,
negative control. |
ACC1 knockdown increases histone
acetylation by elevating Acetyl-CoA, leading to DNMT1
upregulation
As ACC1 influences protein acetylation by modulating
acetyl-CoA levels (29), we
hypothesized that the upregulation of DNMT1 upon ACC1 knockdown may
be associated with this phenomenon. The results of the present
study revealed that, compared with controls, knockdown of ACC1
significantly increased acetyl-CoA levels (Fig. 4A) and promoted H3K9ac expression
(Fig. 4B and C). Notably, the
knockdown of ACC1 did not significantly reduce the intracellular
level of fatty acids compared with the control (Fig. S6A). SREBP1, encoded by the sterol
regulatory element-binding transcription factor 1 (SREBF1) gene, is
a key regulator of lipid metabolism that can activate the
transcription of fatty acid synthesis-related genes such as FASN,
thereby maintaining cellular fatty acid homeostasis (30). The results demonstrated that,
compared with controls, ACC1 knockdown significantly upregulated
both SREBF1 (Fig. S6B and C) and
FASN mRNA levels (Fig. S6D), as
well as SREBP1 and FASN protein levels (Fig. S6E and F). This suggests a
compensatory enhancement of fatty acid synthesis to counteract the
reduction caused by ACC1 depletion, ultimately preserving cellular
fatty acid balance. As this compensatory mechanism maintains fatty
acid levels, the phenotypic changes observed after ACC1 knockdown
may be driven by alterations in histone acetylation rather than
disruptions in fatty acid metabolism.
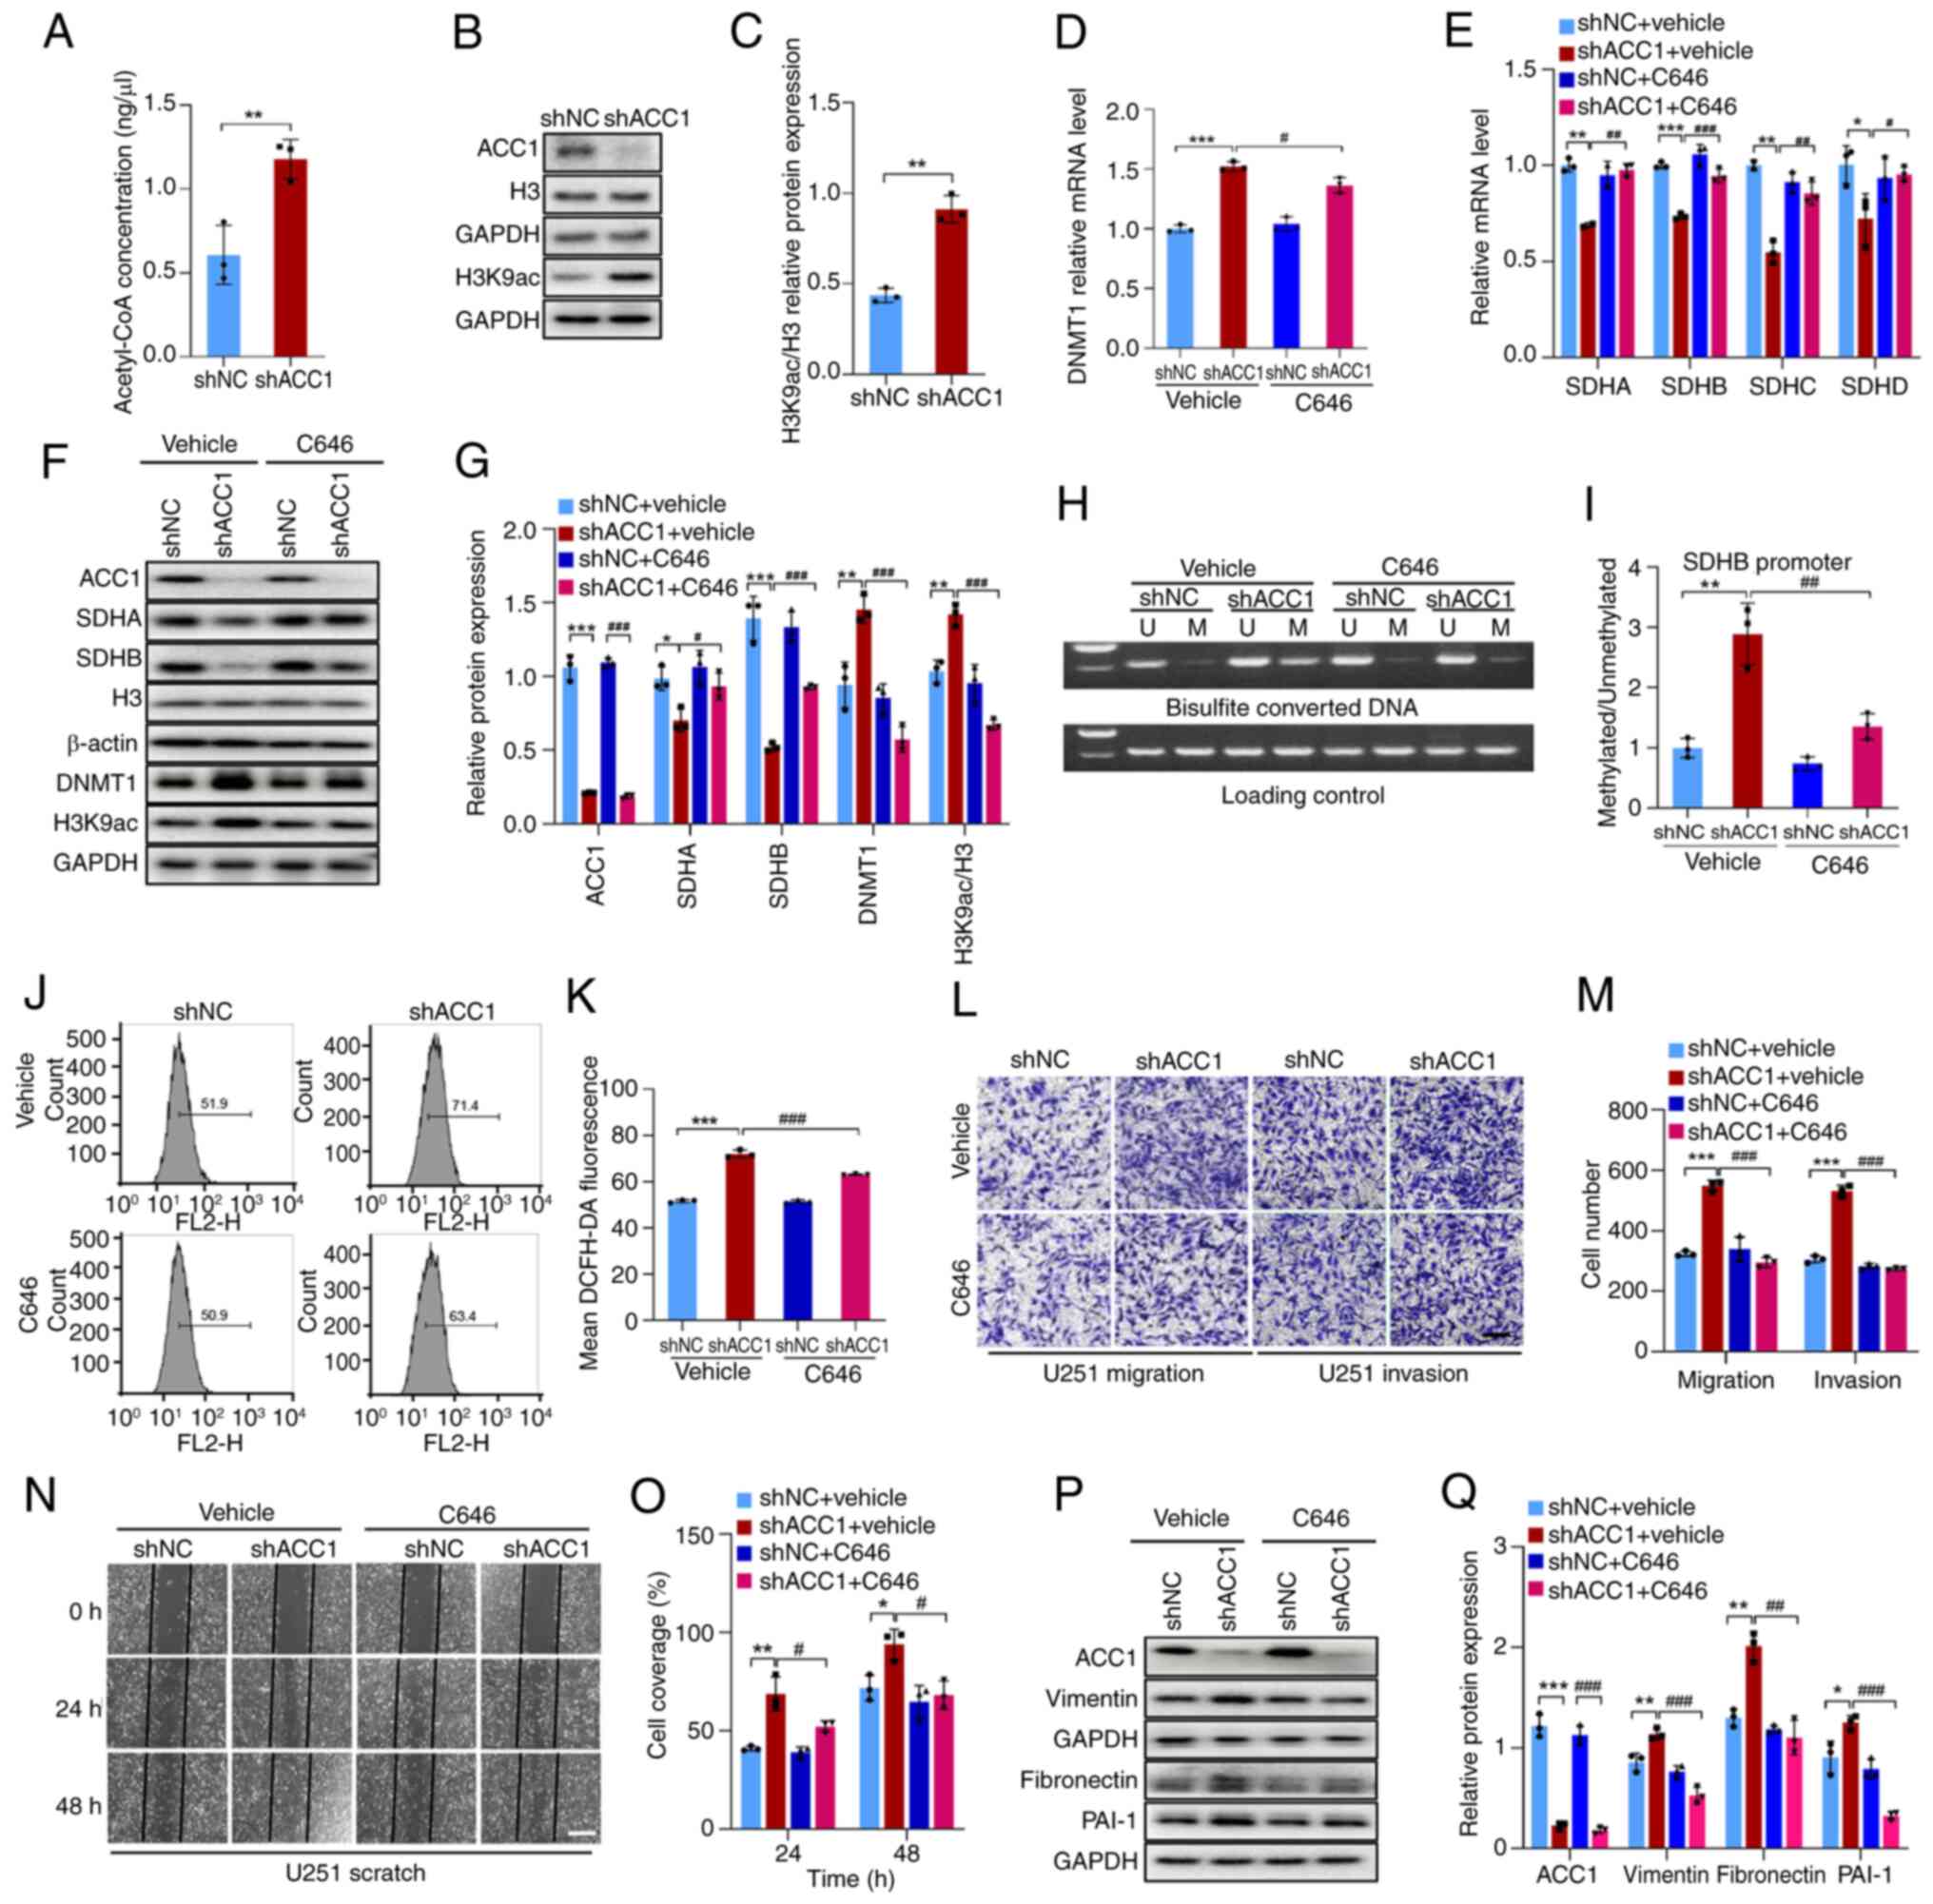 | Figure 4KD of ACC1 induces histone
acetylation via acetyl-CoA elevation, resulting in DNMT1
upregulation. (A) Fluorometric assay of acetyl-CoA levels after
ACC1 KD. (B) WB of ACC1, H3K9ac and H3 after ACC1 KD. (C)
Semi-quantification of H3K9ac/H3 protein levels after ACC1 KD. (D)
RT-qPCR of DNMT1 mRNA levels after treatment with C646. (E) RT-qPCR
of SDHA, SDHB, SDHC and SDHD mRNA levels after treatment with C646.
(F) WB of ACC1, SDHA, SDHB, H3, DNMT1 and H3K9ac after treatment
with C646. (G) Semi-quantification of ACC1, SDHA, SDHB, DNMT1 and
H3K9ac/H3 protein levels after treatment with C646. (H)
Methylation-specific PCR of SDHB promoter methylation after
treatment with C646. (I) Semi-quantification of SDHB promoter
methylation level after treatment with C646. (J) Flow cytometric
analysis of ROS after treatment with C646. (K) Quantification of
cellular ROS fluorescence signals after treatment with C646. (L)
Images of Transwell migration/invasion assays after treatment with
C646. (M) Quantification of Transwell migration/invasion assays
after treatment with C646. (N) Wound-healing images after treatment
with C646. (O) Wound-healing assay quantification after treatment
with C646. (P) WB of ACC1, vimentin, fibronectin and PAI-1 after
treatment with C646. (Q) Semi-quantification of ACC1, vimentin,
fibronectin and PAI-1 protein levels after treatment with C646.
Scale bars, 100 μm. Error bars represent the mean ± standard
from three independent experiments. *P<0.05;
**P<0.01; ***P<0.001.
#P<0.05; ##P<0.01;
###P<0.001. ACC1, acetyl-CoA carboxylase 1; DNMT, DNA
methyltransferase; H3K9ac, histone H3 acetylation at lysine 9; SDH,
succinate dehydrogenase; PAI-1, plasminogen activator inhibitor-1;
U, unmethylated; M, methylated; WB, western blotting; KD,
knockdown; sh, short hairpin; NC, negative control. |
To further evaluate whether increased histone
acetylation leads to the upregulation of DNMT1, C646 was utilized
to inhibit histone acetylation. A total of 5 μM C646
(Fig. S3C) effectively reduced
histone acetylation levels (Fig. 4F
and G), prevented the upregulation of DNMT1 induced by ACC1
knockdown (Fig. 4D, F and G) and
subsequently reversed the effects of ACC1 knockdown on SDH, ROS
levels and migration/invasion (Fig.
4E-Q). These findings suggest that knockdown of ACC1 promotes
histone acetylation by increasing acetyl-CoA levels, which
subsequently upregulates the expression of DNMT1. Consequently,
hypermethylation of SDH promoter inhibits SDH expression, leading
to increased ROS production and ultimately facilitating cell
migration and invasion.
ACC1 elevates DNMT1 expression through
P300 interaction
To assess the involvement of P300 in the
upregulation of DNMT1 induced by ACC1 knockdown, siRNA was utilized
to interfere with P300 expression (Fig. 5A, B, M and N). Compared with in
cells with ACC1 knockdown alone (shACC1 + siNC), the silencing of
P300 in ACC1 knockdown cells (shACC1 + siP300) significantly
reduced the ACC1 knockdown-induced increase in DNMT1 expression
(Fig. 5C, M and N). Additionally,
compared with shACC1 + siNC, interference with P300 (shACC1 +
siP300) restored SDH expression (Fig.
5D, M and N) and reduced SDHB promoter methylation (Fig. 5E and F). Compared with shACC1 +
siNC, P300 knockdown (shACC1 + siP300) also attenuated the
increased ROS and enhanced migration/invasion observed upon ACC1
knockdown (Fig. 5G-N). Overall,
the results indicate that ACC1 knockdown enhances the availability
of substrates for P300 by elevating acetyl-CoA levels, resulting in
increased DNMT1 expression, SDH hypermethylation and elevated ROS
levels, which ultimately promotes cell migration and invasion.
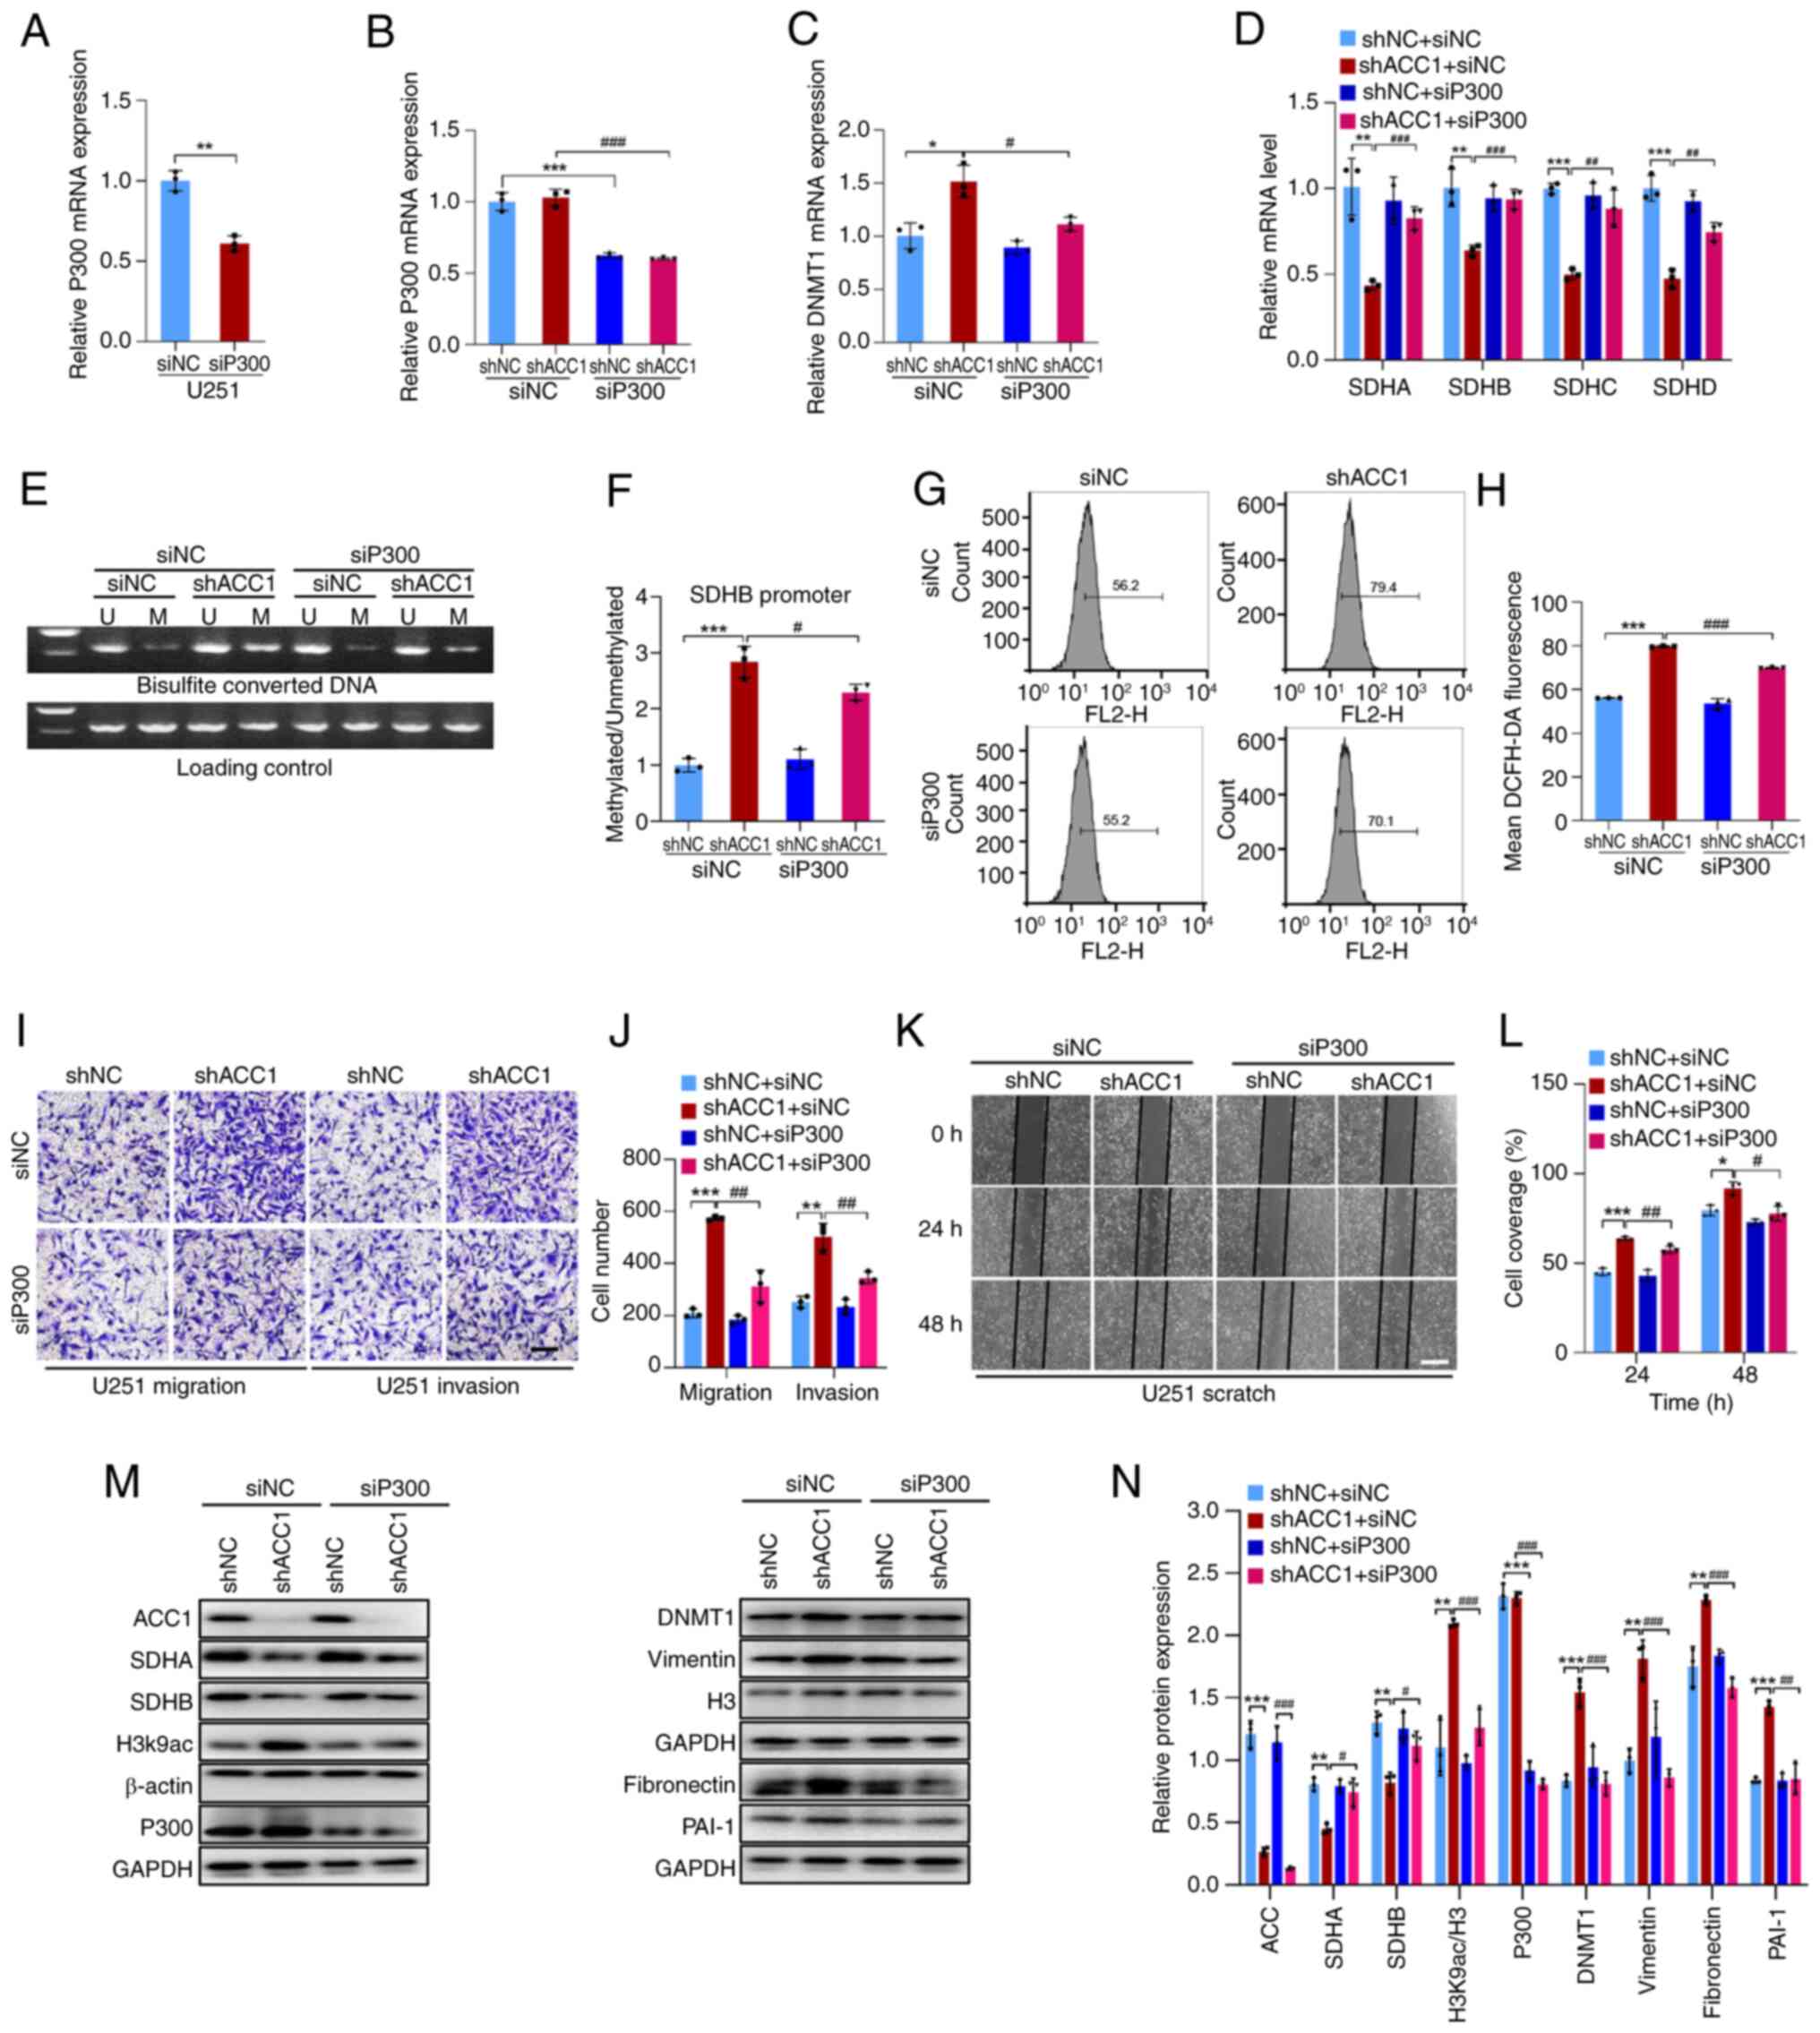 | Figure 5KD of ACC1 in U251 cells elevates
DNMT1 expression via P300. (A) RT-qPCR of P300 mRNA after siP300
transfection in wild-type U251 cells. (B) RT-qPCR of P300 mRNA
after siP300 transfection in ACC1 KD cells. (C) RT-qPCR of DNMT1
mRNA after siP300 transfection. (D) RT-qPCR of SDHA, SDHB, SDHC and
SDHD mRNA after siP300 transfection. (E) Methylation-specific PCR
of SDHB promoter methylation after siP300 transfection. (F)
Semi-quantification of SDHB promoter methylation levels after
siP300 transfection. (G) Flow cytometric analysis of ROS after
siP300 transfection. (H) Quantification of cellular ROS
fluorescence signals after siP300 transfection. (I) Images of
Transwell migration/invasion assays after siP300 transfection. (J)
Quantification of Transwell migration/invasion assays after siP300
transfection. (K) Wound-healing images after siP300 transfection.
(L) Wound-healing assay quantification after siP300 transfection.
(M) WB of ACC1, SDHA, SDHB, H3K9ac, P300, DNMT1, vimentin, H3,
fibronectin and PAI-1 after siP300 transfection. (N)
Semi-quantification of ACC1, SDHA, SDHB, H3K9ac/H3, P300, DNMT1,
vimentin, fibronectin and PAI-1 protein levels after siP300
transfection. Scale bars, 100 μm. Error bars represent the
mean ± standard deviation from three independent experiments.
*P<0.05; **P<0.01;
***P<0.001. #P<0.05;
##P<0.01; ###P<0.001. ACC1, acetyl-CoA
carboxylase 1; DNMT, DNA methyltransferase; SDH, succinate
dehydrogenase; si, small interfering; U, unmethylated; M,
methylated; ROS, reactive oxygen species; H3K9ac, histone H3
acetylation at lysine 9; PAI-1, plasminogen activator inhibitor-1;
WB, western blotting; KD, knockdown; RT-qPCR, reverse
transcription-quantitative PCR; sh, short hairpin; NC, negative
control. |
Low ACC1 expression is associated with
poor prognosis in patients with glioma
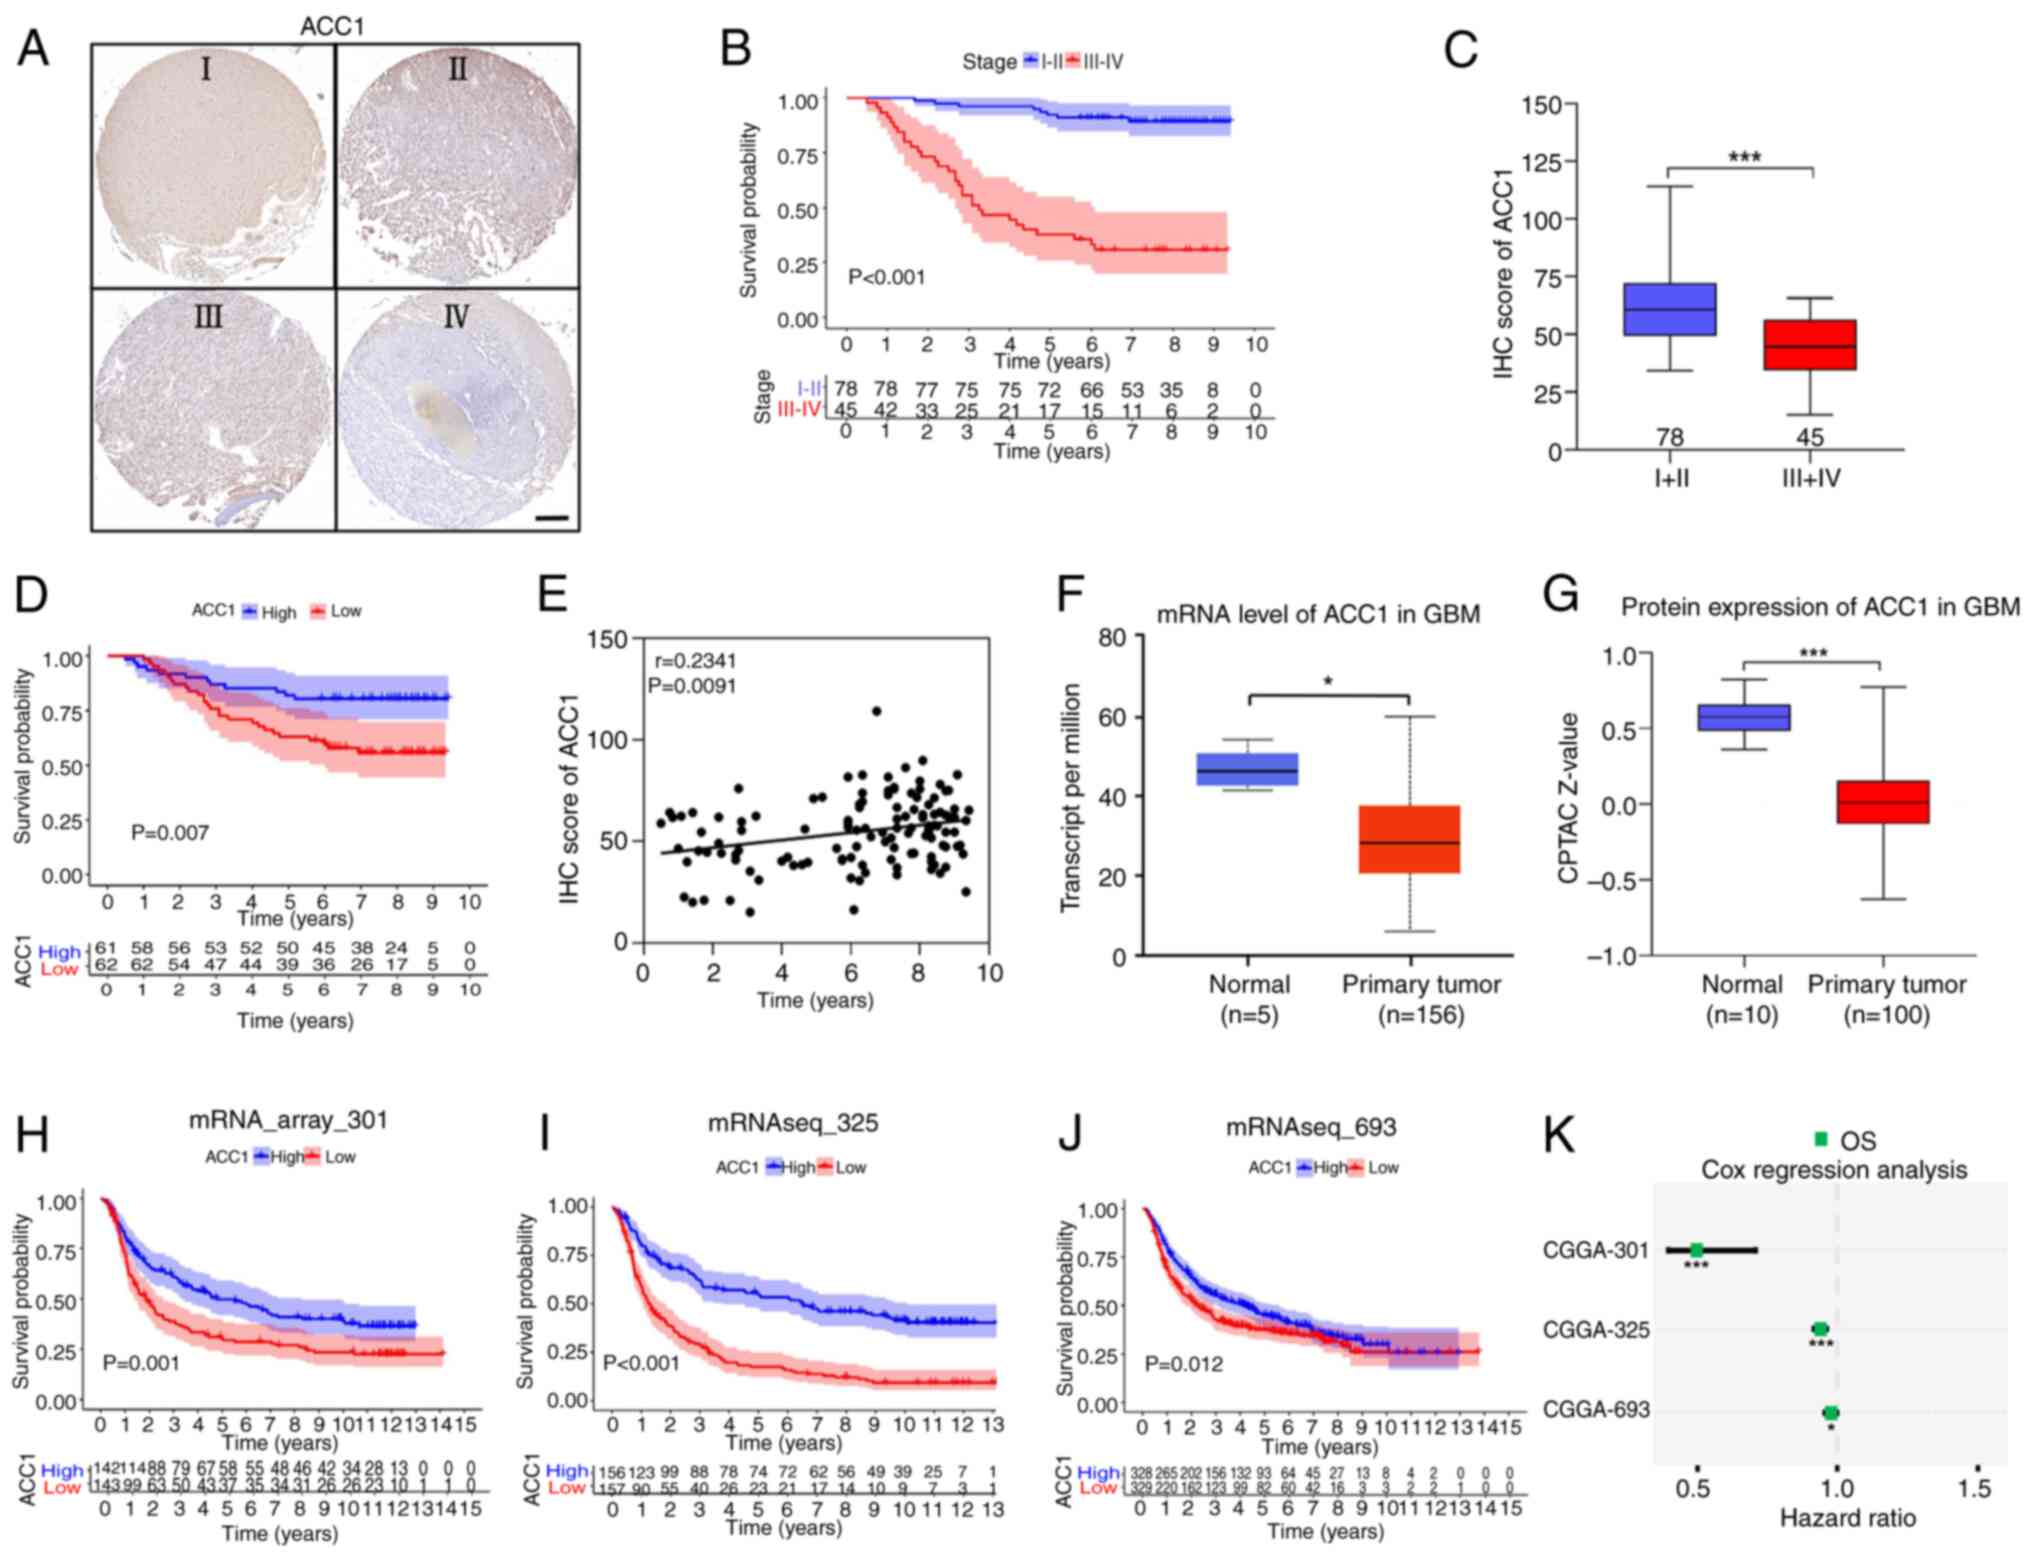
To further assess the association between ACC1
levels and the prognosis of patients with glioma,
immunohistochemical staining of ACC1 was performed using a glioma
tissue microarray (Fig. 6A).
Analysis of clinical data indicated a significant reduction in
overall survival (OS) among patients with grades III-IV glioma,
compared with those with grades I-II (Fig. 6B). Furthermore, evaluation based
on immunohistochemistry scores revealed significantly lower ACC1
levels in tumor tissues from patients with grades III-IV glioma
compared with those with grades I-II (Fig. 6C). Notably, patients exhibiting
low ACC1 expression experienced significantly worse OS outcomes
compared with those with high ACC1 expression (Fig. 6D), with a positive correlation
observed between survival time and ACC1 expression levels (Spearman
r=0.2341; P=0.0091; Fig. 6E).
Moreover, data from TCGA (Fig.
6F) and CPTAC databases (Fig.
6G) corroborated the downregulation of ACC1 in glioma tissues
compared with in normal tissues (28). Finally, analysis of three datasets
from the CGGA (31) database
(mRNA_array_301, mRNAseq_325 and mRNAseq_693) revealed that
patients with glioma with low ACC1 expression exhibited worse OS
(Fig. 6H-J) and were at a higher
risk of recurrence, compared with those with high ACC1 expression
(Fig. 6K). In summary, the
aforementioned findings highlight the association between low ACC1
expression and adverse outcomes in patients with glioma.
Discussion
The results of the present study demonstrate the
multifaceted role of ACC1 in glioma progression, impacting
proliferation, migration, invasion and prognosis. The study first
assessed ACC1 expression across four glioma cell lines, revealing a
differential pattern: U87 cells demonstrated lower ACC1 levels,
whilst U251, LN229 and T98G cells exhibited higher expression. This
pattern closely mirrored the ACC1 mRNA levels observed in U87,
U251, T98G and LN229 cells, according to the Cancer Cell Line
Encyclopedia database (32).
However, abnormal SDH activity was observed exclusively in U251
cells. To further explore the mechanism underlying this
specificity, the research focused on the molecular characteristics
of U251 cells.
Understanding glioma cell origin, classification and
heterogeneity of glioma cells is essential for both research and
therapy. Although U87, U251, T98G and LN229 are all World Health
Organization grade IV glioma cell lines derived from astrocytic
transformation, they originate from patients with diverse ethnic
backgrounds, ages, sexes and tumor locations, resulting in distinct
genetic backgrounds and molecular characteristics (33,34). According to TCGA classification,
U251 and LN229 belong to the classical subtype, whilst U87 and T98G
represent the mesenchymal subtype, with notable differences in gene
expression profiles and signaling pathway activity (35). Morphologically, U251 and T98G
exhibit fibroblast-like characteristics, whereas U87 and LN229
display more epithelial-like features, further illustrating the
phenotypic diversity among glioma cells (33). In this context, the finding that
ACC1 knockdown reduced SDH expression specifically in U251 cells
highlights this intrinsic heterogeneity and underscores the
importance of molecular subtyping and precise diagnostic strategies
in glioma.
SDH activity is associated with ROS levels in
several cancers. SDH mutations increase ROS and promote tumor
development in paraganglioma, pheochromocytoma (11) and gastrointestinal stromal tumors
(12). Redox imbalance is also
implicated in glioma progression (17). Elevated ROS levels have been
reported to drive glioma stem cell proliferation (36) and enhance the proliferation and
migration/invasion in glioma cell lines (37,38). Our previous findings demonstrated
that ACC1 knockdown in U251 cells increases ROS and promotes
migration/invasion via ERK1/2 phosphorylation (Wang et al,
unpublished data). The results of the current study further support
the importance of ROS in glioma pathogenesis.
Epigenetic mechanisms, including DNA methylation and
histone modifications, serve crucial roles in cancer progression,
including in glioma (39).
Elevated histone acetylation has been reported to promote invasion
and metastasis across several tumors, including glioma (40). The dynamic balance of histone
acetylation and deacetylation modulates DNMT1 activity, a key
regulator of epigenetic processes, as supported by multiple studies
(41-45). Specifically, the histone
acetyltransferase P300 directly interacts with the DNMT1 promoter,
enhancing chromatin acetylation and DNMT1 gene transcription
(46). Furthermore, P300
functions as a critical transcriptional regulator of DNMT1, as
highlighted by its role in cancer progression, as demonstrated by
Li et al (46) in breast
cancer. In U251 glioma cells, the present study demonstrated that
suppressing ACC1 increased the levels of acetyl-CoA, consequently
promoting protein acetylation catalyzed by histone
acetyltransferases, including that of P300. This is likely to
induce increased histone acetylation, potentially reshaping gene
expression profiles and fueling glioma advancement. Additionally,
this may enhance the binding affinity of P300 to the DNMT1
promoter, resulting in increased DNMT1 acetylation, elevated DNMT1
expression and subsequent epigenetic modifications. Moreover,
recent studies have highlighted the role of DNMT1-mediated
hypermethylation of the SDHB promoter in reducing SDHB expression,
which, in turn, is associated with elevated levels of ROS and
contributes to adrenal cortical dysfunction (47). In line with this, the findings of
the present study in U251 glioma cells suggest that increased DNMT1
expression induces hypermethylation of the SDH promoter. This
epigenetic modification elevates ROS levels, fostering U251 glioma
cell migration and invasion.
Furthermore, the in vitro results in the
present study demonstrate that ACC1 knockdown promoted glioma cell
migration and invasion, suggesting a role for ACC1 in glioma
progression. This finding aligned with that of the clinical tissue
microarray analysis, which revealed that lower ACC1 expression was
associated with a worse prognosis in patients with glioma. This was
further supported by survival data from the CGGA database.
Together, these results indicate that ACC1 may serve as a potential
prognostic marker in glioma. Moreover, analysis of the CPTAC glioma
dataset revealed consistent downregulation of all SDH subunits in
high-grade gliomas, suggesting that SDH suppression is a common
feature of aggressive glioma phenotypes. This is consistent with
previous studies linking reduced SDH expression with poor prognosis
in patients with high-grade gliomas (20). However, as ACC1 knockdown was
associated with SDH reduction specifically in U251 cells in the
present study, SDH levels and their association with ACC1
expression in patient tissues were not evaluated, leaving the
clinical relevance and subtype-specific significance of this
relationship uncertain. These findings highlight the need for
further clinical validation to determine whether SDH dysregulation
contributes to ACC1-mediated glioma progression across distinct
glioma subtypes.
Notably, despite adherence to standardized
protocols, the present study was unable to establish a stable
orthotopic xenograft model using U251 cells, and this limitation
precluded in vivo validation of the in vitro
findings. Therefore, future studies should employ patient-derived
xenograft models to evaluate the physiological relevance of the
results of the present study.
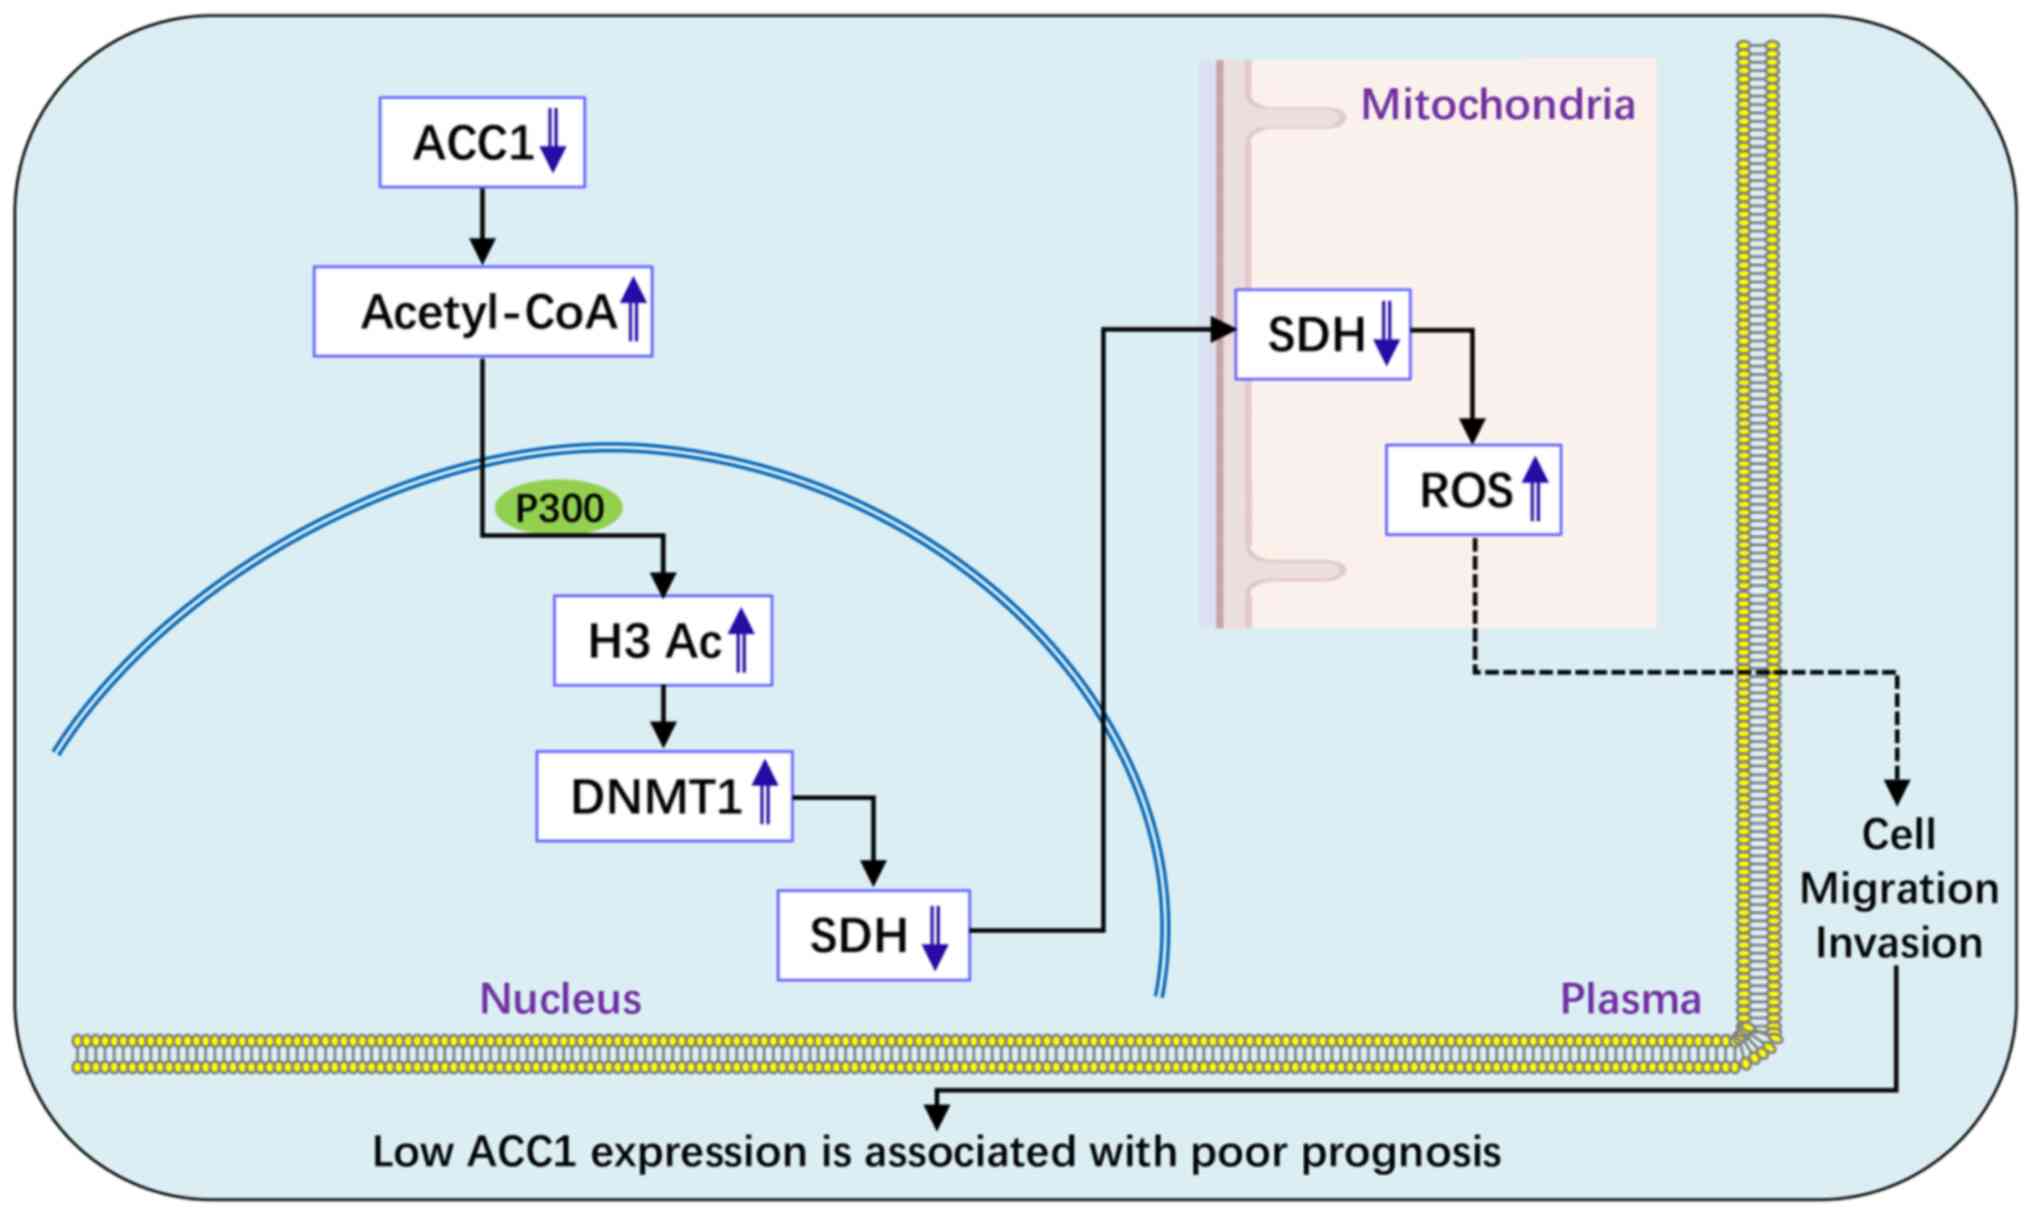
In conclusion, the results of the present study
demonstrated that low ACC1 expression is associated with poor
prognosis in patients with glioma and that ACC1 knockdown enhances
glioma cell proliferation, migration and invasion. Specifically, in
U251 cells, ACC1 knockdown promotes migration and invasion through
the acetyl-CoA/P300/DNMT1/SDH/ROS pathway (Fig. 7). These findings highlight ACC1 as
a potential therapeutic target and underscore the need for
personalized treatment strategies for patients with glioma.
Supplementary Data
Availability of data and materials
The data generated from this study are available
upon request from the corresponding author.
Authors' contributions
XXW, YW, YZL and BSZ conceived and designed the
study. XXW and YW performed the investigation and data analysis.
XXW, WLZ, WQY and JPT conducted the experiments and bioinformatics
analysis. YZL and BSZ supervised the research. XXW and YZL drafted
the manuscript. XXW and YZL confirm the authenticity of all the raw
data. All authors edited, read and approved the final
manuscript.
Ethics approval and consent to
participate
Ethics approval for the glioma tissue microarray was
obtained by Shanghai Outdo Biotech Co., Ltd. (approval no. SHYJS-C
P-1801018).
Patient consent for publication
Not applicable.
Competing interests
The authors that they have declare no competing
interests.
Acknowledgements
Not applicable.
Funding
The present study was supported by grants from the National
Natural Science Foundation of China (grant no. 81973988), the Henan
Key Laboratory of Neurorestoratology Foundation (grant no.
HNSJXF-2021-014) and the Henan Plan of the Medical Science and
Technology Research (grant no. LHGJ20230519).
References
|
1
|
Lapointe S, Perry A and Butowski NA:
Primary brain tumors in adults. Lancet. 392:432–446. 2018.
View Article : Google Scholar : PubMed/NCBI
|
|
2
|
Delgado-López PD and Corrales-García EM:
Survival in glioblastoma: A review on the impact of treatment
modalities. Clin Transl Oncol. 18:1062–1071. 2016. View Article : Google Scholar : PubMed/NCBI
|
|
3
|
Khasraw M and Lassman AB: Advances in the
treatment of malignant gliomas. Curr Oncol Rep. 12:26–33. 2010.
View Article : Google Scholar : PubMed/NCBI
|
|
4
|
Lucke-Wold B, Rangwala BS, Shafique MA,
Siddiq MA, Mustafa MS, Danish F, Nasrullah RMU, Zainab N and Haseeb
A: Focus on current and emerging treatment options for glioma: A
comprehensive review. World J Clin Oncol. 15:482–495. 2024.
View Article : Google Scholar : PubMed/NCBI
|
|
5
|
Duzan A, Reinken D, McGomery TL, Ferencz
NM, Plummer JM and Basti mM: Endocannabinoids are potential
inhibitors of glioblastoma multiforme proliferation. J Integr Med.
21:120–129. 2023. View Article : Google Scholar : PubMed/NCBI
|
|
6
|
Hunkeler M, Hagmann A, Stuttfeld E, Chami
M, Guri Y, Stahlberg H and Maier T: Structural basis for regulation
of human acetyl-CoA carboxylase. Nature. 558:470–474. 2018.
View Article : Google Scholar : PubMed/NCBI
|
|
7
|
Rios Garcia M, Steinbauer B, Srivastava K,
Singhal M, Mattijssen F, Maida A, Christian S, Hess-Stumpp H,
Augustin HG, Müller-Decker K, et al: Acetyl-CoA carboxylase
1-dependent protein acetylation controls breast cancer metastasis
and recurrence. Cell Metab. 26:842–855.e5. 2017. View Article : Google Scholar : PubMed/NCBI
|
|
8
|
Ye B, Yin L, Wang Q and Xu C: ACC1 is
overexpressed in liver cancers and contributes to the proliferation
of human hepatoma Hep G2 cells and the rat liver cell line BRL 3A.
Mol Med Rep. 19:3431–3440. 2019.PubMed/NCBI
|
|
9
|
Garn H, Krause H, Enzmann V and Drössler
K: An improved MTT assay using the electron-coupling agent
menadione. J Immunol Methods. 168:253–256. 1994. View Article : Google Scholar : PubMed/NCBI
|
|
10
|
Owens KM, Aykin-Burns N, Dayal D, Coleman
MC, Domann FE and Spitz DR: Genomic instability induced by mutant
succinate dehydrogenase subunit D (SDHD) is mediated by O2(-•) and
H2O2. Free Radic Biol Med. 52:160–166. 2012. View Article : Google Scholar
|
|
11
|
Turchini J and Gill AJ: Morphologic clues
to succinate dehydrogenase (SDH) deficiency in pheochromocytomas
and paragangliomas. Am J Surg Pathol. 44:422–424. 2020. View Article : Google Scholar
|
|
12
|
Neppala P, Banerjee S, Fanta PT, Yerba M,
Porras KA, Burgoyne AM and Sicklick JK: Current management of
succinate dehydrogenase-deficient gastrointestinal stromal tumors.
Cancer Metastasis Rev. 38:525–535. 2019. View Article : Google Scholar : PubMed/NCBI
|
|
13
|
Rani V, Deep G, Singh RK, Palle K and
Yadav UC: Oxidative stress and metabolic disorders: Pathogenesis
and therapeutic strategies. Life Sci. 148:183–193. 2016. View Article : Google Scholar : PubMed/NCBI
|
|
14
|
Chang H, Li J, Qu K, Wan Y, Liu S, Zheng
W, Zhang Z and Liu C: CRIF1 overexpression facilitates tumor growth
and metastasis through inducing ROS/NFκB pathway in hepatocellular
carcinoma. Cell Death Dis. 11:3322020. View Article : Google Scholar
|
|
15
|
Checa J and Aran JM: Reactive oxygen
species: Drivers of physiological and pathological processes. J
Inflamm Res. 13:1057–1073. 2020. View Article : Google Scholar : PubMed/NCBI
|
|
16
|
Sarmiento-Salinas FL, Perez-Gonzalez A,
Acosta-Casique A, Ix-Ballote A, Diaz A, Treviño S, Rosas-Murrieta
NH, Millán-Perez-Peña L and Maycotte P: Reactive oxygen species:
Role in carcinogenesis, cancer cell signaling and tumor
progression. Life Sci. 284:1199422021. View Article : Google Scholar : PubMed/NCBI
|
|
17
|
Zhou Y, Wang L, Wang C, Wu Y, Chen D and
Lee TH: Potential implications of hydrogen peroxide in the
pathogenesis and therapeutic strategies of gliomas. Arch Pharm Res.
43:187–203. 2020. View Article : Google Scholar : PubMed/NCBI
|
|
18
|
Kleinman HK and Martin GR: Matrigel
basement membrane matrix with biological activity. Semin Cancer
Biol. 15:378–386. 2005. View Article : Google Scholar : PubMed/NCBI
|
|
19
|
Livak KJ and Schmittgen TD: Analysis of
relative gene expression data using real-time quantitative PCR and
the 2(−Delta Delta C(T)) method. Methods. 25:402–408. 2001.
View Article : Google Scholar
|
|
20
|
Sharpe MA, Ismail N and Baskin DS:
Metabolic sculpting of the mitochondria, cell signaling and the
cancer phenotype. Transl Cancer Res. 6:S182–S188. 2017. View Article : Google Scholar
|
|
21
|
Zhang W and Lang R: Succinate metabolism:
A promising therapeutic target for inflammation,
ischemia/reperfusion injury and cancer. Front Cell Dev Biol.
11:12669732023. View Article : Google Scholar : PubMed/NCBI
|
|
22
|
Zafarullah M, Li WQ, Sylvester J and Ahmad
M: Molecular mechanisms of N-acetylcysteine actions. Cell Mol Life
Sci. 60:6–20. 2003. View Article : Google Scholar : PubMed/NCBI
|
|
23
|
Suzuki mM and Bird A: DNA methylation
landscapes: Provocative insights from epigenomics. Nat Rev Genet.
9:465–476. 2008. View Article : Google Scholar : PubMed/NCBI
|
|
24
|
Bestor T, Laudano A, Mattaliano R and
Ingram V: Cloning and sequencing of a cDNA encoding DNA
methyltransferase of mouse cells. The carboxyl-terminal domain of
the mammalian enzymes is related to bacterial restriction
methyltransferases. J Mol Biol. 203:971–983. 1988. View Article : Google Scholar : PubMed/NCBI
|
|
25
|
Ashapkin VV, Kutueva LI and Vanyushin BF:
Dnmt2 is the most evolutionary conserved and enigmatic cytosine DNA
methyltransferase in eukaryotes. Genetika. 52:269–282. 2016.In
Russian. PubMed/NCBI
|
|
26
|
Liao HF, Tai KY, Chen WS, Cheng LC, Ho HN
and Lin SP: Functions of DNA methyltransferase 3-like in germ cells
and beyond. Biol Cell. 104:571–587. 2012. View Article : Google Scholar : PubMed/NCBI
|
|
27
|
Robertson KD, Uzvolgyi E, Liang G,
Talmadge C, Sumegi J, Gonzales FA and Jones PA: The human DNA
methyltransferases (DNMTs) 1, 3a and 3b: Coordinate mRNA expression
in normal tissues and overexpression in tumors. Nucleic Acids Res.
27:2291–2298. 1999. View Article : Google Scholar : PubMed/NCBI
|
|
28
|
Chandrashekar DS, Karthikeyan SK, Korla
PK, Patel H, Shovon AR, Athar M, Netto GJ, Qin ZS, Kumar S, Manne
U, et al: UALCAN: An update to the integrated cancer data analysis
platform. Neoplasia. 25:18–27. 2022. View Article : Google Scholar : PubMed/NCBI
|
|
29
|
Wu J, Singh K, Shing V, Gupta A, Arenberg
BC, Huffstutler RD, Lee DY and Sack MN: Mitochondrial fatty acid
oxidation regulates monocytic type I interferon signaling via
histone acetylation. Sci Adv. 11:eadq93012025. View Article : Google Scholar : PubMed/NCBI
|
|
30
|
Eberlé D, Hegarty B, Bossard P, Ferré P
and Foufelle F: SREBP transcription factors: Master regulators of
lipid homeostasis. Biochimie. 86:839–848. 2004. View Article : Google Scholar : PubMed/NCBI
|
|
31
|
Zhao Z, Zhang KN, Wang Q, Li G, Zeng F,
Zhang Y, Wu F, Chai R, Wang Z, Zhang C, et al: Chinese glioma
genome atlas (CGGA): A comprehensive resource with functional
genomic data from Chinese glioma patients. Genomics Proteomics
Bioinformatics. 19:1–12. 2021. View Article : Google Scholar : PubMed/NCBI
|
|
32
|
Ghandi M, Huang FW, Jané-Valbuena J,
Kryukov GV, Lo CC, McDonald ER III, Barretina J, Gelfand ET,
Bielski CM, Li H, et al: Next-generation characterization of the
cancer cell line encyclopedia. Nature. 569:503–508. 2019.
View Article : Google Scholar : PubMed/NCBI
|
|
33
|
Vitale AM, D'Amico G, Santonocito R,
Spinnato G, Di Marco M, Scalia F, Campanella C, Tringali G, Giusti
I, Dolo V, et al: An overview of glioblastoma multiforme in vitro
experimental models. J Biol Res. 6:1982024.
|
|
34
|
Hong X, Chedid K and Kalkanis SN:
Glioblastoma cell line-derived spheres in serumcontaining medium
versus serum-free medium: A comparison of cancer stem cell
properties. Int J Oncol. 41:1693–1700. 2012. View Article : Google Scholar : PubMed/NCBI
|
|
35
|
Hernández-Vega AM, Del Moral-Morales A,
Zamora-Sánchez CJ, Piña-Medina AG, González-Arenas A and
Camacho-Arroyo I: Estradiol induces epithelial to mesenchymal
transition of human glioblastoma cells. Cells. 9:19302020.
View Article : Google Scholar : PubMed/NCBI
|
|
36
|
Yuan S, Lu Y, Yang J, Chen G, Kim S, Feng
L, Ogasawara M, Hammoudi N, Lu W, Zhang H, et al: Metabolic
activation of mitochondria in glioma stem cells promotes cancer
development through a reactive oxygen species-mediated mechanism.
Stem Cell Res Ther. 6:1982015. View Article : Google Scholar : PubMed/NCBI
|
|
37
|
Wu L, Wang F, Xu J and Chen Z: PTPN2
induced by inflammatory response and oxidative stress contributed
to glioma progression. J Cell Biochem. 120:19044–19051. 2019.
View Article : Google Scholar : PubMed/NCBI
|
|
38
|
Chiu WT, Shen SC, Chow JM, Lin CW, Shia LT
and Chen YC: Contribution of reactive oxygen species to
migration/invasion of human glioblastoma cells U87 via
ERK-dependent COX-2/PGE2 activation. Neurobiol Dis.
37:118–129. 2010. View Article : Google Scholar
|
|
39
|
Recillas-Targa F: Cancer epigenetics: An
overview. Arch Med Res. 53:732–740. 2022. View Article : Google Scholar : PubMed/NCBI
|
|
40
|
Fan Y, Peng X, Wang Y, Li B and Zhao G:
Comprehensive analysis of HDAC family identifies HDAC1 as a
prognostic and immune infiltration indicator and HDAC1-related
signature for prognosis in glioma. Front Mol Biosci. 8:7200202021.
View Article : Google Scholar : PubMed/NCBI
|
|
41
|
Tan HH and Porter AG: p21(WAF1) negatively
regulates DNMT1 expression in mammalian cells. Biochem Biophys Res
Commun. 382:171–176. 2009. View Article : Google Scholar : PubMed/NCBI
|
|
42
|
Peng L, Yuan Z, Ling H, Fukasawa K,
Robertson K, Olashaw N, Koomen J, Chen J, Lane WS and Seto E: SIRT1
deacetylates the DNA methyltransferase 1 (DNMT1) protein and alters
its activities. Mol Cell Biol. 31:4720–4734. 2011. View Article : Google Scholar : PubMed/NCBI
|
|
43
|
Harada T, Ohguchi H, Grondin Y, Kikuchi S,
Sagawa M, Tai YT, Mazitschek R, Hideshima T and Anderson KC: HDAC3
regulates DNMT1 expression in multiple myeloma: Therapeutic
implications. Leukemia. 31:2670–2677. 2017. View Article : Google Scholar : PubMed/NCBI
|
|
44
|
Du Z, Song J, Wang Y, Zhao Y, Guda K, Yang
S, Kao HY, Xu Y, Willis J, Markowitz SD, et al: DNMT1 stability is
regulated by proteins coordinating deubiquitination and
acetylation-driven ubiquitination. Sci Signal. 3:ra802010.
View Article : Google Scholar : PubMed/NCBI
|
|
45
|
Kishikawa S, Ugai H, Murata T and Yokoyama
KK: Roles of histone acetylation in the Dnmt1 gene expression.
Nucleic Acids Res. Suppl:209–210. 2002. View Article : Google Scholar
|
|
46
|
Li Z, Wang P, Cui W, Yong H, Wang D, Zhao
T, Wang W, Shi M, Zheng J and Bai J: Tumour-associated macrophages
enhance breast cancer malignancy via inducing ZEB1-mediated DNMT1
transcriptional activation. Cell Biosci. 12:1762022. View Article : Google Scholar : PubMed/NCBI
|
|
47
|
Mateska I, Witt A, Hagag E, Sinha A,
Yilmaz C, Thanou E, Sun N, Kolliniati O, Patschin M, Abdelmegeed H,
et al: Succinate mediates inflammation-induced adrenocortical
dysfunction. Elife. 12:e830642023. View Article : Google Scholar : PubMed/NCBI
|