Introduction
Intimate intercellular communication between breast
cancer (BC) cells and other cells in the surrounding
microenvironment exerts a significant influence on a number of key
processes, including primary tumor growth, metastasis evolution and
immune escape. In particular, the breast is a fat-rich organ and BC
development and progression are strongly influenced by the intimate
and highly vicious cycle between adipocytes, which act as endocrine
cells, and tumor cells (1). The
main methods of cell-to-cell communication are direct contacts
involving adhesion molecules and indirect contacts through
classical paracrine signaling mediated by secreted molecules
(2,3). Beyond the secretion of various
soluble factors (for example, leptin and adiponectin) (4-13),
adipocyte-derived EVs, a heterogeneous group of membrane-enclosed
structures, have emerged as an essential part of the adipocyte
secretome (14), acting as key
mediators of intercellular communication and contributing to
autocrine, paracrine and endocrine communication (15). Indeed, EVs are capable of
transferring a multitude of biological molecules, including
proteins, nucleic acids and lipids, which can subsequently alter
the biology of the recipient cells. In this situation, it has been
demonstrated that EVs derived from 3T3-L1 adipocytes, a widely used
in vitro model for white adipocytes, sustain proliferation,
migration and invasion and response to therapy in several cancer
cell lines through multiple mechanisms (16-21). For instance, melanoma cell lines
treated with adipocyte-derived EVs exhibit more aggressive
features, including elongated morphology and actin-rich membrane
profusion along with an increased cell migration in vitro
and lung colonization in vivo (18). Furthermore, it has been also
demonstrated that 3T3-L1-EV adipocytes promote lung cancer cell
invasion in vitro and in vivo through an increased
activity of matrix metalloproteinase 9 (MMP-9) (16). In another study, EVs derived from
3T3-L1 adipocytes were reported to: i) Promote the proliferation of
prostate cancer cells, ii) sustain their migratory capabilities and
iii) confer resistance to docetaxel. This is achieved through a
mechanism involving the Akt/hypoxia-inducible factor 1 α (HIF-1α)
axis, which is accompanied by enhanced glycolysis and ATP
production (17). The involvement
of the HIF-1α/von Hippel-Lindau axis in modulating the protumoral
effects of adipocyte-derived EVs has been also reported in
hepatocellular carcinoma (19).
In line with this evidence, our research group also found that
3T3-L1 adipocyte-derived EVs support BC cell proliferation, growth,
migration and invasion as well as their metastatic potential via
the induction of HIF-1α levels and activity (20).
The present study employed proteomic analysis to
gain deeper insights into the role of EVs in breast adiponcosis,
providing novel evidence on the role of adipocyte-derived EVs in
sustaining mitochondrial metabolism in BC cells through HIF-1α.
Materials and methods
Antibodies and reagents
Dexamethasone, 3-Isobutyl-1-Methylxanthine and
bovine insulin were purchased from Merck KGaA. KC7F2 (cat. no.
S7946) from Selleck Chemicals LLC. Tumor susceptibility gene 101
(Tsg101; cat. no. MA1-23296) was purchased from Thermo Fisher
Scientific, Inc. ALIX (cat. no. ab186429) and total OXPHOS (cat.
no. ab110411) cocktail was purchased from Abcam. CD81 (cat. no.
sc-166029); Heat shock protein 90 (HSP90; cat. no. sc-7947);
Calnexin (cat. no. sc-11397), HIF-1α (cat. no. sc-13515), TOM20
(cat. no. sc-17764), β-Actin (cat. no. sc-47778) and GAPDH (cat.
no. sc-166545) were acquired from Santa Cruz Biotechnology,
Inc.
Cell cultures
Human MCF-7 (cat. no. HTB-22), ZR-75-1 (cat. no.
CRL-1500) and BT-474 (cat. no. HTB-20) BC epithelial cells and
murine 3T3-L1 (cat. no. CRL-1500) pre-adipocytes were acquired from
American-Type-Culture-Collection (ATCC) and cultured in accordance
with supplier specifications. MCF-7 and ZR-75-1 cells were cultured
in EMEM medium and RPMI-1640 (Thermo Fisher Scientific, Inc.),
respectively, containing 10% FBS, 1% L-glutamine and 1%
penicillin-streptomycin (Thermo Fisher Scientific, Inc.). BT-474
cells were cultured in ATCC Hybri-Care Medium supplemented with 10%
FBS, 1% penicillin-streptomycin. Every six months, cells were
authenticated by single tandem repeat analysis at our Sequencing
Core; morphology, doubling times and estrogen sensitivity and
tested for mycoplasma negativity (MycoAlert; Lonza Group Ltd.).
Isolation of extracellular vesicles
(EVs)
Isolation of 3T3-L1 adipocyte-derived
EVs
EVs were isolated from murine 3T3-L1 and 3T3-L1
adipocytes (3T3-L1A) conditioned media. Briefly, 3T3-L1 and 3T3-L1A
cells were cultured in serum-free medium for 24 h and EVs were
obtained from the resulting conditioned medium using differential
ultracentrifugation (20).
Isolation of normal weight (NW) and
overweight/obese (OW/Ob) EVs
EVs from serum samples of NW and OW/Ob female
patients with BC were isolated by the ExoQuick isolation agent
(System Bioscience, Palo Alto, CA, USA), following the
manufacturer's instructions (22). A total of 45 biological samples,
with an age range of 30-73 years for NW group and 36-83 years for
OW/Ob groups, were collected, between May 2016 and February 2020,
at the Department of Molecular Medicine and Medical Biotechnology,
University of Naples Federico II. The samples were stored at −80°C
until use. The study protocol was reviewed and approved (approval
no. 107/05) by the Ethics Committee of the University of Naples
Federico II (Department of Advanced Biomedical Sciences).
Isolated EVs were stored at −80°C and characterized
by transmission electron microscopy (TEM), Nanoparticle tracking
analysis (NTA) and immunoblotting. For TEM analysis, the
EV-containing aliquots were diluted in sterile NaCl 0.9% and then
added onto formvar-carbon coated grids (Electron Microscopy
Sciences, cat. no. FCF400-Cu). The grids were blotted dry at room
temperature. The imaging process was conducted using a Jeol JEM
1400 Plus transmission electron microscope (JEOL Ltd., Tokyo,
Japan) operated at an accelerating voltage of 80 kV. NTA was
performed as previously reported (20). As storage at −80°C maintains EV
stability, with minimal changes in size, concentration and protein
content (23,24), these EVs were used in the
respective experiments reported in the current study.
Gene silencing transfection
Cells were transfected with small interfering
(si)HIF-1α silencer validated siRNA (cat. no. 4390824; ID s6541)
and with silencer select negative control (NC; cat. no. 4390843)
(Ambion; Thermo Fisher Scientific, Inc.), using
Lipofectamine® RNAi/MAX reagent (Thermo Fisher
Scientific, Inc.) according to the manual instructions.
Specifically, 35×104 MCF-7 BC cells were transfected
with 50 pmol of both validated (si)HIF-1α silencer siRNA and
silencer select negative control and plated in 6-well plates. After
24 h, transfected cells were plated for mitotracker analysis
(35×104 cells in 6-well plates) and for seahorse
analysis (104 cells in XFe-96 well plates). Assays were
then performed as described.
Immunoblot analysis
Immunoblot were performed as previously described
(25). Specifically, cell
extracts or EV lysates were obtained using RIPA buffer
(Sigma-Aldrich), supplemented with protease inhibitor. 50 μg
of proteins, previously quantified by Pierce™ BCA Protein Assay Kit
(cat. no. 23227; Thermo Fishers Scientific, Inc.) were resolved on
10% SDS polyacrylamide gel and transferred to nitrocellulose
membranes by using power blotter XL system (Thermo Fisher
Scientific, Inc.). Nitrocellulose membranes were blocked with 5%
milk in tris-buffered saline for 1 h at room temperature, which was
followed by incubation overnight at 4°C in bovine serum albumin 5%
with primary antibodies. Specifically, anti-Tsg101 (cat. no.
MA1-23296; dilution 1:1,000); anti-ALIX (cat. no. ab186429;
dilution 1:1,000); total OXPHOS cocktail (cat. no. ab110411;
dilution 1:1,000); CD81 (cat. no. sc-166029; dilution 1:500); HSP90
(cat. no. sc-7947; dilution 1:500); Calnexin (cat. no. sc-11397;
dilution 1:1,000), HIF-1α (cat. no. sc-13515; dilution 1:200);
TOM20 (cat. no. sc-17764; dilution 1:1,000), β-Actin (cat. no.
sc-47778; dilution 1:10,000) and GAPDH (cat. no. sc-166545;
dilution 1:10,000) primary antibodies were used. IRDye 600 and
800CW Goat anti-Mouse or anti-Rabbit (LI-COR, Inc.) IgG secondary
antibodies were used at 1:15,000 dilution. Images were acquired
using Odyssey FC (LI-COR, Inc.) and ImageJ software was used to
quantify the band of interest (v.1.52a, NIH, USA).
Proteomic analysis
Filter-aided sample protocol (FASP)
digestion
The cells were lysed with RIPA buffer and the
protein digestion procedure was subsequently performed according to
the FASP method (26) using 10
kDa molecular cut-off microcon filters. According to the digestion
protocol, 50 μg of cell lysate was mixed with 10% SDS, 500
mM DTT, 1 M Tris HCl, pH 8.0 and incubated at 650 rpm for 10 min at
95°C. After incubation, the samples were allowed to reach to room
temperature and loaded onto the FASP filter. The protocol is
characterized by several distinct steps including two washes with
200 μl of 8M UREA (8 M UA, 100 mM Tris-HCl buffer pH 8.0)
and subsequent centrifugation at 14,000 × g for 20 min at room
temperature, followed by the addition of 50 μl of 50 mM
Iodioacetamide (IAA) and centrifugation at 6,000 × g for 20 min at
room temperature. After the alkylation reaction, two washes with 8M
UREA and two washes with 50 mM TEAB were performed. Enzymatic
digestion was then performed overnight at 37°C by adding 500 ng of
proteomics grade trypsin (MilliporeSigma) in 60 μl of 50 mM
TEAB buffer at pH 8.5.
SCX (strong cation exchange)
purification
The next day H2O (140 μl) was
added and the samples were centrifuged at 14,000 × g for 20 min at
room temperature to collect 180-200 μl of digest. Then, 40
μl (corresponding to 10 μg of digested peptides) of
each extract were purified by StageTip SCX as described by
Rappsilber et al (27), to
remove detergent residues. Before proceeding with SCX purification,
tryptic digests were acidified with 360 μl of Wash B [80%
acetonitrile/0.5% formic acid (v/v)], to reduce the salt
concentration. Acidified tryptic peptides were then loaded onto
StageTips containing approximately 100 μg of a cation
exchange resin (Millipore Extraction Disks; MilliporeSigma) that
had before been conditioned with Wash A [20% acetonitrile/0.5%
formic acid (v/v)] and Wash B. After two washes with 50 μl
of Solution W2 and 50 μl of Solution W1, respectively, the
peptides were eluted by the addition of 10 μl of 500 mM
ammonium acetate-20% acetonitrile and were then diluted by adding
90 μl of 0.1% formic acid. Then, 1 μl of the purified
sample was used for preliminary liquid chromatography-tandem mass
spectrometry (LC-MS/MS) analysis. Following the preliminary
injections, the final injections were performed. In particular, for
each biological replicate, three LC-MS/MS injections were performed
(technical replicate).
LC-MS/MS analysis
For peptide separation, the present study employed
an easy nlC-1000 chromatographic instrument coupled to an Exploris
480 mass spectrometer (Thermo Fisher Scientific, Inc.). For
LC-MS/MS analysis, samples were separated using a 14 cm, 75
μm i.d. column, packed in-house with 3 μm C18 silica
particles (Dr. Maisch HPLC GmbH). The peptides were eluted from the
column with a binary gradient of 140 min and a flow rate of 300
nl/min. The following mobile phases were used: Mobile phase A [2%
acetonitrile/0.1% formic acid (v/v)] and mobile phase B [80%
acetonitrile/0.1% formic acid (v/v)]. The peptide separation were
obtained at a flow rate of 300 nl/min as follows: From 0% B to 3% B
in 1 sec, from 3% B to 8% B in 40 min and from 42% B to 100% B in
13 min; the column was cleaned for 5 min with 100% B. The samples
were analyzed in Data Independent Acquisition (DIA) mode. The DIA
method included 60 windows (45 windows with an isolation window of
8 m/z, 10 windows with an isolation of 16 m/z and 5 windows with an
isolation of 28 m/z). Full MS scans were performed in the range
from 350 m/z up to 1,000 m/z with 60000 of resolution (AGC target
Custom; maximum injection time 50 and collision energy 25).
Statistical analysis of proteome
data
The RAW files were analyzed using the Spectronaut
software (version 13.0; Biognosys AG). The search was performed
with Direct DIA mode. Protein quantification was performed using
the following parameters: Active precursor filtering (it required
the precursor to be quantified in at least 20% of the runs);
imputation by run wise imputing, Major Group Top N (Max 10-Min 1).
Missing values at the protein quant level were 2006, averaging at
~111 proteins per sample (2.5%) and were handled in Spectronaut
using the following parameters: Active precursor filtering (it
required the precursor to be quantified in at least 20% of the
runs); imputation by run wise imputing. The resulting matrix, which
contained no missing values since already imputed in Spectronaut,
was then imported into Perseus (version 2.0.6.0;
Max-Planck-Gesellschaft) to perform the necessary statistical
analysis (28). The data were
transformed using a logarithmic scale (log2). Protein
quantities from technical replicates (separate LC-MS/MS injections)
were combined using the median value. Finally, the unpaired
two-sample t-test was used to assess the statistical significance
of protein abundances. Correction for multiple hypothesis testing
was permutation-based (FDR <0.05). The principal component
analysis (PCA) plot was generated by using the R packages (version
4.4.2; https://www.R-project.org/),
'Factoextra' (version 1.0.7, https://CRAN.R-project.org/package=factoextra) and
'ggplot2' (version 3.5.2; https://ggplot2.tidyverse.org); 95% confidence limits
within the PCA plot were calculated using the function
'fviz_pca_ind' in the 'Factoextra' package.
Analysis of protein annotations
The resulting protein list was subjected to
different annotation tools for further in-depth analysis. For
functional makeup of the identified proteins Bionic Visualizations
Proteomaps was used (https://www.proteomaps.net). All de-regulated proteins
(39 upregulated and 59 downregulated) were used for the
analyses.
Protein-protein interaction (PPI)
network construction
The PPI network of the candidate proteins was
generated using STRING version 12.0 (https://string-db.org/cgi/input?sessionId=bp7GGoXn66Fl&input_page_show_search=on).
Functional enrichment analysis
De-regulated proteins identified in MCF-7 cells
treated with 3T3-L1A-EVs were subjected to Gene Ontology (GO) and
biological pathway enrichment analysis using FunRich tool
(http://www.funrich.org) against human FunRich
background database. P≤0.05 was considered to indicate a
statistically significant difference and the GO results were ranked
by P-value. The top 10 significant pathways in the de-regulated
proteins were exhibited as bar charts. The same bioinformatics tool
was employed to construct a Venn diagram, with the objective of
evaluating the potential overlap between the identified
de-regulated proteins and EV proteins that have been previously
annotated in Vesiclepedia (version 5.1, http://www.microvesicles.org/) and Exocarta (version
3.1, http://www.exocarta.org/) databases.
Gene set enrichment analysis
(GSEA)
GSEA was performed using the Molecular Signatures
Database (MSigDB; https://www.gsea-msigdb.org/gsea/msigdb) to examine
the gene expression profiles of de-regulated proteins identified in
MCF-7 cells treated with 3T3-L1A-EVs. The analysis included
overlaps with GO categories: GO:BP (Biological Process), GO:CC
(Cellular Component) and GO:MF (Molecular Function). Results were
visualized using the ggplot2 package in R.
Pathway enrichment analysis
The analysis of signaling pathways in which
de-regulated proteins identified in MCF-7 cells treated with
3T3-L1A-EVs are involved was performed using the REACTOME free
online database (https://reactome.org/). The resulting data were
visualized in R using the ggplot2 package.
Seahorse XFe96 metabolic profile
analysis
By using XFe-96 well cell culture plates MCF-7,
ZR-75-1 and BT-474 cells were seeded in 150 μl of regular
growth medium for 24 h (104 cells/well). The next day, 2
μg/ml of 3T3-L1A-EVs were added to Exo-depleted medium
(Thermo Fisher Scientific, Inc.) for 48 h. The real-time oxygen
consumption rates (OCR) and extracellular acidification rates
(ECAR) were assessed by using mito stress and glycolysis stress
assays, respectively (Agilent Technologies, Inc.). The day prior to
assay a sensor cartridge was hydrated using Seahorse XF Calibrant
at 37°C for 1 h in a non-CO2 incubator. On the day of
the experiment, cells were in prewarmed XF assay media (10 mM
glucose, 1 mM pyruvate, 2 mM L-glutamine to assess OCR levels; 2 mM
L-glutamine to measure ECAR levels and adjusted to pH 7.4) and
cells were maintained at 37°C for 1 h in a CO2-free
incubator. Then, 1.5 μM Oligomycin, 0.5 μM FCCP and
0.5 μM Rotenone/0.5 μM Antimycin A mix were
sequentially injected to measure mitochondrial activity. To assess
glycolytic activity 10 mM glucose, 1 μM Oligomycin and 50 mM
M2-deoxyglucose (2-DG) were sequentially injected. The data were
then normalized using the sulforhodamine B (SRB) assay.
Sulforhodamine B (SRB) assay
Trichloroacetic acid (TCA; 10%) was added to cells
(1 h at 4°C), then SRB dye was used (30 min; Acid Red 52; Merck
KGaA) and the cells washed two times with 1% acetic acid. The cells
were left to air dry for a minimum of 3 h. Finally, 10 mM Tris pH
8.8 solution was added and the absorbance measured at a wavelength
of 565 nm (Multiskan SkyHigh; Thermo Fisher Scientific, Inc.).
Determination of cellular ATP
levels
MCF-7 cells were plated in 1.5 ml of Exo-depleted
medium into 6 well-plates for 24 h (35×104 cells/well)
and the next day treated or not with the same amount (2
μg/ml) of EVs for 48 h. Intracellular ATP levels were
determined by using an ATP Assay Kit (cat. no. ab83355; Abcam) and
optical density (570 nm) was measured using a microplate reader
(Multiskan SkyHigh; Thermo Fisher Scientific, Inc.). ATP levels
were normalized to cell number.
Assessment of mitochondrial mass and
mitochondrial membrane potential
Cells were plated in 1.5 ml of regular growth medium
into 6 well-plates (35×104 cells/well) and the next day
were treated or not with 2 μg/ml of 3T3-L1A-EVs for 48 h in
Exo-depleted medium. At the end of the treatment, cells were
trypsinized and equally divided into two separate tubes. Each
aliquot was then incubated with a different probe
[MitoTracker® Deep Red FM or MitoTracker®
Orange CMTMRos (Thermo Fisher scientific, Inc.) 10 nM in PBS for
30-60 min at 37°C] to assess mitochondrial mass and membrane
potential, respectively, by FACS analysis (CytoFLEX Beckman,
Beckman Coulter, Inc.). For data analysis, manual gating was used
to remove debris and doublets and analysis was performed at
constant events (104) in each sample (Fig. S1). Data analysis was performed
using CytExpert Beckman Coulter software (version 2.4, Beckman
Coulter, Inc.).
Statistical analysis
Statistical analysis was performed with unpaired
Student's t test for the comparison between two groups and one-way
ANOVA with Tukey's multiple comparisons post hoc test for the
comparison between multiple variables by using GraphPad Prism 8
(GraphPad Software, Inc.; Dotmatics) and the results were reported
as the mean ± SD or ± SEM, as indicated, of at least 3 independent
experiments, each performed in triplicate. P<0.05 was considered
to indicate a statistically significant difference.
Results
3T3-L1A-derived EVs affect the proteomic
profile of BC cells
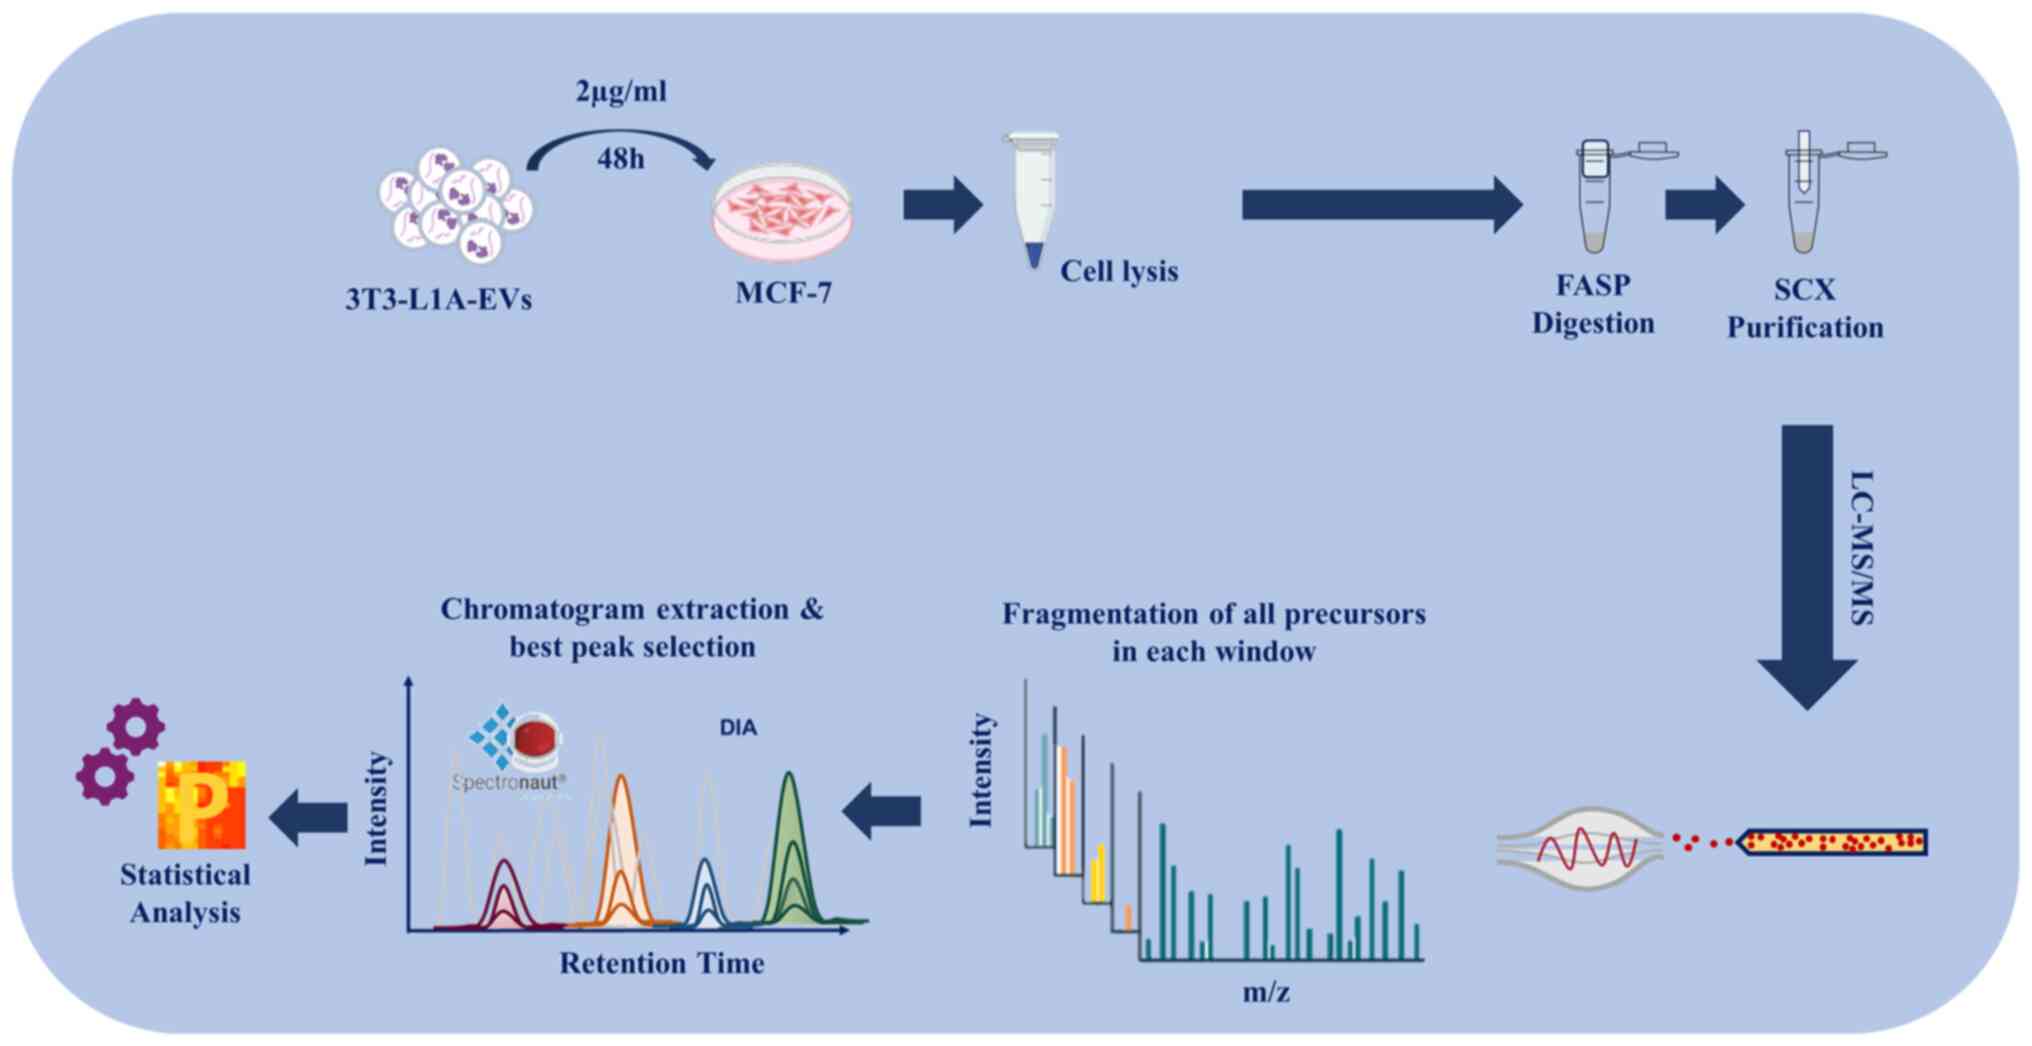
In order to evaluate the effect of EVs on the
proteomic profile of BC cells, the present study used stored and
fully characterized EVs, which had previously been isolated from
the conditioned media derived from 3T3-L1A cells, the most commonly
used in vitro model for white adipocytes (20). EVs were characterized by
transmission electron microscopy (TEM), Nanoparticle tracking
analysis (NTA) and immunoblotting. Specifically, TEM analysis
confirmed that EVs exhibited the characteristic oval or cup-shaped
morphology, enclosed within a lipid bilayer membrane (Fig. S2A) and the NTA analysis revealed
that the mode diameter remained consistently below 200 nm in all
isolated EVs (Fig. S2B).
Immunoblotting showed an enrichment of the EV hallmarks, including
Alix, CD81, Tsg101 and HSP90, while the negative marker Calnexin
was not detected in all isolated EVs (Fig. S2C). Estrogen receptor-positive
(ER+) MCF-7 BC cells were treated for 48 h with 2 μg/ml EVs
and then cells were subjected to LC-MS/MS, by using FASP protocol
and DIA. Raw data were analyzed by using Spectronaut and Perseus
(statistical analysis) software. A schematic diagram of the
experimental design of the study is shown in Fig. 1.
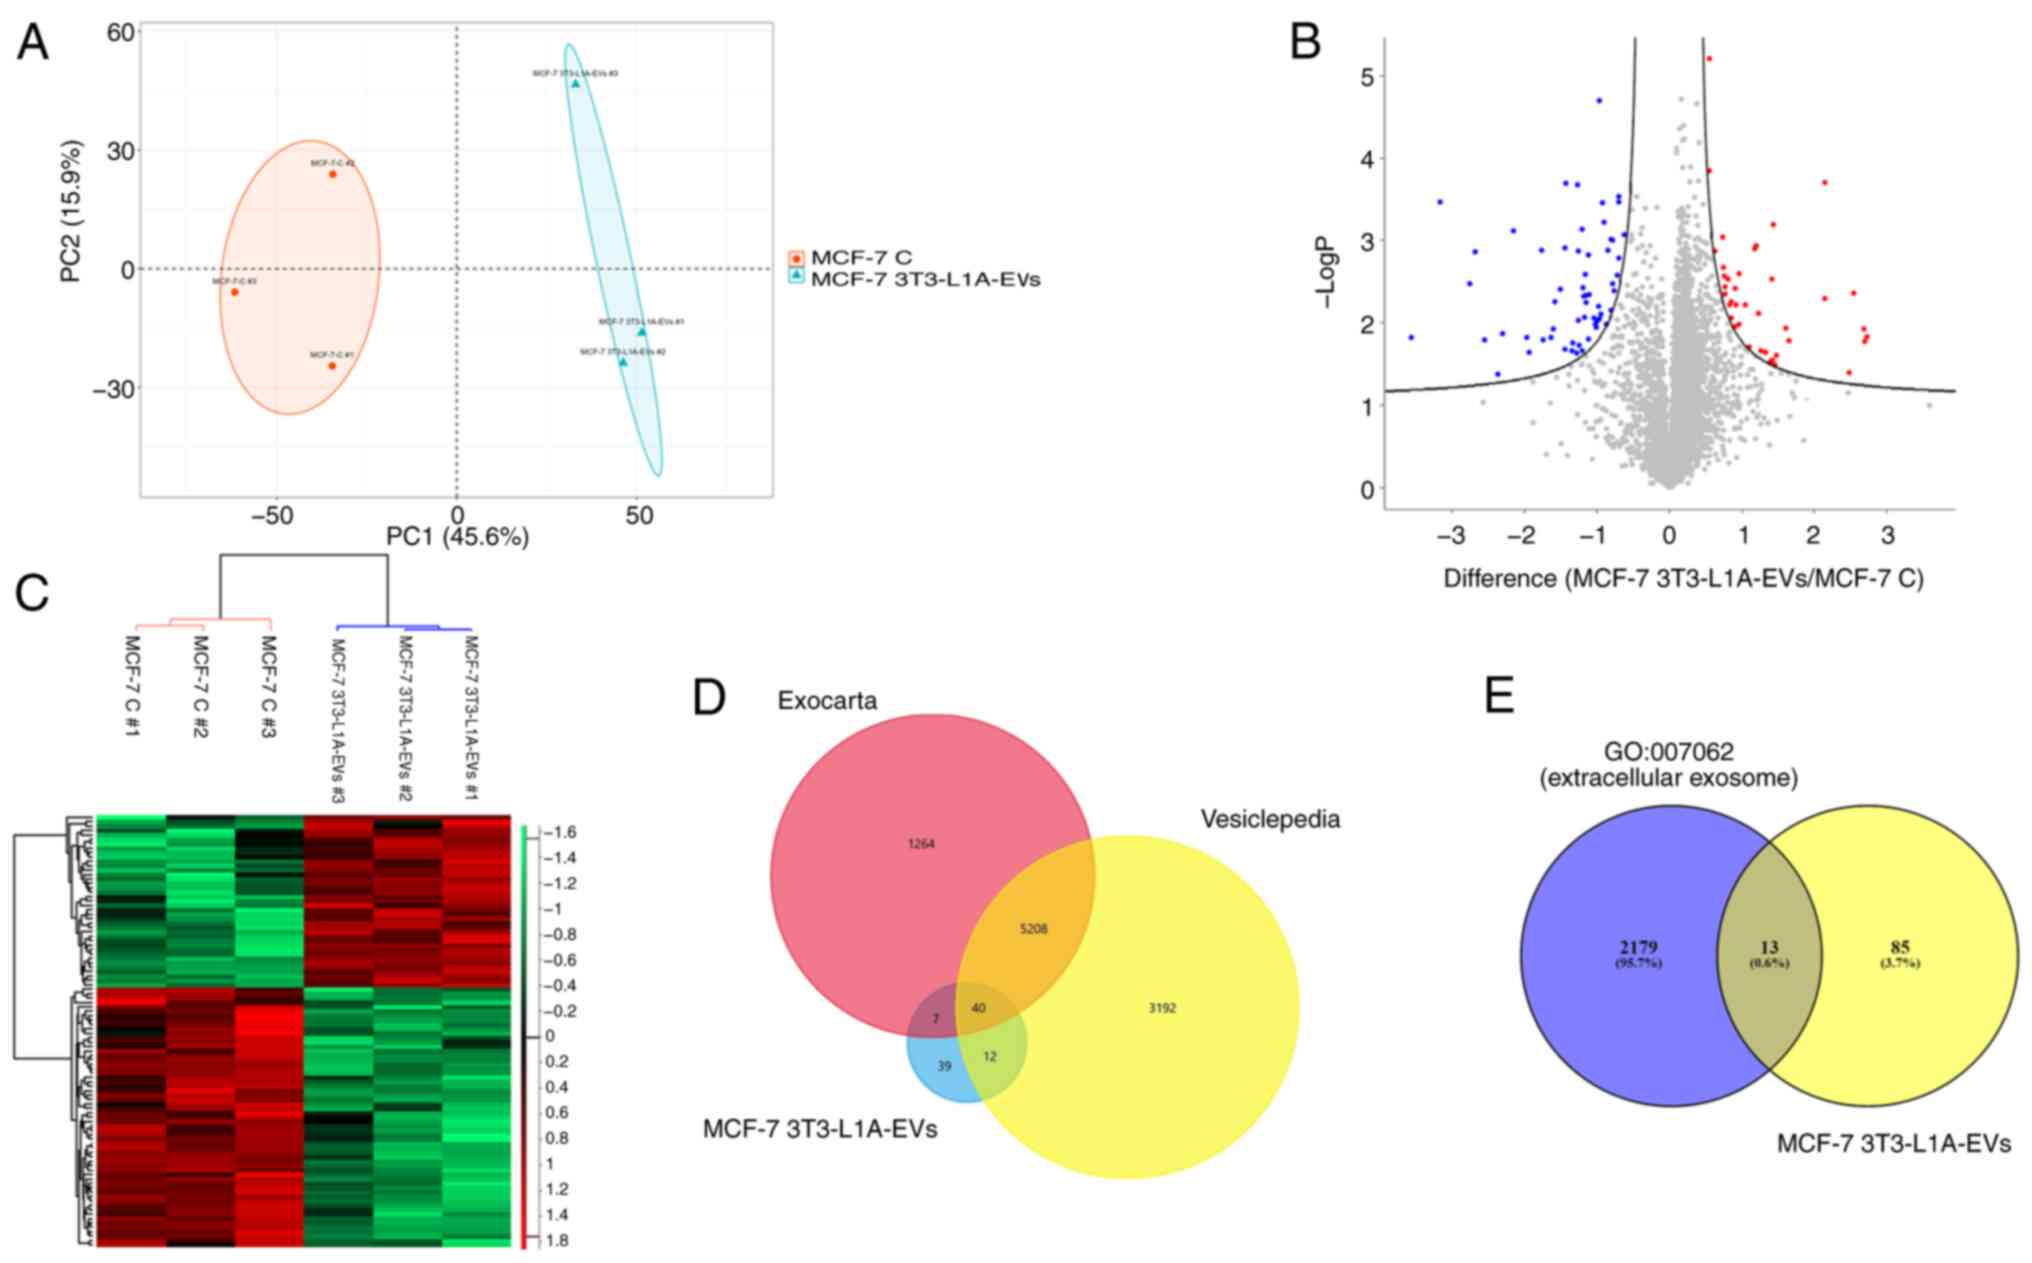
PCA indicated good reproducibility of the technical
replicates and injections demonstrating the different
two-dimensional distribution between the three replicates of each
sample (untreated and treated samples). Furthermore, the PCA
revealed that the EV-treated cells clustered separately from the
untreated cells, highlighting a significant difference in the
proteomes of the two different conditions (Fig. 2A). LC-MS/MS analysis allowed us to
identify 4,411 proteins (FDR <0.05). Prior to imputation, only
very few proteins were exclusively identified and quantified in
either one of the two conditions; in particular, syntenin-1,
ubiquitin carboxyl-terminal hydrolase 4 and vinexin were
exclusively identified in control MCF-7 cells, whereas
skin-specific protein 32 was exclusively detected in 3 analyses of
3T3-L1A-EV-treated MCF-7 cells. Among the proteins revealed by
LC-MS/MS analysis, 98 proteins were found to be differentially
expressed in 3T3-L1A-EV-treated MCF-7 cells, with a P≤0.05
(Table I). Of these, 39 proteins
were upregulated and 59 proteins downregulated, as reported in the
volcano plot (Fig. 2B). The
hierarchical cluster analysis confirmed the alteration in protein
levels between MCF-7 cells treated with 3T3-L1A-EVs and untreated
cells (Fig. 2C). In addition,
when the de-regulated proteins were compared with those identified
in the Vesiclepedia and Exocarta databases, it was found that 40 of
them could be attributed to vesicular origin (Fig. 2D). Furthermore, the association of
the 98 differentially expressed proteins in 3T3-L1A-EVs-treated
MCF-7 cells were investigated with the 'extracellular exosome' gene
ontology (GO:0070062). It is notable that a total of 13 proteins
(gene names: PLG, APOD, PRKCA, CLIC1, SAMM50, HLA-B, GPRC5A,
GSTM2, PPIC, AASDHPPT, NEDD8, LAMTOR1 and VTN) were
found to be associated with the 'extracellular exosome' gene
ontology (Fig. 2E).
 | Table IThe 98 de-regulated proteins
identified in the comparison MCF-7 3T3-L1A-EV treated cells vs.
untreated cells. |
Table I
The 98 de-regulated proteins
identified in the comparison MCF-7 3T3-L1A-EV treated cells vs.
untreated cells.
| Gene name | Fold change | Protein
descriptions |
|---|
| ATPIF1 | 6.6 | ATPase inhibitor,
mitochondrial |
| PLG | 6.5 | Plasminogen |
| USMG5 | 6.5 | Up-regulated during
skeletal muscle growth protein 5 |
| RABIF | 5.8 | Guanine nucleotide
exchange factor MSS4 |
| ANTXR2 | 5.6 | Isoform 4 of
Anthrax toxin receptor 2 |
| COX17 | 4.4 | Cytochrome c
oxidase copper chaperone |
| FBXO7 | 4.4 | F-box only protein
7 |
| AGPAT1 | 3.1 |
1-acyl-sn-glycerol-3-phosphate
acyltransferase alpha |
| POLR2G | 3.1 | DNA-directed RNA
polymerase II subunit RPB7 |
| STAG2 | 2.8 | Cohesin subunit
SA-2; Isoform 2 of Cohesin subunit SA-2 |
| YARS2 | 2.7 | Tyrosine-tRNA
ligase, mitochondrial |
| MAP4K5 | 2.7 | Mitogen-activated
protein kinase kinase kinase kinase 5 |
| AFAP1 | 2.7 | Actin
filament-associated protein 1 |
| PRKCA | 2.7 | Protein kinase C
alpha type |
| BTF3 | 2.6 | Isoform 2 of
Transcription factor BTF3 |
| TUBGCP2 | 2.5 | Gamma-tubulin
complex component 2 |
| MRPL4 | 2.4 | 39S ribosomal
protein L4, mitochondrial |
| NSUN4 | 2.4 | 5-methylcytosine
rRNA methyltransferase NSUN4 |
| GEMIN6 | 2.3 | Gem-associated
protein 6 |
| PPM1H | 2.3 | Protein phosphatase
1H |
| TMEM38B | 2.2 | Trimeric
intracellular cation channel type B |
| IRF2BP1 | 2.1 | Interferon
regulatory factor 2-binding protein 1 |
| MPDU1 | 1.9 | Mannose-P-dolichol
utilization defect 1 protein |
| TBC1D23 | 1.9 | TBC1 domain family
member 23; Isoform 2 of TBC1 domain family member 23 |
| ACOT8 | 1.9 | Acyl-coenzyme A
thioesterase 8 |
| KRI1 | 1.9 | Protein KRI1
homolog |
| WDR6 | 1.9 | WD
repeat-containing protein 6 |
| PATL1 | 1.8 | Protein PAT1
homolog 1; Isoform 2 of Protein PAT1 homolog 1 |
| HLA-B | 1.8 | HLA class I
histocompatibility antigen, B-14 alpha chain |
| FHL3 | 1.8 | Four and a half LIM
domains protein 3 |
| CMC1 | 1.8 | COX assembly
mitochondrial protein homolog |
| ALG8 | 1.7 | Probable dolichyl
pyrophosphate Glc1Man9GlcNAc2 alpha-1,3-glucosyltransferase; |
| XIAP | 1.7 | E3
ubiquitin-protein ligase XIAP |
| TAPBP | 1.7 | Tapasin; Isoform 2
of Tapasin; Isoform 3 of Tapasin |
| DDX50 | 1.7 | ATP-dependent RNA
helicase DDX50 |
| IFI6 | 1.7 | Interferon
α-inducible protein 6 |
| PPP1R10 | 1.5 |
Serine/threonine-protein phosphatase 1
regulatory subunit 10 |
| SUMO1 | 1.5 | Small
ubiquitin-related modifier 1; |
| SCRN3 | 1.5 | Secernin-3; Isoform
2 of Secernin-3 |
| PPIC | 0.6 | Peptidyl-prolyl
cis-trans isomerase C |
| NOP14 | 0.6 | Nucleolar protein
14 |
| CLIC1 | 0.6 | Chloride
intracellular channel protein 1 |
| PFDN6 | 0.6 | Prefoldin subunit
6 |
| HNRNPR | 0.6 | Heterogeneous
nuclear ribonucleoprotein R |
| RABGGTB | 0.6 | Geranylgeranyl
transferase type-2 subunit beta |
| JMJD6 | 0.6 | Bifunctional
arginine demethylase and lysyl-hydroxylase JMJD6 |
| RPP30 | 0.6 | Ribonuclease P
protein subunit p30; Isoform 2 of Ribonuclease P protein subunit
p30 |
| MRPL57 | 0.6 | Ribosomal protein
63, mitochondrial |
| COIL | 0.6 | Coilin |
| CRBN | 0.6 | Protein cereblon;
Isoform 2 of Protein cereblon |
| SAMM50 | 0.5 | Sorting and
assembly machinery component 50 homolog |
| CHRAC1 | 0.5 | Chromatin
accessibility complex protein 1 |
| CCDC175 | 0.5 | Coiled-coil
domain-containing protein 175 |
| NEDD8 | 0.5 | NEDD8 Ubiquitin
Like Modifier |
| LAMTOR1 | 0.5 | Regulator complex
protein LAMTOR1 |
| TOP2B | 0.5 | DNA topoisomerase
2-β; Isoform β-1 of DNA topoisomerase 2-β |
| MTIF2 | 0.5 | Translation
initiation factor IF-2, mitochondrial |
| SEMA4C | 0.5 | Semaphorin-4C |
| ZNF687 | 0.5 | Zinc finger protein
687; Isoform 2 of Zinc finger protein 687 |
| DERA | 0.5 |
Deoxyribose-phosphate aldolase |
| CNOT3 | 0.5 | CCR4-NOT
transcription complex subunit 3 |
| DEGS1 | 0.5 | Sphingolipid
delta(4)-desaturase DES1 |
| ENOPH1 | 0.5 | Enolase-phosphatase
E1 |
| GOLM1 | 0.5 | Golgi membrane
protein 1; Isoform 2 of Golgi membrane protein 1 |
| RPL7L1 | 0.5 | 60S ribosomal
protein L7-like 1 |
| LAMTOR5 | 0.5 | Regulator complex
protein LAMTOR5 |
| GID8 | 0.4 | Glucose-induced
degradation protein 8 homolog |
| WDR3 | 0.4 | WD
repeat-containing protein 3 |
| CBX1 | 0.4 | Chromobox protein
homolog 1 |
| TPM1 | 0.4 | Isoform 10 of
Tropomyosin alpha-1 chain; Isoform 4 of Tropomyosin alpha-1
chain |
| GSKIP | 0.4 | GSK3-beta
interaction protein |
| RNPS1 | 0.4 | RNA-binding protein
with serine-rich domain 1 |
| UBQLN2 | 0.4 | Ubiquilin-2 |
| GPRC5A | 0.4 | Retinoic
acid-induced protein 3 |
| APOD | 0.4 | Apolipoprotein
D |
| TAF10 | 0.4 | Transcription
initiation factor TFIID subunit 10 |
| EIF1 | 0.4 | Eukaryotic
translation initiation factor 1 |
| GSTM2 | 0.4 | Glutathione
S-transferase Mu 2; Isoform 2 of Glutathione S-transferase Mu
2 |
| AASDHPPT | 0.4 |
L-aminoadipate-semialdehyde
dehydrogenase-phosphopantetheinyl transferase |
| NUP62 | 0.4 | Nuclear pore
glycoprotein p62 |
| NDUFAB1 | 0.4 | Acyl carrier
protein, mitochondrial |
| ESYT2 | 0.4 | Isoform 6 of
Extended synaptotagmin-2 |
| ARL1 | 0.4 | ADP-ribosylation
factor-like protein 1; Isoform 2 of ADP-ribosylation factor-like
protein 1 |
| ESYT1 | 0.3 | Isoform 2 of
Extended synaptotagmin-1 |
| LMBR1L | 0.3 | Protein LMBR1L |
| TAMM41 | 0.3 | Phosphatidate
cytidylyltransferase, mitochondrial |
| L3HYPDH | 0.3 |
Trans-L-3-hydroxyproline dehydratase |
| HAS1 | 0.3 | Hyaluronan synthase
1 |
| DAAM1 | 0.3 |
Disheveled-associated activator of
morphogenesis 1 |
| NECAB1 | 0.3 | N-terminal EF-hand
calcium-binding protein 1 |
| GTF2A1 | 0.2 | Transcription
initiation factor IIA subunit 1 |
| TMEM128 | 0.2 | Transmembrane
protein 128 |
| AURKA | 0.2 | Aurora kinase
A |
| MT-ND2 | 0.2 | NADH-ubiquinone
oxidoreductase chain 2 |
| C1QBP | 0.2 | Complement
component 1 Q subcomponent-binding protein, mitochondrial |
| TAGLN3 | 0.1 | Transgelin-3 |
| VTN | 0.1 | Vitronectin |
| ABRACL | 0.1 | Costars family
protein ABRACL |
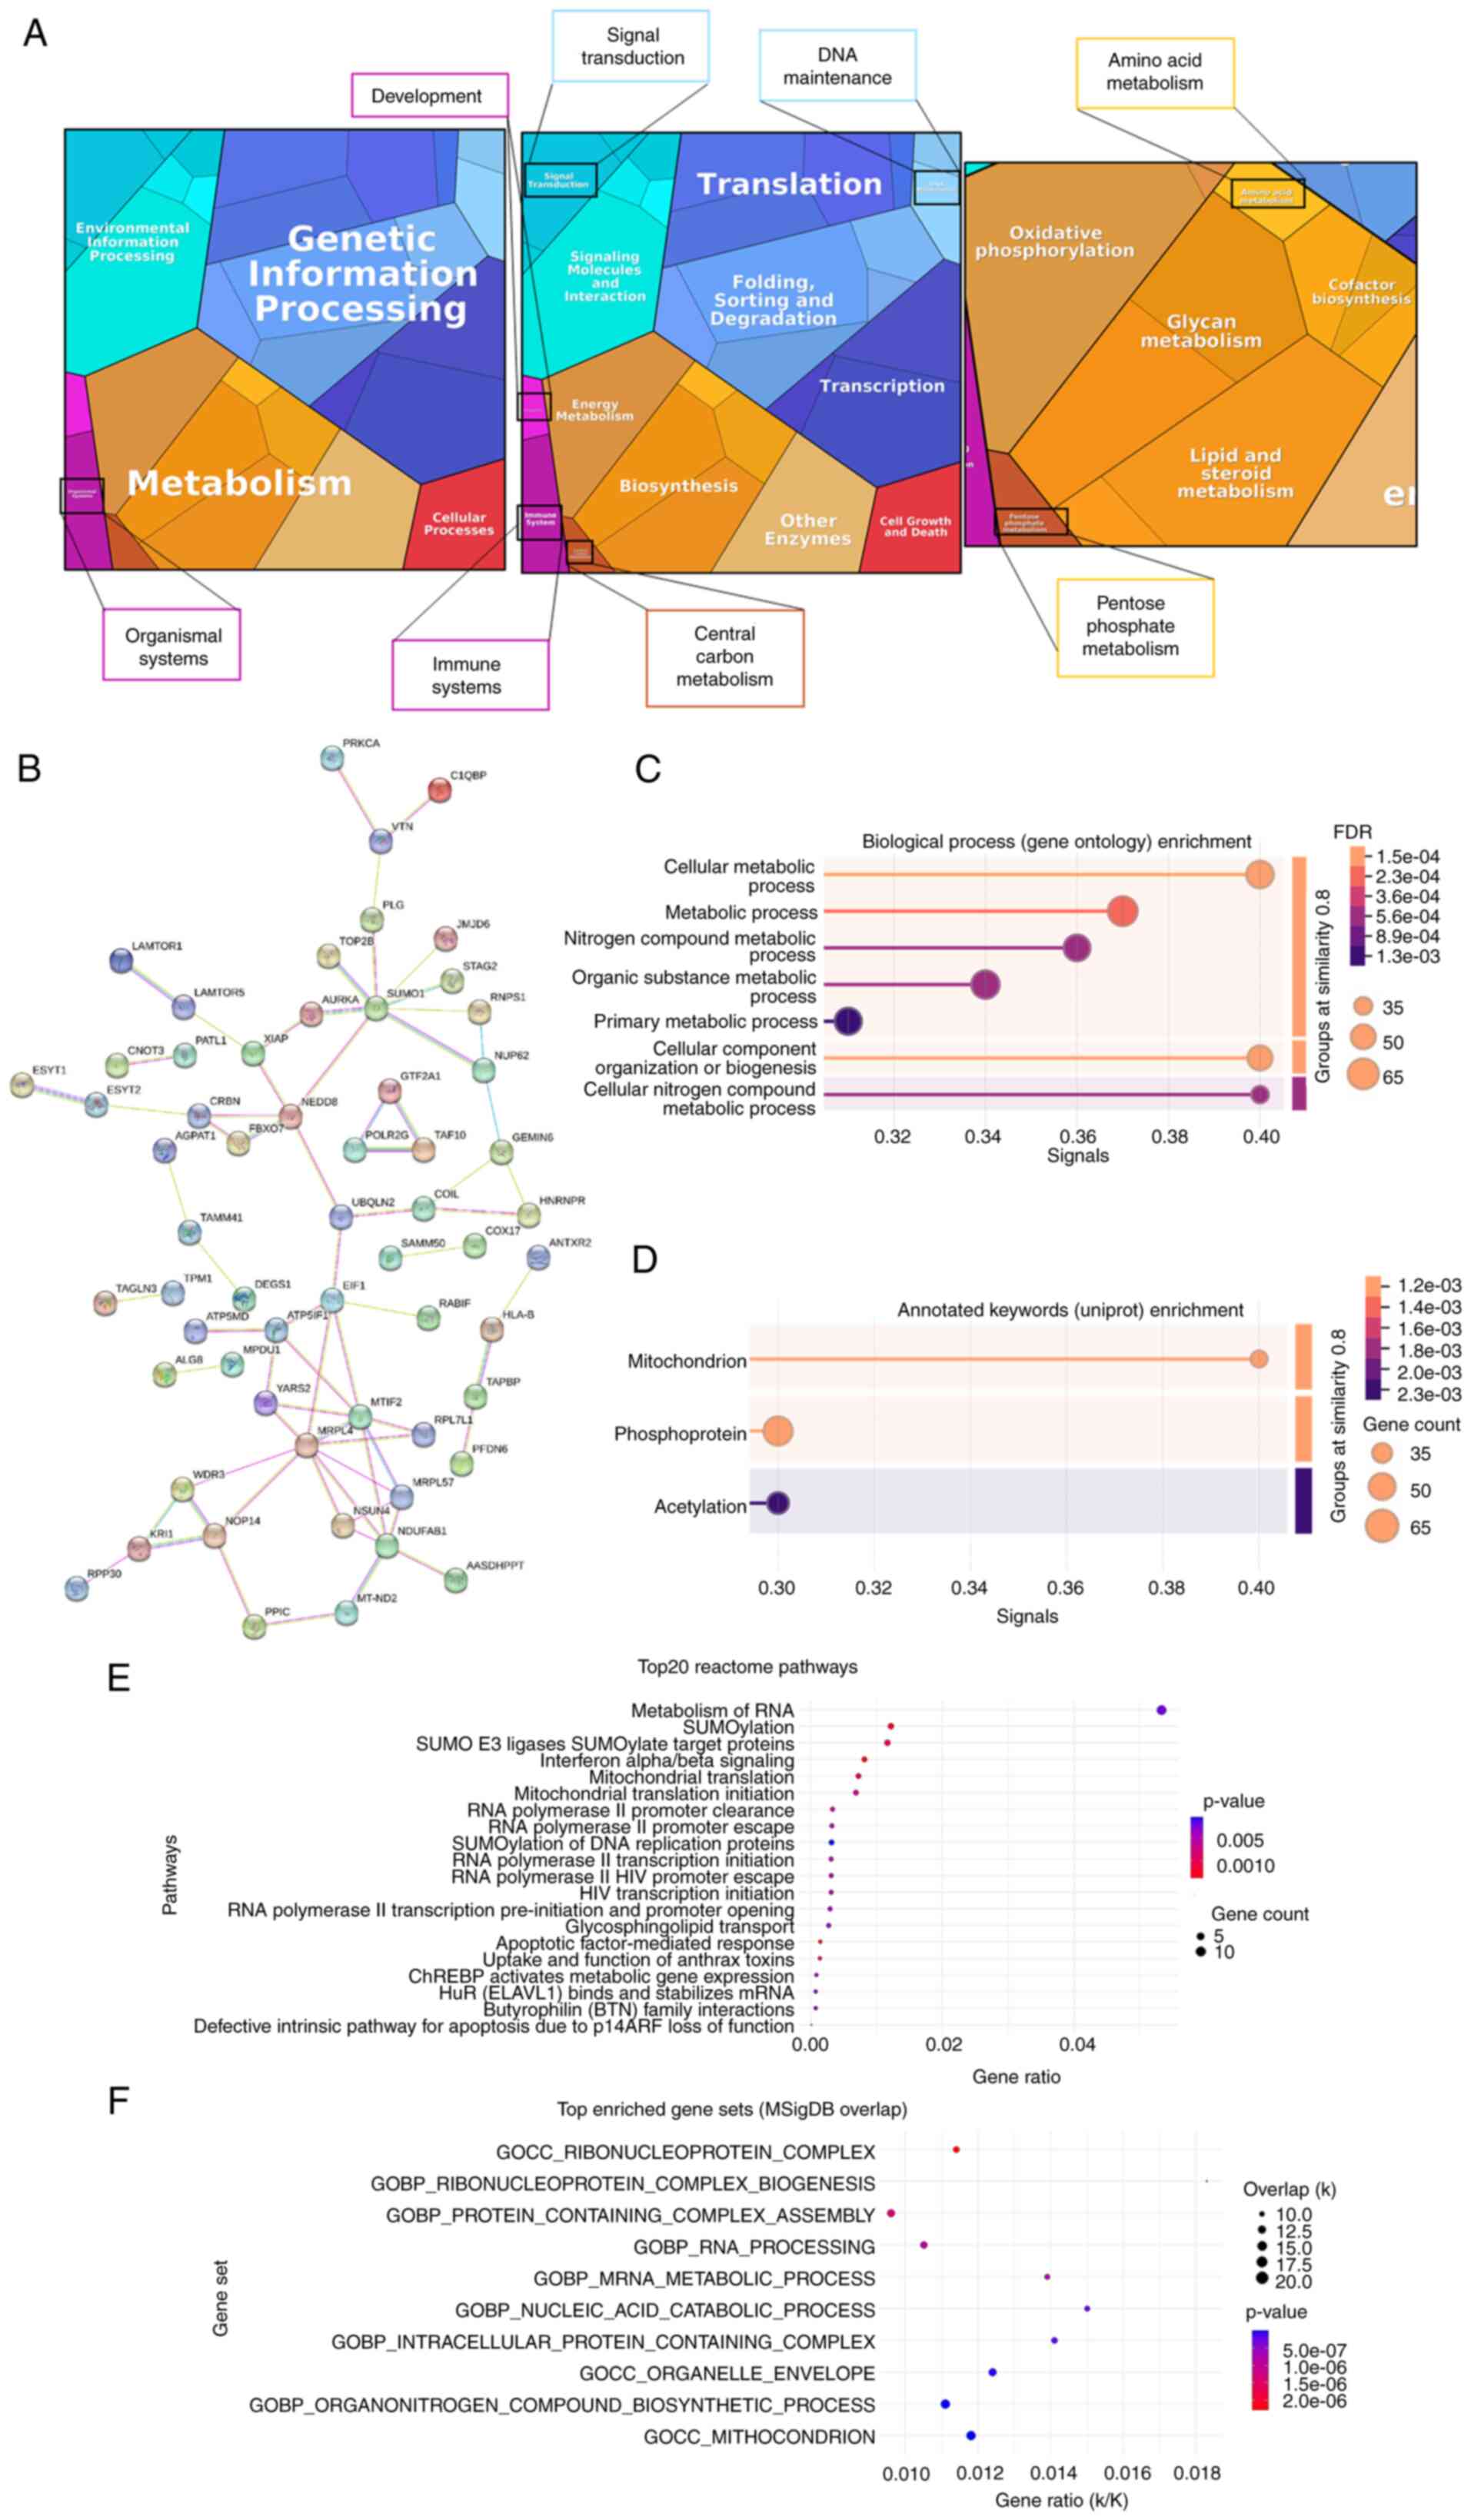
To investigate the biological significance of the 98
de-regulated proteins revealed by proteomic analysis, the proteome
of 3T3-L1A EV-treated MCF-7 cells was summarized into a proteomap
(29) (https://www.proteomaps.net), wherein each protein is
represented by a polygon which size is proportional to the
protein's abundance. Taking into account the protein fold
regulation, the present study gathered functional information
clustered in five categories: Genetic information processing
(blue), metabolism (orange), environmental information processing
(cyan), cellular processes (red) and organismal systems (pink)
(Fig. 3A). At the broadest level,
most proteins identified in EV-treated MCF-7 cells have been
assigned to the following biological processes: Genetic information
processing and metabolism, especially in terms of biosynthesis and
energy metabolism. In the category of metabolism, the de-regulated
proteins were involved into the oxidative phosphorylation,
lipid/steroid metabolism, glycan metabolism, cofactor biosynthesis,
amino acid metabolisms and pentose phosphate metabolism (Fig. 3A). The interactions of the 98
de-regulated proteins identified by proteomic analysis were
analyzed using the STRING software (https://string-db.org/cgi/input?sessionId=bAzNH23SoAwP&input_page_show_search=on).
The established network shown in Fig.
3B contained 98 nodes and MRLP4, MTIF2 and
NDUFAB1 had more degree of connection. Subsequently, a
functional enrichment analysis was conducted, which corroborated
the aforementioned findings. The 98 de-regulated proteins were
found to be involved in metabolic processes and in mitochondria. In
particular, cellular metabolic process (58 proteins; FDR: 0.0015),
cellular component organization or biogenesis (52 proteins; FDR
0.0018), cellular nitrogen compound metabolic process (37 proteins;
FDR 0.0046) and metabolic process (64 proteins; FDR 0.0021) were
among the first five biological processes (Fig. 3C). In addition, mitochondrion (18
proteins; FDR 0.0124) was the top subcellular localization
(Fig. 3D). In the Reactome
Pathway analysis (https://reactome.org/), the present study found
'Metabolism of RNA', 'SUMOylation', 'SUMO E3 ligases SUMOylate
target proteins', 'Interferon alpha/beta signaling', 'Mitochondrial
translation' and 'Mitochondrial translation initiation' among the
top five enrichment pathways ranked by P-value (Fig. 3E). Moreover, among the cellular
component GOs, 'mitochondrion' resulted the top enriched GO in the
Molecular Signatures Database analysis (MSigDB; https://www.gsea-msigdb.org/gsea/msigdb/; Fig. 3F), in term of overlap and P-value.
In order to conduct a more thorough investigation into the function
of the 98 de-regulated proteins identified in MCF-7 cells treated
with 3T3-L1A-EVs, the present study also conducted an evaluation of
their potential association with other GOs, including 'ATP
biosynthetic process', 'ADP metabolic process', 'response to
hypoxia' and 'glycolytic process'. No relevant associations were
found, except for NADH-ubiquinone oxidoreductase chain 2, which
showed an association with 'ATP biosynthetic process' and 'response
to hypoxia' and for Acyl carrier protein, mitochondrial, which was
associated with 'ATP biosynthetic process' (data not shown).
The present study also used FunRich (http://www.funrich.org) platform to obtain GO
enrichments of the all de-regulated proteins. According to the
cellular component, the de-regulated proteins were clustered in
'mitochondrion' (21.2%), in 'nucleolus' (17.6%) and in 'cytoplasm'
(52.9%; Fig. S3A). In the
context of 'biological process', the investigated proteins were
markedly enriched in GOs such as 'protein modification' (2.1%),
'anti-apoptosis' (2.1%), 'lipid metabolism' (2.1%) and protein
metabolism' (13.4%; Fig. S3B).
Moreover, among the GO 'molecular functions' the de-regulated
proteins were mainly related to 'chaperone activity' (4.1%), a
family of proteins known to be regulators of metabolic processes
(30) (Fig. S3C).
Therefore, the present study sought to ascertain
whether 3T3-L1A-EVs might exert an influence on metabolism in BC
cells.
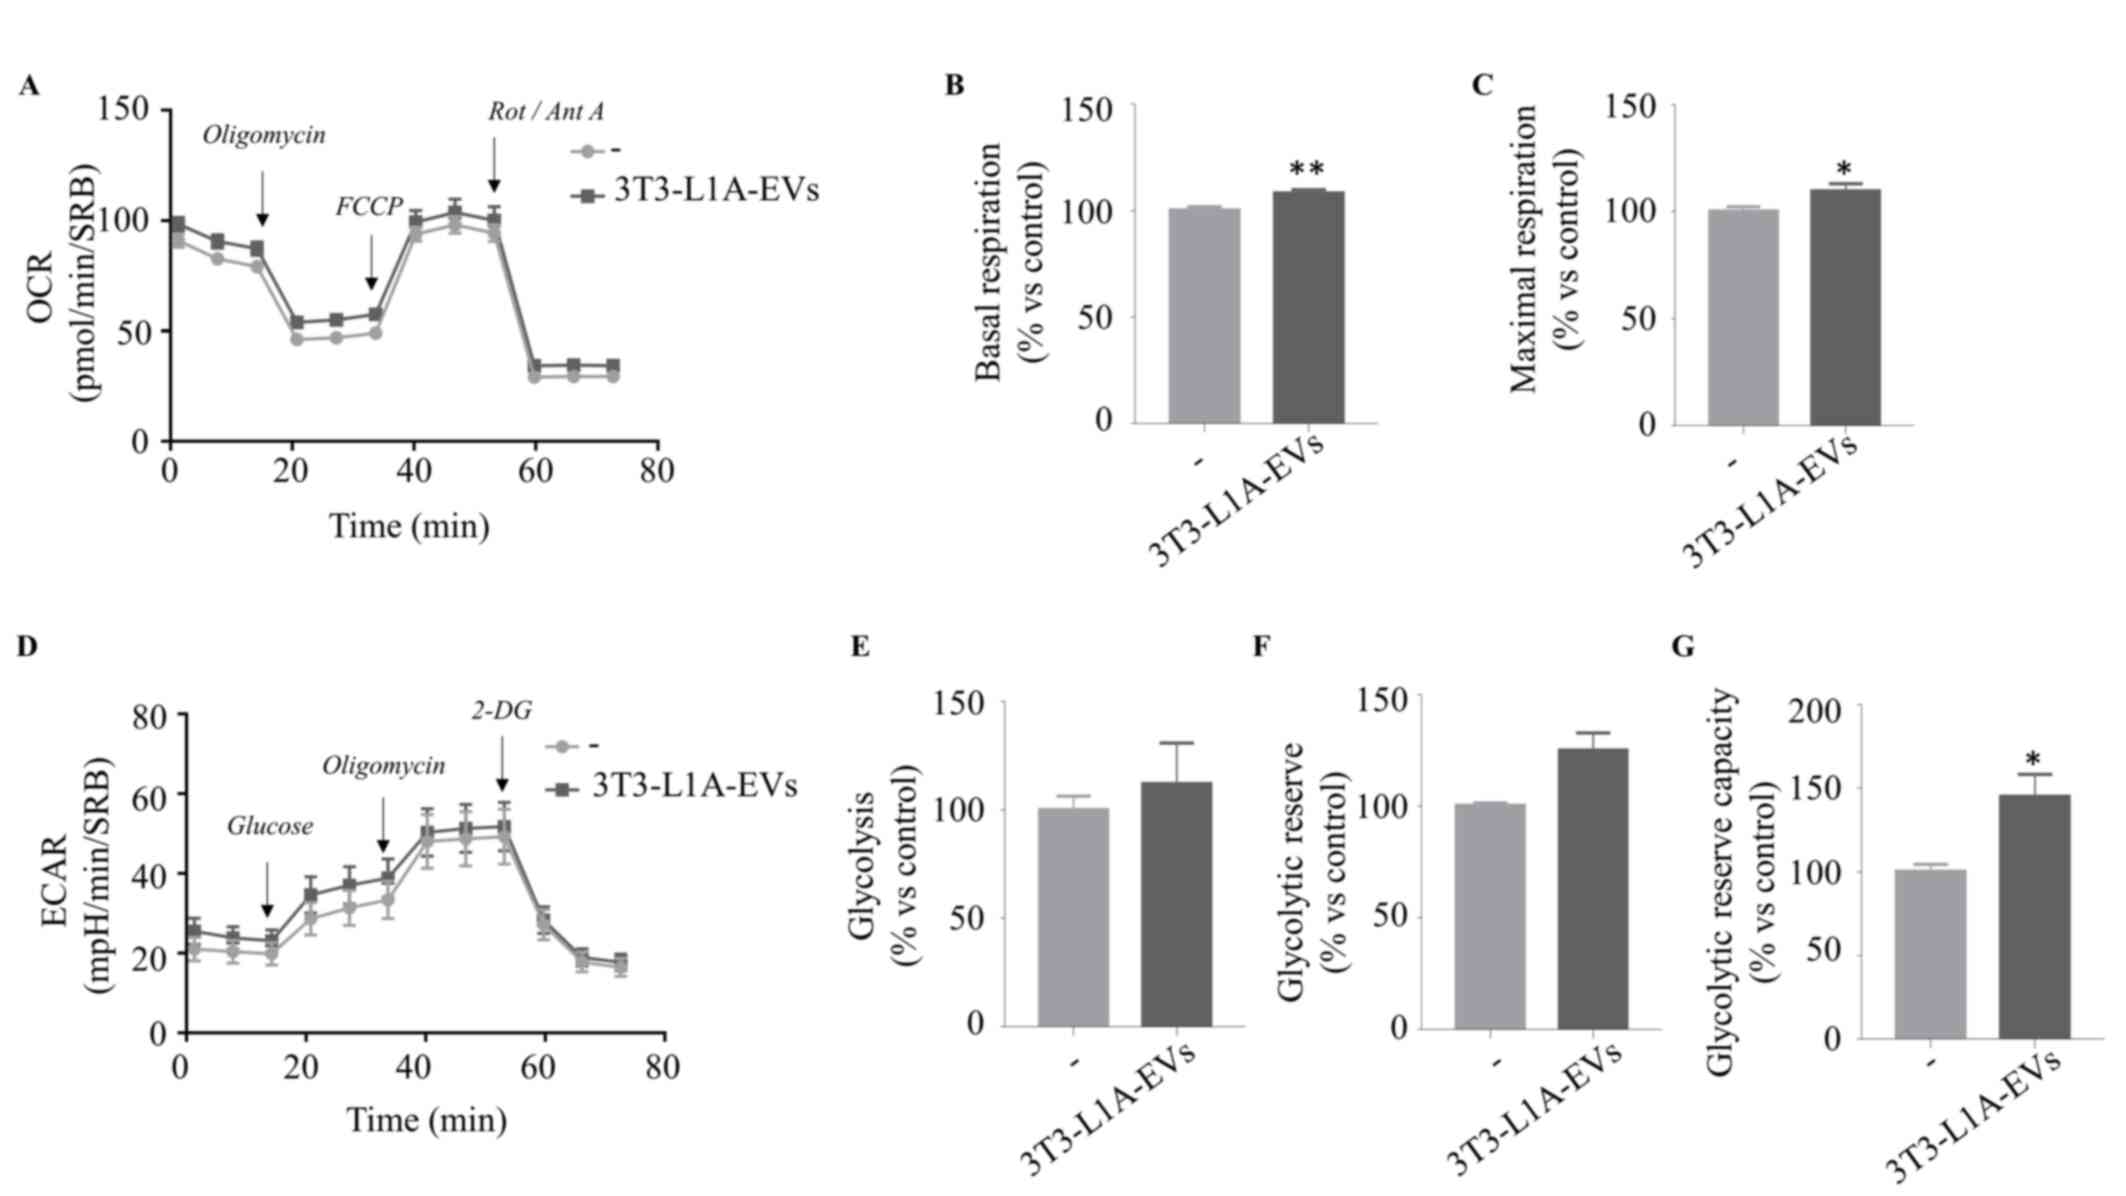
3T3-L1A-EVs support oxidative
phosphorylation of ER-positive BC cells
In order to validate the hypothesis that EVs
isolated from 3T3-L1 adipocytes can affect the metabolism of BC
cells, the present study investigated possible changes in the OCR
and the ECAR by using the Seahorse Extracellular Flux (XFe96)
Analyzer. OCR is a well-established indicator of mitochondrial
respiration rate because oxygen consumption by respiration is a
fundamental function of the mitochondria, mainly used in the
process of ATP production. Thus, the present study performed Mito
Stress Test that measures OCR levels in real time by sequential
injections of oligomycin, an inhibitor of ATP synthase (complex V),
carbonyl cyanide p-trifluoromethoxyphenylhydrazone (FCCP), an
uncoupling molecule that disrupts the mitochondrial membrane
potential and a mixture of rotenone and antimycin A, inhibitors of
complex I and III, respectively (Fig.
4A). 3T3-L1A-EVs markedly increased basal (Fig. 4B) and maximal respiration
(Fig. 4C) of MCF-7 cells compared
with the control group. Meanwhile, by sequentially injecting a
saturating concentration of glucose, oligomycin and 2-DG, an
analogue of the glucose that inhibits glycolysis, ECAR, the release
of protons into the extracellular milieu generated by anaerobic
glycolysis, was estimated (Fig.
4D). The data showed that 3T3-L1A-EV treatment did not affect
glycolysis (Fig. 4E) or
glycolytic reserve (Fig. 4F), but
they markedly increased the glycolytic reserve capacity (Fig. 4G), which is the difference between
glycolytic capacity and glycolysis rate. It is noteworthy that the
glycolytic reserve is indicative of the capacity of cells to
enhance ATP production via glycolysis in response to stress or
other physiologically demanding circumstances. It was found that
pre-adipocyte-derived EVs (3T3-L1-EVs) had no detectable effects on
mitochondrial activity in MCF-7 cells (Fig. S4), further confirming previous
data that 3T3-L1-EVs failed to promote malignant features in BC
cells (20) and supporting the
notion that functional changes in tumor cells are specifically
driven by EVs from differentiated adipocytes.
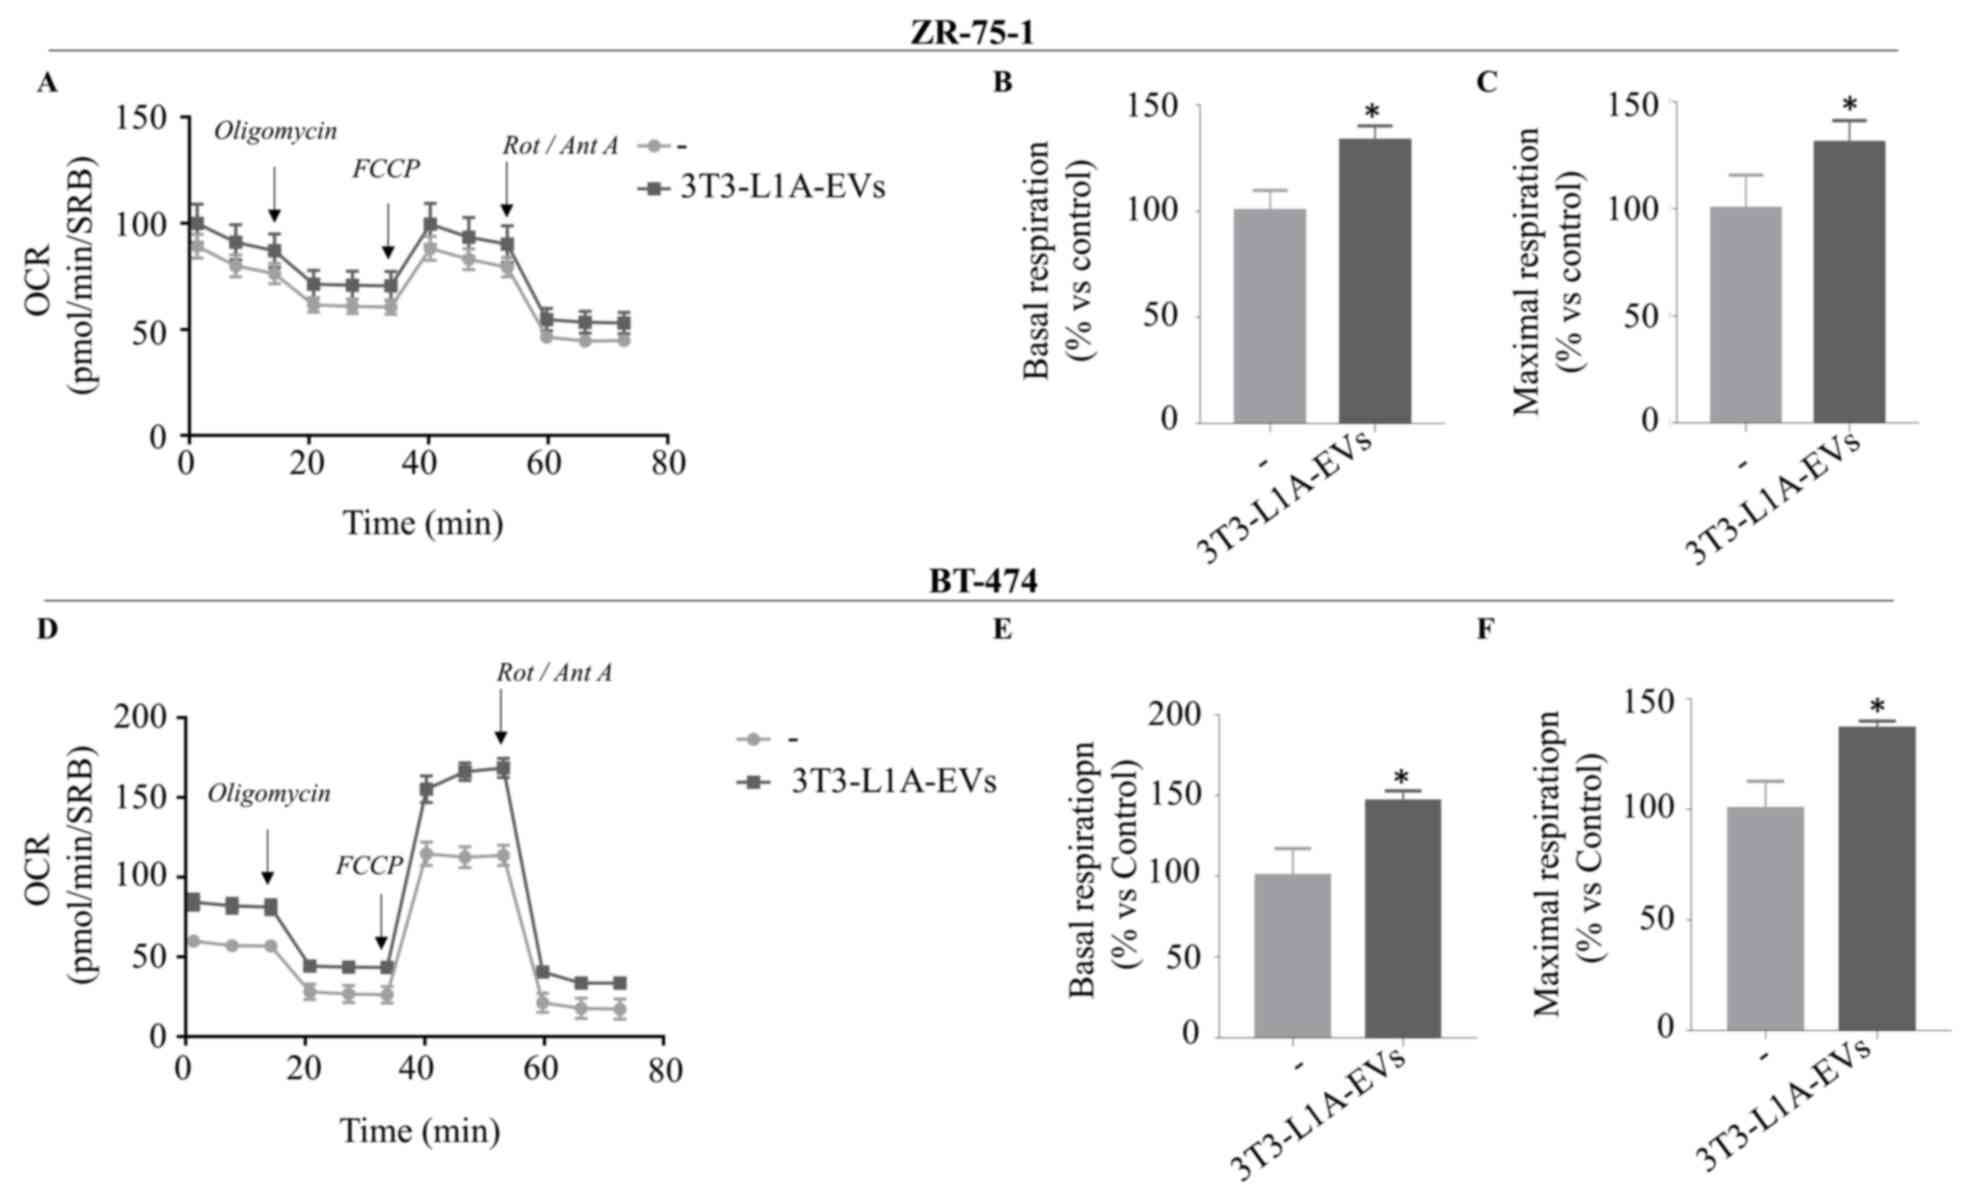
To further support these findings, we also used two
additional ER+ BC cell lines as ZR-75-1 (Fig. 5A-C) and BT-474 (Fig. 5D-F) and found that 3T3-L1A-EVs
affected mitochondrial respiration of both experimental models.
Therefore, EVs isolated from mature adipocytes may promote the
mitochondrial metabolism of BC cells, leading to an increase in
energy production in different cellular background.
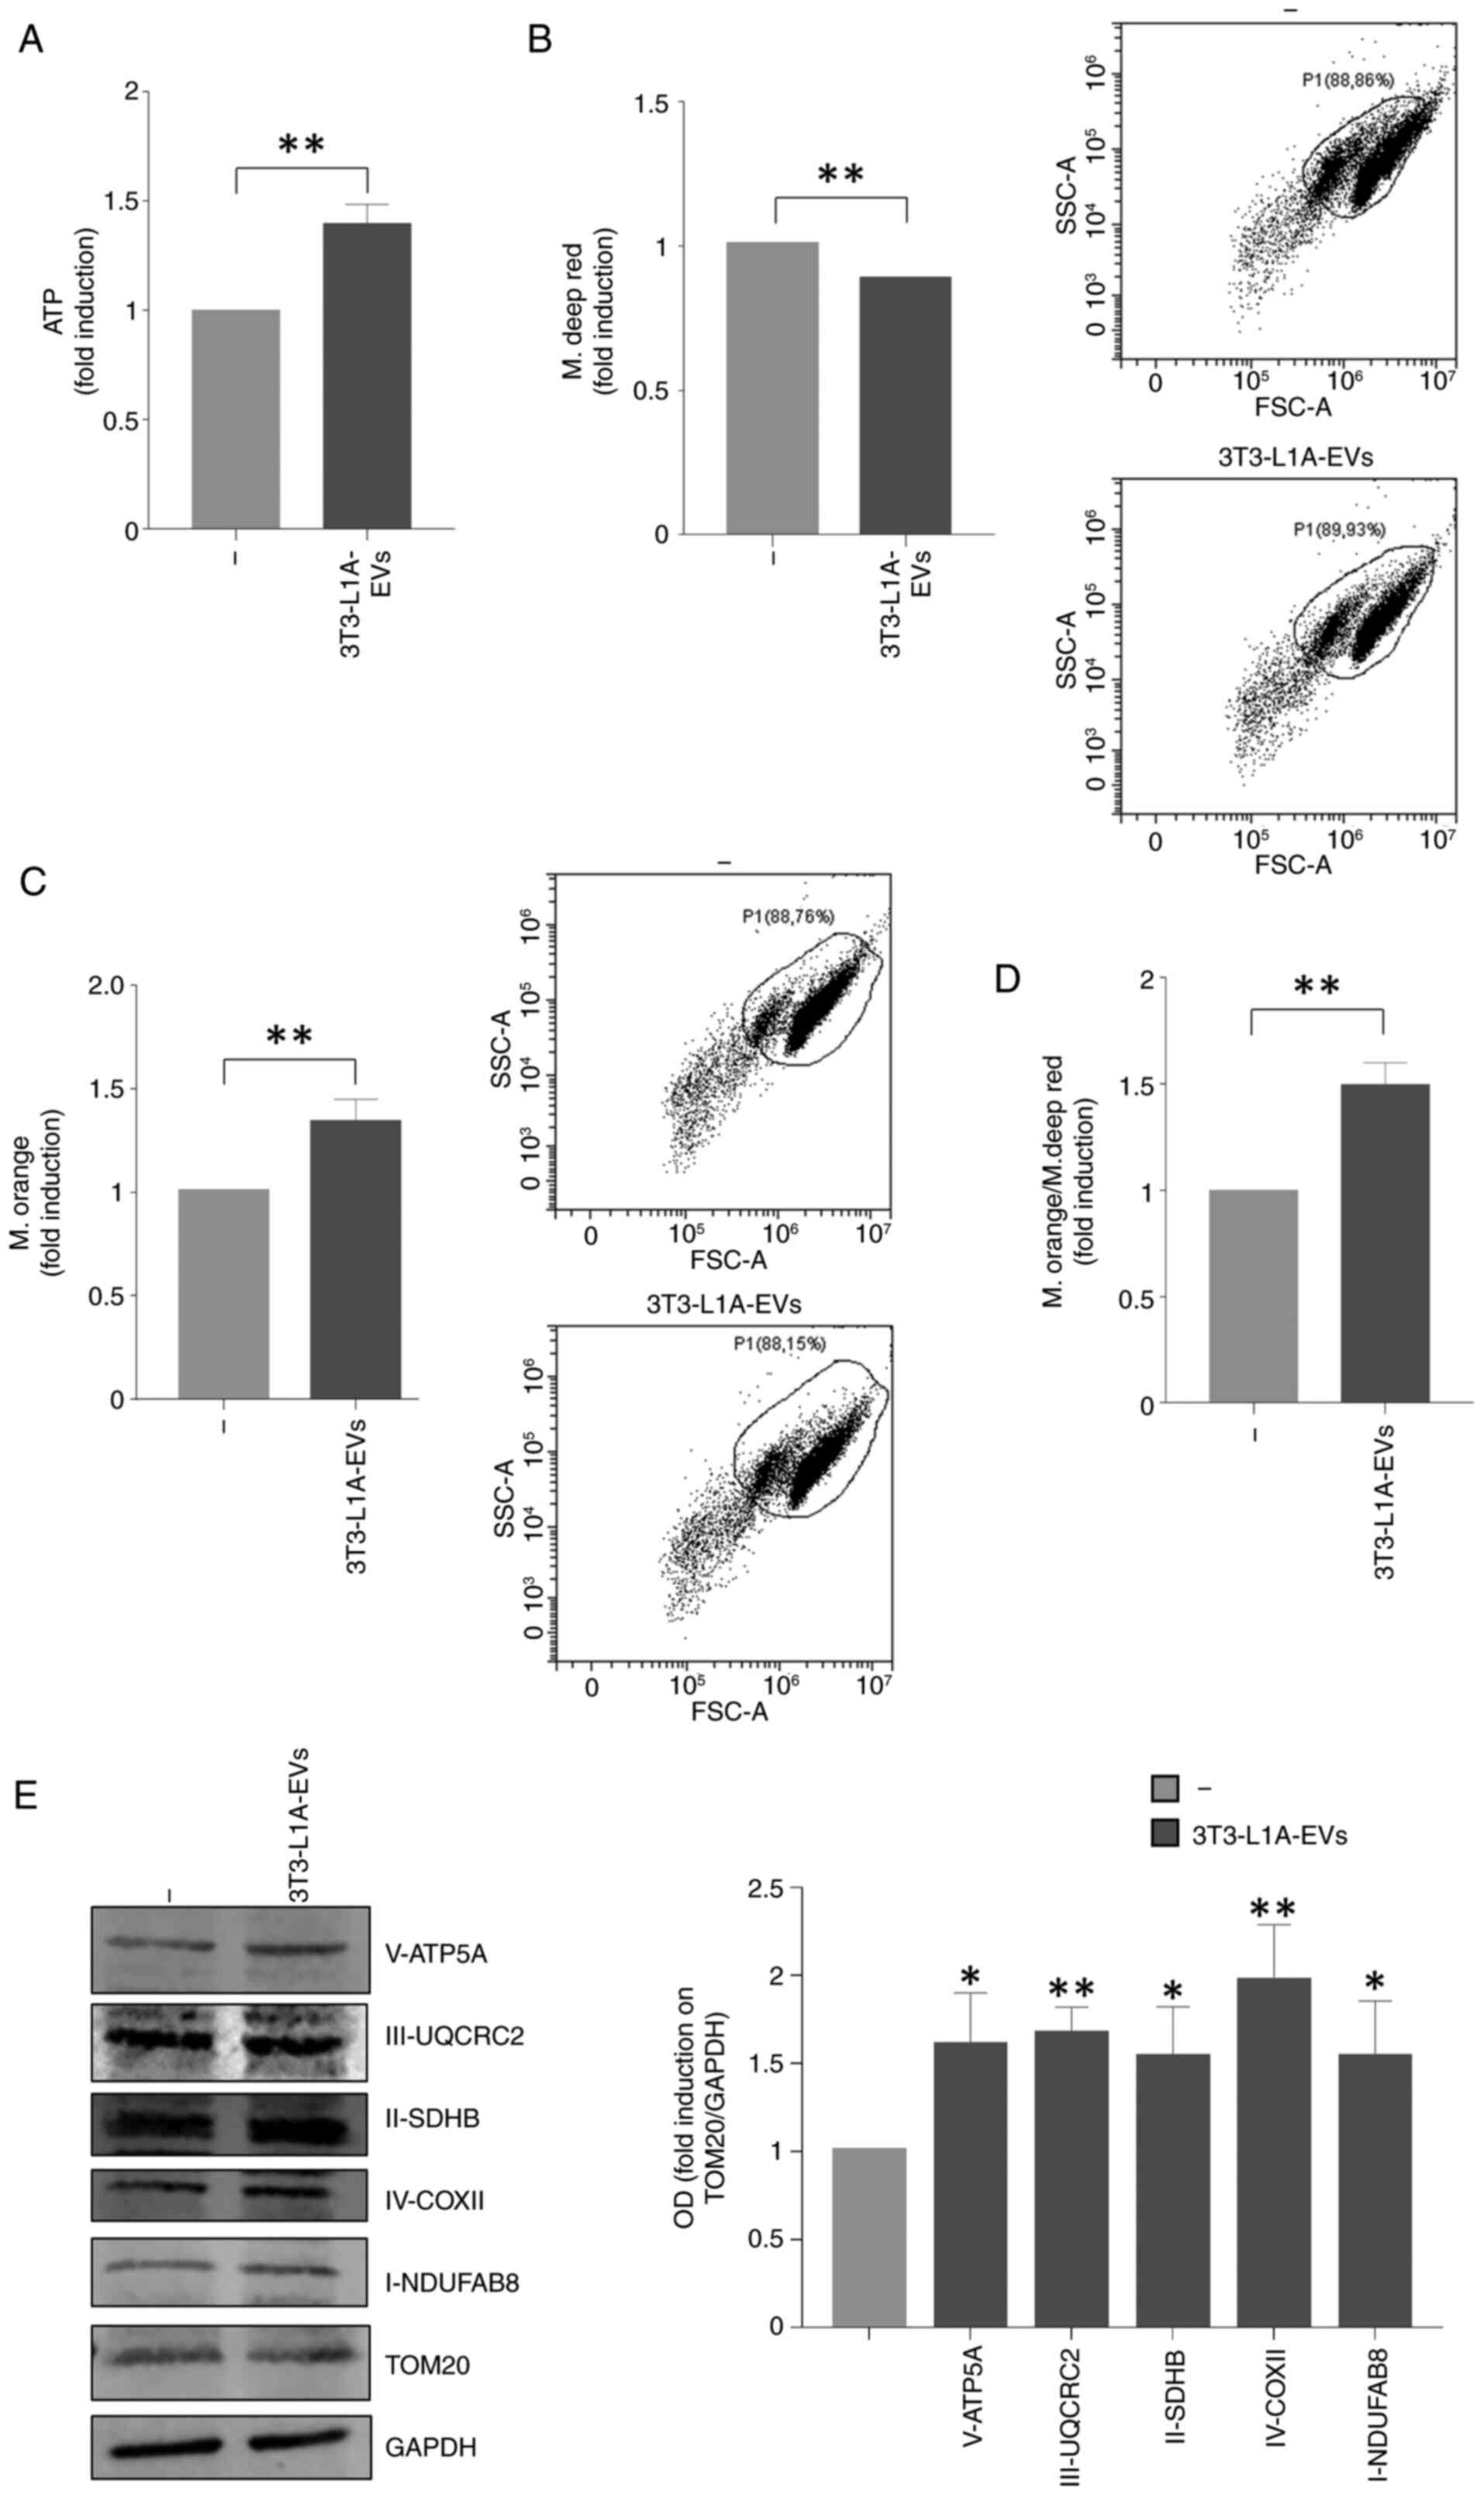
As it is widely known that ATP production through
oxidative phosphorylation is markedly greater than that produced by
glycolysis alone, the present study also investigated the ATP
amounts in BC cells treated with 3T3-L1A-EVs. Notably, 3T3-L1A-EVs
enhanced the ATP production in MCF-7 BC cells (Fig. 6A). Furthermore, the present study
investigated the mitochondrial phenotype of MCF-7 cells treated
with 3T3-L1A-EVs employing FACS analysis by using two different
dyes able to discriminate mitochondrial mass (MitoTracker Deep Red)
and mitochondrial membrane potential (MitoTracker Orange). There
was a slight reduction of mitochondrial mass along with a
significant increase in mitochondrial membrane potential in MCF-7
cells treated with 3T3-L1A-EVs compared with the control group
(Fig. 6B and C). Consequently,
the ratio of mitochondrial membrane potential/mitochondrial mass
confirmed elevated mitochondrial activity in MCF-7 EVs-treated
cells compared with the control group (Fig. 6D). In addition, an increase in
mitochondrial markers from Complexes I to V was observed in
EV-treated MCF-7 cells compared to control (Fig. 6E).
The aforementioned events confirmed the role of
3T3-L1A-EVs in regulating cell energy production by sustaining
mitochondrial function in BC cells.
HIF-1α is a potential mediator of the
effects of 3T3-L1A-EVs on BC cell metabolism
We have previously demonstrated that HIF-1α plays a
role in mediating the effects of 3T3-L1A-EVs on BC cell biology
(20). Indeed, treatment of BC
cells with 3T3-L1A EVs resulted in increased mRNA and protein
expression of HIF-1α as well as in an upregulation of well-known
HIF-1α target genes (such as VEGF, Ob, MMP-2,
MMP-9 and SERPINE1). Accordingly, inhibition of
HIF-1α activity using KC7F2, able to downregulate HIF-1α protein
synthesis and its transcriptional activity, or using a specific
siHIF-1α, resulted in the reversal of the promoting effects of
3T3-L1A-EVs on BC cell motility, invasion and metastasis (20). In light of these findings, the
present study sought to investigate the potential involvement of
HIF-1α in mediating the metabolic effects of 3T3-L1-EVs. As a first
step, the specific HIF-1α inhibitor KC7F2 was used at 20 μM,
a concentration previously shown to be non-toxic both in
vitro and in vivo (20). It was found that the inhibition of
HIF-1α activity, using KC7F2, reversed the effects of 3T3-L1A-EVs
in increasing mitochondrial respiration in MCF-7 BC cells, which
exhibited levels comparable to those observed in the control group
(Fig. 7A-C). Data were confirmed
by knocking down HIF-1α expression in MCF-7 BC cells (Fig. 8A-D). Specifically, HIF-1α
silencing (Fig. 8A) counteracted
3T3-L1A-EV-mediated effect on basal (Fig. 8C) and maximal (Fig. 8D) respiration. The aforementioned
data were further corroborated through an analysis of the ATP
levels conducted under the same experimental conditions.
Particularly, the specific blockade of HIF-1α activity (Fig. 7D and E) as well as its reduced
expression (Fig. 8E and F)
counteracted the ATP production and the mitochondrial activity
observed in MCF-7 cells when exposed to 3T3-L1A-EVs, further
supporting the potential involvement of HIF-1α in mediating the
effects of 3T3-L1A-EVs on BC cell metabolism.
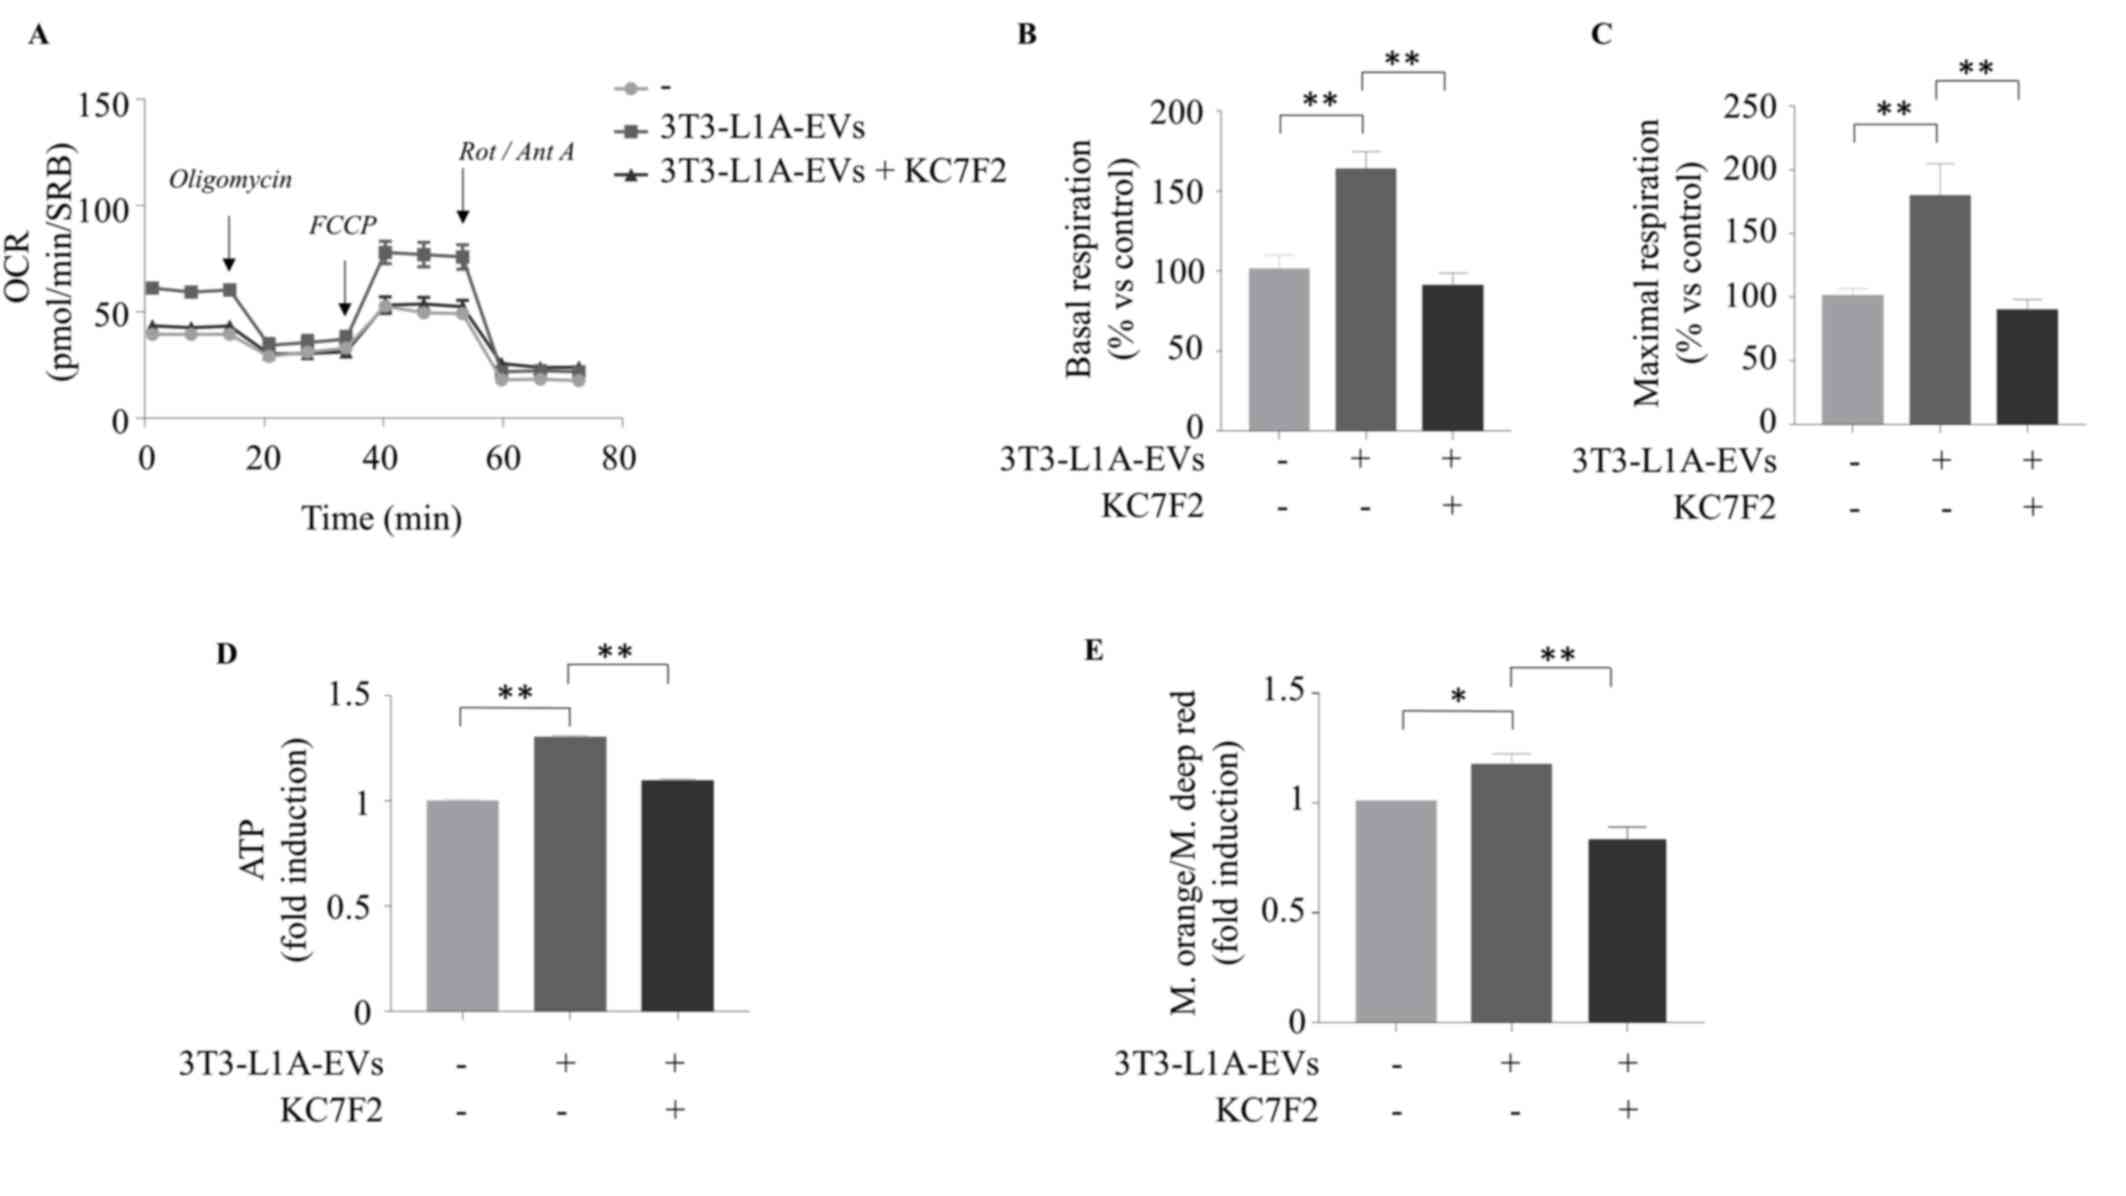 | Figure 7HIF-1α specific blockade inhibits
3T3L-1A-EV effects on cell metabolism and energy production. The
seahorse XF-e96 analyzer was used to assess the mitochondrial
metabolic profile of MCF-7 cells untreated (-) or treated with
3T3-L1A-EVs (2 μg/ml) for 48 h, in the presence or not of
HIF-1α specific inhibitor (KC7F2, 20 μM). (A) OCR flux and
histograms of different mitochondrial respiratory parameters (B)
basal and (C) maximal respiration. Data were analyzed using one-way
ANOVA with Tukey's multiple comparisons post hoc test and
represented as ± SEM of five biological replicates from three
independent experiments and normalized to protein content (SRB
assay). (D) ATP production; (E) ratio between mitochondrial
membrane potential and mitochondrial mass of MCF-7 cells untreated
(-) or treated with 3T3-L1A-EVs (2 μg/ml) for 48 h, in the
presence or not of HIF-1α specific inhibitor (KC7F2 20 μM).
Data were analyzed using one-way ANOVA with Tukey's multiple
comparisons post hoc test and represented as ± SD of three
biological replicates from three independent experiments.
*P≤0.05; **P≤0.01. 3T3-L1A, murine 3T3-L1
adipocytes; EVs, extracellular vesicles; OCR, oxygen consumption
rates; SRB, sulforhodamine B; FCCP, carbonyl cyanide
p-trifluoromethoxyphenylhydrazone; Rot, rotenone; Ant, Antimycin
A. |
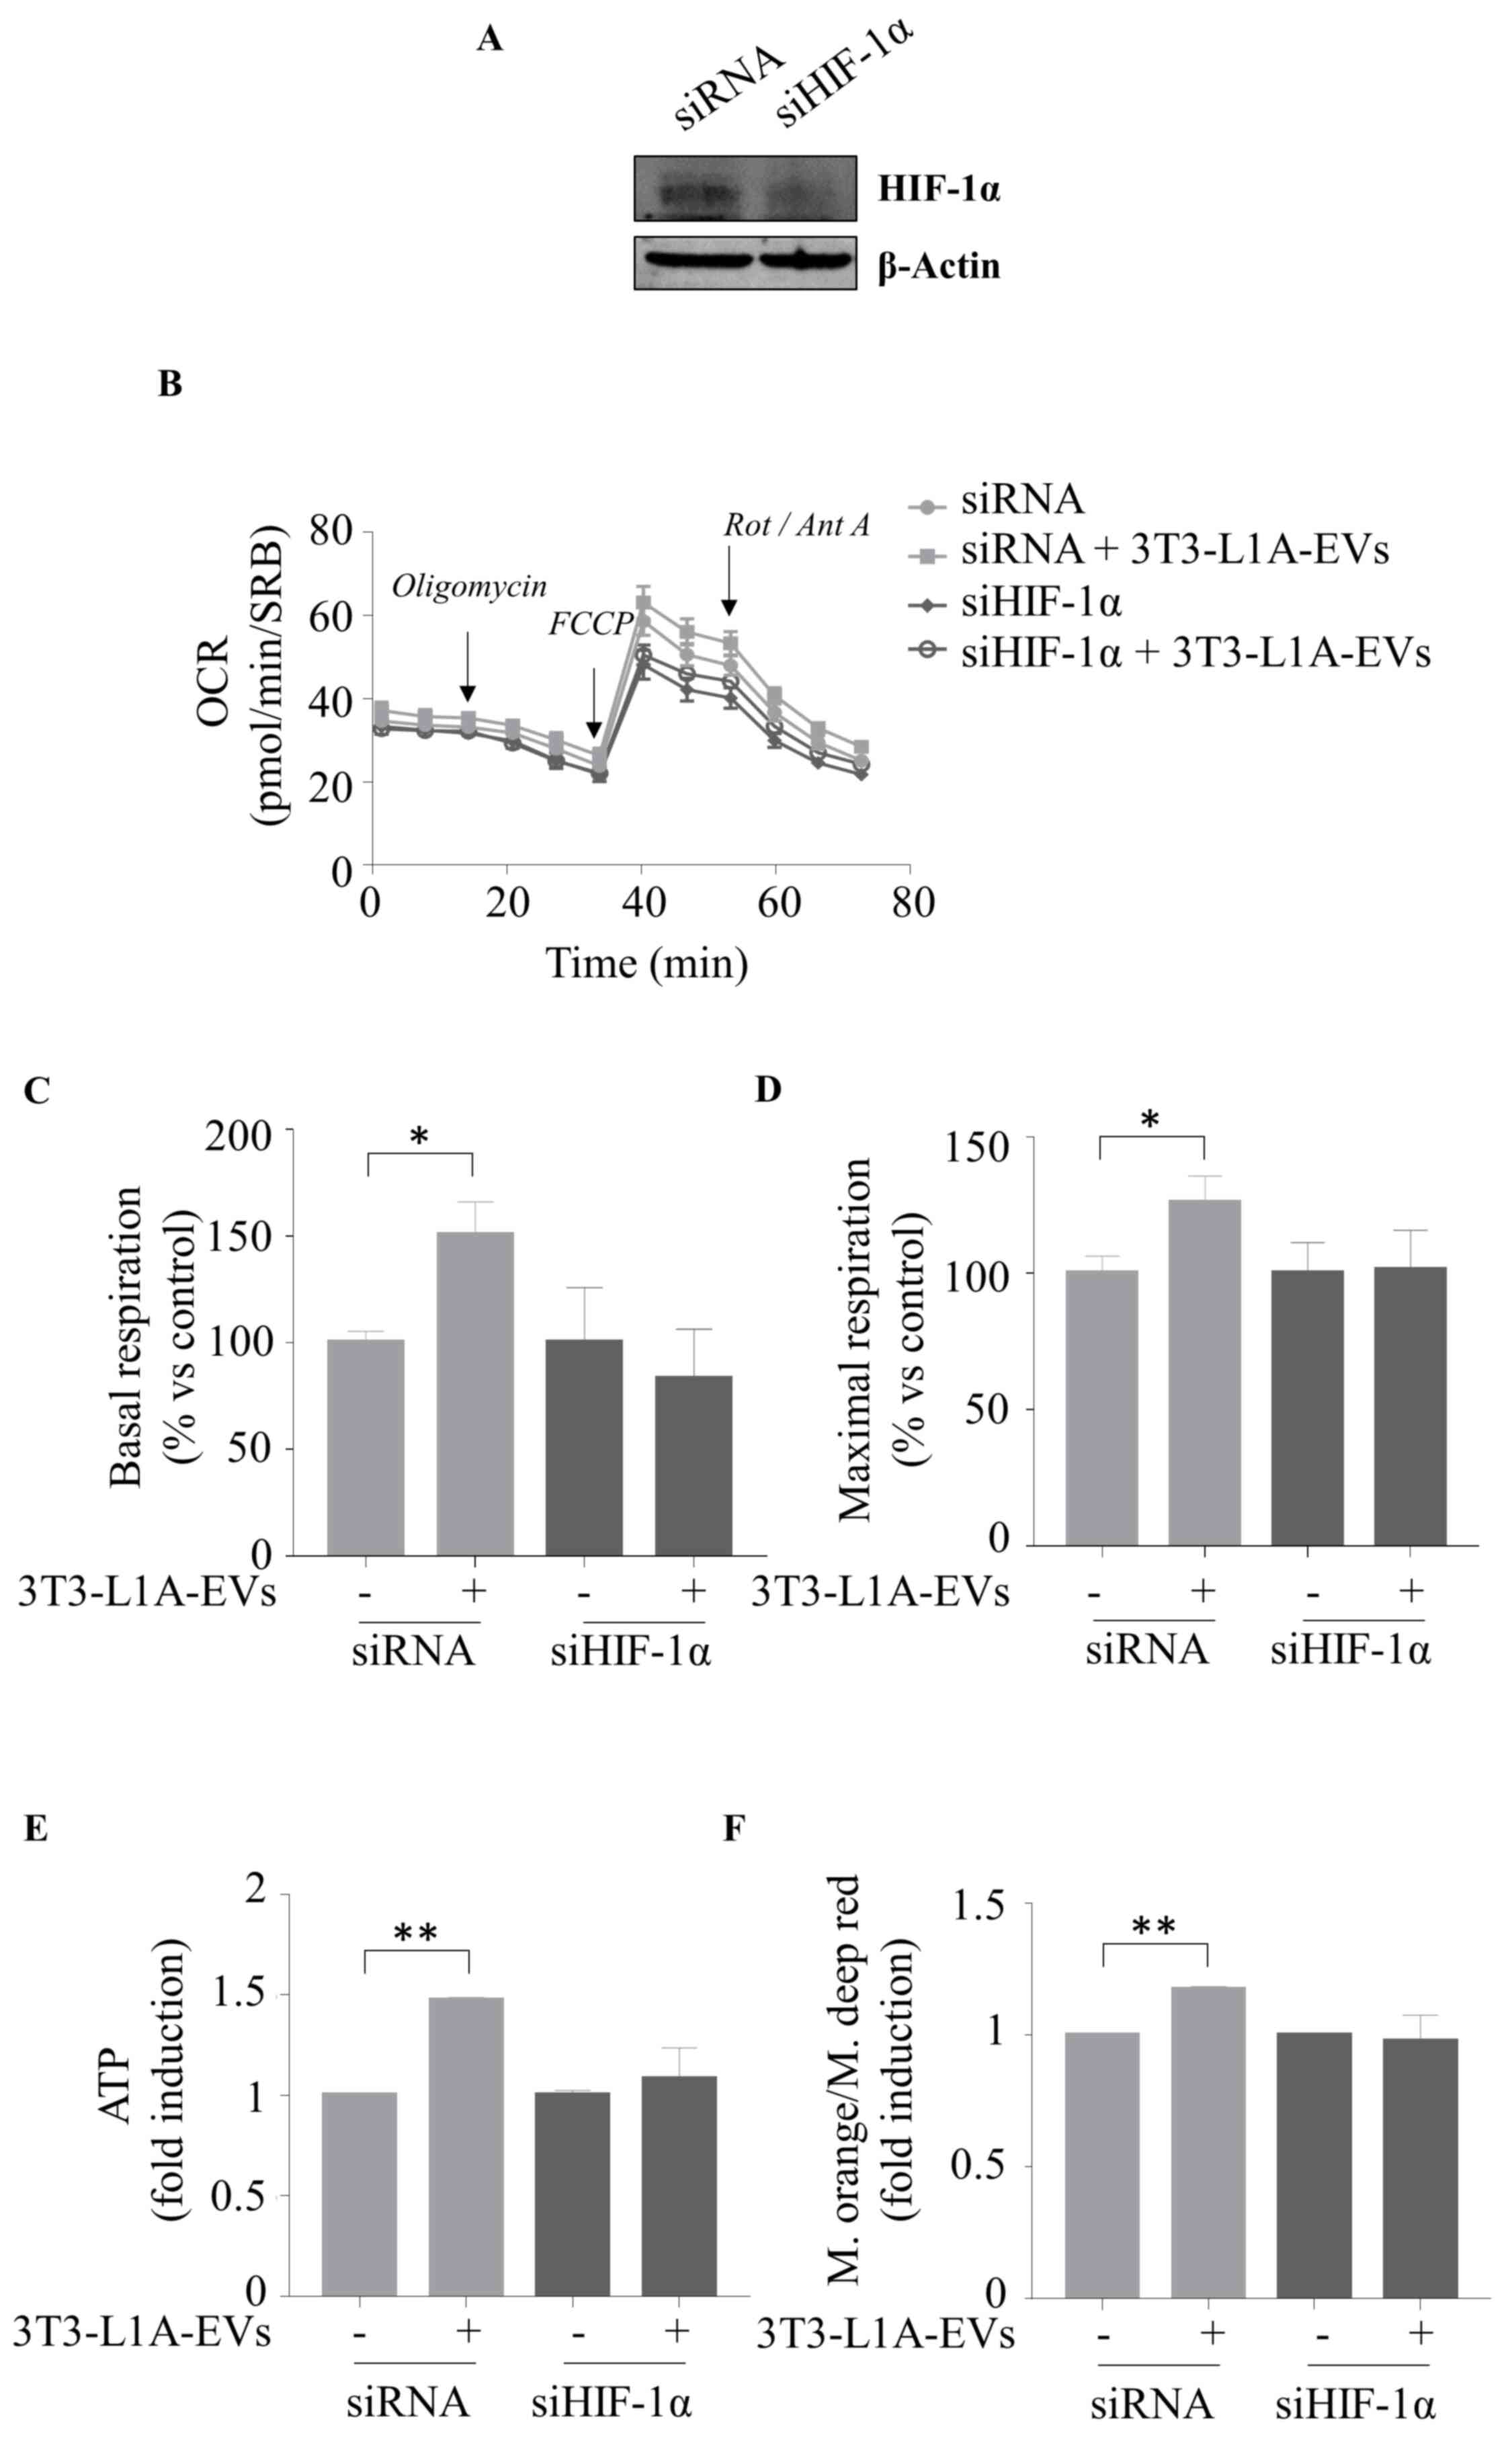 | Figure 8Silencing HIF-1α expression inhibits
3T3L-1A-EV effects on cell metabolism and energy production. (A)
Immunoblot analysis of HIF-1α in whole cell lysate of MCF-7 cells
transfected with negative control siRNA or siHIF-1α for 48 h.
β-Actin was used as a control of equal loading and transfer. The
seahorse XF-e96 analyzer was used to assess the mitochondrial
metabolic profile of MCF-7 cells untreated (-) or treated with
3T3-L1A-EVs (2 μg/ml) for 48 h, previously transfected for
48 h with either siRNA or with siHIF-1α. (B) OCR flux and
histograms of different mitochondrial respiratory parameters such
as (C) basal and (D) maximal respiration. Data were analyzed using
Student's t test and represented as ± SEM of five biological
replicates from two independent experiments and normalized to
protein content (SRB assay). (E) ATP production; (F) ratio between
mitochondrial membrane potential and mitochondrial mass of MCF-7
cells transfected for 48 h with either siRNA or with siHIF-1α and
then untreated (-) or treated with 3T3-L1A-EVs (2 μg/ml) for
48 h. Data were analyzed using Student's t test and represented as
± SD of three biological replicates from two independent
experiments. *P≤0.05; **P≤0.01. HIF-1α,
hypoxia inducible factor-1α; 3T3-L1A, murine 3T3-L1 adipocytes;
EVs, extracellular vesicles; si, small interfering; OCR, oxygen
consumption rates; SRB, sulforhodamine B; FCCP, carbonyl cyanide
p-trifluoromethoxyphenylhydrazone; Rot, rotenone; Ant, Antimycin
A. |
EVs isolated from serum of obese patients
with BC promote mitochondrial metabolism and energy production in
MCF-7 cells via HIF-1α
Finally, in order to reproduce the findings within
the context of obesity, the present study used EVs that had been
isolated from the serum of NW and OW/Ob patients with BC and
characterized by TEM, NTA and immunoblotting as shown in Fig. S2D-F. It was found that EVs
derived from OW/Ob patients increased the basal and maximal
respiration of MCF-7 cells compared with the BC cells treated with
NW-EVs (Fig. 9A-C). Accordingly,
the OW/Ob-EVs enhanced the ATP production in BC cells (Fig. 9D). Of note, the HIF-1α inhibitor
KC7F2 abrogated the up-regulatory effects mediated by OW/Ob-EVs on
mitochondrial respiration and energy production (Fig. 9A-D). Furthermore, the enhanced
effects of OW/Ob-EVs on ATP production in MCF-7 cells were blocked
by a specific siHIF-1α (Fig.
9E).
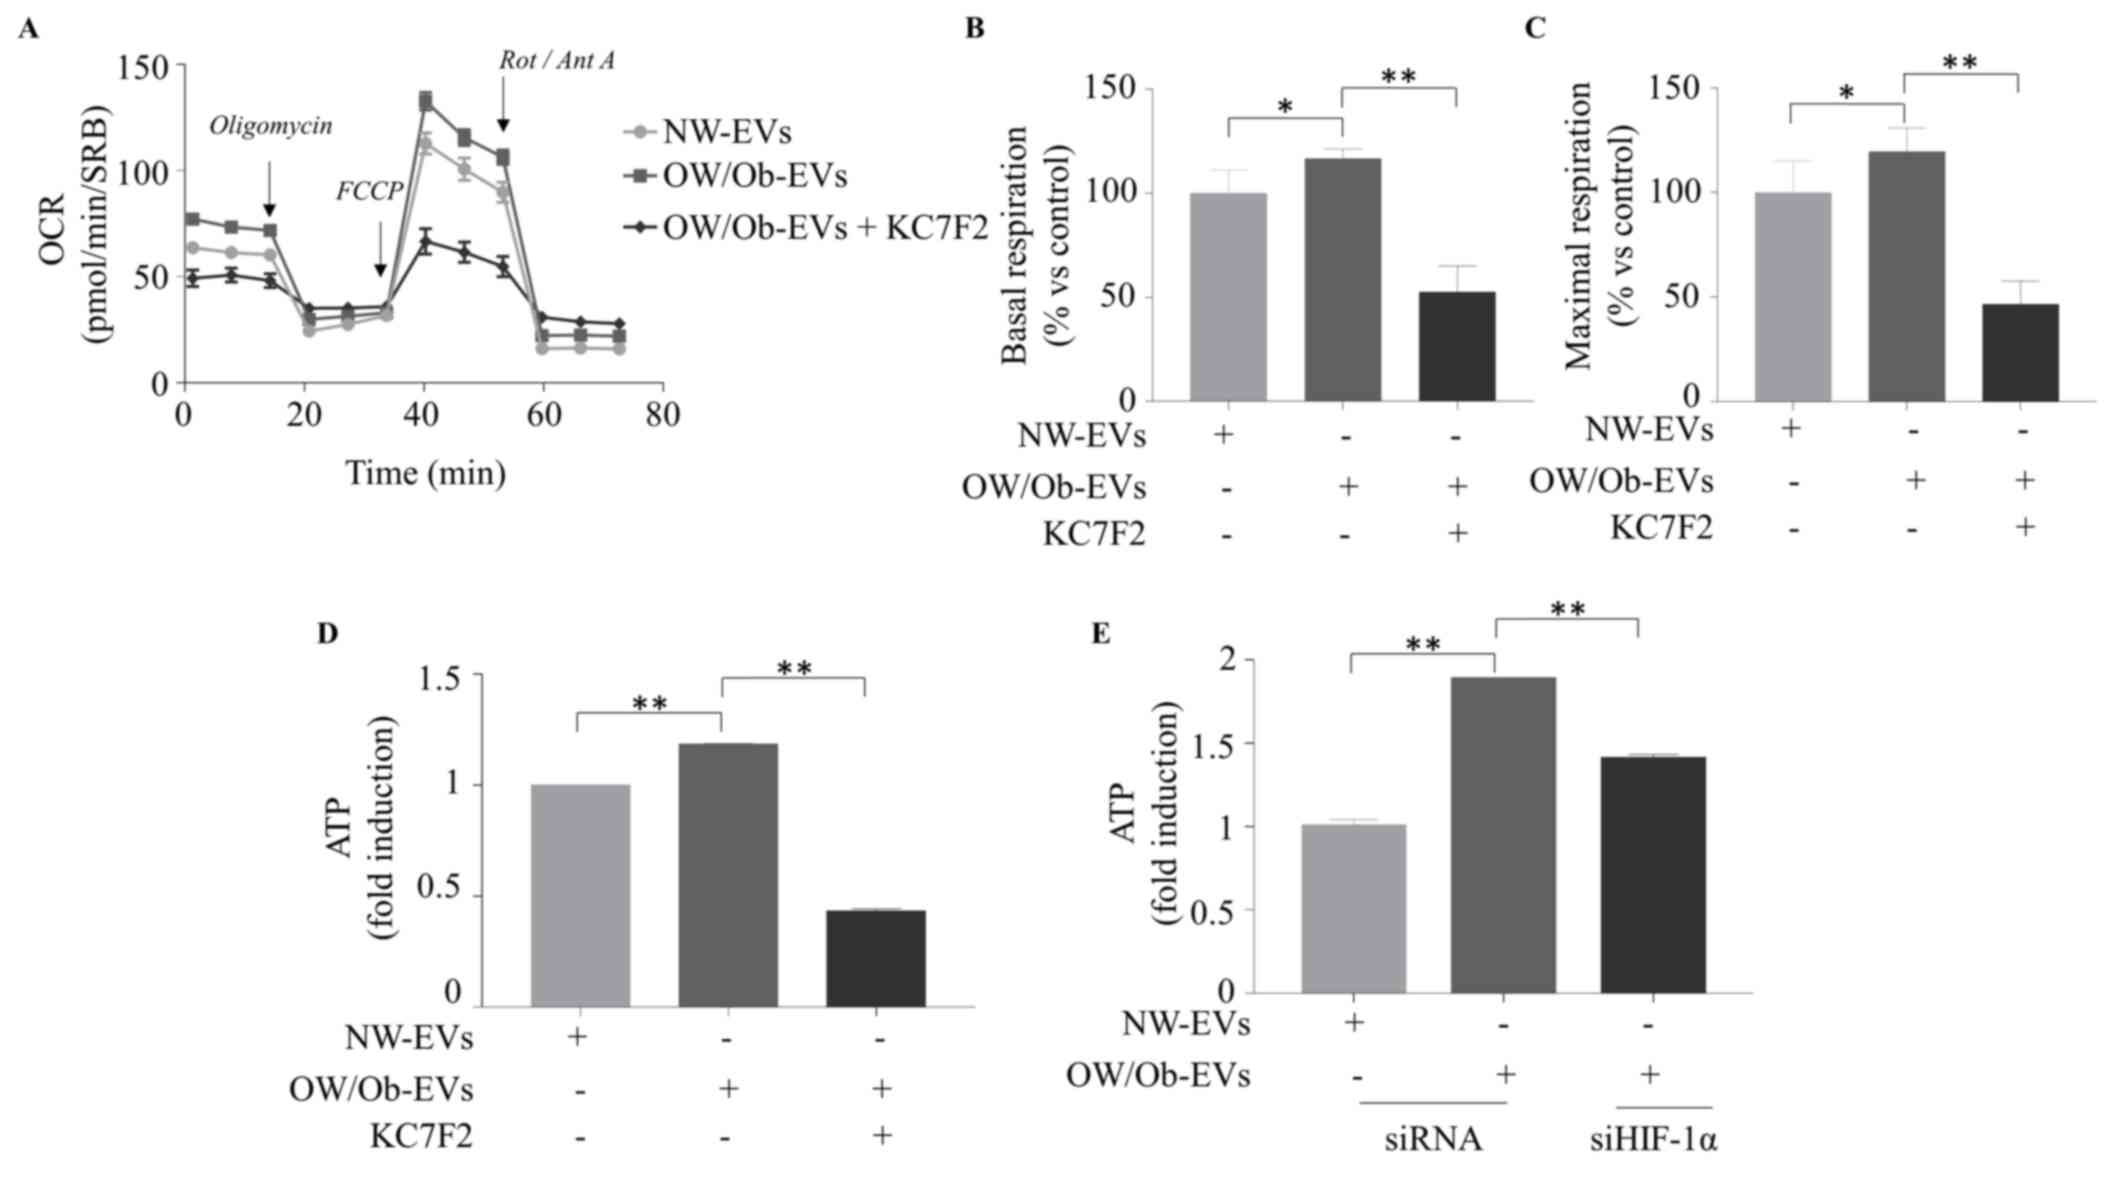 | Figure 9EVs derived from overweight/obese
patients with BC enhance mitochondrial phosphorylation and ATP
production in BC cells through HIF-1α. The seahorse XF-e96 analyzer
was used to assess the mitochondrial metabolic profile of MCF-7
cells treated with EVs (2 μg/ml) isolated from the serum of
NW and OW/Ob patients with BC for 48 h, in the presence or not of
HIF-1α specific inhibitor (KC7F2; 20 μM). (A) OCR flux and
histograms of different mitochondrial respiratory parameters such
as (B) basal (C) and maximal respiration are shown. Data were
analyzed using one-way ANOVA with Tukey's multiple comparisons post
hoc test and represented as ± SEM of five biological replicates
from two independent experiments and normalized to protein content
(SRB assay). ATP production in MCF-7 cells treated as indicated (D)
or transfected with siHIF-1α (E). Data were analyzed using one-way
ANOVA with Tukey's multiple comparisons post hoc test and
represented as ± SD of three biological replicates from two
independent experiments. *P≤0.05; **P≤0.01.
EVs, extracellular vesicles; HIF-1α, hypoxia inducible factor-1α;
NW, normal weight; OW/Ob, overweight/obese; OCR, oxygen consumption
rates; SRB, sulforhodamine B; FCCP, carbonyl cyanide
p-trifluoromethoxyphenylhydrazone; Rot, rotenone; Ant, Antimycin
A. |
All these data supported the role of HIF-1α as a
potential mediator of the stimulatory effects of EVs on BC cell
metabolism.
Discussion
The complex and multifaceted interaction between
adipocytes and BC cells within the tumor microenvironment (TME)
exerts a profound influence on the development and progression of
BC. However, this dialogue has been largely confined to the various
factors secreted by adipose tissue, as well as adipokines,
cytokines and growth factors (4-13,31-33). Recently, EVs have been identified
as a component of the secretome of adipocytes and EV-mediated
effects represent a pivotal aspect of the dynamic TME. Although,
the majority of current studies focus on elucidating the cargo of
EVs or identifying genomic alterations induced by EVs in cancer
cells, there is still a gap in our knowledge regarding the
potential effects of EVs in modulating the metabolic phenotype of
BC cells. The present study described for the first time how EVs
derived from adipocytes may modify the proteomic profile of BC
cells. The findings demonstrated that these vesicles are able to:
i) Deregulate proteins associated with metabolic processes; ii)
switch the metabolic profile towards mitochondrial respiration; and
iii) enhance ATP production in BC cells. This occurs through a
mechanism involving HIF-1α.
It is now recognized that cells following the
malignant transformation into neoplastic cells rewire cellular
metabolism, essential to satisfy the demand of growth,
proliferation and progression (34-36). The defined metabolic hallmark of
tumor metabolism is aerobic glycolysis, accompanied by an increased
rate of lactate production, phenomenon known as the 'Warburg
effect' (37). Nevertheless,
cancer cells are capable of autonomously reprogramming their
metabolic pathways, enabling rapid adaptation to microenvironmental
changes and the fulfilment of increased bioenergetic demand
(38,39). Tumor-surrounding adipocytes
facilitate metabolic reprogramming in cancer cells by increasing
the availability of fatty acid and supporting beta-oxidation in
cancer cells. This provides an excess of substrate for the
production of ATP and the generation of lipid membranes (40-42). Studies have indicated that adipose
tissue can influence the mitochondrial metabolism of cancer cells
not only in close proximity through the secretion of substrates but
also via EVs (43-46). Particularly, it has been
demonstrated that the cargo of adipocyte-derived EVs may also
contain metabolites that can markedly impact the metabolism of
recipient cells, potentially contributing to cancer progression
(43-46). The present study demonstrated that
adipocyte-derived EVs altered the proteome of BC cells. Notably,
Proteomaps, STRING, REACTOME pathway, MsigDB and FunRich analyses
revealed that de-regulated proteins identified in the EV-treated
cells were highly enriched in GOs mainly related to mitochondrion,
protein metabolism, energy pathways and oxidoreductase activity.
Consequently, functional studies confirmed that adipocyte-derived
EVs enhanced mitochondrial respiration, a trait now regarded as a
hallmark of more aggressive cancers (47-49), in several ER-positive BC cells,
including MCF-7, ZR-75 and BT-474 cells. By contrast, no changes in
glycolysis were detected in the experimental conditions of the
present study. Furthermore, in agreement with these previously
reported data, the present study found that adipocyte-derived EVs
enhanced ATP production as a consequence of increased mitochondrial
activity, as evidenced by mitotracker analysis and the expression
of several mitochondrial markers.
Regarding obesity, a well-established risk factor
for BC, it has been extensively documented that the typical
enlarged adipocytes secrete a greater quantity of EVs that differ
in nature and size when compared with their NW counterparts. These
EVs have profound implications in the pathogenesis of several
malignancies, including breast, endometrial, prostate, colorectal
and melanoma (44-46,50-54). In this frame, our research group
identified a potential mechanism through which the
obesity-associated hormone leptin sustains exosome generation and
modifies the EV cargo in BC cells, thus supporting mitochondrial
metabolism in recipient epithelial tumor cells and macrophages
(52,55). Moreover, analysis of circulating
EV-derived miRNAs in patients with BC revealed a differential miRNA
profile within EVs in relation to a patient's body mass index and
allow the identification of let-7 as a potential obesity-related
miRNA whose downregulation may be associated with tumor progression
(22). It has been reported that
EVs derived from obese adipocytes influence the miRNome of BC cells
by altering their metabolic processes (45). Clement et al (44) conducted a comparative proteomic
analysis of EVs derived from adipocytes of lean and obese mice,
identifying the presence of proteins involved in fatty acid
oxidation (FAO). The horizontally transferred proteins, associated
with FAO, mitochondrial respiration and ATP production, remodel
melanoma metabolism and support aggressiveness. Furthermore, the
modulation of lipid metabolism induced by vesicles derived from
obese patients was also identified as a critical factor in the
development of ferroptosis and chemoresistance in colorectal cancer
cells (46). Consistent with this
evidence, the results of the present study revealed that EVs
isolated from the serum of OW/Ob patients with BC increased the
oxidative phosphorylation and the ATP production in BC cells
compared with those treated with EVs isolated from NW patients.
It has been widely reported that HIF-1α regulates
the expression of numerous genes involved in physiological and
pathological processes, including cell metabolism. Indeed, HIF-1α
is a transcription factor that plays a pivotal role in modulating
tumor metabolism in response to a low-oxygen environment.
Specifically, under hypoxic conditions, HIF-1α is responsible for
regulating tumor cell metabolism towards glycolysis. This involves
the overexpression of glucose transporters (such as GLUT1 and GLUT
3) and glycolytic enzymes (such as hexokinase, phosphofructokinase,
aldolase, glyceraldehyde 3-phosphate dehydrogenase,
phosphoglycerate kinase, enolase, pyruvate kinase, lactate
dehydrogenase and pyruvate dehydrogenase kinase), which ultimately
results in an increased glucose uptake (56-60). In particular, HIF-1α is also
involved in the interactions between adipocytes and BC cells,
primarily by promoting lipolysis and free-fatty acid release in
adipocytes (61-63). This allows free fatty acid
transfer from the adipocyte to the BC cells, which then initiate
fatty acid metabolism in order to maintain high levels of ATP,
thereby supporting the growth and progression of the tumor
(41). Notably, since obesity is
characterized by adipose tissue hypoxia, HIF-1α expression and
activity resulted increased in obese conditions, with a consequent
release of pro-inflammatory signals (64-66). The present study demonstrated the
direct involvement of HIF-1α in the EV-enhanced effects on BC cell
metabolism. In particular, the pharmacological inhibition of HIF-1α
by using the cystamine compound KC7F2 or genetic inhibition by
employing a siHIF-1α counteracts the stimulatory effects of
adipocyte-derived EVs on the mitochondrial respiration and activity
as well as in the ATP energy production in BC cells. HIF-1α
inhibition was also able to reverse the effects of OW/Ob-EVs on BC
cell metabolic activity, further highlighting HIF-1α as a potential
target for therapeutic strategy in BC, especially in the context of
obesity.
In conclusion, the present study represented a
novel contribution to the growing body of evidence supporting the
involvement of EVs in the obesity-BC link. Investigation into the
function of adipocyte-derived EVs in educating BC cells towards a
more aggressive phenotype may facilitate the discovery of novel
biomarkers or innovative targets (for example, HIF-1α) that might
be involved in metabolic cancer vulnerability. Such discoveries
could then be employed for the purposes of a personalized
therapeutic approach in obese patients with BC.
Supplementary Data
Availability of data materials
The data generated in the present study may be
requested from the corresponding author. The mass spectrometry
proteomics data have been deposited to the ProteomeXchange
Consortium via the PRIDE partner repository with the dataset
identifier PXD059789.
Authors' contributions
LG, IB, CG and SC made substantial contributions to
the conception or design of the work, and drafted the article; LG,
IB and PDC contributed to the acquisition, analysis, or
interpretation of data for the work; MF and PDC contributed to the
acquisition, analysis, or interpretation of metabolism data; MG and
MSM performed, analyzed and intepreted the proteomic data; FG, GDN
and SP performed, analyzed and interpreted the flow-cytometry data;
DB, SA, MG and GA partecipated to the acquisition, analysis, or
interpretation of data from patients. All authors contributed to
revising the work critically for important intellectual content.
All authors read and approved the final manuscript.
Ethics approval and consent to
participate
The present study was approved by the ethical
committee of University of Naples 'Federico II' (approval no.
107/05).
Patient consent for publication
Not applicable.
Competing interest
The authors declare that they have no competing
interests.
Acknowledgements
Not applicable.
Funding
The present study was funded by BANDO PRIN 2017 grant no.
2017WNKSLR, PRIN 2022-European NextGenerationEU initiative under
the Italian Ministry of University and Research-M4C2-I1.1 (grant
no. 202239N8PR, CUP H53D23006360006) and PRIN PNRR 2022-European
NextGenerationEU initiative under the Italian Ministry of
University and Research as part of the PNRR-M4C2-I1.1 (grant no.
P2022YAKJY, CUP H53D23010120001) to I. Barone; PRIN 2022, European
NextGenerationEU initiative under the Italian Ministry of
University and Research M4C2-I1.1 (grant no. 2022AA4FTJ, CUP
H53D23006420006) to Giordano C; PRIN PNRR 2022-European
NextGenerationEU initiative under the Italian Ministry of
University and Research as part of the PNRR-M4C2-I1.1 (grant no.
P2022FK2J8, CUP H53D23010420001) to L. Gelsomino; AIRC Investigator
Grant no. 30782 to S. Catalano and grant no. 26246 to S. Andò. The
present study was also funded by the National Plan for NRRP
Complementary Investments grant no. PNC0000003, AdvaNced
Technologies for Human-centrEd Medicine (ANTHEM); POS RADIOAMICA
project funded by the Italian Minister of Health (CUP: grant no.
H53C22000650006); and POS CAL.HUB. RIA project funded by the
Italian Minister of Health (grant no. CUP H53C22000800006).
References
|
1
|
Ambrosio MR, Adriaens M, Derks K,
Migliaccio T, Costa V, Liguoro D, Cataldi S, D'Esposito V, Maneli
G, Bassolino R, et al: Glucose impacts onto the reciprocal
reprogramming between mammary adipocytes and cancer cells. Sci Rep.
14:246742024. View Article : Google Scholar : PubMed/NCBI
|
|
2
|
Dominiak A, Chelstowska B, Olejarz W and
Nowicka G: Communication in the cancer microenvironment as a target
for therapeutic interventions. Cancers (Basel). 12:12322020.
View Article : Google Scholar : PubMed/NCBI
|
|
3
|
Zhou JX, Taramelli R, Pedrini E,
Knijnenburg T and Huang S: Extracting intercellular signaling
network of cancer tissues using ligand-receptor expression patterns
from whole-tumor and single-cell transcriptomes. Sci Rep.
7:88152017. View Article : Google Scholar : PubMed/NCBI
|
|
4
|
Andò S, Gelsomino L, Panza S, Giordano C,
Bonofiglio D, Barone I and Catalano S: Obesity, leptin and breast
cancer: epidemiological evidence and proposed mechanisms. Cancers
(Basel). 11:622019. View Article : Google Scholar : PubMed/NCBI
|
|
5
|
Gelsomino L, Giordano C, Camera GL, Sisci
D, Marsico S, Campana A, Tarallo R, Rinaldi A, Fuqua S, Leggio A,
et al: Leptin signaling contributes to aromatase inhibitor
resistant breast cancer cell growth and activation of macrophages.
Biomolecules. 10:5432020. View Article : Google Scholar : PubMed/NCBI
|
|
6
|
Catalano S, Leggio A, Barone I, De Marco
R, Gelsomino L, Campana A, Malivindi R, Panza S, Giordano C,
Liguori A, et al: A novel leptin antagonist peptide inhibits breast
cancer growth in vitro and in vivo. J Cell Mol Med. 19:1122–1132.
2015. View Article : Google Scholar : PubMed/NCBI
|
|
7
|
Barone I, Catalano S, Gelsomino L, Marsico
S, Giordano C, Panza S, Bonofiglio D, Bossi G, Covington KR, Fuqua
SA and Andò S: Leptin mediates tumor-stromal interactions that
promote the invasive growth of breast cancer cells. Cancer Res.
72:1416–1427. 2012. View Article : Google Scholar : PubMed/NCBI
|
|
8
|
Giordano C, Vizza D, Panza S, Barone I,
Bonofiglio D, Lanzino M, Sisci D, De Amicis F, Fuqua SA, Catalano S
and Andò S: Leptin increases HER2 protein levels through a
STAT3-mediated up-regulation of Hsp90 in breast cancer cells. Mol
Oncol. 7:379–391. 2013. View Article : Google Scholar
|
|
9
|
Devericks EN, Carson MS, McCullough LE,
Coleman MF and Hursting SD: The obesity-breast cancer link: A
multidisciplinary perspective. Cancer Metastasis Rev. 41:607–625.
2022. View Article : Google Scholar : PubMed/NCBI
|
|
10
|
Andò S, Naimo GD, Gelsomino L, Catalano S
and Mauro L: Novel insights into adiponectin action in breast
cancer: Evidence of its mechanistic effects mediated by ERα
expression. Obes Rev. 21:e130042020. View Article : Google Scholar
|
|
11
|
Mauro L, Naimo GD, Gelsomino L, Malivindi
R, Bruno L, Pellegrino M, Tarallo R, Memoli D, Weisz A, Panno ML
and Andò S: Uncoupling effects of estrogen receptor α on LKB1/AMPK
interaction upon adiponectin exposure in breast cancer. FASEB J.
32:4343–4355. 2018. View Article : Google Scholar : PubMed/NCBI
|
|
12
|
Naimo GD, Forestiero M, Paoli A, Malivindi
R, Gelsomino L, Győrffy B, Leonetti AE, Giordano F, Panza S,
Conforti FL, et al: ERα/LKB1 complex upregulates E-cadherin
expression and stimulates breast cancer growth and progression upon
adiponectin exposure. Int J Cancer. 153:1257–1272. 2023. View Article : Google Scholar : PubMed/NCBI
|
|
13
|
Naimo GD, Gelsomino L, Catalano S, Mauro L
and Andò S: Interfering role of ERα on adiponectin action in breast
cancer. Front Endocrinol (Lausanne). 11:662020. View Article : Google Scholar
|
|
14
|
Hartwig S, De Filippo E, Göddeke S, Knebel
B, Kotzka J, Al-Hasani H, Roden M, Lehr S and Sell H: Exosomal
proteins constitute an essential part of the human adipose tissue
secretome. Biochim Biophys Acta Proteins Proteom. 1867:1401722019.
View Article : Google Scholar
|
|
15
|
Durcin M, Fleury A, Taillebois E, Hilairet
G, Krupova Z, Henry C, Truchet S, Trötzmüller M, Köfeler H,
Mabilleau G, et al: Characterisation of adipocyte-derived
extracellular vesicle subtypes identifies distinct protein and
lipid signatures for large and small extracellular vesicles. J
Extracell Vesicles. 6:13056772017. View Article : Google Scholar : PubMed/NCBI
|
|
16
|
Wang J, Wu Y, Guo J, Fei X, Yu L and Ma S:
Adipocyte-derived exosomes promote lung cancer metastasis by
increasing MMP9 activity via transferring MMP3 to lung cancer
cells. Oncotarget. 8:81880–81891. 2017. View Article : Google Scholar : PubMed/NCBI
|
|
17
|
Fontana F, Anselmi M, Carollo E, Sartori
P, Procacci P, Carter D and Limonta P: Adipocyte-derived
extracellular vesicles promote prostate cancer cell aggressiveness
by enabling multiple phenotypic and metabolic changes. Cells.
11:23882022. View Article : Google Scholar : PubMed/NCBI
|
|
18
|
Lazar I, Clement E, Dauvillier S, Milhas
D, Ducoux-Petit M, LeGonidec S, Moro C, Soldan V, Dalle S, Balor S,
et al: Adipocyte exosomes promote melanoma aggressiveness through
fatty acid oxidation: A novel mechanism linking obesity and cancer.
Cancer Res. 76:4051–4057. 2016. View Article : Google Scholar : PubMed/NCBI
|
|
19
|
Liu Y, Tan J, Ou S, Chen J and Chen L:
Adipose-derived exosomes deliver miR-23a/b to regulate tumor growth
in hepatocellular cancer by targeting the VHL/HIF axis. J Physiol
Biochem. 75:391–401. 2019. View Article : Google Scholar : PubMed/NCBI
|
|
20
|
La Camera G, Gelsomino L, Malivindi R,
Barone I, Panza S, De Rose D, Giordano F, D'Esposito V, Formisano
P, Bonofiglio D, et al: Adipocyte-derived extracellular vesicles
promote breast cancer cell malignancy through HIF-1α activity.
Cancer Lett. 521:155–168. 2021. View Article : Google Scholar : PubMed/NCBI
|
|
21
|
Jafari N, Kolla M, Meshulam T, Shafran JS,
Qiu Y, Casey AN, Pompa IR, Ennis CS, Mazzeo CS, Rabhi N, et al:
Adipocyte-derived exosomes may promote breast cancer progression in
type 2 diabetes. Sci Signal. 14:eabj28072021. View Article : Google Scholar : PubMed/NCBI
|
|
22
|
Barone I, Gelsomino L, Accattatis FM,
Giordano F, Gyorffy B, Panza S, Giuliano M, Veneziani BM, Arpino G,
De Angelis C, et al: Analysis of circulating extracellular vesicle
derived microRNAs in breast cancer patients with obesity: A
potential role for Let-7a. J Transl Med. 21:2322023. View Article : Google Scholar : PubMed/NCBI
|
|
23
|
Aliakbari F, Stocek NB, Cole-André M,
Gomes J, Fanchini G, Pasternak SH, Christiansen G, Morshedi D,
Volkening K and Strong MJ: A methodological primer of extracellular
vesicles isolation and characterization via different techniques.
Biol Methods Protoc. 9:bpae0092024. View Article : Google Scholar : PubMed/NCBI
|
|
24
|
Wu JY, Li YJ, Hu XB, Huang S and Xiang DX:
Preservation of small extracellular vesicles for functional
analysis and therapeutic applications: A comparative evaluation of
storage conditions. Drug Deliv. 28:162–170. 2021. View Article : Google Scholar : PubMed/NCBI
|
|
25
|
Gelsomino L, Caruso A, Tasan E, Leonetti
AE, Malivindi R, Naimo GD, Giordano F, Panza S, Gu G, Perrone B, et
al: Evidence that CRISPR-Cas9 Y537S-mutant expressing breast cancer
cells activate Yes-associated protein 1 to driving the conversion
of normal fibroblasts into cancer-associated fibroblasts. Cell
Commun Signal. 22:5452024. View Article : Google Scholar : PubMed/NCBI
|
|
26
|
Murfuni MS, Prestagiacomo LE, Giuliano A,
Gabriele C, Signoretti S, Cuda G and Gaspari M: Evaluation of PAC
and FASP performance: DIA-Based quantitative proteomic Analysis.
Int J Mol Sci. 25:51412024. View Article : Google Scholar : PubMed/NCBI
|
|
27
|
Rappsilber J, Mann M and Ishihama Y:
Protocol for micro-purification, enrichment, pre-fractionation and
storage of peptides for proteomics using StageTips. Nat Protoc.
2:1896–1906. 2007. View Article : Google Scholar : PubMed/NCBI
|
|
28
|
Tyanova S, Temu T, Sinitcyn P, Carlson A,
Hein MY, Geiger T, Mann M and Cox J: The Perseus computational
platform for comprehensive analysis of (prote)omics data. Nat
Methods. 13:731–740. 2016. View Article : Google Scholar : PubMed/NCBI
|
|
29
|
Liebermeister W, Noor E, Flamholz A,
Davidi D, Bernhardt J and Milo R: Visual account of protein
investment in cellular functions. Proc Natl Acad Sci USA.
111:8488–8493. 2014. View Article : Google Scholar : PubMed/NCBI
|
|
30
|
Binder MJ and Pedley AM: The roles of
molecular chaperones in regulating cell metabolism. FEBS Lett.
597:1681–1701. 2023. View Article : Google Scholar : PubMed/NCBI
|
|
31
|
Caruso A, Gelsomino L, Panza S, Accattatis
FM, Naimo GD, Barone I, Giordano C, Catalano S and Andò S: Leptin:
A heavyweight player in obesity-related cancers. Biomolecules.
13:10842023. View Article : Google Scholar : PubMed/NCBI
|
|
32
|
Gelsomino L, Naimo GD, Malivindi R,
Augimeri G, Panza S, Giordano C, Barone I, Bonofiglio D, Mauro L,
Catalano S and Andò S: Knockdown of leptin receptor affects
macrophage phenotype in the tumor microenvironment inhibiting
breast cancer growth and progression. Cancers (Basel). 12:20782020.
View Article : Google Scholar : PubMed/NCBI
|
|
33
|
Gelsomino L, Naimo GD, Catalano S, Mauro L
and Andò S: The emerging role of adiponectin in female
malignancies. Int J Mol Sci. 20:21272019. View Article : Google Scholar : PubMed/NCBI
|
|
34
|
Elia I and Haigis MC: Metabolites and the
tumour microenvironment: From cellular mechanisms to systemic
metabolism. Nat Metab. 3:21–32. 2021. View Article : Google Scholar : PubMed/NCBI
|
|
35
|
Chae HS and Hong ST: Overview of cancer
metabolism and signaling transduction. Int J Mol Sci. 24:122022.
View Article : Google Scholar
|
|
36
|
Cantor JR and Sabatini DM: Cancer cell
metabolism: One hallmark, many faces. Cancer Discov. 2:881–898.
2012. View Article : Google Scholar : PubMed/NCBI
|
|
37
|
Warburg O: On the origin of cancer cells.
Science. 123:309–314. 1956. View Article : Google Scholar : PubMed/NCBI
|
|
38
|
Yang J, Shay C, Saba NF and Teng Y: Cancer
metabolism and carcinogenesis. Exp Hematol Oncol. 13:102024.
View Article : Google Scholar : PubMed/NCBI
|
|
39
|
Pavlova NN, Zhu J and Thompson CB: The
hallmarks of cancer metabolism: Still emerging. Cell Metab.
34:355–377. 2022. View Article : Google Scholar : PubMed/NCBI
|
|
40
|
Pham DV and Park PH: Tumor metabolic
reprogramming by adipokines as a critical driver of
obesity-associated cancer progression. Int J Mol Sci. 22:14442021.
View Article : Google Scholar : PubMed/NCBI
|
|
41
|
Balaban S, Shearer RF, Lee LS, van
Geldermalsen M, Schreuder M, Shtein HC, Cairns R, Thomas KC,
Fazakerley DJ, Grewal T, et al: Adipocyte lipolysis links obesity
to breast cancer growth: Adipocyte-derived fatty acids drive breast
cancer cell proliferation and migration. Cancer Metab. 5:12017.
View Article : Google Scholar : PubMed/NCBI
|
|
42
|
Brown KA: Metabolic pathways in
obesity-related breast cancer. Nat Rev Endocrinol. 17:350–363.
2021. View Article : Google Scholar : PubMed/NCBI
|
|
43
|
Müller G, Schneider M, Biemer-Daub G and
Wied S: Microvesicles released from rat adipocytes and harboring
glycosylphosphatidylinositol-anchored proteins transfer RNA
stimulating lipid synthesis. Cell Signal. 23:1207–1223. 2011.
View Article : Google Scholar : PubMed/NCBI
|
|
44
|
Clement E, Lazar I, Attané C, Carrié L,
Dauvillier S, Ducoux-Petit M, Esteve D, Menneteau T, Moutahir M, Le
Gonidec S, et al: Adipocyte extracellular vesicles carry enzymes
and fatty acids that stimulate mitochondrial metabolism and
remodeling in tumor cells. EMBO J. 39:e1025252020. View Article : Google Scholar : PubMed/NCBI
|
|
45
|
Liu S, Benito-Martin A, Pelissier Vatter
FA, Hanif SZ, Liu C, Bhardwaj P, Sethupathy P, Farghli AR, Piloco
P, Paik P, et al: Breast adipose tissue-derived extracellular
vesicles from obese women alter tumor cell metabolism. EMBO Rep.
24:e573392023. View Article : Google Scholar : PubMed/NCBI
|
|
46
|
Zhang Q, Deng T, Zhang H, Zuo D, Zhu Q,
Bai M, Liu R, Ning T, Zhang L, Yu Z, et al: Adipocyte-derived
exosomal MTTP suppresses ferroptosis and promotes chemoresistance
in colorectal cancer. Adv Sci (Weinh). 9:e22033572022. View Article : Google Scholar : PubMed/NCBI
|
|
47
|
Galluzzi L, Kepp O, Vander Heiden MG and
Kroemer G: Metabolic targets for cancer therapy. Nat Rev Drug
Discov. 12:829–846. 2013. View Article : Google Scholar : PubMed/NCBI
|
|
48
|
Martinez-Outschoorn UE, Peiris-Pagés M,
Pestell RG, Sotgia F and Lisanti MP: Cancer metabolism: A
therapeutic perspective. Nat Rev Clin Oncol. 14:11–31. 2017.
View Article : Google Scholar
|
|
49
|
Hanahan D and Weinberg RA: Hallmarks of
cancer: The next generation. Cell. 144:646–674. 2011. View Article : Google Scholar : PubMed/NCBI
|
|
50
|
Zhou C, Huang YQ, Da MX, Jin WL and Zhou
FH: Adipocyte-derived extracellular vesicles: Bridging the
communications between obesity and tumor microenvironment. Discov
Oncol. 14:922023. View Article : Google Scholar : PubMed/NCBI
|
|
51
|
Blandin A, Dugail I, Hilairet G, Ponnaiah
M, Ghesquière V, Froger J, Ducheix S, Fizanne L, Boursier J, Cariou
B, et al: Lipidomic analysis of adipose-derived extracellular
vesicles reveals specific EV lipid sorting informative of the
obesity metabolic state. Cell Rep. 42:1121692023. View Article : Google Scholar : PubMed/NCBI
|
|
52
|
Gelsomino L, Barone I, Caruso A, Giordano
F, Brindisi M, Morello G, Accattatis FM, Panza S, Cappello AR,
Bonofiglio D, et al: Proteomic profiling of extracellular vesicles
released by leptin-treated breast cancer cells: A potential role in
cancer metabolism. Int J Mol Sci. 23:129412022. View Article : Google Scholar : PubMed/NCBI
|
|
53
|
Sakaue T, Dorayappan KDP, Zingarelli R,
Khadraoui W, Anbalagan M, Wallbillich J, Bognar B, Wanner R,
Cosgrove C, Suarez A, et al: Obesity-induced extracellular vesicles
proteins drive the endometrial cancer pathogenesis: Therapeutic
potential of HO-3867 and Metformin. Oncogene. 43:3586–3597. 2024.
View Article : Google Scholar : PubMed/NCBI
|
|
54
|
Mathiesen A, Haynes B, Huyck R, Brown M
and Dobrian A: Adipose tissue-derived extracellular vesicles
contribute to phenotypic plasticity of prostate cancer cells. Int J
Mol Sci. 24:12292023. View Article : Google Scholar : PubMed/NCBI
|
|
55
|
Giordano C, Gelsomino L, Barone I, Panza
S, Augimeri G, Bonofiglio D, Rovito D, Naimo GD, Leggio A, Catalano
S and Andò S: Leptin modulates exosome biogenesis in breast cancer
cells: An additional mechanism in cell-to-cell communication. J
Clin Med. 8:10272019. View Article : Google Scholar : PubMed/NCBI
|
|
56
|
Liu Q, Guan C, Liu C, Li H, Wu J and Sun
C: Targeting hypoxia-inducible factor-1alpha: A new strategy for
triple-negative breast cancer therapy. Biomed Pharmacother.
156:1138612022. View Article : Google Scholar : PubMed/NCBI
|
|
57
|
Zhi S, Chen C, Huang H, Zhang Z, Zeng F
and Zhang S: Hypoxia-inducible factor in breast cancer: Role and
target for breast cancer treatment. Front Immunol. 15:13708002024.
View Article : Google Scholar : PubMed/NCBI
|
|
58
|
Luo S, Jiang Y, Zheng A, Zhao Y, Wu X, Li
M, Du F, Chen Y, Deng S, Chen M, et al: Targeting hypoxia-inducible
factors for breast cancer therapy: A narrative review. Front
Pharmacol. 13:10646612022. View Article : Google Scholar : PubMed/NCBI
|
|
59
|
Liu ZJ, Semenza GL and Zhang HF:
Hypoxia-inducible factor 1 and breast cancer metastasis. J Zhejiang
Univ Sci B. 16:32–43. 2015. View Article : Google Scholar : PubMed/NCBI
|
|
60
|
Infantino V, Santarsiero A, Convertini P,
Todisco S and Iacobazzi V: Cancer cell metabolism in hypoxia: Role
of HIF-1 as Key regulator and therapeutic target. Int J Mol Sci.
22:57032021. View Article : Google Scholar : PubMed/NCBI
|
|
61
|
Yun Z, Maecker HL, Johnson RS and Giaccia
AJ: Inhibition of PPAR gamma 2 gene expression by the
HIF-1-regulated gene DEC1/Stra13: A mechanism for regulation of
adipogenesis by hypoxia. Dev Cell. 2:331–341. 2002. View Article : Google Scholar : PubMed/NCBI
|
|
62
|
Yu X, Zhang T, Cheng X and Ma L: Breast
cancer cells and adipocytes in hypoxia: Metabolism regulation.
Discov Oncol. 15:112024. View Article : Google Scholar : PubMed/NCBI
|
|
63
|
Aird R, Wills J, Roby KF, Bénézech C,
Stimson RH, Wabitsch M, Pollard JW, Finch A and Michailidou Z:
Hypoxia-driven metabolic reprogramming of adipocytes fuels cancer
cell proliferation. Front Endocrinol (Lausanne). 13:9895232022.
View Article : Google Scholar : PubMed/NCBI
|
|
64
|
Mirabelli M, Misiti R, Sicilia L, Brunetti
FS, Chiefari E, Brunetti A and Foti DP: Hypoxia in human obesity:
New insights from inflammation towards insulin resistance-a
narrative review. Int J Mol Sci. 25:98022024. View Article : Google Scholar : PubMed/NCBI
|
|
65
|
Gaspar JM and Velloso LA: Hypoxia
inducible factor as a central regulator of metabolism-implications
for the development of obesity. Front Neurosci. 12:8132018.
View Article : Google Scholar
|
|
66
|
He Q, Gao Z, Yin J, Zhang J, Yun Z and Ye
J: Regulation of HIF-1{alpha} activity in adipose tissue by
obesity-associated factors: Adipogenesis, insulin, and hypoxia. Am
J Physiol Endocrinol Metab. 300:E877–E885. 2011. View Article : Google Scholar : PubMed/NCBI
|