Introduction
Breast cancer is the most common malignant tumor
among women worldwide (1). In
clinical practice, immunohistochemical results are often used to
define the four breast cancer subtypes, including luminal A,
luminal B, human epidermal growth factor receptor 2 (HER2)-enriched
and triple-negative breast cancer (TNBC) (2). Luminal A is characterized by high
expression of the estrogen receptor (ER) and progesterone receptor
(PR) as well as low expression of Ki67 and is HER2-negative,
indicating slower cell growth and improved prognosis. Luminal B
tumors are ER-positive and PR-positive, but they can be either
HER2-positive or HER2-negative. They exhibit higher levels of Ki67,
which indicates faster cell growth. HER2-enriched cancer is
ER-negative and PR-negative and exhibits high Ki67 levels,
indicating that the tumor is highly aggressive. TNBC lacks the
expression of HER2, ER and PR, and is clinically recognized as the
most therapeutically recalcitrant breast cancer subtype (3). Due to the notable invasiveness and
high recurrence and metastasis rates of TNBC, chemotherapy
resistance often develops during treatment, leading to a poor
prognosis following conventional chemotherapy (4). Consequently, it is essential to
further develop effective antitumor drugs with low toxicity that
can reverse drug resistance.
Autophagy is a cellular biological process in which
cells degrade dysfunctional organelles or unnecessary components
through autophagosomes, subsequently recycling the nutrients for
their growth (5). Previous
research has identified autophagy as a promising therapeutic target
in the treatment of cancer, and an increasing body of evidence
supports that blocking autophagy can effectively inhibit the growth
and progression of advanced tumors (6,7).
In recent years, research has focused on targeting the various
pathways involved in tumor progression, including the PI3K/AKT/mTOR
and cyclin D/CDK/retinoblastoma protein pathways (8,9).
In this respect, autophagy inhibition has been demonstrated to
enhance chemotherapeutic responsiveness.
Research indicates that metastatic cell lines have
higher levels of basal autophagy compared with non-metastatic cell
lines, suggesting that autophagy may enhance the invasiveness of
tumor cells (10,11). High expression of
microtubule-associated protein 1 light chain 3 (LC3) has been
linked to tumor progression and poor outcomes in TNBC,
demonstrating its potential as a prognostic biomarker for this
disease (10). Furthermore, the
knockout of autophagy-related genes, specifically LC3, has been
shown to inhibit autophagy, leading to a marked decrease in cell
proliferation, colony formation and migratory/invasive
capabilities, while also promoting apoptosis in MDA-MB-231 cell
lines (12). Overall, autophagy
is essential for the survival of tumor cells (8). At present, the only autophagy
inhibitors available for clinical application are chloroquine (CQ)
and hydroxychloroquine (HCQ). However, these agents are associated
with retinotoxicity and cardiotoxicity (13). Therefore, it is essential to
further search for autophagy inhibitors with low toxicity that
exhibit enhanced specificity.
Immune checkpoint molecules play a key role in the
antitumor immune response. Cancer cells frequently exploit these
mechanisms to evade immune surveillance, thereby facilitating
cancer progression and contributing to treatment resistance
(14). Immune checkpoint
inhibitors regulate the TME through various mechanisms to exert
their anticancer effects. With the development of cancer
immunotherapy, targeting programmed cell death protein-1 (PD-1) or
programmed death-ligand 1 (PD-L1) pathways can enhance antitumor
immune activity and inhibit cancer cell proliferation (9). However, the low response rate of
antitumor immunotherapy limits its efficacy (15). Furthermore, autophagy is a
critical factor in tumor immunotherapy and interacts with immune
cells to regulate therapeutic effects (16). Autophagy has been demonstrated to
play a notable role in T cell activation and memory
differentiation, and it can influence the immunogenicity of tumor
cell death (17,18). In summary, cytoprotective
autophagy and the immunosuppressive TME have been recognized as
notable barriers. Consequently, the development of novel drugs that
inhibit autophagy and possess immunomodulatory effects, or the use
of multi-drug combinations, may further enhance therapeutic
efficacy.
Inhibiting autophagy while modulating the antitumor
immune response holds potential for effective tumor suppression.
Small molecule compounds have demonstrated advantages for
tumor-targeting therapy. These small molecule compounds can be
easily modified to become more suitable for clinical needs, and
their synthesis cost is low and easy to promote, which makes them
hot spots in the current research of tumor-targeting therapy
(9,19). LLY-507, a selective small-molecule
inhibitor of SET and MYND domain-containing protein 2 (SMYD2), has
been extensively validated for its mechanism of action and
antitumor properties. LLY-507 exhibits submicromolar potency
against SMYD2 in various cancer cell lines (such as esophageal
squamous carcinoma, bladder carcinoma gastric cancer cell lines) by
occupying the peptide-binding groove of SMYD2 (20-23). However, the impact of LLY-507
derivatives and their synthetic intermediates on tumor cell
autophagy and immune modulation remains unexplored.
In the present study, a series of LLY-507
derivatives, including 26 intermediates, were screened. Through the
mRFP-GFP-LC3 fluorescence tandem assay, CYTO-ID assay,
monodansylcadaverine (MDC) staining and protein-level detection of
LC3, the intermediate compound FZU-0045-053 (053) in the synthesis
process of LLY-507 derivatives was preliminarily screened as having
autophagy-regulating effects on breast cancer cells. To capture the
spectrum of breast cancer heterogeneity, two representative cell
lines were selected: MDA-MB-231 as a triple-negative
(ER−/PR−/HER2−) basal-like subtype
and MCF-7 as a hormone receptor-positive
(ER+/PR+) luminal subtype. This dual-model
system provides a critical platform for mechanistic studies, drug
discovery and personalized therapy development by encompassing both
treatment-responsive and therapy-resistant phenotypes. At the
cellular level, the effects of compound 053 on key autophagy
markers were validated to elucidate its regulatory mechanism on
autophagy in breast cancer cells. Apoptosis and proliferation
assays were used to verify whether the combination of 053 and
chemotherapy drugs could reverse chemotherapy resistance. The PD-L1
levels of tumor cells and the co-stimulatory or co-inhibitory
molecules on the surface of T cells were detected to evaluate the
effect of compound 053 on the immune response. Additionally, an
MDA-MB-231 xenograft model was established to evaluate the
antitumor and autophagy-regulating effects of 053± gemcitabine
(GEM). The 4T1 xenograft model was established to assess the
antitumor and immune-modulating effects of 053± GEM.
Materials and methods
Reagents
Compound 053 was dissolved in DMSO to prepare a 10
mM stock solution. CQ (cat. no. C129284) was purchased from
Shanghai Aladdin Biochemical Technology Co., Ltd. and dissolved in
DMSO to prepare a 10 mM stock solution. Rapamycin (RAPA; cat. no.
HY-10219) was purchased from MedChemExpress and dissolved in DMSO
to prepare a 10 mM stock solution. Adriamycin (ADM; cat. no.
HY-15142A; MedChemExpress) was dissolved in DMSO to prepare a 10 mM
stock solution. GEM (cat. no. HY-17026; MedChemExpress) was
dissolved in DMSO to prepare a 100 mM stock solution. Paclitaxel
(PTX; cat. no. HY-B0015; MedChemExpress) was dissolved in DMSO to
prepare a 100 mM stock solution. Cisplatin (DDP; cat. no. HY-17394;
MedChemExpress) was dissolved in DMSO to prepare a 100 mM stock
solution. 5-Fluorouracil (5-FU; cat. no. HY-90006; MedChemExpress)
was dissolved in DMSO to prepare a 100 mM stock solution.
Synthesis of compound 053
The synthesis, detailed synthetic procedure and
characterization of compound 053 are described in Data S1.
Cells and cell culture
The breast cancer cell lines MCF-7 (cat. no.
KGG3332-1), MDA-MB-231 (cat. no. KGG3220-1) and 4T1 (cat. no.
KGG2224-1) (all from Nanjing Kaiji Biotechnology Co., Ltd.) were
cultured in RPMI-1640 medium (cat. no. L210KJ; Shanghai Yuanpei
Biotech Co., Ltd.) supplemented with 10% fetal bovine serum (FBS;
cat. no. A0050-3110; Cegrogen Biotech GmbH) and 1%
penicillin/streptomycin (cat. no. MA0110; Dalian Meilun Biology
Technology Co., Ltd.).
Peripheral blood mononuclear cells (primary cells
isolated from human blood) were obtained in accordance with the
regulations established by The Ethics Committee of Fujian
Provincial Cancer Hospital (Fuzhou, China; approval no.
K2023-305-01) and with the informed consent of the participants.
Blood samples were collected at the Fujian Provincial Key
Laboratory of Tumor Biotherapy, Clinical Oncology School of Fujian
Medical University, Fujian Cancer Hospital (Fuzhou, China). All
participants were women, ranging in age from 25 to 40 years. The
blood sample collection period extended from September 2023 to
August 2024. Furthermore, the inclusion criteria for participants
consisted of healthy adults without major diseases. CD3 (10
μg/ml; cat. no. T210; Takara Bio, Inc.) was used to coat 1
well of a 6-well plate overnight at 4°C. A total of 4 ml peripheral
blood was drawn from healthy individuals, and after removing the
serum, it was diluted with PBS. The mixture was slowly added to a
centrifuge tube containing 4 ml Ficoll Paque PREMIUM (cat. no.
17544202; Cytiva) and centrifuged at 800 × g with an acceleration
of 8 and a deceleration of 0 for 20 min at room temperature. The
middle white membrane layer was collected and washed twice with
PBS. The cells were resuspended in X-VIVO 15™ culture medium (cat.
no. 04-418Q; Lonza Group, Ltd.), which contained 10% FBS, 0.5
μg/ml interleukin-2 (cat. no. GMP-11848-HNAE; Beijing Sino
Technology Co. Ltd.) and 0.25 μg/ml interferon-γ (IFN-γ;
cat. no. 11725-HNAS; Beijing Sino Technology Co. Ltd.). The cell
mixture was transferred to the CD3-coated plate, and 25
μl/ml CD3/CD28 (cat. no. 10971; Stemcell Technologies, Inc.)
was added. The cell culture conditions were a constant temperature
of 37°C and a gaseous environment of 5% CO2.
mRFP-GFP-LC3 fluorescence tandem
assay
MCF-7 and MDA-MB-231 cells were transfected with the
pGMLV-CMV-RFP-GFP-hLC3-Puro lentivirus (cat. no. GM-0220LV05-1;
GemPharmatech Co., Ltd.) and were subsequently designated as MCF-7
GFP/RFP-LC3B and MDA-MB-231 GFP/RFP-LC3B, respectively. After
adding viral supernatant at a multiplicity of infection (MOI) of 10
for MDA-MB-231 cells and MOI of 30 for MCF-7 cells, as well as 2
μg/ml polybrene (cat. no. C0351; Beyotime Biotechnology) for
a co-incubation of 24 h, the medium was replaced with fresh
complete medium. At 72 h post-viral transduction, 2 μg/ml
puromycin was added to the cells and selection was continued for 2
weeks until all cells in the untransduced control group had died,
after which subsequent experiments were conducted. Untransfected
wild-type (WT) cells, MCF-7 WT and MDA-MB-231 WT, served as
controls. As shown in Fig. S1A and
B, after treatment with RAPA (10 μM) for 24 h to induce
autophagy, clear red and green fluorescence signals were observed
in the MCF-7 GFP/RFP-LC3B and MDA-MB-231 GFP/RFP-LC3B cells under
fluorescence microscopy. By contrast, no significant fluorescence
was detected in the control groups (MCF-7 WT and MDA-MB-231 WT).
This demonstrated the successful establishment of stable cell lines
expressing pGMLV-CMV-RFP-GFP-hLC3-Puro.
Next, MCF-7 GFP/RFP-LC3B or MDA-MB-231 GFP/RFP-LC3B
cells (~1×10⁴/well) were seeded into 24-well plates,
which contained microscope cover glasses and cultured at 37°C in a
humidified atmosphere with 5% CO2 for 24 h. Cells were
then treated with 053 (5 μM), CQ (30 μM), RAPA (10
μM) or RAPA combined with CQ or 053 for 24 h. Microscope
cover glasses containing cells were washed three times with PBS and
fixed with 4% paraformaldehyde for 15 min at room temperature,
washed three more times with PBS for 5 min each, air-dried and
overlaid on slides dripped with DAPI anti-fluorescence attenuation
sealer. The slides were observed and images were captured using an
Olympus inverted fluorescence microscope (Olympus Corporation). The
level of fluorescence was analyzed using ImageJ (1.8.0.1; National
Institutes of Health) software.
CYTO-ID assay
MCF-7 or MDA-MB-231 cells (~5×10⁴/well)
were cultured in 24-well plates for 24 h, treated with RAPA (10
μM), CQ (30 μM) or 053 (0, 0.5, 2.5 or 5 μM)
for 24 h and stained with CYTO-ID® Autophagy detection
kit 2.0 (cat. no. ENZ-KIT175-0200; Enzo Life Sciences, Inc.). The
CYTO-ID staining was observed and images were captured by inverted
fluorescence microscope or detected by flow cytometry (MoFlo XDP;
Beckman Coulter Ltd.). FlowJo software (v10.8.1; BD Biosciences)
was used for analysis.
MDC staining
MCF-7 or MDA-MB-231 cells (~1×10⁵/well)
were seeded into 12-well plates and incubated overnight at 37°C in
a humidified atmosphere with 5% CO2. Next, cells were
treated with 5 μM 053 and 30 or 60 μM CQ for 24 h.
The cells were stained according to the MDC Staining Assay Kit
(cat. no. C3018M; Beyotime Biotechnology) and detected by flow
cytometry (MoFlo XDP). FlowJo software was used for analysis.
Brightfield microscopy
MCF-7 or MDA-MB-231 cells (~1×10⁵/well)
were seeded into 12-well plates and incubated overnight at 37°C in
a humidified atmosphere with 5% CO2. Next, cells were
treated with different concentrations of 053 (0, 2.5, 5, 10 or 20
μM) for 24 h. Micrographs were obtained using an inverted
fluorescence microscope.
Transmission electron microscopy
MCF-7 or MDA-MB-231 cells (~1×10⁵/well)
were seeded into 12-well plates and incubated overnight at 37°C in
a humidified atmosphere with 5% CO2. Next, cells were
treated with 5 μM 053 for 24 h. The cells were collected,
washed once with PBS and then resuspended in 2.5% glutaraldehyde
and fixed at 4°C for 24 h. After gradual dehydration with ethanol,
the cells were treated with acetone for 10 min, followed by
treatment with a mixture of epoxy resin and acetone. Finally, the
samples were embedded in resin and subjected to ultrathin
sectioning at a thickness of 60 nm. The sections were stained with
uranyl acetate for 15 min at room temperature, washed twice with
distilled water and subsequently stained with lead citrate for 5
min at room temperature. After a final thorough wash with ultrapure
water, the samples were observed and imaged under the transmission
electron microscope. Images were observed and captured using a FEI
Tecnai 12 BioTwin transmission electron microscope (FEI; Thermo
Fisher Scientific, Inc.).
Cell viability
MDA-MB-231 or 4T1 cells (~2×10³/well)
were seeded into 96-well plates and incubated for 24 h at 37°C in a
humidified atmosphere with 5% CO2. After which, the
cells were treated with 053 (0, 2.5, 5, 10 or 20 μM), 10
μM docetaxel (DOC), 50 μM DDP, 80 μM GEM, 0.1
μM PTX or 50 μM 5-fluoro-2,4-pyrimidinedione (5-FU)
alone or combined with 053 (5 μM) for 24 h. The CellTiter
96® AQueous One Solution Cell Proliferation Assay (cat.
no. G3581; Promega Corporation) was used to detect cell growth
inhibition activity. Finally, the absorbance at 490 nm was measured
using a microplate reader (Corona Electric Co., Ltd.). T cells
(~2×10³/well) were seeded into 96-well plates, and
treated with 053 (0, 2.5, 5, 10 or 20 μM) for 24 h.
T cells were co-cultured with MDA-MB-231 cells at a
1:1 ratio, both of which were treated with 053 (0, 2.5, 5, 10 or 20
μM) for 24 h. The ATP Detection Assay Kit (cat. no. S0026;
Beyotime Biotechnology) was used to evaluate T cell proliferation,
and the relative light unit values were measured using a
luminometer.
Western blotting
Western blot analysis was performed to evaluate the
effects of compound 053, CQ or RAPA on the protein levels of LC3,
p62, mTOR, phosphorylated (p-)mTOR, AKT and p-AKT. Western blot
analysis was also conducted to assess the effects of compound 053,
ADM, GEM and CQ on the protein levels of co-stimulatory and
co-inhibitory molecules on the surface of T cells. Total proteins
were extracted from cells with RIPA lysis buffer (cat. no. PC101;
Shanghai Epizyme Biopharmaceutical Technology Co., Ltd.; Ipsen
Pharma) and the BCA Protein Assay Kit (cat. no. P0012; Beyotime
Biotechnology) was used for protein quantification. Equal amounts
of protein (30 μg) were separated on a 12.5% SDS-PAGE gel
(cat. no. PG113; Shanghai Epizyme Biopharmaceutical Technology Co.,
Ltd.; Ipsen Pharma) and transferred to a nitrocellulose transfer
membrane (cat. no. 66485; Pall Corporation). The membrane was
blocked by 5% w/v non-fat dry milk at room temperature for 1 h and
incubated with the LC3B (cat. no. 83506; 1:1,000), p62 (cat. no.
88588; 1:1,000), AKT (cat. no. 4691; 1:1,000), p-AKT (cat. no.
9271; 1:1,000), p-mTOR (cat. no. 5536; 1:1,000), mTOR (cat. no.
2983; 1:1,000), T-cell immunoglobulin and mucin domain-containing
protein 3 (TIM3; cat. no. 45208; 1:1,000), programmed cell death
protein 1 (PD-1; cat. no. 86163; 1:1,000), V-domain immunoglobulin
suppressor of T-cell activation (VISTA; cat. no. 54979; 1:1,000),
CD40 ligand (CD40L; cat. no. 15094; 1:1,000) (all from Cell
Signaling Technology, Inc.), tumor necrosis factor receptor
superfamily, member 4 (OX40; cat. no. ab264466; 1:1,000; Abcam) and
tumor necrosis factor receptor superfamily, member 9 (4-1BB; cat.
no. ab68185; 1:1,000; Abcam) antibodies overnight at 4°C. After
washing the primary antibody away with 1X TBST (0.1% Tween-20), the
membrane was incubated with the secondary antibody goat anti-mouse
IgG (HRP conjugated; 1:10,000; cat. no. LF101; Shanghai Epizyme
Biotech Co., Ltd.) or goat anti-rabbit IgG (HRP conjugated;
1:10,000; cat. no. LF102; Shanghai Epizyme Biotech Co., Ltd.) for 1
h at room temperature. The chemiluminescence detection was
ultimately performed using a FluorChem E digital darkroom system
(Bio-Techne).
Apoptosis assay
MDA-MB-231 cells (~1×10⁵/well) were
seeded into 12-well plates and incubated overnight at 37°C in a
humidified atmosphere with 5% CO2. The commonly used
concentrations of DOC in in vitro cell experiments range
from 0 to 10 μM (24,25). Short-term high doses are used to
observe rapid cytotoxicity or changes in signaling pathways.
Experiments with sensitive cell lines (Luminal) typically use
50-100 nM, while invasive cell lines (TNBC) typically use 1-10
μM (26). Clinically,
intravenous injections of 75-100 mg/m2 DOC are
administered, which require individualized adjustment. Clinical
doses for the Luminal-type are typically 75 mg/m2,
recommended clinical doses for the HER2-positive type are 75-100
mg/m2 and high-dose 100 mg/m2 is used for
TNBC (27,28). In the present study, the cells
were treated with 053 (0, 5 or 10 μM), DOC (10 μM),
DDP (50 μM), GEM (80 μM), PTX (0.1 μM) and
5-FU (50 μM) alone or combined with 053 (5 μM) for 24
h. Subsequently, the cells were collected and washed with Annexin
V-FITC binding buffer (cat. no. C1062S; Beyotime Biotechnology)
twice, resuspended with staining solution containing 5 μl
Annexin V-FITC and 5 μl PI (cat. no. C1062S; Beyotime
Biotechnology) and incubated for 30 min in the dark. Finally, cell
apoptosis was assessed using flow cytometry (MoFlo XDP). FlowJo
software was used for analysis.
Reactive oxygen species (ROS) assay
MCF-7 or MDA-MB-231 cells (~1×10⁵/well)
were seeded into 12-well plates and incubated overnight at 37°C in
a humidified atmosphere with 5% CO2. After which, the
cells were treated with different concentrations of 053 (0, 2.5, 5
or 10 μM) for 24 h. A ROS Assay Kit (cat. no. CM-H2DCFDA;
Beyotime Biotechnology) was used to detect intracellular ROS level
of cells, and fluorescence was measured using a flow cytometer
(MoFlo XDP). FlowJo software was used for analysis.
Multi-color flow cytometry assay
MDA-MB-231 or 4T1 cells (~1×10⁵/well)
were seeded into 12-well plates and incubated overnight at 37°C in
a humidified atmosphere with 5% CO2. After which, the
cells were treated with different concentrations of 053 (0, 5 and
10 μM) for 24 h. Next, MDA-MB-231 or 4T1 cells were
collected for PD-L1/B7-H1-PE (cat. no. 10084-R312-P; 1:25; Beijing
Sino Technology Co. Ltd) antibody labelling. T cells
(~1×10⁵/well) were seeded into 6-well plates and treated
with concentrations of 053 (0, 5 and 10 μM) for 24 h. T
cells were co-cultured with MDA-MB-231 cells at a 1:1 ratio, both
of which were treated with 053 (0, 5 or 10 μM) for 24 h.
Treated T cells were collected for CD3-BV650 (cat. no. A07749;
1:25; Beckman Coulter, Inc.), CD4-APC-H7 (cat. no. 737660; 1:25;
Beckman Coulter, Inc.), CD8-PE-CY7 (cat. no. 6604728; 1:25; Beckman
Coulter, Inc.), IFN-γ-FITC (cat. no. 11-7319-82; 1:25; eBioscience;
Thermo Fisher Scientific, Inc.), Granzyme B-FITC (cat. no. 560211;
1:25; BD Pharmingen; BD Biosciences), PD-1-BV421 (cat. no. 564323;
1:25; BD Biosciences), TIM3-RB705 (cat. no. 570584; 1:25; BD
Biosciences), OX-40-RB705 (cat. no. 757846; 1:25; BD Biosciences),
4-1BB-RY603 (cat. no. 759418; 1:25; BD Biosciences) and inducible
T-cell Co-stimulator (ICOS-R718; cat. no. 751854; 1:25; BD
Biosciences) antibody labeling. Finally, after incubating for 30
min at room temperature in the dark, the assay was performed using
flow cytometry (MoFlo XDP). FlowJo software was used for analysis.
The flow cytometry gating strategy involved labelling T cells with
CD3 to assess the expression of PD-1, TIM3, OX-40, 4-1BB and ICOS
on the surface of T cells. CD3+ T cells were then
separated into CD3+CD8+ T cells or
CD3+CD4+ T cells, then IFN-γ and granzyme B
were detected.
In vivo xenograft experiment
A total of 24 BALB/cJ female nude mice (age, 5-6
weeks; weight, 16-20 g) and 24 BALB/c female mice (age, 5-6 weeks;
weight, 10-14 g) were purchased from GemPharmatech Co. Ltd. and
housed in a specialized pathogen-free environment (20-25°C;
humidity, 40-60%; 12-h light/dark cycle and ad libitum
access to food and water). Animals were checked daily and any
animal found unexpectedly to be moribund, cachectic or unable to
obtain food or water was sacrificed. However, no such cases
occurred during the present study. The in vivo mouse study
procedure was performed according to The Laboratory Animal Ethics
Committee of The College of Biological Sciences and Engineering,
Fuzhou University (Fuzhou, China; approval no. 2022-SG-022). In
strict compliance with animal welfare guidelines, the tumor burden
was maintained within ethical limits: Tumor weight did not exceed
10% of the mouse body weight (10% indicates: subcutaneous tumors on
the backs of 25 g mice reached a diameter of ~17 mm), the average
tumor diameter remained under 20 mm and the tumor volume was kept
below 2,000 mm3. After 7 days, when the mice had
acclimatized to the new environment, 5×10⁶ MDA-MB-231
cells were injected subcutaneously into the left hindlimbs of
BALB/cJ nude mice and 2×10⁶ 4T1 cells were injected
subcutaneously into the left hindlimbs of BALB/c mice. When the
tumor volume measured ~100 mm3 (7 days, recorded as day
0), mice were randomly divided into the following four groups
(n=5/group): i) PBS (control); ii) 053; iii) GEM; and iv) 053+ GEM.
During the experiment, the health and behavior of the mice were
monitored daily. Following tumor formation, intravenous injections
via the tail vein were administered every 3 days at a dosage of 150
μl per mouse for a period of 3 weeks, totaling 7 injections.
The administered agents consisted of normal saline, 053 (10 mg/kg),
GEM (10 mg/kg) or a combination of 053 (5 mg/kg) and GEM (5 mg/kg).
The body weight, tumor length and width were measured every 3 days,
and the tumor volume was calculated according to the formula: Tumor
volume=(longest diameter × shortest diameter2)/2. At the
end of the study (21 days post-injection), mice were euthanized
following deep anesthesia using isoflurane (5% for induction, 2%
for maintenance). CO2 inhalation was used to complete
euthanasia at a displacement rate of 30-70% of the chamber volume
per min. Following euthanasia by carbon dioxide inhalation,
cervical dislocation was performed to confirm death (evidenced by a
visible gap between the skull and the spine), and death was further
verified by the absence of respiration. After euthanasia, the
tumors, heart, liver, spleen, lungs and kidneys were excised and
immediately placed in either 4% paraformaldehyde or tissue
preservation solution (cat. no. HY-K6010; MedChemExpress), followed
by storage at 4°C for subsequent analysis. All mice were euthanized
at the planned end of the experiment.
Tumor tissue was transferred to an Eppendorf tube
and cut into small fragments. Tumor tissue digestion solution (cat.
no. abs50090-10T; Absin Bioscience Inc.) was then added for
digestion into a single-cell suspension. After which, the
single-cell suspension was slowly added to a centrifuge tube
containing 4 ml Ficoll Paque PREMIUM and centrifuged at 2,000 × g
with an acceleration of 8 and a deceleration of 0 for 20 min at
room temperature. The middle white membrane layer was collected and
washed twice with PBS, followed by labeling with Fixable Viability
Stain 510 (FVS510; cat. no. 564406; 1:1,000), CD45-APC-CY7 (cat.
no. 557659; 1:25), CD3-APC (cat. no. 565643; 1:25), CD4-BV605 (cat.
no. 563151; 1:25), CD8a-PE-CY7 (cat. no. 552877; 1:25), PD-1-BV421
(cat. no. 748268; 1:25), TIM3-BV650 (cat. no. 747623; 1:25),
OX-40-BV605 (cat. no. 740545; 1:25), ICOS-BB515 (cat. no. 565880;
1:25) and 4-1BB-BV421 (cat. no. 740033; 1:25) (all from BD
Biosciences). The tumor cells at the bottom were collected and
washed twice with PBS, followed by labeling with FVS510 and PD-L1
(cat. no. 758168; 1:25; BD Biosciences). The assay was performed
using flow cytometry (MoFlo XDP). FlowJo software was used for
analysis. The flow cytometry gating strategy used FVS510 to
identify the viable tumor cell population and detect PD-L1
expression. Viable lymphocyte populations were identified using
FVS510 and CD45, followed by CD3 marking of T cells to detect the
expression of PD-1, TIM3, OX-40, 4-1BB and ICOS on the surface of T
cells and further detection of the proportions of
CD3+CD8+ T cells and
CD3+CD4+ T cells.
Biological tissue sections test
Tissues including major organs and tumors were
collected from mouse xenograft models and fixed in 4%
paraformaldehyde at 4°C for 24 h, followed by paraffin embedding.
Sections (5 μm) were prepared from the paraffin-embedded
blocks, dewaxed in xylene and immersed in EDTA antigen retrieval
buffer. Subsequently, hematoxylin and eosin (H&E) staining was
performed. The sections were stained with 1% hematoxylin for 5 min
at room temperature, treated with 1% acid alcohol for 45 sec and
then counterstained with eosin for 2 min at room temperature. After
dehydration through a graded series of ethanol (70, 85, 95 and
100%), the sections were cleared in xylene and finally mounted with
neutral resin. The results were observed under an optical
microscope.
For immunohistochemical detection, paraffin-embedded
sections were dewaxed in xylene and rehydrated through a graded
ethanol series. For antigen retrieval, the sections were heated in
citrate buffer at 100°C for 10 min. For the detection of
intracellular epitopes (Ki67/LC3/p62), permeabilization was first
performed with 0.1% Triton X-100 (20 min, room temperature),
followed by quenching of endogenous peroxidase activity with 3%
H2O2 (20 min, room temperature). The sections
were then blocked with 5% BSA for 1 h at room temperature and
subsequently incubated overnight at 4°C with the following primary
antibodies: Anti-Ki67 antibody (cat. no. GB111499-100; 1:1,000;
Wuhan Servicebio Technology Co., Ltd), anti-LC3 antibody (cat. no.
81004-1-RR; 1:1,000; Proteintech Group, Inc), anti-p62 antibody
(cat. no. GB11239-1-100; 1:1,000; Wuhan Servicebio Technology Co.,
Ltd), anti-PD-L1 antibody (cat. no. GB150059-100; 1:1,000; Wuhan
Servicebio Technology Co., Ltd), anti-PD-L2 antibody (cat. no.
27406-1-AP; 1:4,000; Proteintech Group, Inc), anti-CD3 antibody
(cat. no. GB11014-100; 1:1,000; Wuhan Servicebio Technology Co.,
Ltd), anti-CD4 antibody (cat. no. GB11064-100; 1:1,000; Wuhan
Servicebio Technology Co., Ltd), anti-CD8 antibody (cat. no.
GB11068; 1:1,000; Wuhan Servicebio Technology Co., Ltd),
anti-4-1BB/CD137 antibody (cat. no. A2025; 1:200; ABclonal Biotech
Co., Ltd), anti-CD134/OX40 antibody (cat. no. 32621-1-AP; 1:500;
Proteintech Group, Inc), anti-PD1 antibody (cat. no. GB153744-100;
1:400; Wuhan Servicebio Technology Co., Ltd) and anti-TIM3 antibody
(cat. no. 11872-1-AP; 1:1,000; Proteintech Group, Inc).
Subsequently, the samples were incubated with HRP-conjugated goat
anti-rabbit IgG (cat. no. GB23303; 1:5,000; Wuhan Servicebio
Technology Co., Ltd) or HRP-conjugated goat anti-mouse IgG (cat.
no. GB23301; 1:5,000; Wuhan Servicebio Technology Co., Ltd) at 37°C
for 1 h. Following this, staining was performed with DAB chromogen
for 15 min (cat. no. G1211; Wuhan Servicebio Technology Co., Ltd),
and hematoxylin was used as a counterstain for 3 min at room
temperature. Finally, dehydration was conducted using a graded
ethanol series, followed by immersion in xylene, and mounting with
neutral balsam. The results were observed under an optical
microscope.
Following permeabilization with Proteinase K (20
μg/ml; 37°C, 20 min), TUNEL assay was performed using the
commercial kit (cat. no. G1501; Wuhan Servicebio Technology Co.,
Ltd) according to the manufacturer's instructions. The sections
were then directly mounted with an antifade mounting medium
containing DAPI (cat. no. P0126; Beyotime Biotechnology). All
section images were acquired using a fluorescence microscope.
Statistical analysis
GraphPad Prism 9.0 software (Dotmatics) or FlowJo
software (v10.8.1; BD Biosciences) were used for data analysis. All
results are expressed as the mean ± standard error. Statistical
significance was evaluated using one-way analysis of variance and
post hoc comparisons were performed using Dunnett's multiple
comparisons test to compare all experimental groups against a
single control group, while controlling the family-wise error rate
under multiple testing conditions. P<0.05 was considered to
indicate a statistically significant difference.
Results
Preliminary characterization of compound
053 on autophagy regulatory function
The structural formula of compound 053 is shown in
Fig. 1A. The preliminary
investigation was conducted using the tandem mRFP-GFP-LC3B reporter
system. During autophagosome-lysosome fusion, only red fluorescence
was detectable as the acidic lysosomal environment quenches GFP
fluorescence while mRFP remains stable. When autophagy was
inhibited, cytoplasmic yellow fluorescence of mRFP-GFP-LC3B was
observed, resulting from co-localization of mRFP and GFP signals
due to impaired autophagosome-lysosome fusion. In 053-treated MCF-7
cells, the number of GFP/mRFP-labeled LC3B puncta was significantly
increased compared with control, with both the 053- and CQ-treated
groups exhibiting enhanced yellow fluorescence, suggesting that
compound 053 may regulate the autophagic process in breast cancer
cells (Fig. S1C and D). The
synthesis, detailed synthetic procedure and characterization of
compound 053 are described in Data S1 (Figs. S2-S14).
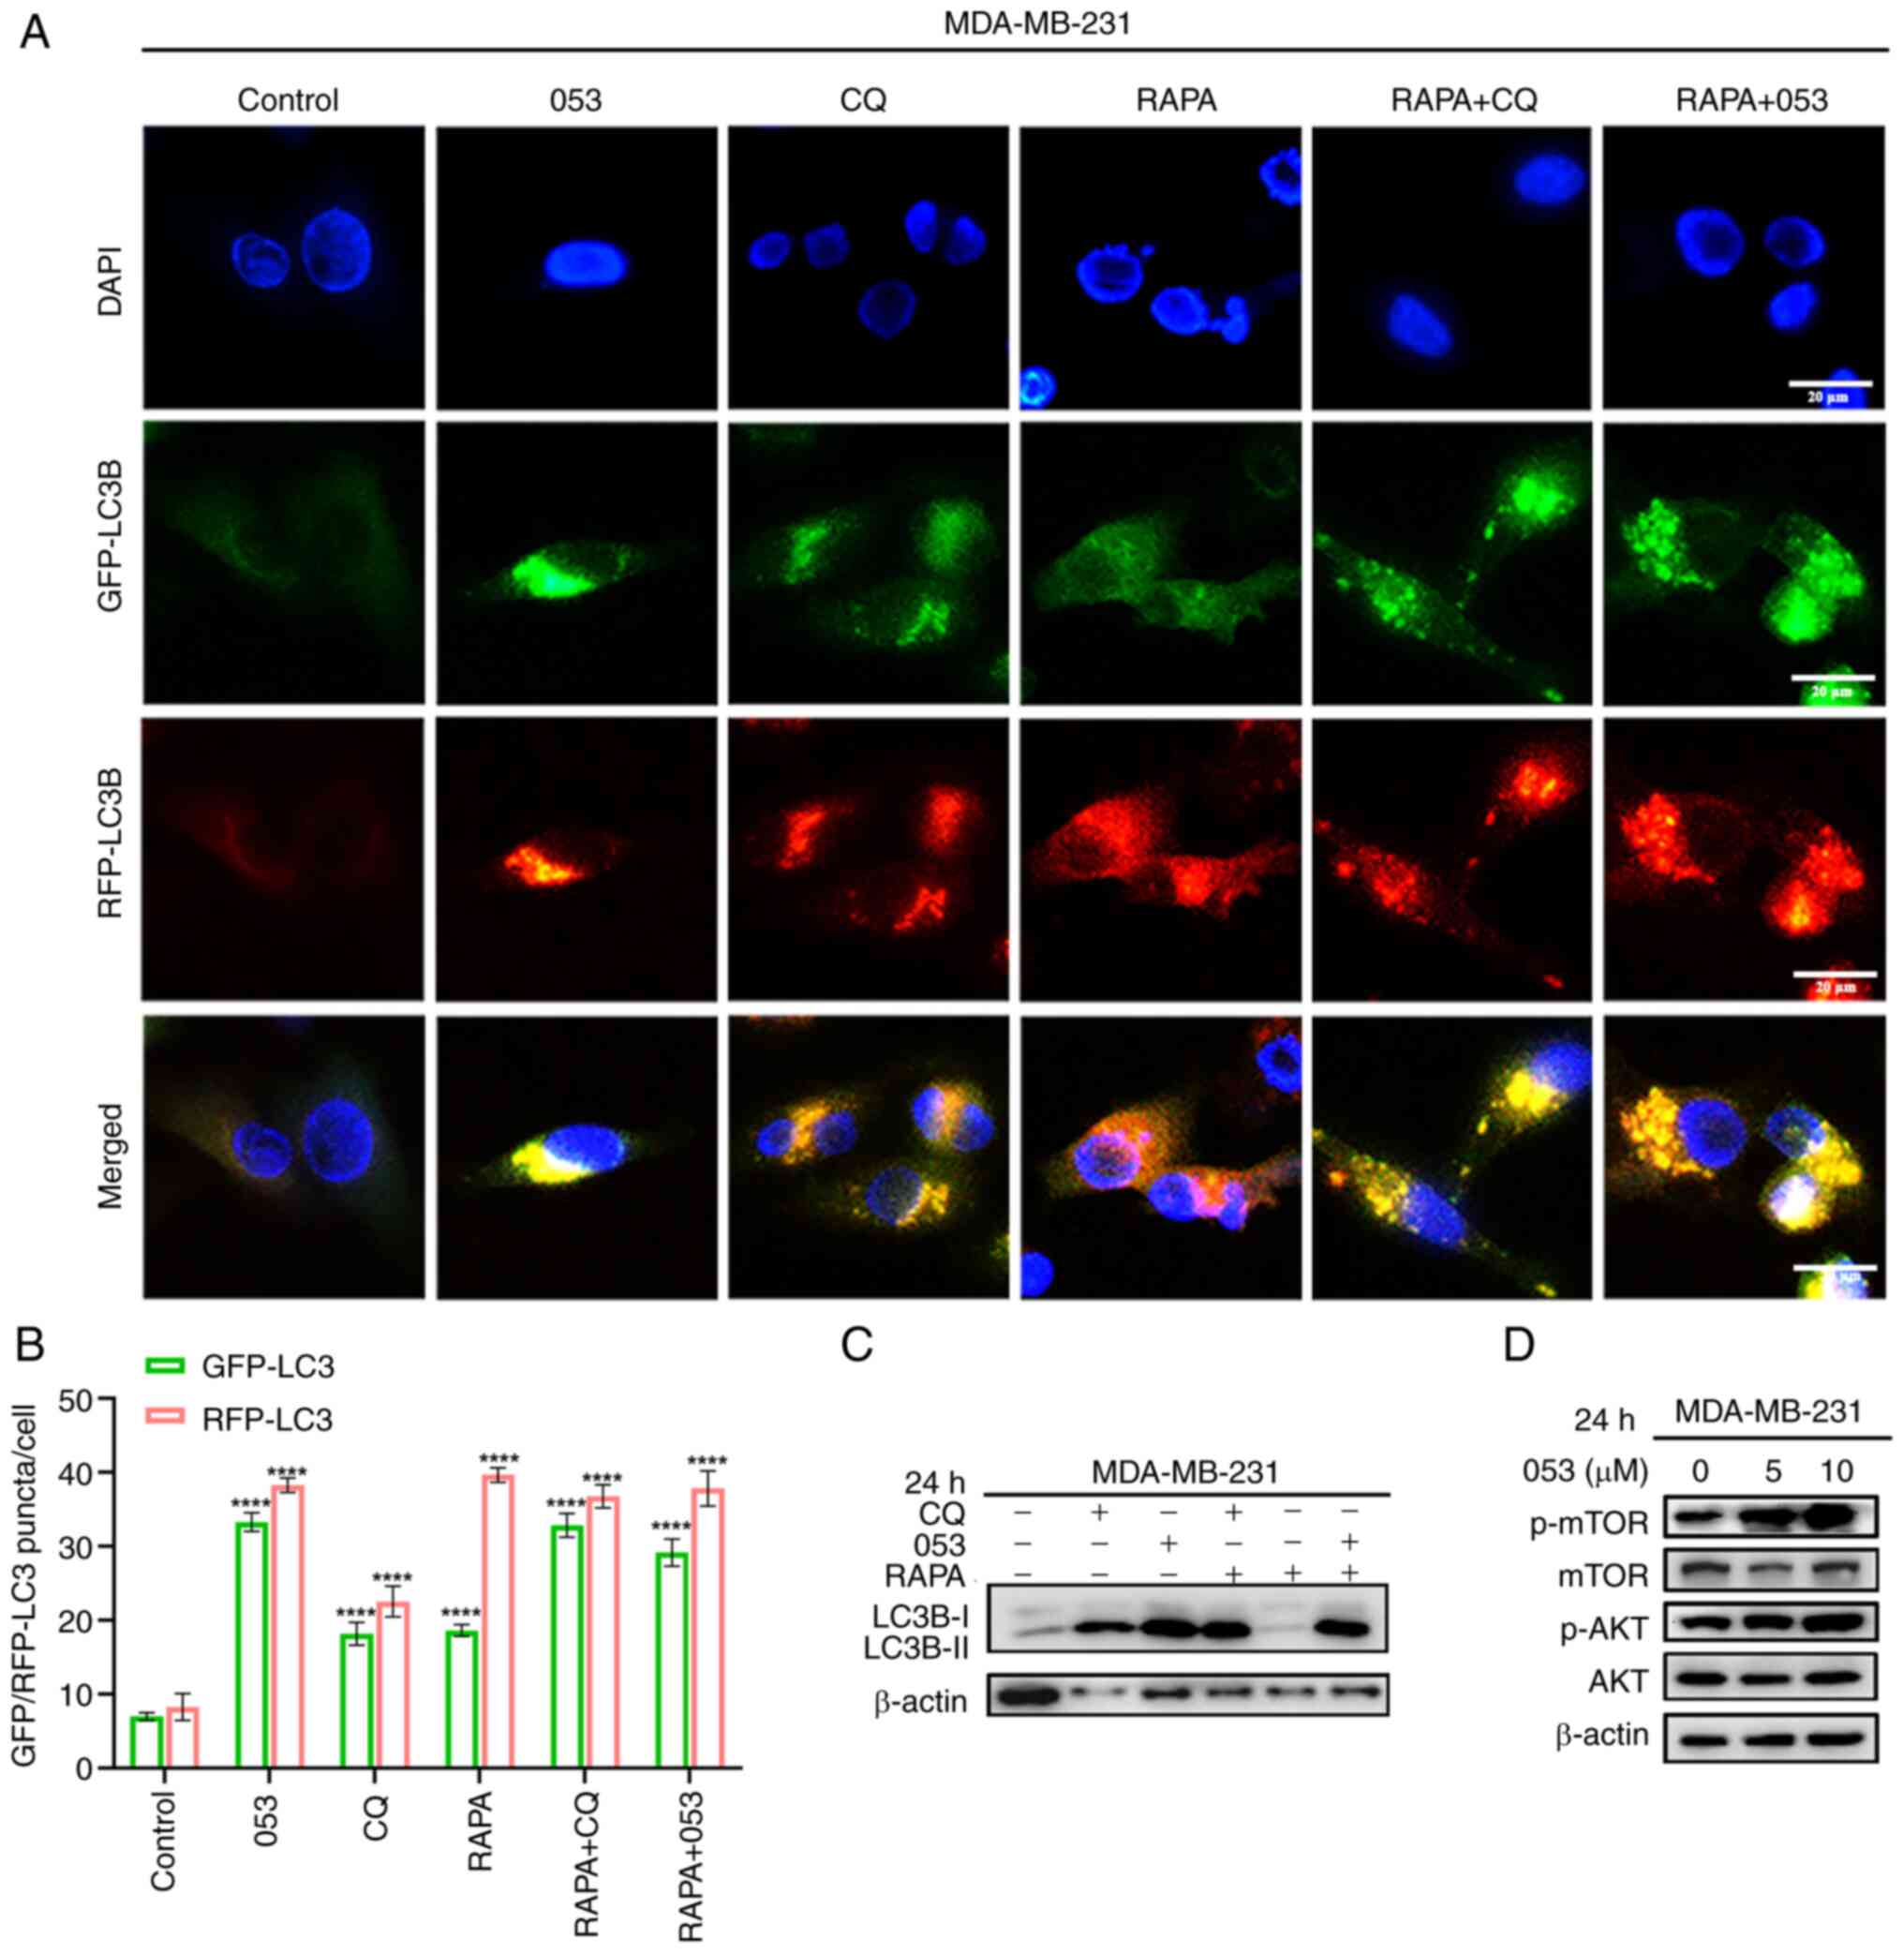
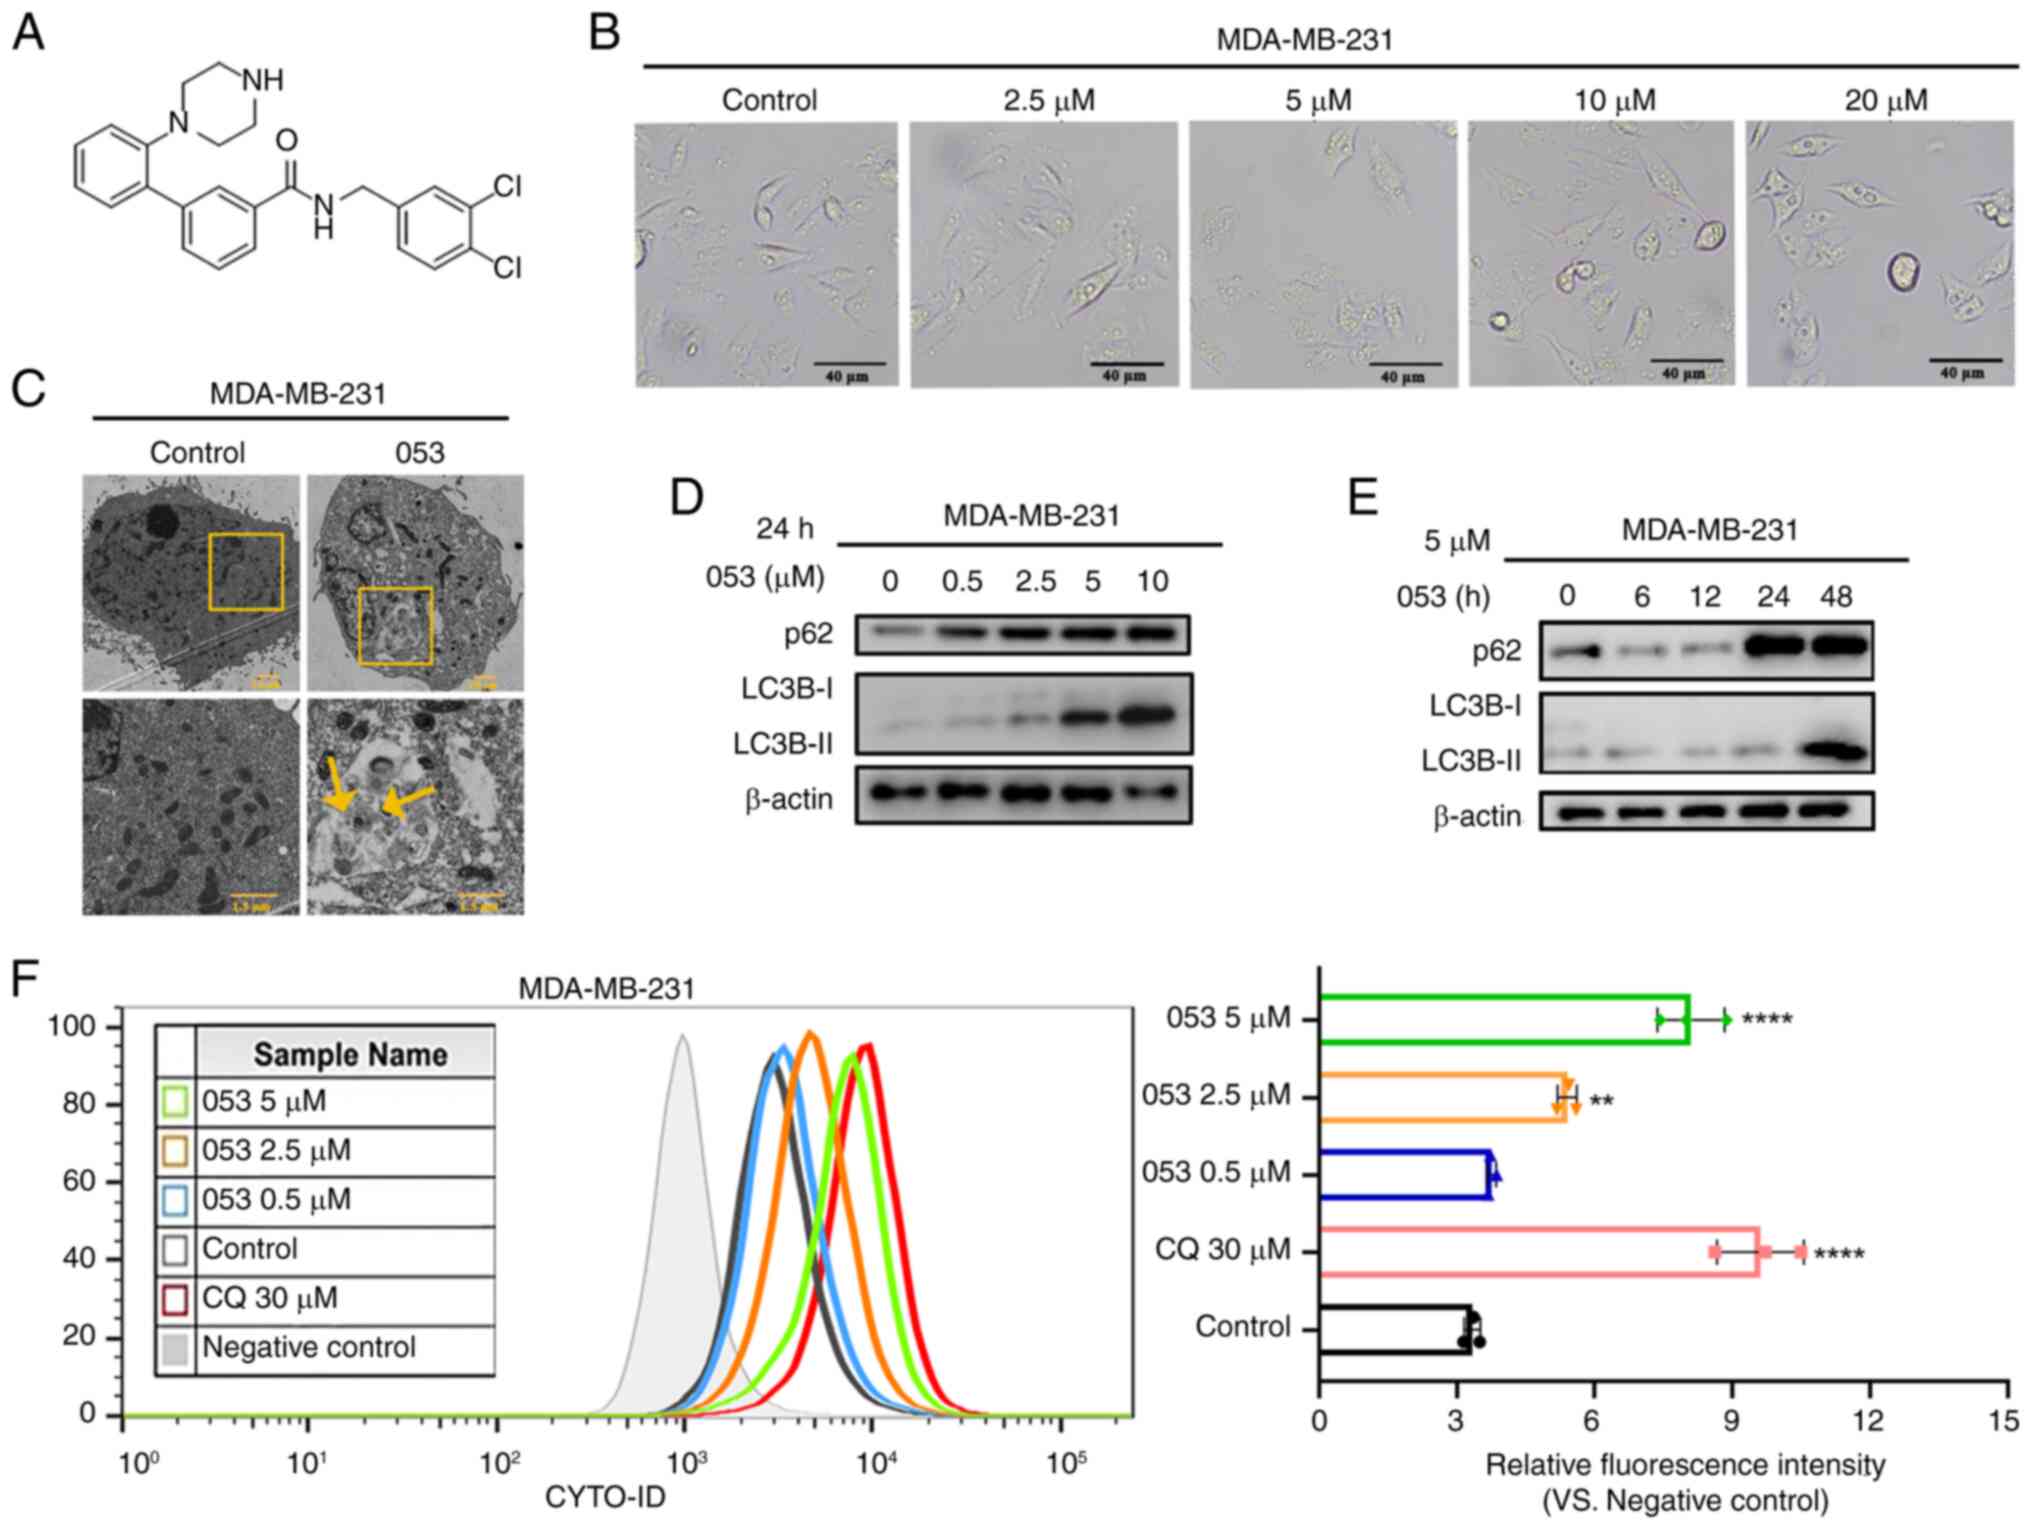 | Figure 1Compound 053 inhibits late autophagy
in MDA-MB-231 cells. (A) Chemical structural formula of 053. The
relative molecular mass of 053 is 440.37 g/mol. (B) Representative
microscope images of MDA-MB-231 cells treated with different
concentrations of 053 (0-20 μM) for 24 h. Scale bar, 40
μm. (C) Internal structure of MDA-MB-231 cells under
transmission electron microscopy after treatment with 5 μM
053 for 24 h. The lower image is a magnified view of the yellow box
in the image above. Scale bar, 1.5 μm. (D) Protein levels of
p62 and LC3B-Ⅰ/Ⅱ in MDA-MB-231 cells were analyzed by western
blotting after treatment with 053 (0-10 μM) for 24 h. (E)
MDA-MB-231 cells were treated with 5 μM 053 for different
times (0, 6, 12, 24 and 48 h), and the protein levels of p62 and
LC3B-Ⅰ/Ⅱ were analyzed by western blotting. (F) Flow cytometry was
used to detect the fluorescence intensity of autophagy-related
vesicles stained with CYTO-ID in MDA-MB-231 cells. Cells were
treated with 053 (0-5 μM) or CQ (30 μM) for 24 h. The
bar graph shows quantitative analysis of relative fluorescence
intensity. Data are presented as mean ± SEM (n=3). Statistical
significance was determined by one-way ANOVA followed by Dunnett's
multiple comparisons test to compare all experimental groups
against a single control group. **P<0.01 and
****P<0.0001 vs. Control. 053, FZU-0045-053;
p62/SQSTM1, sequestosome 1; LC3B, microtubule-associated protein
1A/1B-light chain 3B; CQ, chloroquine. |
Similar to CQ, compound 053 inhibits late
autophagy in breast cancer cells
In the present study, the effects of compound 053 on
the MDA-MB-231 and MCF-7 breast cancer cell lines were examined to
facilitate a comparative analysis of their regulatory impacts. In
the cell morphology analysis, it was found that with increased 053
concentration, cytoplasmic vacuolization was induced in MDA-MB-231
cells with the appearance of a large number of vesicles, which was
accompanied by a reduction of the cell volume (Fig. 1B), suggesting that 053 may
regulate autophagic flux while promoting apoptosis. To further
demonstrate that 053 regulates autophagy, ultrastructural studies
were performed. Compared with the control group, the number of
vacuoles was increased in 053-treated MDA-MB-231 cells, and
autophagic vesicles formed in the cytoplasm contained recognizable
double-membrane structures and undegraded cargo (Fig. 1C).
LC3B-I/II is a protein marker that is intricately
related to the autophagy process and has been used to monitor
autophagy (29). The adaptor
protein p62 connects autophagosomes to their substrates and serves
as a molecular regulator in the process of cellular autophagy.
Elevated levels of p62 typically reflect the blockage of autophagic
flux (30). In addition, the
accumulation of autophagosomes may be associated with the
activation of autophagy or the suppression of late-stage autophagy.
Therefore, the protein levels of p62 were detected using western
blotting to clarify the role of 053 in the regulation of autophagy.
The results showed that the protein levels of p62 and LC3B-II
exhibited an increase in a manner that was both time- and
concentration-dependent following the application of 053 to
MDA-MB-231 cells (Fig. 1D and
E).
The CYTO-ID probe labels vacuoles associated with
the autophagy pathway, whereby the green dye typically accumulates
in spherical vacuoles around the nucleus. CQ, a late-stage
autophagy inhibitor, primarily inhibits autophagy by blocking the
fusion of autophagosomes with lysosomes (31). To further explore the role of 053
in the regulation of autophagy in both cell lines, CYTO-ID staining
was conducted, followed by quantitative analysis using flow
cytometry. The fluorescence intensity of CYTO-ID in MDA-MB-231
cells was gradually enhanced with increasing 053 concentration
(Fig. 1F). Treatment of MCF-7
cells with 053 significantly increased vesicle accumulation, while
p62 and LC3B-II protein levels exhibited time- and
concentration-dependent elevation (Fig. S15A-D). Concurrently, CYTO-ID
fluorescence intensity progressively increased with increasing 053
concentrations (Fig. S15E).
These results demonstrated that compound 053 shares similar effects
with CQ in promoting the accumulation of acidic autophagic vesicles
and upregulating autophagy-related proteins (particularly p62 and
LC3B-II) in breast cancer cells. These findings indicate that 053
likely suppresses late-stage autophagy by blocking autophagic flux,
rather than inducing autophagy.
To confirm the effect of 053 on autophagic flux, the
tandem mRFP-GFP-LC3B reporter gene was used for observation. The
results demonstrated that both red and green fluorescence were
enhanced by the action of 053 and CQ compared with the control
group, and the yellow fluorescence was further enhanced by the
co-localized superposition of red and green fluorescence. By
contrast, the GFP fluorescence signal was weakened by the use of
the autophagy inducer RAPA alone, and only red fluorescence could
be detected by the superposition of red and green fluorescence,
which indicated that RAPA-induced autophagy accelerated autophagic
flux (Figs. 2A, B, S16A and S16B). Thus, it is evident that
053, similarly to CQ, may disrupt the autophagic flux by blocking
the fusion of autophagosomes and lysosomes at a late stage, leading
to the accumulation of autophagosomes rather than inducing
autophagy.
To further confirm that 053 is a late-stage
autophagy inhibitor that functions similarly to CQ, western
blotting was used to analyze the protein levels of LC3B in both
cell lines following treatment with 053, CQ and RAPA. It was found
that treatment with 053 or CQ alone increased the protein level of
LC3B-II in cells, while the autophagy inducer RAPA did not increase
the protein level of LC3B-II. This indicated that the efficiency of
autophagic lysosomal degradation was not affected by RAPA treatment
at this time, and that LC3B-II levels did not increase even when
autophagy was activated. However, when 053 or CQ was combined with
RAPA, LC3B-II protein resumed accumulation (Figs. 2C and S16C). The PI3K/AKT/mTOR signaling
pathway has been demonstrated to be a key pathway in the cellular
regulation of autophagy (32). It
was further verified whether the inhibitory effect of 053 on
autophagy in MDA-MB-231 and MCF-7 cells was associated with the
PI3K/AKT/mTOR signaling pathway. Notably, 053 specifically promoted
the phosphorylation of AKT and mTOR in MDA-MB-231 cells, while not
influencing the PI3K/AKT/mTOR signaling pathway in MCF-7 cells
(Figs. 2D and S16D). In conclusion, these results
suggested that 053 is a late autophagy inhibitor similar to CQ,
which may inhibit autophagy by blocking the fusion of
autophagosomes and lysosomes. The inhibitory effect of 053 on
autophagy in MDA-MB-231 cells is associated with the PI3K/AKT/mTOR
signaling pathway.
Compound 053 enhances chemosensitivity
and downregulates PD-L1 expression in breast cancer cells
Initially, the effect of compound 053 on the
viability of MCF-7 and MDA-MB-231 cells was evaluated using the
CellTiter 96® AQueous One Solution assay. As shown in
Figs. 3A and S17A, the results revealed that compound
053 significantly decreased the viability of 4T1, MDA-MB-231 and
MCF7 cells in a dose-dependent manner. Furthermore, the effect of
compound 053 on apoptosis in breast cancer cells was assessed using
the Annexin-V/PI assay and it was discovered that 053 could also
induce apoptosis in a concentration-dependent manner (Figs. 3B and S17B). To further investigate whether
the apoptosis and autophagy inhibition induced by 053 was
associated with intracellular ROS production, the effect of 053 on
ROS levels in MCF-7 and MDA-MB-231 cells was assessed using a
DCFH-DA probe. As shown in Figs.
3C and S17C, compound 053
did not alter ROS levels in MCF-7 and MDA-MB-231 cells, suggesting
that the apoptosis and autophagy inhibition mediated by 053 is not
associated with ROS levels in breast cancer cells. These findings
suggest that as the concentration of 053 increased, it inhibited
the proliferation of MCF-7 and MDA-MB-231 cells, while also
inducing apoptosis.
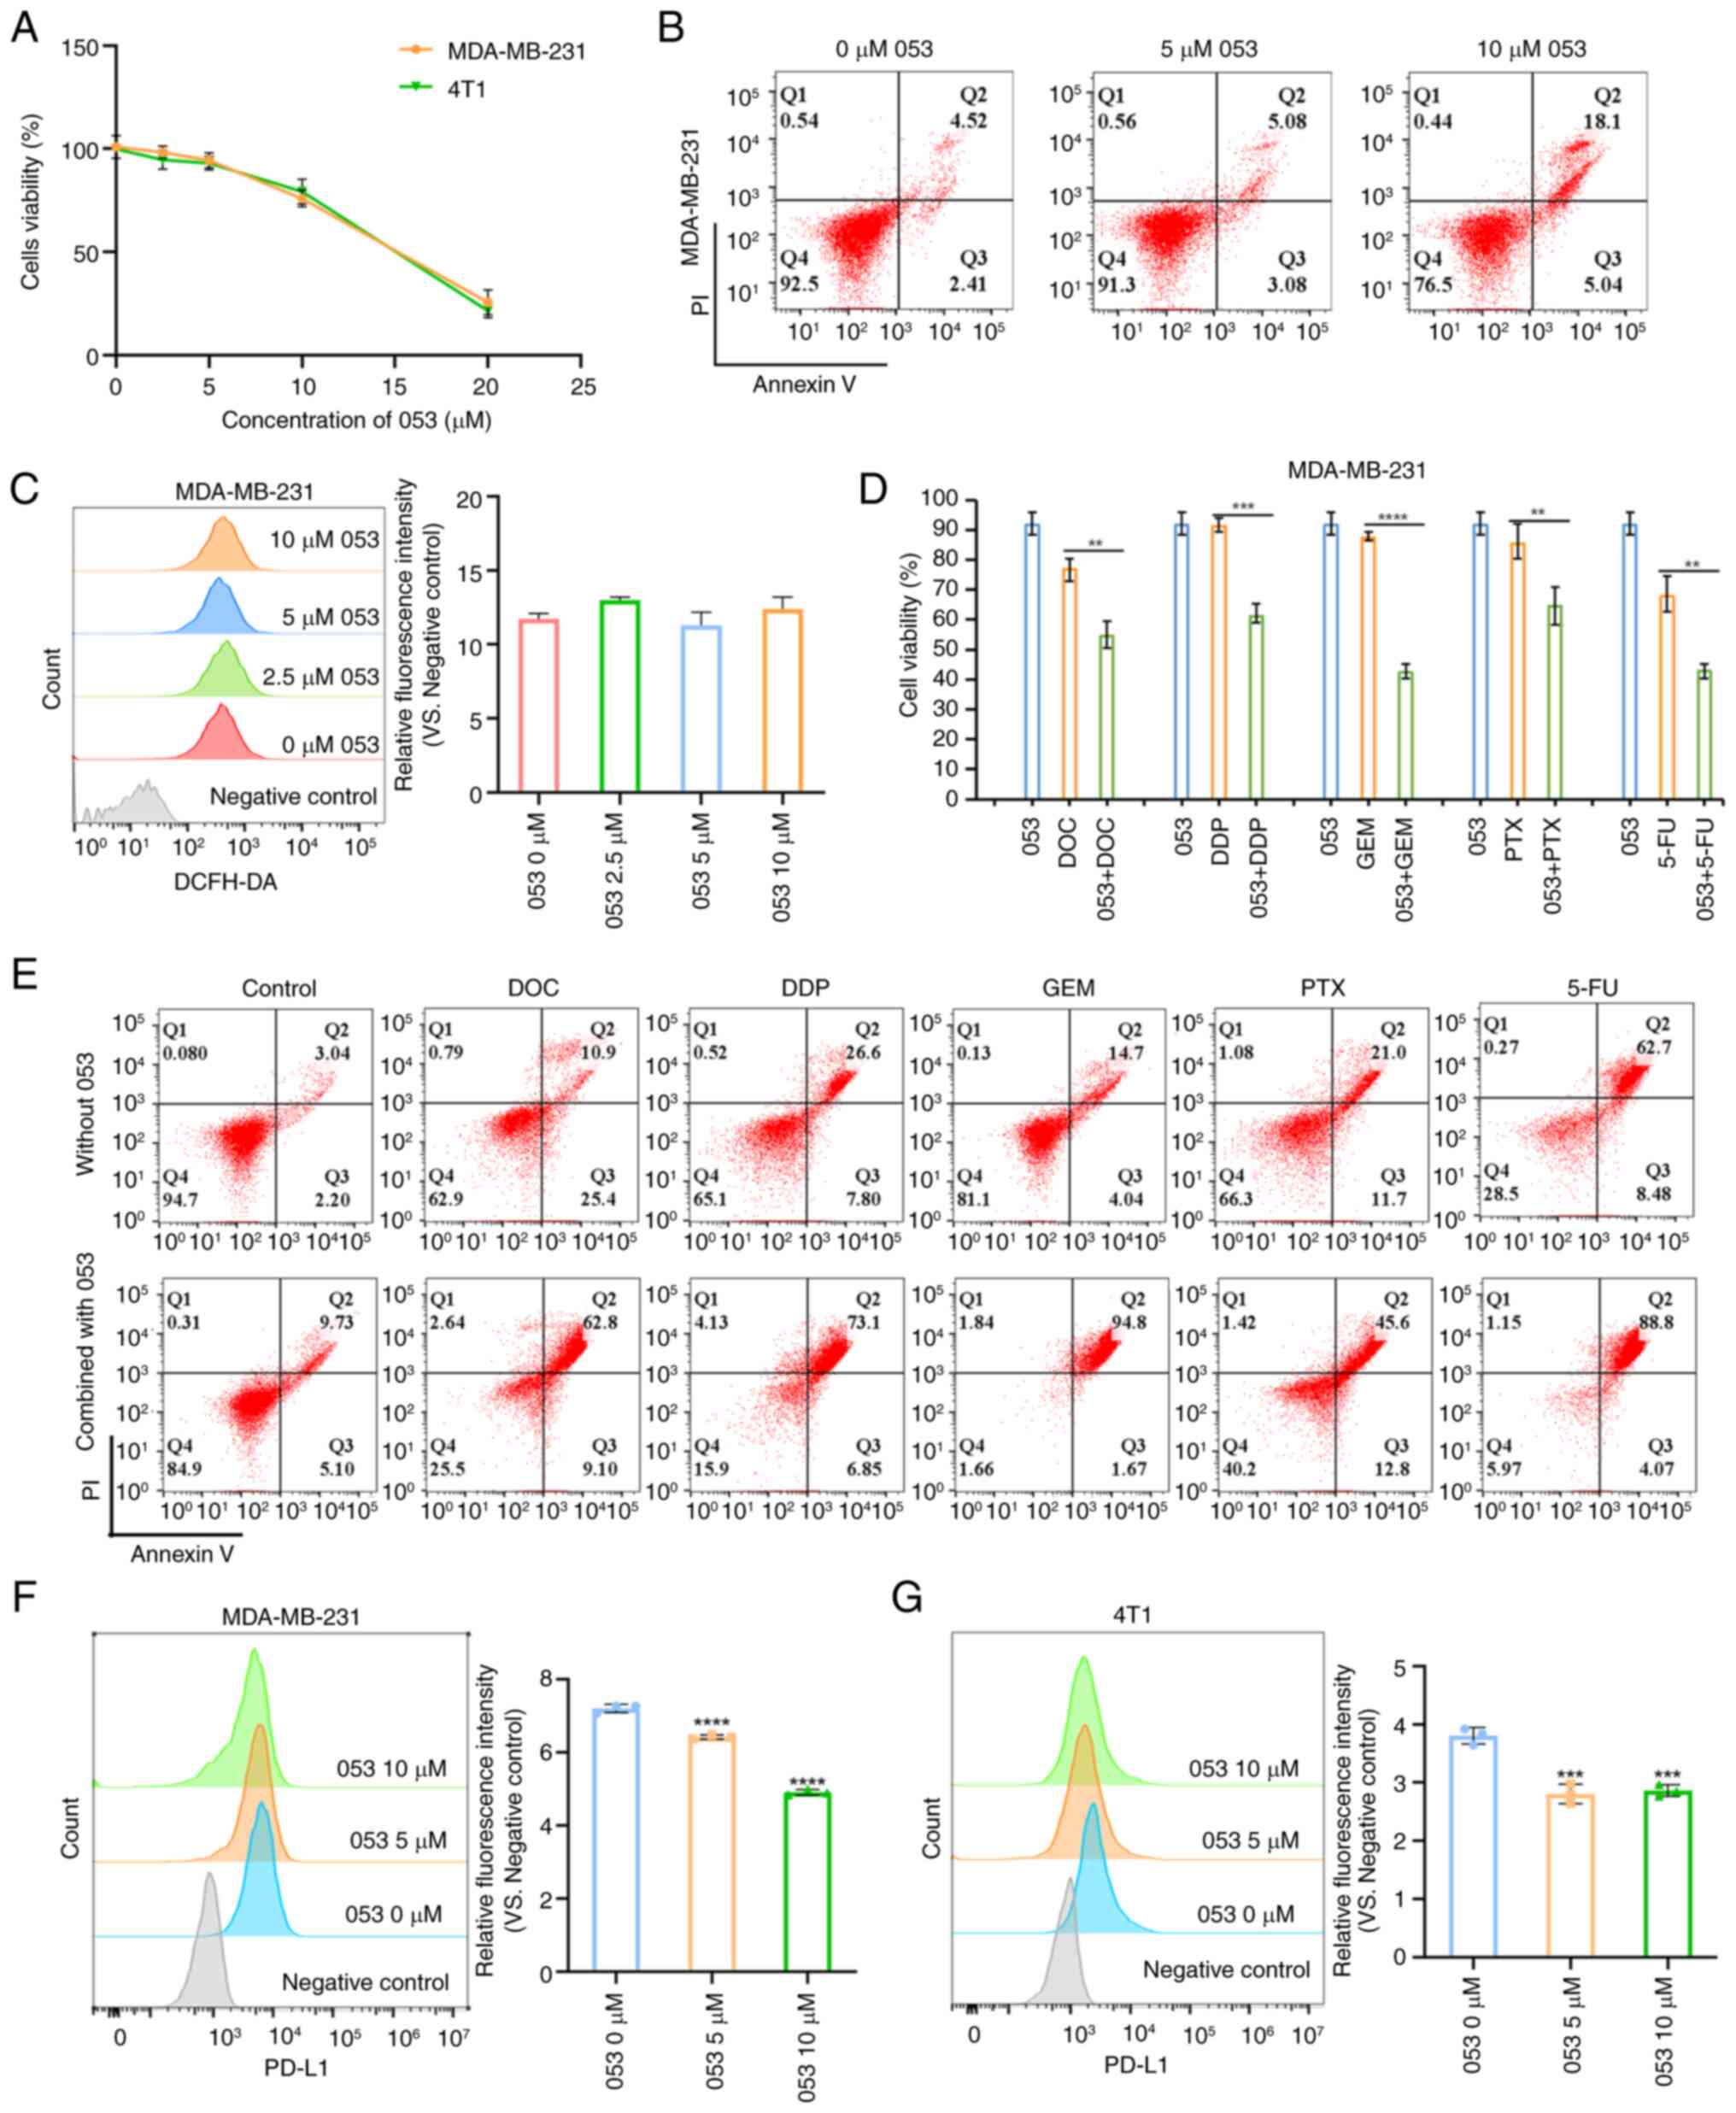 | Figure 3Compound 053 induces apoptosis and
downregulates PD-L1 expression in MDA-MB-231 cells. (A) CellTiter
96® AQueous One Solution Cell Proliferation Assay was
used to determine the proliferation of 4T1 and MDA-MB-231 cells
treated with 053 (0-20 μM) for 24 h. (B) The apoptosis of
MDA-MB-231 cells after treatment with 053 (0-10 μM) for 24 h
was analyzed by flow cytometry. (C) The ROS levels in MDA-MB-231
cells after treatment with 053 (0-10 μM) for 24 h was
analyzed by flow cytometry. The bar graph shows quantitative
analysis of relative fluorescence intensity. Data are presented as
mean ± SEM (n=3). Statistical significance was determined by
one-way ANOVA followed by Dunnett's multiple comparisons test to
compare all experimental groups against a single control group. (D)
CellTiter 96® AQueous One Solution Cell Proliferation
detection of MDA-MB-231 cell viability when treated with 053 (5
μM), DOC (10 μM), DDP (50 μM), GEM (80
μM), PTX (0.1 μM) and 5-FU (50 μM) treated
alone, or the effect of 053 combined with chemotherapy drugs on the
viability of MDA-MB-231 cells after 24 h treatment. Data are
presented as mean ± SEM (n=4). Statistical significance was
determined by one-way ANOVA followed by Dunnett's multiple
comparisons test to compare all experimental groups against a
single control group. **P<0.01,
***P<0.001 and ****P<0.0001. (E)
Apoptosis of MDA-MB-231 cells was detected by flow cytometry, cells
were treated with 053 (5 μM), DOC (10 μM), DDP (50
μM), GEM (80 μM), PTX (0.1 μM) and 5-FU (50
μM) or 053 in combination with chemotherapy drugs for 24 h.
(F) Flow cytometry was used to detect PD-L1 surface expression on
MDA-MB-231 cells treated with 053 (0-10 μM) for 24 h. The
bar graph shows quantitative analysis of relative fluorescence
intensity. Data are presented as mean ± SEM (n=3). Statistical
significance was determined by one-way ANOVA followed by Dunnett's
multiple comparisons test to compare all experimental groups
against a single control group. ****P<0.0001 vs. 0
μM 053. (G) Flow cytometry was used to detect surface
expression on 4T1 cells treated with 053 (0-10 μM) for 24 h.
The bar graph shows quantitative analysis of relative fluorescence
intensity. Data are presented as mean ± SEM (n=3). Statistical
significance was determined by one-way ANOVA followed by Dunnett's
multiple comparisons test to compare all experimental groups
against a single control group. ***P<0.001 vs. 0
μM 053. 053, FZU-0045-053; ROS, reactive oxygen species;
DOC, docetaxel; DDP, cisplatin; GEM, gemcitabine; PTX, paclitaxel;
5-FU, 5 -fluorouracil; PD-L1, programmed death-ligand 1. |
Autophagy inhibition has been shown to enhance
chemotherapy-induced apoptosis and suppress tumor cell
proliferation, while also serving as a key mechanism of
chemoresistance (11).
Previously, it was demonstrated that compound 053 can inhibit
late-stage autophagy. Therefore, its effect on the chemosensitivity
of MDA-MB-231 cells was further investigated. Initially, the impact
of compound 053 in combination with conventional breast cancer
chemotherapeutic agents, including PTX, DDP, DOC, GEM and 5-FU, was
assessed. Cell viability assay revealed that the combination of 053
and chemotherapeutic agents more effectively reduced the survival
rate of MDA-MB-231 cells compared with treatment with either 053 or
the chemotherapeutic agents alone (Fig. 3D). The Annexin V/PI assay revealed
that 053 combined with chemotherapeutic drugs significantly
enhanced apoptosis in MDA-MB-231 cells compared with chemotherapy
alone (Fig. 3E). In conclusion,
compound 053 significantly enhanced the chemosensitivity of
MDA-MB-231 cells by inhibiting autophagy.
It has been reported that PD-1 and its ligand PD-L1
can be regulated by autophagy in various types of cancer (33). Tumor cells evade immune
surveillance by upregulating the expression of PD-L1. PD-L1
expression in 053-treated MDA-MB-231 and 4T1 cells was examined
using flow cytometry and western blotting. As shown in Fig. 3F and G, 053 treatment
significantly downregulated the expression of PD-L1 on the surface
of MDA-MB-231 and 4T1 cells compared with the control group. In
conclusion, 053 could negatively regulate the expression of PD-L1
on the surface of MDA-MB-231 and 4T1 cells.
Compound 053 enhances the in vivo
antitumor effect of GEM by inhibiting autophagy in the MDA-MB-231
xenograft nude mouse model
To more accurately simulate the in vivo
effects of compound 053, a BALB/cJ nude mouse model for MDA-MB-231
breast cancer xenografts was established. After tumor formation,
mice were injected with saline, 053 (10 mg/kg), GEM (10 mg/kg) or a
combination of 053 (5 mg/kg) and GEM (5 mg/kg) via tail vein
injection every 3 days for 3 weeks (Fig. 4A). As shown in Fig. 4B-D, the tumor size and weight in
the control group of the nude mouse xenograft model continued to
increase, while tumor growth in the drug-treated groups was
inhibited to varying degrees. Notably, the tumor growth in the nude
mouse xenograft model treated with the combination of 053 and GEM
was the slowest and thus this treatment exhibited the most
significant antitumor effect. As shown in Fig. 4E and G, immunohistochemical and
immunofluorescence staining of tumor tissues from the nude mouse
xenograft model revealed that, compared with the saline-treated
group (control), 053 treatment alone reduced Ki67 expression and
increased TUNEL expression in tumors, while the combination of 053
and GEM further decreased Ki67 expression and elevated TUNEL
expression. Subsequently, the antitumor effect of 053 was further
confirmed by analyzing H&E-stained tumor tissues. As shown in
Fig. 4H, the tumor tissues in the
control group showed almost no cell necrosis or apoptosis, whereas
the 053- and GEM-treated groups displayed extensive cell shrinkage
and apoptotic nuclei, and the tumor tissues in the 053- and
GEM-combined treatment group exhibited the most severe cell damage.
More notably, immunohistochemical staining of the tumor tissues
also showed that, compared with the control group, 053 alone or in
combination with GEM significantly increased the expression of LC3B
and p62 in the tumor tissues (Fig.
4E). As previously demonstrated, it was confirmed that 053 can
negatively regulate the expression of PD-L1in MDA-MB-231 cells
in vitro. Therefore, the expression of PD-L1 in the tumor
tissues of a nude mouse xenograft model was further tested using
immunohistochemical staining. Notably, treatment with 053 alone or
in combination with GEM reduced the expression of PD-L1 in tumor
tissues compared with the control group (Fig. 4E). All the aforementioned results
indicated that 053 can effectively inhibit the autophagy of tumor
cells in vivo, and the combination treatment with GEM
significantly enhances the antitumor effect.
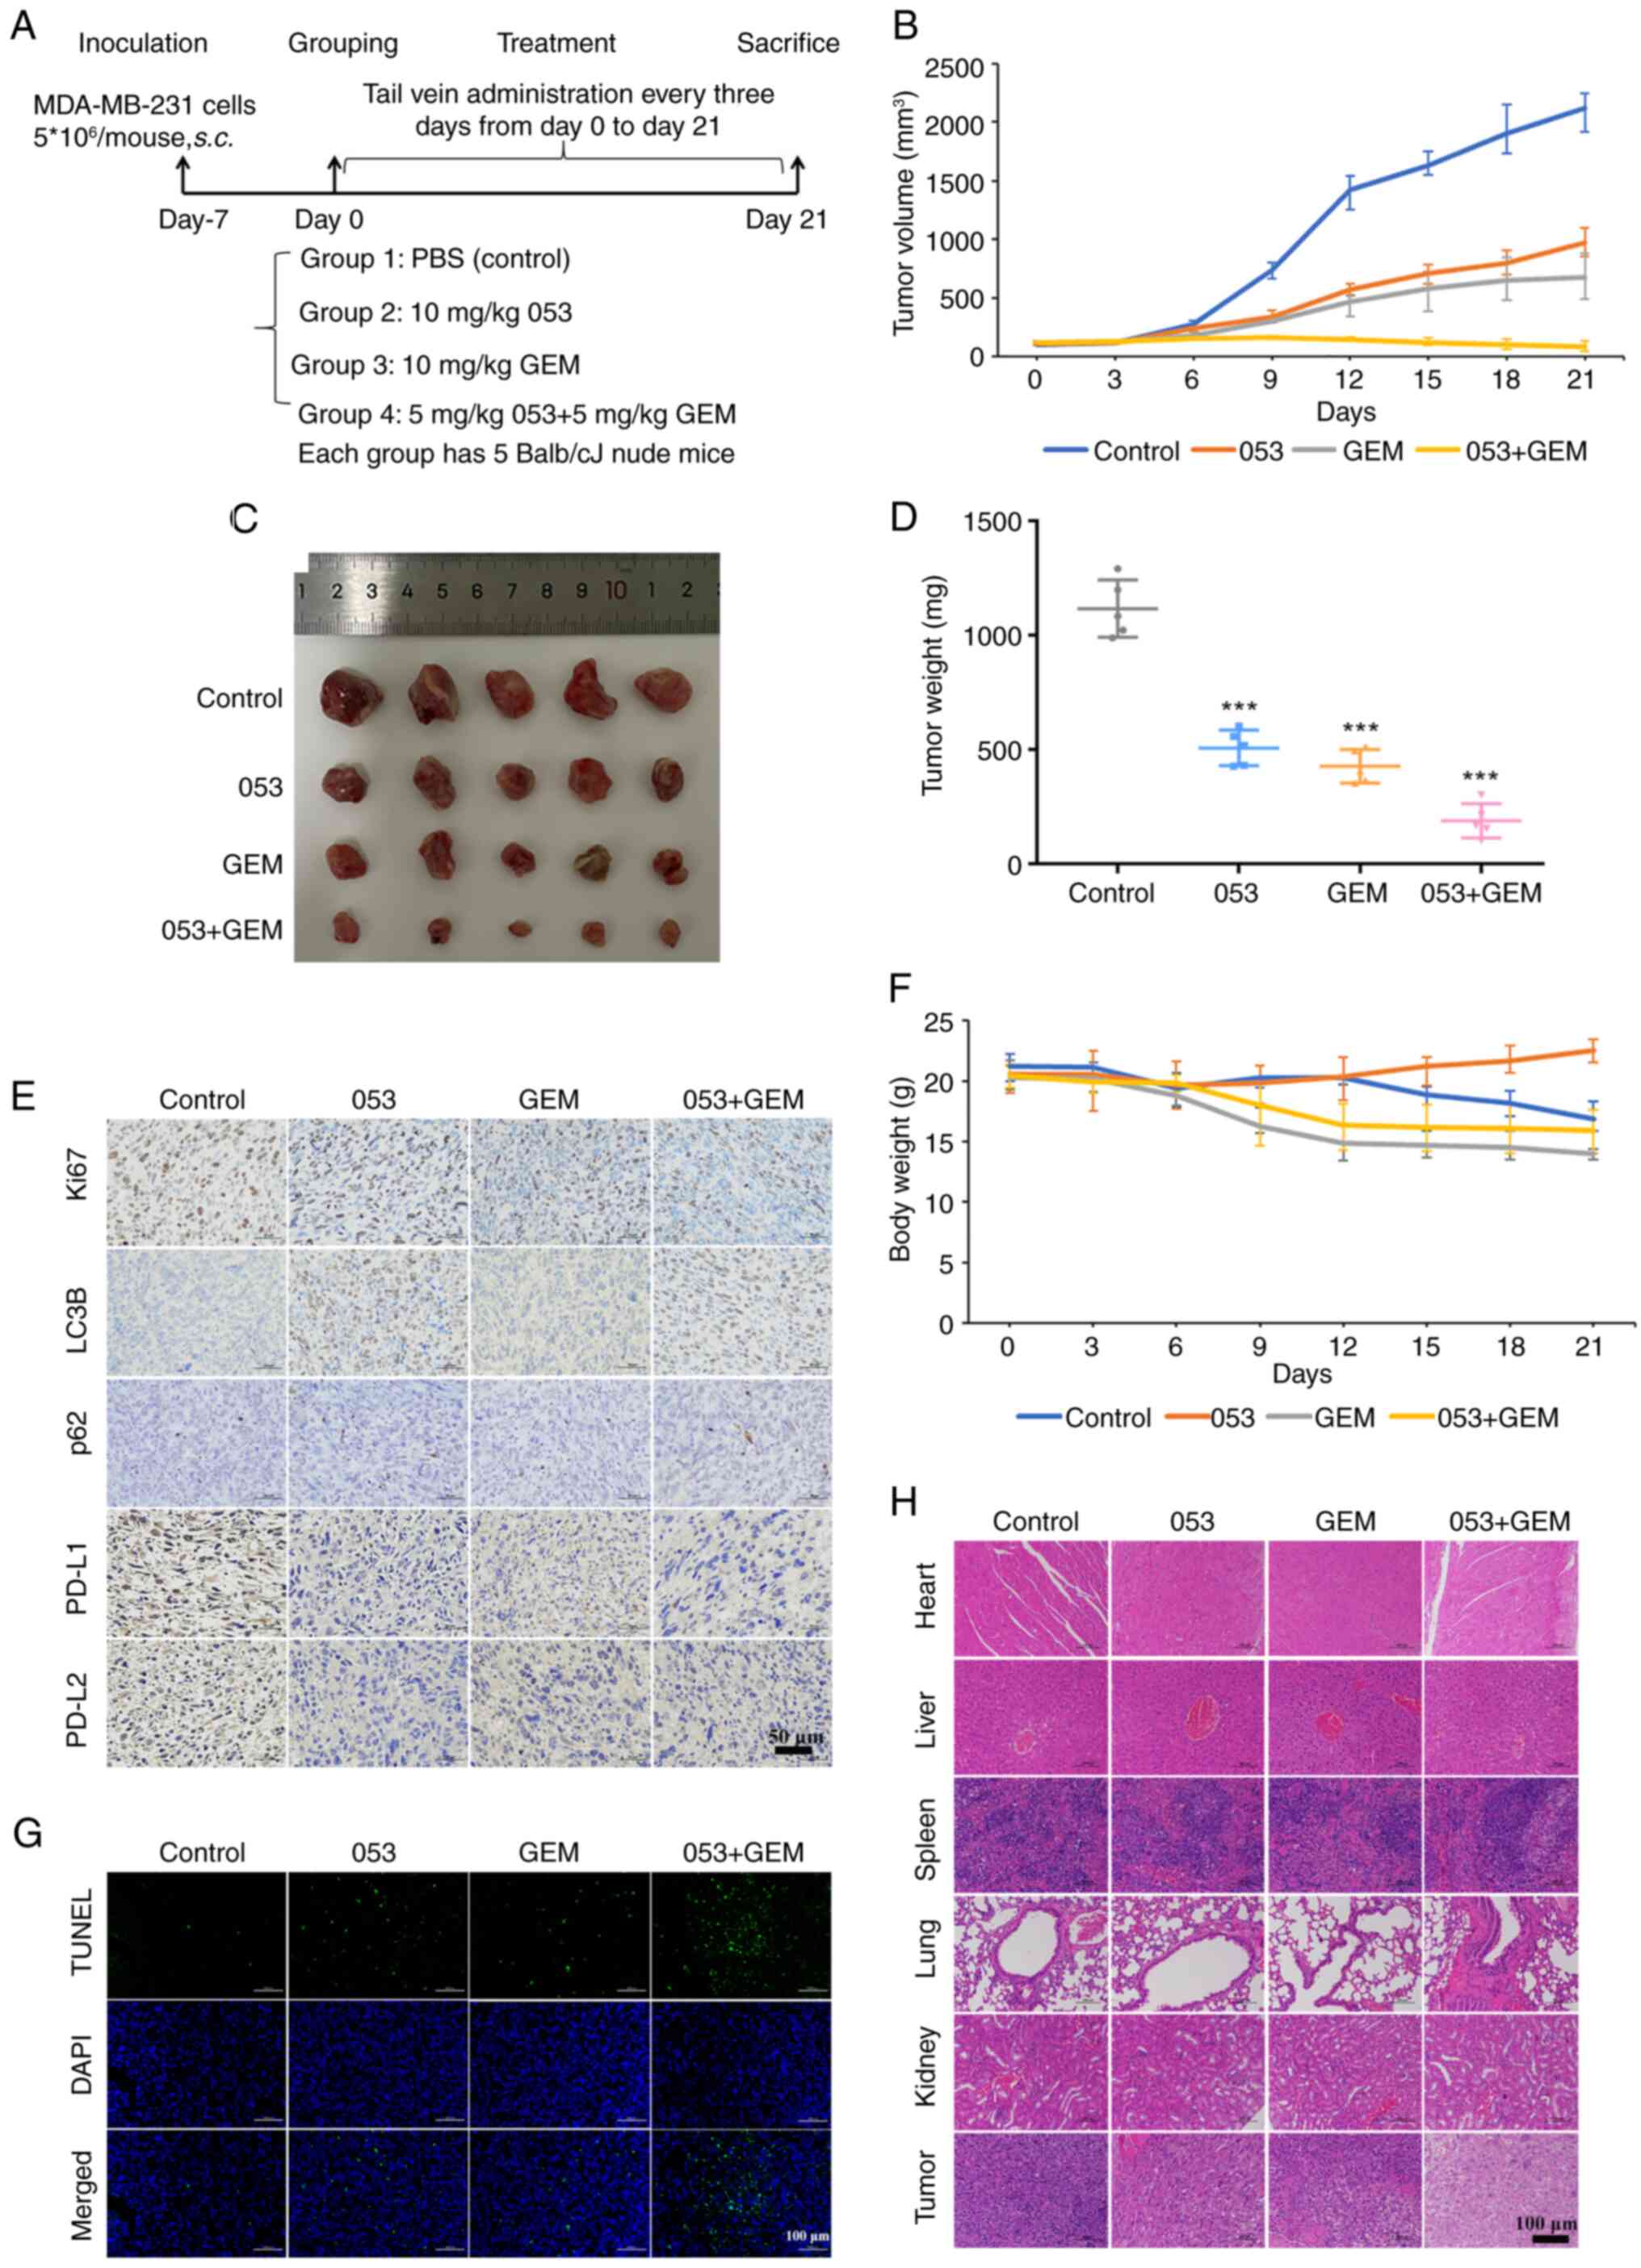 | Figure 4Compound 053 enhances the therapeutic
effect of GEM by inhibiting autophagy in the MDA-MB-231 xenograft
model. (A) Mouse treatment plan. (B) The tumor size was measured
with a caliper every 3 days and the volume was calculated (n=5).
(C) Tumor morphology of mouse removed at 21 days of treatment. (D)
The tumors were removed and weighed at 21 days of treatment. Data
are presented as mean ± SEM (n=5). Statistical significance was
determined by one-way ANOVA followed by Dunnett's multiple
comparisons test to compare all experimental groups against a
single control group. ***P<0.001 vs. Control. (E)
Protein levels of Ki67, LC3B, p62, PD-L1 and PD-L2 were detected
using immunohistochemical staining in tumor tissues of mice after
21 days of treatment. Nuclei are localized in blue and target
proteins are localized in brown. Scale bar, 50 μm. (F) Body
weight was measured every 3 days. (G) The TUNEL assay was used to
evaluate DNA fragmentation in mouse tumor tissues after 21 days of
treatment. Blue fluorescence indicates nuclear staining (DAPI),
while green fluorescence specifically labels DNA breaks associated
with apoptosis. Scale bar, 100 μm. (H) H&E staining of
tumor tissues and major organs (heart, liver, spleen, lungs and
kidneys) of mice after 21 days of treatment. Nuclei are blue-purple
and cytoplasm is red. Scale bar, 100 μm. 053, FZU-0045-053;
GEM, gemcitabine; LC3B, microtubule-associated protein 1A/1B-light
chain 3B; p62/SQSTM1, sequestosome 1; PD-L1/2, programmed
death-ligand 1/2. |
In addition, there was no significant decrease in
body weight in the 053-treated mice compared with the other
treatment groups during the treatment period (Fig. 4F). The major organs (heart, liver,
spleen, lungs and kidneys) of the treated mice were further
examined using H&E staining. As shown in Fig. 4H, no obvious organ damage or
inflammatory lesions were observed in mice treated with 053.
However, mice treated with GEM showed mild inflammation in the
liver, irregular arrangement of alveolar epithelial cells, diffuse
alveolar damage and interstitial edema. These results indicate that
053 exhibits greater biosafety in mice compared with the
conventional chemotherapeutic agent GEM. In summary, 053 exhibits
high biosafety in vivo and enhances the antitumor effect by
inhibiting autophagy in tumor cells while negatively regulating the
expression of PD-L1 in tumor tissues.
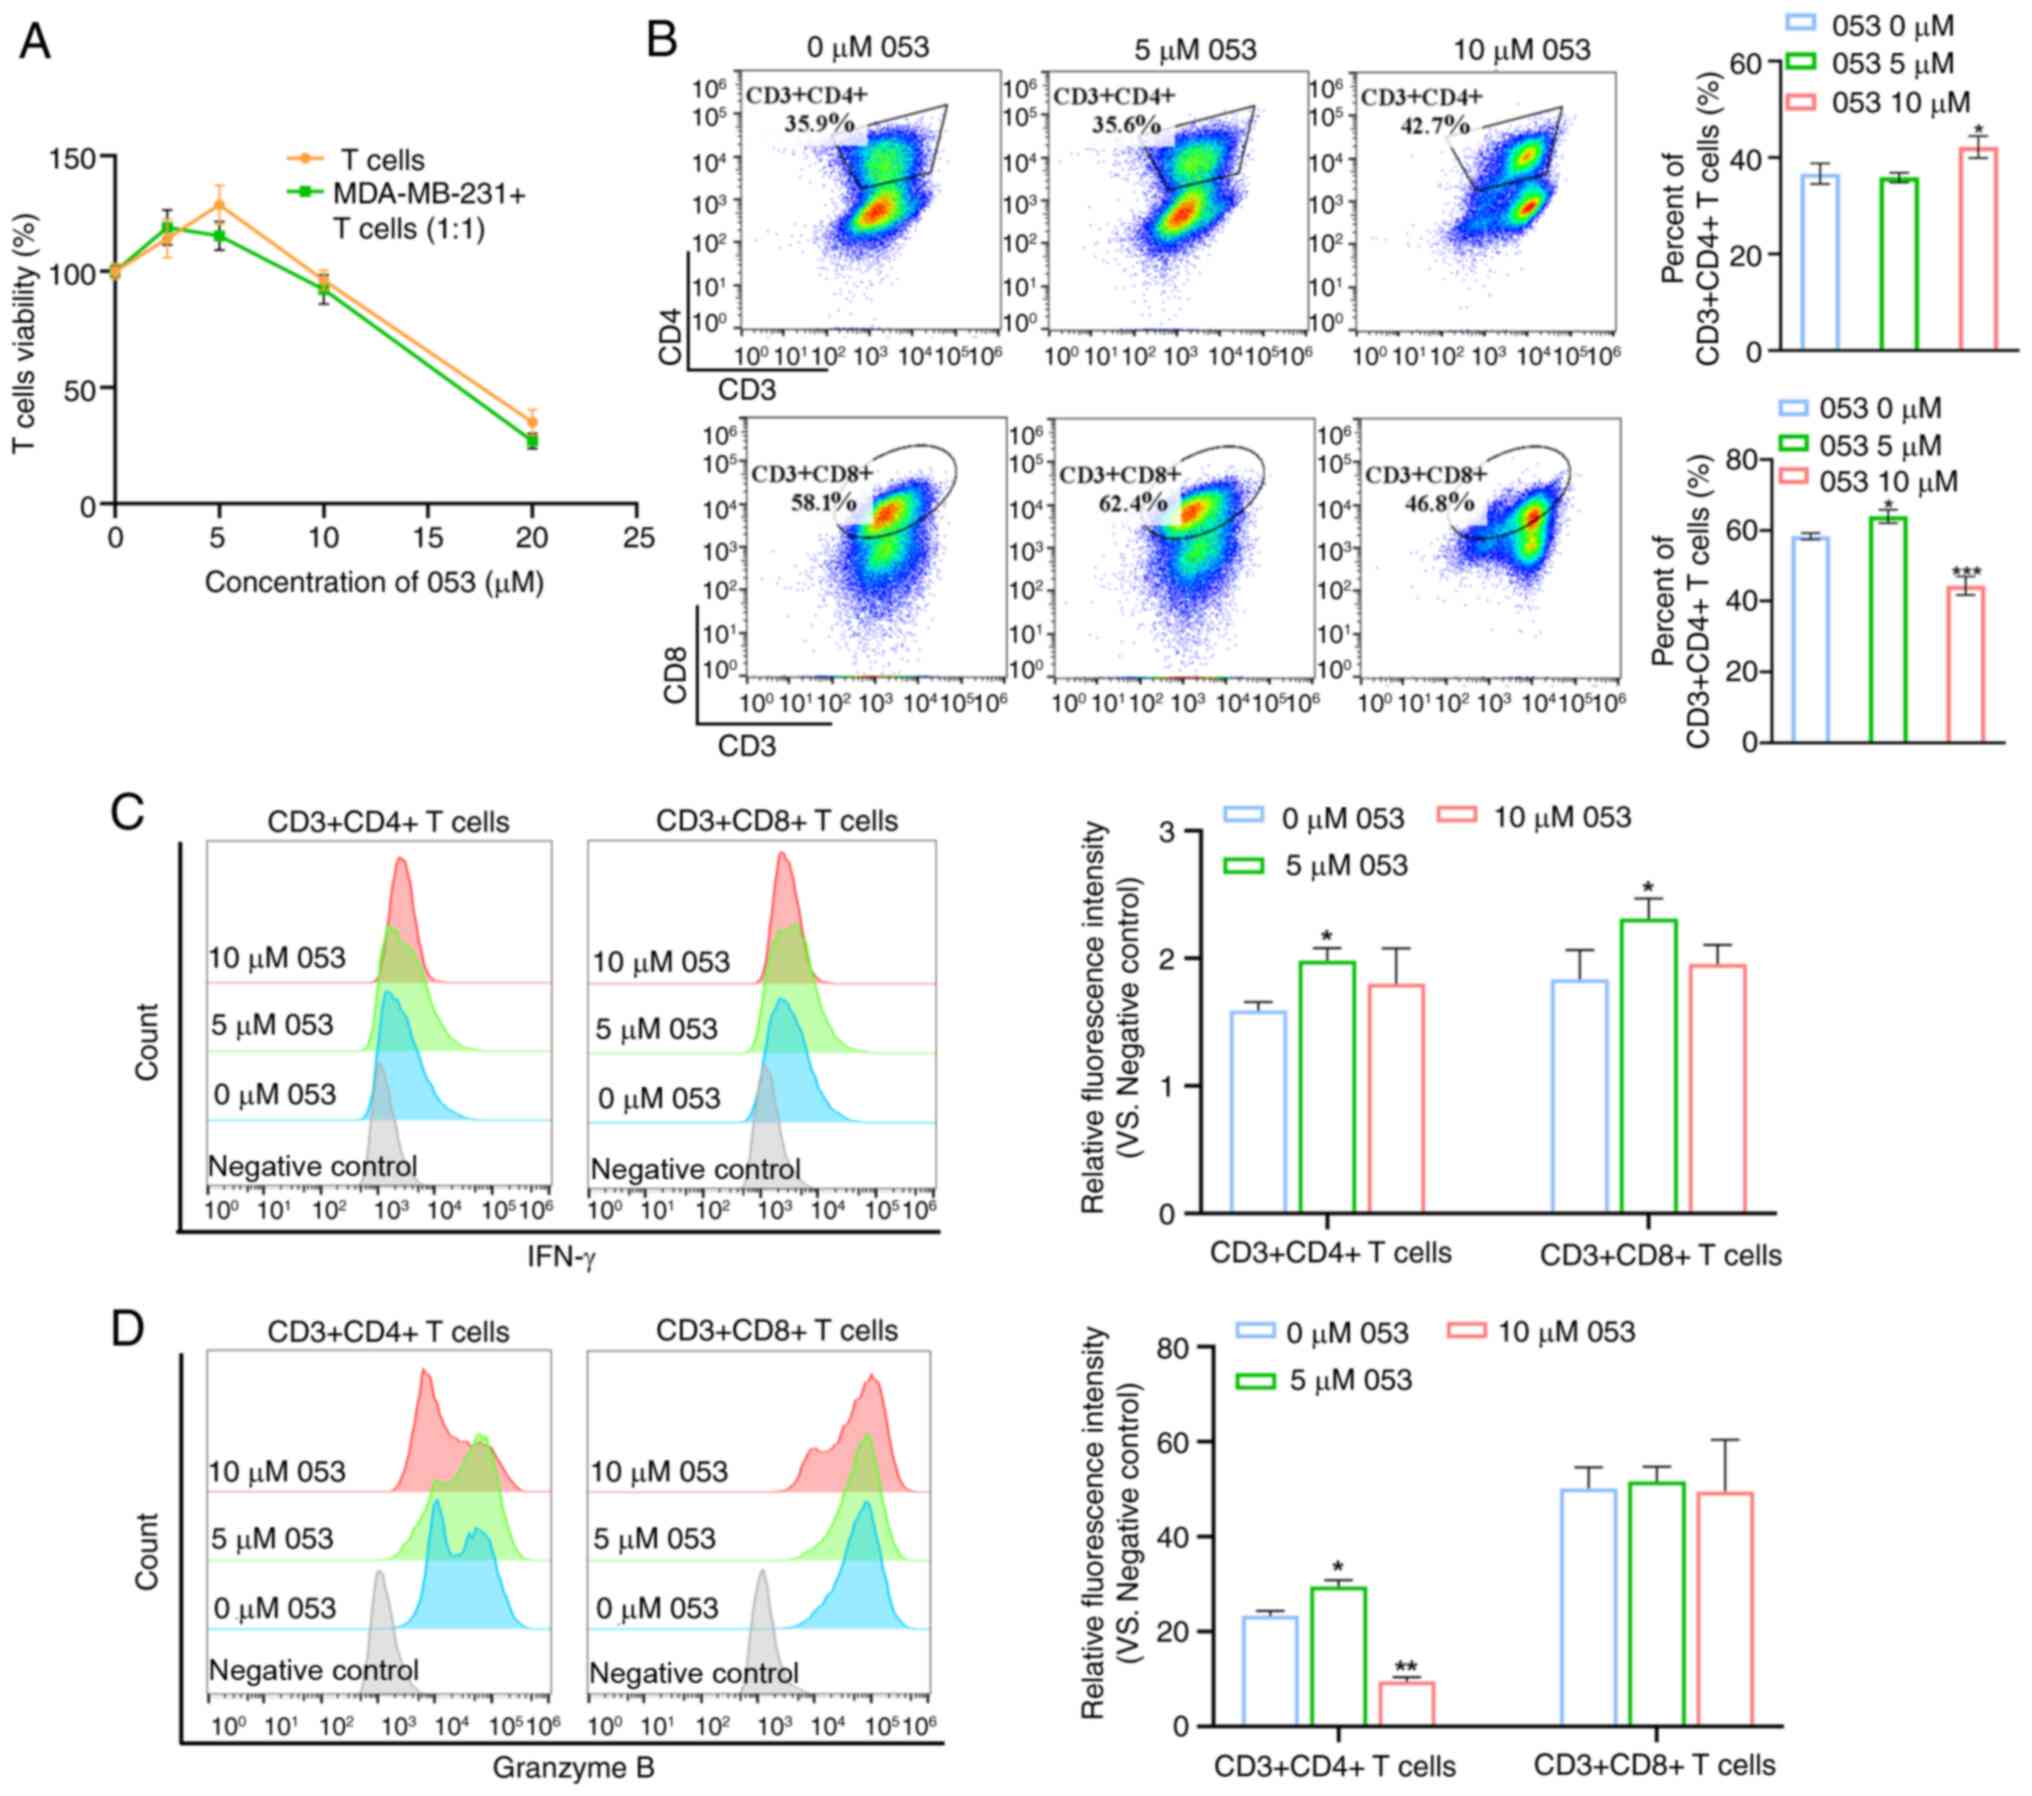
Compound 053 promotes T cell activation
and proliferation by regulating co-stimulatory and co-inhibitory
molecules on the surface of T cells
The dose-response experiments demonstrated that low
dose 053 (0-5 μM) promoted T cell proliferation, while
higher concentrations (>5 μM) induced cytotoxicity.
Notably, this biphasic effect was replicated in the T cell-tumor
cell (MDA-MB-231) co-culture system, indicating that 5 μM
053 optimally activated T cell expansion in both isolated and
tumor-associated environments (Fig.
5A). Therefore, it was hypothesized that compound 053 exhibits
immunomodulatory potential. Subsequently, it was observed that
treatment with 5 μM 053 did not alter the proportion of
CD4+ T cells but slightly increased the proportion of
CD8+ T cells. Notably, treatment with 10 μM 053
reduced the proportion of CD8+ T cells, while increasing
the proportion of CD4+ T cells (Fig. 5B). Activated CD4+ T
cells and CD8+ T cells secrete a range of cytokines
involved in inflammatory responses and immunomodulation. As shown
in Fig. 5C and D, using flow
cytometry it was found that 5 μM 053 promoted the expression
of IFN-γ and Granzyme B in T cells, but 10 μM 053
downregulated the expression of IFN-γ and Granzyme B in T cells,
which was due to the toxicity of high concentrations of compound
053 to T cells.
Co-stimulatory molecules on the surface of T cells,
such as 4-1BB, OX-40 and CD40L, transmit positive signals by
binding to their respective ligands, thereby promoting T cell
activation and participation in subsequent immune responses
(34). By contrast, co-inhibitory
molecules on the surface of T cells, such as TIM3, PD-1 and VISTA,
downregulate or terminate T cell activation and proliferation by
transmitting inhibitory signals (35). Western blotting was performed to
evaluate the effects of compound 053, ADM, GEM and CQ on the
protein levels of co-stimulatory and co-inhibitory molecules on the
surface of T cells. As shown in Fig.
6A and B, it was found that compound 053 (5 μM)
upregulated the expression levels of 4-1BB, CD40L and OX-40, while
they decreased the levels of TIM3 on the surface of T cells.
However, treatment with 053 did not alter the expression level of
PD-1 and VISTA on the surface of T cells, and the levels of TIM-3,
VISTA and PD-1 in the CQ group also appeared unchanged. Flow
cytometry further validated that 053 (0-10 μM) treatment
upregulated co-stimulatory molecules (4-1BB, ICOS and OX-40) and
downregulated inhibitory markers (TIM-3) in T cells cultured alone
or with MDA-MB-231 cells, with optimal effects at 5 μM
(Fig. 6C-J). When T cells were
treated with compound 053 in a monoculture system, the expression
level of PD-1 remained unchanged. However, when 053 was applied to
a co-culture system of T cells and MDA-MB-231 cells, it
downregulated the surface expression of PD-1 on T cells (Fig. 6K and L). In conclusion, compound
053 regulated the activation and proliferation of T cells by
downregulating the co-inhibitory molecules TIM3 and PD-1, and
upregulating the co-stimulatory molecules 4-1BB, OX40, CD40L and
ICOS to promote immune responses.
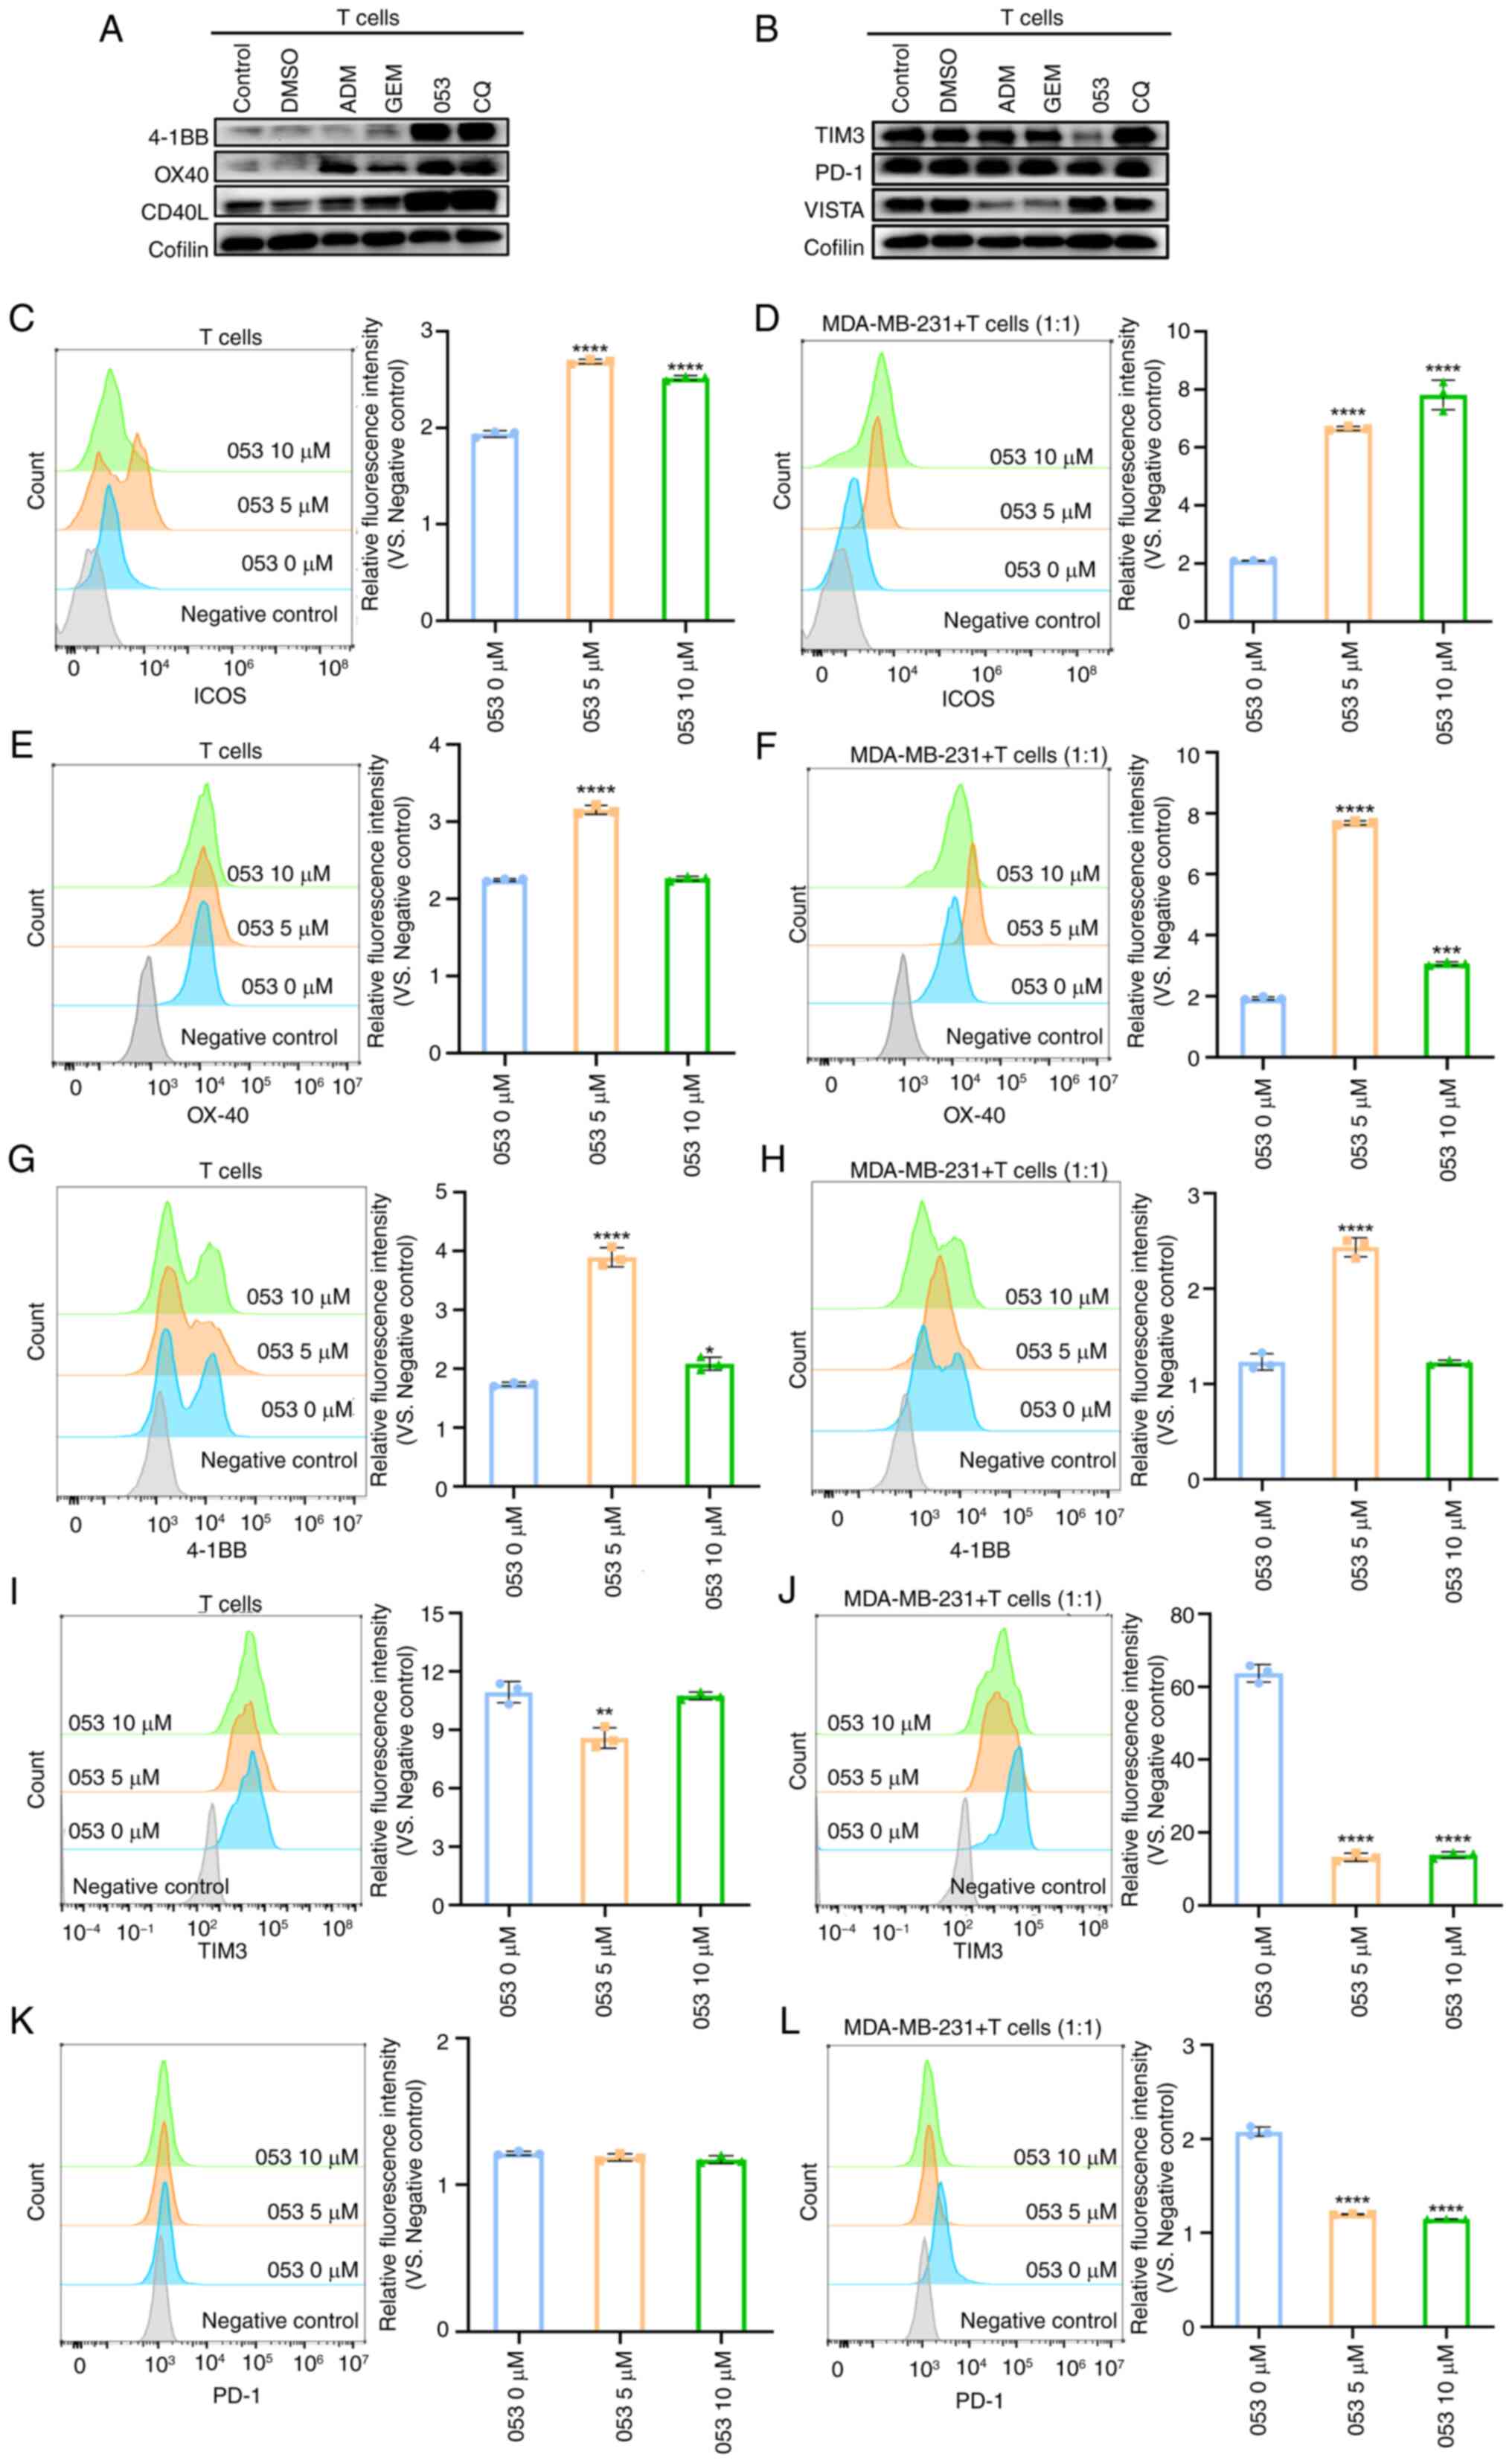 | Figure 6Compound 053 modulates co-stimulatory
and co-inhibitory molecules on T cell surfaces. (A) The protein
levels of 4-1BB, OX40 and CD40L after 5 μM ADM, GEM (80
μM), 053 (5 μM) or CQ (30 μM) treatment were
analyzed by western blotting. (B) The protein levels of TIM3, PD-1
and VISTA after 5 μM ADM, GEM (80 μM), 053 (5
μM) or CQ (30 μM) treatment were analyzed by western
blotting. (C) After T cells were treated with 053 (0-10 μM)
for 24 h, ICOS expression on T cell surfaces was analyzed by flow
cytometry. The bar graph shows quantitative analysis of relative
fluorescence intensity. (D) T cells were co-cultured with
MDA-MB-231 cells at a 1:1 ratio and treated with 053 (0-10
μM) for 24 h, followed by flow cytometric analysis of ICOS
expression on T cell surfaces. The bar graph shows quantitative
analysis of relative fluorescence intensity. (E) After T cells were
treated with 053 (0-10 μM) for 24 h, OX-40 expression on T
cell surfaces was analyzed by flow cytometry. The bar graph shows
quantitative analysis of relative fluorescence intensity. (F) T
cells were co-cultured with MDA-MB-231 cells at a 1:1 ratio and
treated with 053 (0-10 μM) for 24 h, followed by flow
cytometric analysis of OX-40 expression on T cell surfaces. The bar
graph shows quantitative analysis of relative fluorescence
intensity. (G) After T cells were treated with 053 (0-10 μM)
for 24 h, 4-1BB expression on T cell surfaces was analyzed by flow
cytometry. The bar graph shows quantitative analysis of relative
fluorescence intensity. (H) T cells were co-cultured with
MDA-MB-231 cells at a 1:1 ratio and treated with 053 (0-10
μM) for 24 h, followed by flow cytometric analysis of 4-1BB
expression on T cell surfaces. The bar graph shows quantitative
analysis of relative fluorescence intensity. (I) After T cells were
treated with 053 (0-10 μM) for 24 h, TIM3 expression on T
cell surfaces was analyzed by flow cytometry. The bar graph shows
quantitative analysis of relative fluorescence intensity. (J) T
cells were co-cultured with MDA-MB-231 cells at a 1:1 ratio and
treated with 053 (0-10 μM) for 24 h, followed by flow
cytometric analysis of TIM3 expression on T cell surfaces. The bar
graph shows quantitative analysis of relative fluorescence
intensity. (K) After T cells were treated with 053 (0-10 μM)
for 24 h, PD-1 expression on T cell surfaces was analyzed by flow
cytometry. The bar graph shows quantitative analysis of relative
fluorescence intensity. (L) T cells were co-cultured with
MDA-MB-231 cells at a 1:1 ratio and treated with 053 (0-10
μM) for 24 h, followed by flow cytometric analysis of PD-1
expression on T cell surfaces. The bar graph shows quantitative
analysis of relative fluorescence intensity. Data are presented as
mean ± SEM (n=3). Statistical significance was determined by
one-way ANOVA followed by Dunnett's multiple comparisons test to
compare all experimental groups against a single control group.
*P<0.05, **P<0.01,
***P<0.001, ****P<0.0001 vs. 0
μM 053. 053, FZU-0045-053; ADM, adriamycin; 4-1BB, tumor
necrosis factor receptor superfamily member 9; OX40, tumor necrosis
factor receptor superfamily member 4; CD40L, CD40 ligand; ICOS,
inducible T-cell co-stimulator; PD-1, programmed cell death protein
1; TIM3, T-cell immunoglobulin and mucin-domain containing-3;
VISTA, V-domain Ig suppressor of T cell activation; GEM,
gemcitabine; CQ, chloroquine. |
Compound 053 enhances the in vivo
antitumor efficacy of GEM by modulating co-stimulatory and
co-inhibitory molecules on tumor-infiltrating T cells in the 4T1
xenograft model
To more accurately simulate the in vivo
antitumor effects of compound 053 through immunomodulation, a
BALB/c mouse 4T1 breast cancer xenograft model was established.
After tumor formation, mice were injected via the tail vein with
saline, 053 (10 mg/kg), GEM (10 mg/kg) or a combination of 053 (5
mg/kg) and GEM (5 mg/kg) every 3 days for 3 weeks (Fig. 7A). As shown in Fig. 7C and D, consistent with the trends
observed in the previously described nude mouse xenograft model,
tumor growth was inhibited to varying degrees in the drug-treated
groups compared with the control group. Notably, the combination
treatment of 053 and GEM exhibited the slowest tumor growth
(Fig. 7C and D). In addition,
there was no significant decrease in body weight in the mice
treated with 053 compared with the other treatment groups (Fig. 7F). H&E staining was used for
the histological examination of major organs in mice, and no
significant detrimental effects were observed at the therapeutic
dose of 053 (Fig. 7B).
Subsequently, analysis of the H&E staining of the tumor
tissues, which was also consistent with the trend observed in the
aforementioned nude mouse xenograft model, revealed that the 053
and GEM-treated groups exhibited extensive cell atrophy and nuclear
apoptosis compared with the control group, with the tumor tissues
of the 053 and GEM combination treatment group showing the most
severe cell damage (Fig. 7B). In
addition, immunohistochemical analysis of the tumors revealed that
053 increased the levels of CD3, CD4, CD8, 4-1BB and OX-40 in the
tumor tissues, while the levels of PD-1 and TIM3 were reduced,
particularly when 053 was combined with GEM (Fig. 7E).
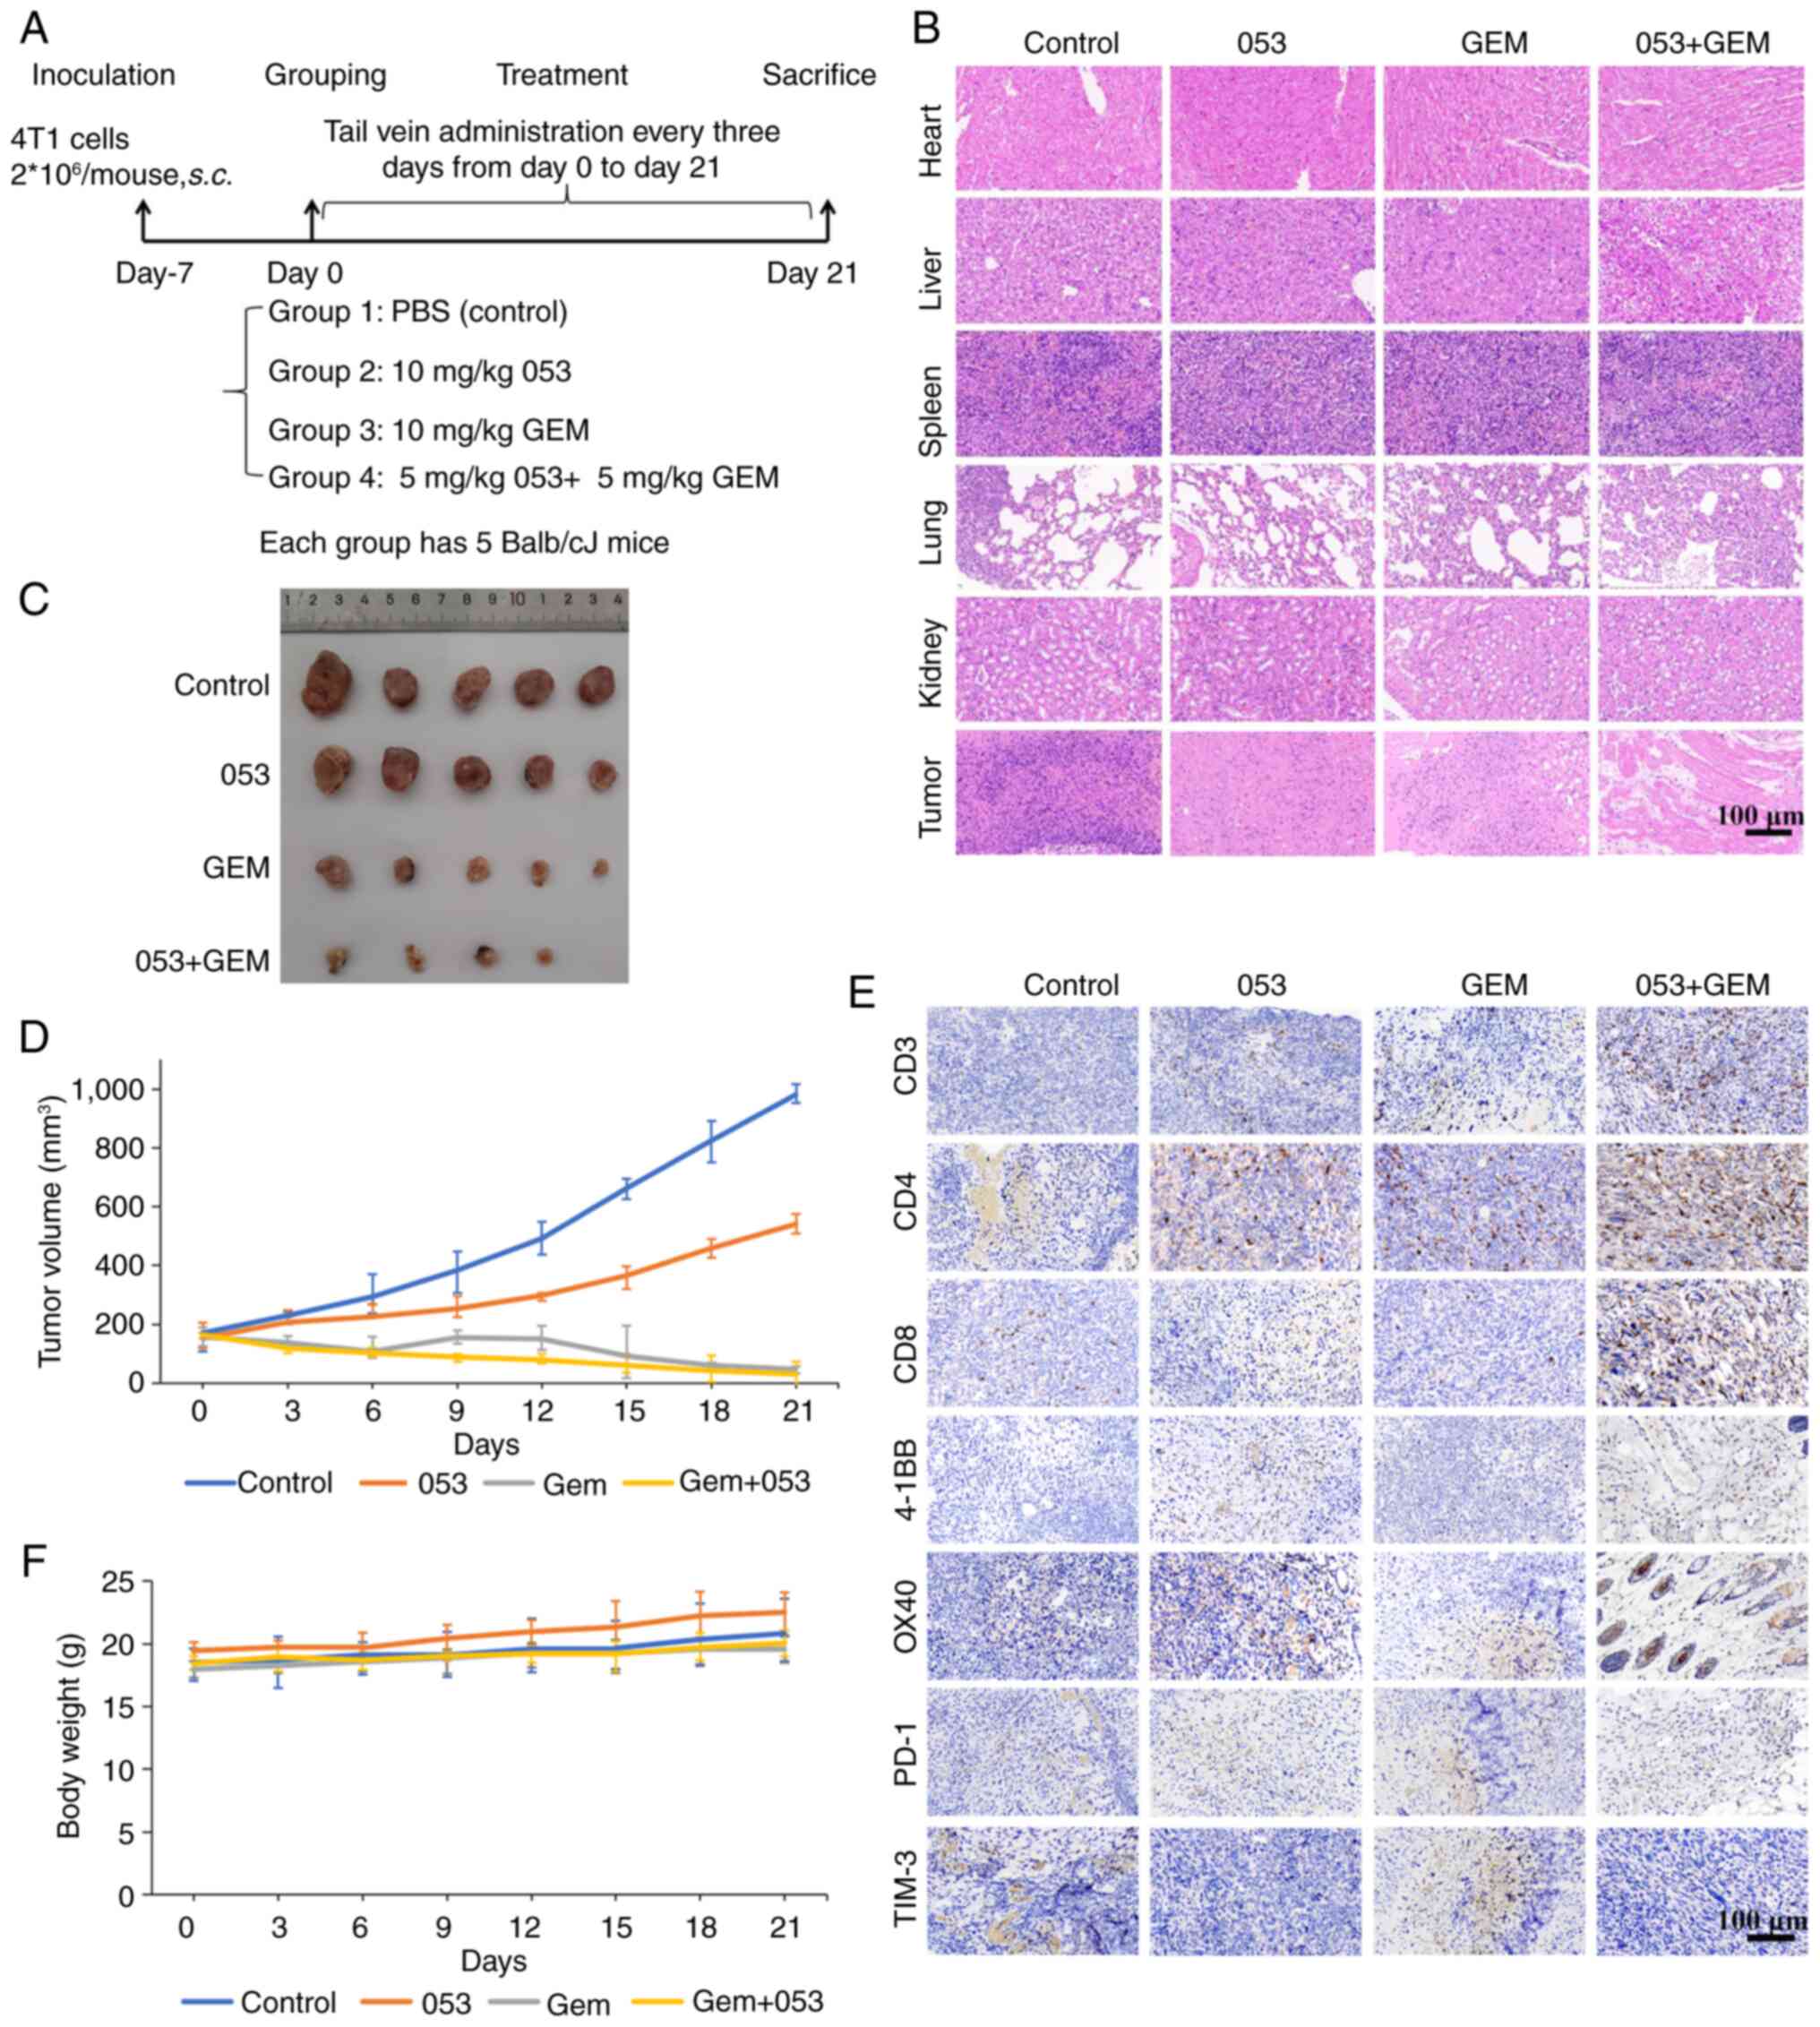 | Figure 7Compound 053 enhances the in
vivo antitumor effect of GEM in the 4T1 xenograft model. (A)
Mouse treatment plan. (B) H&E staining of heart, liver, spleen,
lung and kidney. Scale bar, 100 μm. (C) Tumor morphology of
mouse removed at 21 days of treatment. (D) The tumor size was
measured with a caliper every 3 days and the volume was calculated
(n=5). (E) Protein levels of CD3, CD4, CD8, 4-1BB, OX40, PD-1 and
TIM3 were detected using immunohistochemical staining in tumor
tissues of mice after 21 days of treatment. Nuclei are localized in
blue and target proteins are localized in brown. Scale bar, 100
μm. (F) Body weight was measured every 3 days (n=5). 053,
FZU-0045-053; GEM, gemcitabine; 4-1BB, tumor necrosis factor
receptor superfamily member 9; OX40, tumor necrosis factor receptor
superfamily member 4; PD-1, programmed cell death protein 1; TIM3,
T-cell immunoglobulin and mucin-domain containing-3. |
Subsequently, tumor tissues were digested into
single-cell suspensions and tumor cells were separated from
lymphocytes using Ficoll density gradient centrifugation. Flow
cytometric analysis revealed that both the 053 monotherapy group
and the 053+ GEM combination therapy group showed reduced PD-L1
expression on tumor cells (Fig.
8A). As shown in Fig. 8B-F,
flow cytometric analysis further validated the aforementioned
findings, demonstrating that both the 053 monotherapy group and the
053+ GEM combination therapy group exhibited increased expression
of co-stimulatory molecules (4-1BB, ICOS and OX-40) on
tumor-infiltrating T cells, along with decreased expression of
co-inhibitory molecules (PD-1 and TIM-3). Moreover, flow cytometric
analysis revealed an increase in the proportion of
tumor-infiltrating CD3+CD8+ T cells in both
the 053 monotherapy group and the 053+ GEM combination therapy
group, rising from 20.54 to 34.82 and 39.09% (Fig. 8G). Notably, the combination
therapy group showed more pronounced effects than monotherapy. In
summary, these findings demonstrate that compound 053 downregulates
PD-L1 expression on tumor cells while modulating co-stimulatory and
co-inhibitory molecules on tumor-infiltrating T cells. This dual
mechanism promotes T cell activation and proliferation, enhances
effector functions and increases cytotoxic CD8+ T cell
infiltration in tumor tissues, ultimately potentiating its
antitumor efficacy.
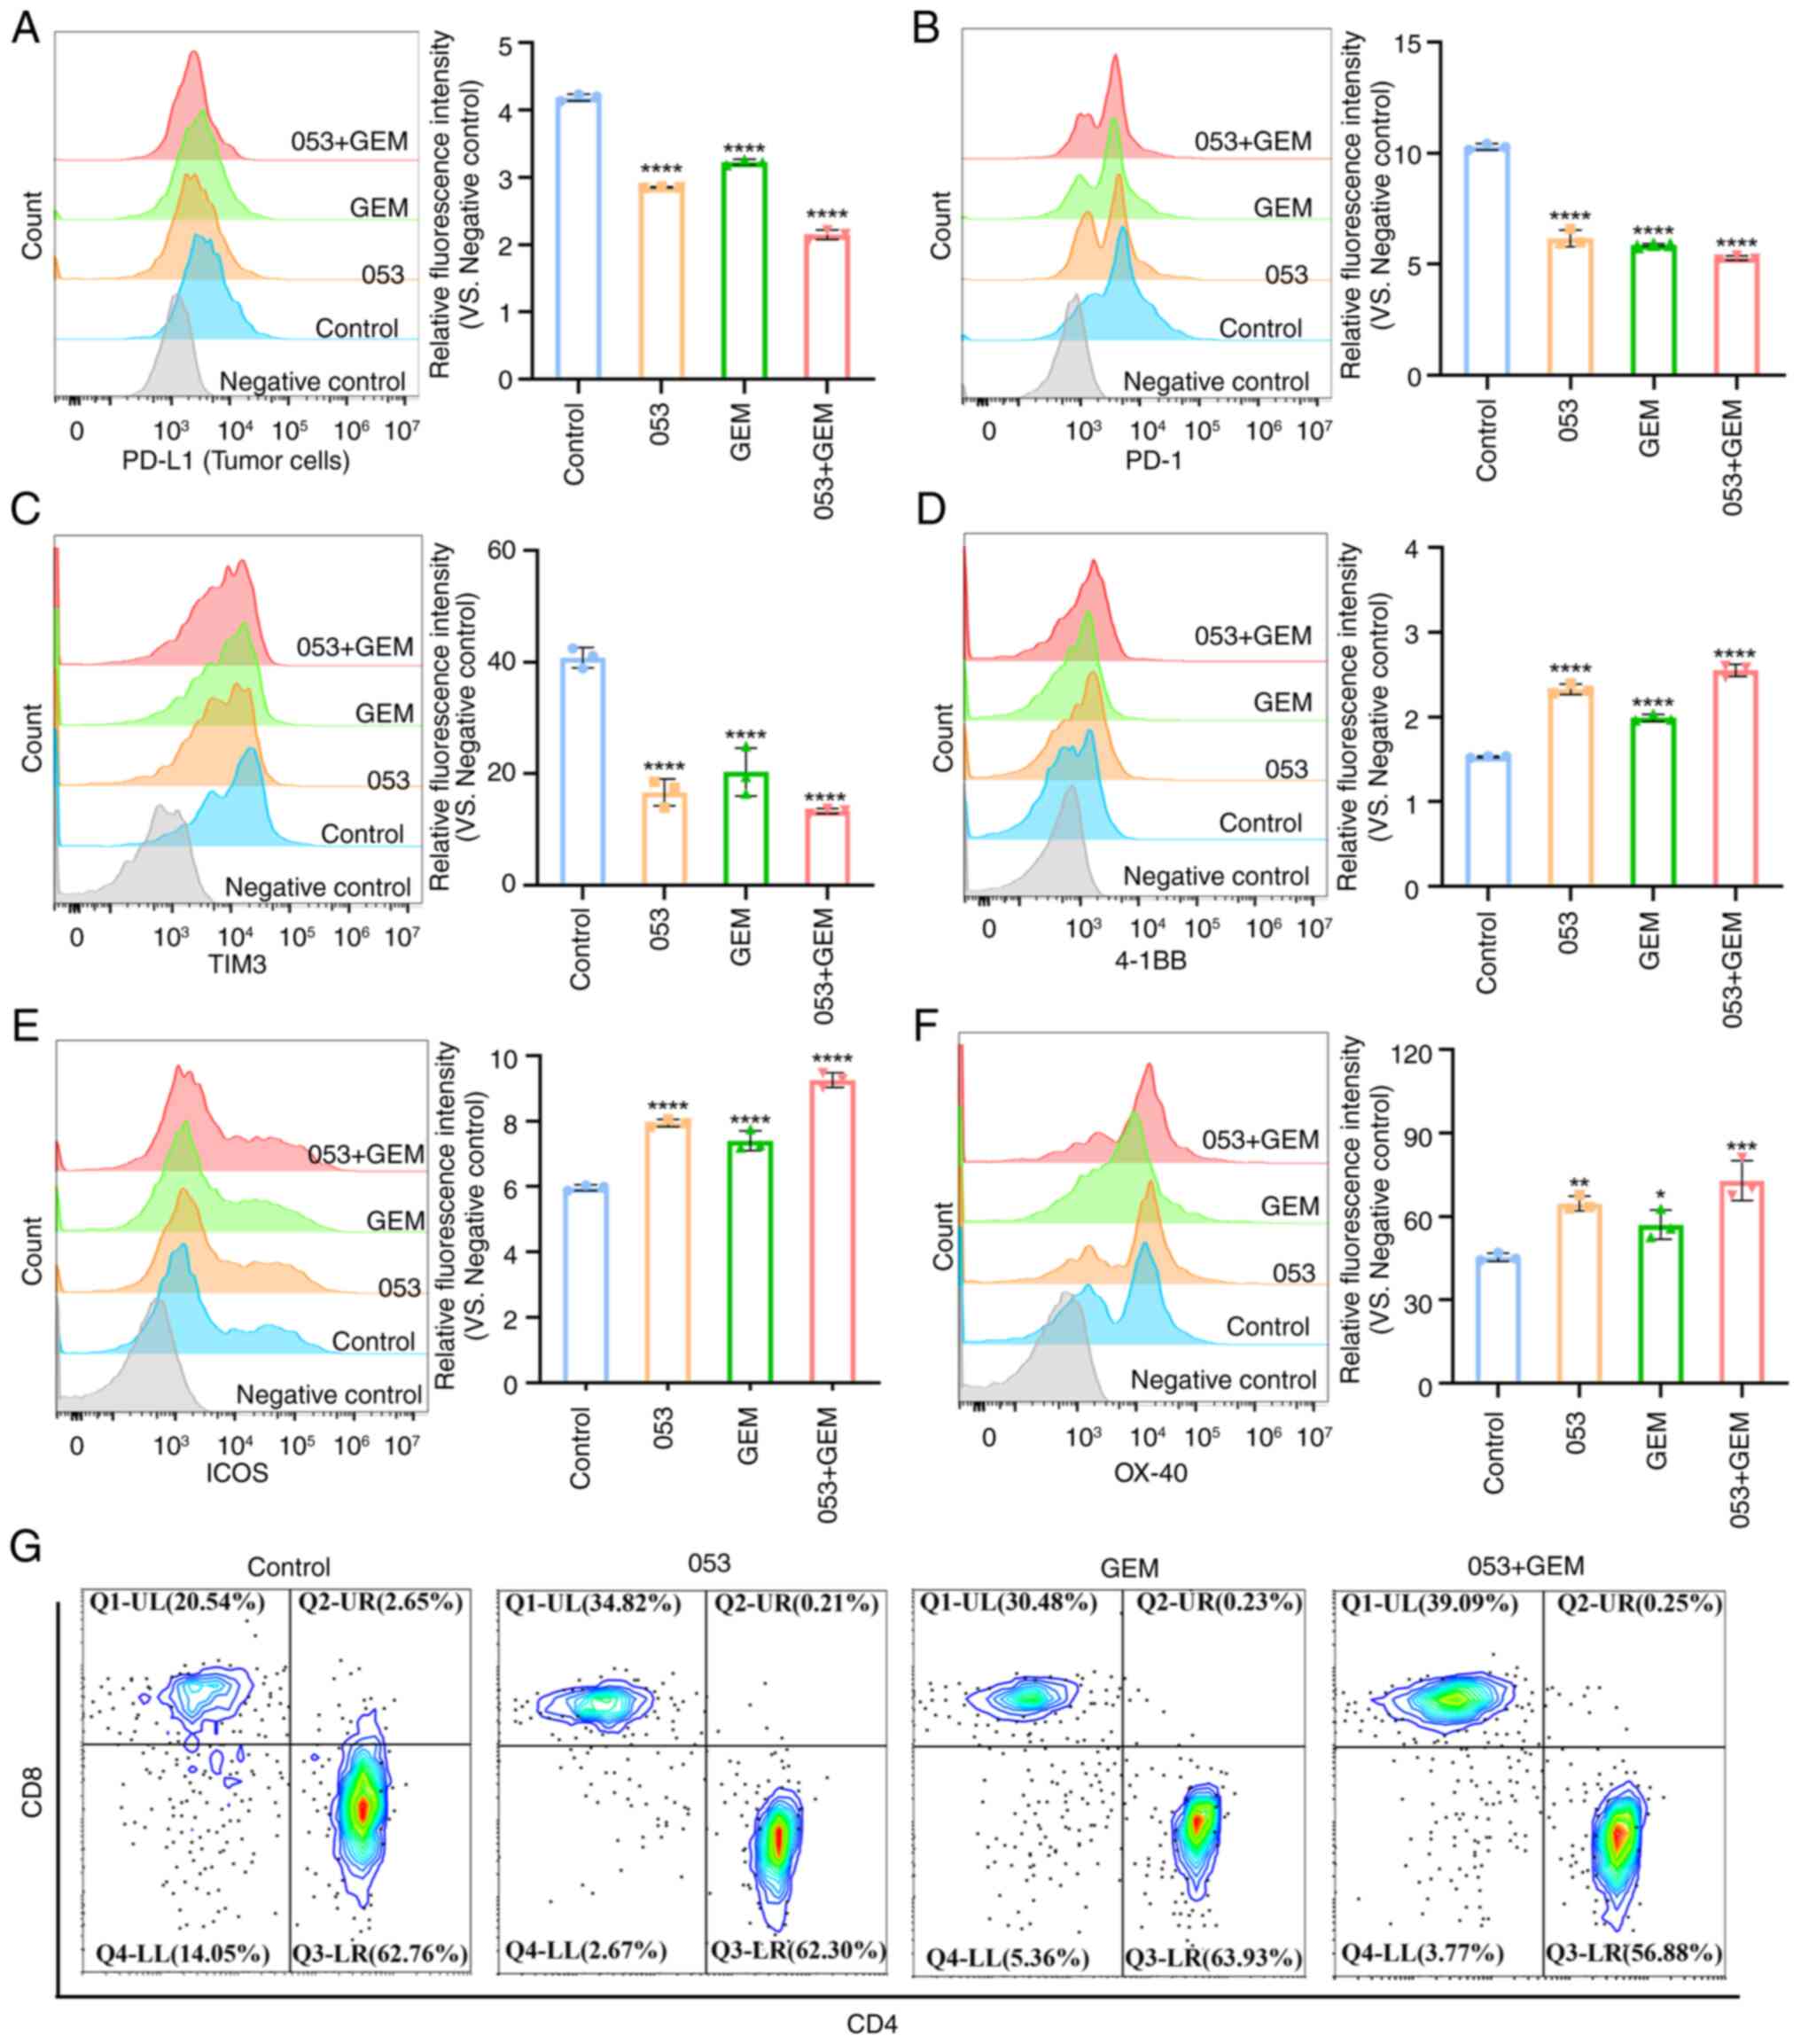 | Figure 8Compound 053 modulates PD-L1 on tumor
cells and co-stimulatory/co-inhibitory molecules on
tumor-infiltrating T cells in the 4T1 xenograft model. (A) Flow
cytometry was performed to analyze PD-L1 surface expression on
tumor cells. The bar graph shows quantitative analysis of relative
fluorescence intensity. (B) PD-1 expression on tumor-infiltrating T
cells surfaces was analyzed by flow cytometry. The bar graph shows
quantitative analysis of relative fluorescence intensity. (C) TIM3
expression on tumor-infiltrating T cells surfaces was analyzed by
flow cytometry. The bar graph shows quantitative analysis of
relative fluorescence intensity. (D) 4-1BB expression on
tumor-infiltrating T cells surfaces was analyzed by flow cytometry.
The bar graph shows quantitative analysis of relative fluorescence
intensity. (E) ICOS expression on tumor-infiltrating T cells
surfaces was analyzed by flow cytometry. The bar graph shows
quantitative analysis of relative fluorescence intensity. (F) OX-40
expression on tumor-infiltrating T cells surfaces was analyzed by
flow cytometry. The bar graph shows quantitative analysis of
relative fluorescence intensity. Data are presented as mean ± SEM
(n=3). Statistical significance was determined by one-way ANOVA
followed by Dunnett's multiple comparisons test to compare all
experimental groups against a single control group.
*P<0.05, **P<0.01,
***P<0.001, ****P<0.0001 vs. 0
μM 053. (G) Flow cytometry was used to analyze the
differentiation of CD3+CD4+ T cells and
CD3+CD8+ T cells. 053, FZU-0045-053; 4-1BB,
tumor necrosis factor receptor superfamily member 9; OX40, tumor
necrosis factor receptor superfamily member 4; ICOS, inducible
T-cell co-stimulator; PD-1, programmed cell death protein 1; TIM3,
T-cell immunoglobulin and mucin-domain containing-3; GEM,
gemcitabine; PD-L1, programmed death-ligand 1. |
Discussion
To the best of our knowledge, CQ/HCQ is the only
clinically approved autophagy inhibitor. However, its efficacy
remains unsatisfactory in current clinical trials for various
cancer types (13,36). Consequently, there is a need to
develop additional autophagy modulators with novel antitumor
potential. Different autophagy inhibitors target different stages
of autophagy. For example, CQ and Bafilomycin A1 primarily inhibit
the final stage of autophagy by blocking autophagosome-lysosome
fusion, leading to the accumulation of autophagic vesicles in
cells, while 3-methyladenine mainly inhibits early autophagy by
preventing autophagosome formation (31,37,38). Among the more common autophagy
inhibitors that block the fusion of autophagosomes and lysosomes,
CQ was selected as a positive control in the present study.
Research indicates that CQ increases the levels of LC3-II and p62
proteins, enhances autophagosome formation and promotes apoptosis,
pretreatment with RAPA mitigates these effects (39). Notably, the present study found
that both 053 and CQ treatments increased the levels of LC3B-II and
p62 proteins, as well as increased the accumulation of acidic
autophagosomes. Consequently, we hypothesized that 053, similar to
CQ, may be a late autophagy inhibitor. Subsequently, it was
investigated whether 053 affects the fusion of autophagosomes and
lysosomes using a tandem mRFP-GFP-LC3B reporter gene assay. The
results showed that both 053 and CQ enhanced yellow fluorescence
following co-localization stacking. Consequently, it was speculated
that 053, similar to CQ, disrupts autophagic flux at late stages by
blocking autophagosome-lysosome fusion, which leads to the
accumulation of autophagosomes. It has been reported that autophagy
can be regulated through the PI3K/AKT/mTOR signaling pathway, and
the inhibition of this pathway downregulates p62 expression in
breast cancer cells, thereby inducing autophagy (9). Additionally, the natural product
astragaloside II overcomes DDP resistance in hepatocellular
carcinoma cells by inactivating autophagy through the enhancement
of the PI3K/AKT/mTOR pathway (32). The results of the present study
also suggest that 053 inhibits autophagy by activating the
PI3K/AKT/mTOR signaling pathway in MDA-MB-231 cells. However, no
significant activation of this pathway was observed in MCF-7 cells.
It has been reported that autophagy regulators can modulate
autophagy through both mTOR-dependent and mTOR-independent pathways
(40). Therefore, we hypothesize
that the autophagy-regulating effect of 053 on MCF-7 cells may not
be dependent on the AKT/mTOR pathway.
Research indicates that the development of
multidrug resistance frequently results from prolonged chemotherapy
regimens. Additionally, the suppression of autophagy has been
demonstrated to improve the effectiveness of chemotherapy, targeted
therapies and immunotherapies, thereby enhancing antitumor
responses (41). Consequently,
after confirming that 053 is an autophagy inhibitor, the present
study further investigated whether 053 enhances the sensitivity of
chemotherapeutic agents by inhibiting autophagy. The results showed
that 053 treatment alone induced tumor cell apoptosis in a time-
and concentration-dependent manner, and the combination of 053 with
chemotherapeutic agents had a significant synergistic effect,
further inducing apoptosis in breast cancer cells. Furthermore, in
the MDA-MB-231 xenograft nude mouse model, 053 treatment alone
induced apoptosis and inhibited autophagy in tumor cells, resulting
in a certain antitumor effect, and the antitumor effect was more
pronounced when 053 was combined with the chemotherapeutic agent
GEM. High levels of ROS have been reported to increase
autophagosome formation and damage in cells (42). However, the results of the present
study were inconsistent with this finding, as 053 did not affect
ROS levels in tumor cells, suggesting that 053 does not depend on
the ROS pathway to regulate autophagy and apoptosis in breast
cancer cells.
The expression of PD-L1 is related to autophagy
mediated by LC3 and p62. There is a strong negative correlation
between p62 and PD-L1 (9).
Notably, the present study demonstrated that compound 053 inhibited
autophagy in tumor cells by increasing the protein levels of LC3-II
and p62, while simultaneously downregulating PD-L1 expression.
Research has shown that knocking out the autophagy-related gene
Rb1cc1 in tumor cells to inhibit autophagy increases TNFα-mediated
T cell killing of tumor cells and enhances the efficacy of immune
checkpoint blockade in mouse tumor models (43). Immune checkpoint blockade in tumor
immunotherapy has been reported to enhance antitumor T-cell
responses through anti-PD-1, anti-CTLA-4 or anti-PD-L1 therapy
(20). T cell co-stimulation is
mediated by immunoregulatory molecules (CD28, CD40L, CD30, OX40 and
4-1BB) expressed on T lymphocytes, while co-inhibitory receptors
(PD-1, CTLA-4, VISTA and TIM3) induce T cell dysfunction and
abrogate antitumor immunity (9,19,34,35). The results of the in vivo
and in vitro experiments in the present study showed that
053 upregulated the expression levels of 4-1BB and OX-40 while
decreasing the levels of PD-1 and TIM-3 on the surface of T cells,
and the effect was more pronounced when 053 was combined with GEM
in vivo. Furthermore, autophagy deficiency leads to the
accumulation of cytoplasmic DNA (such as the release of
mitochondrial DNA), blocking STING degradation and promoting the
secretion of type I interferons and pro-inflammatory factors
through the cGAS/STING pathway, which enhances CD8+ T
cell infiltration (44,45). The results of the present study
further indicated that compound 053 upregulated the expression of
IFN-γ and Granzyme B in T cells, thereby promoting T cell
activation and proliferation. In the 4T1 xenograft model, treatment
with 053 significantly enhanced the infiltration of CD8+
T cells into tumor tissues. IRGQ-mediated autophagy inhibition can
reduce the degradation of MHC class I molecules, enhance tumor
antigen presentation and promote T cell recognition (46). This aligns with the findings of
the present study in which compound 053 not only inhibited tumor
cell autophagy but also exhibited immunostimulatory properties.
Therefore, the regulatory effect of autophagy deficiency in tumor
cells on immune responses is likely secondary. However, the
mechanistic link between autophagy inhibition and immune regulation
in the present study still needs further validation, such as
knocking out key autophagy genes in TNBC cells to explore whether
053 has similar immune regulatory effects.
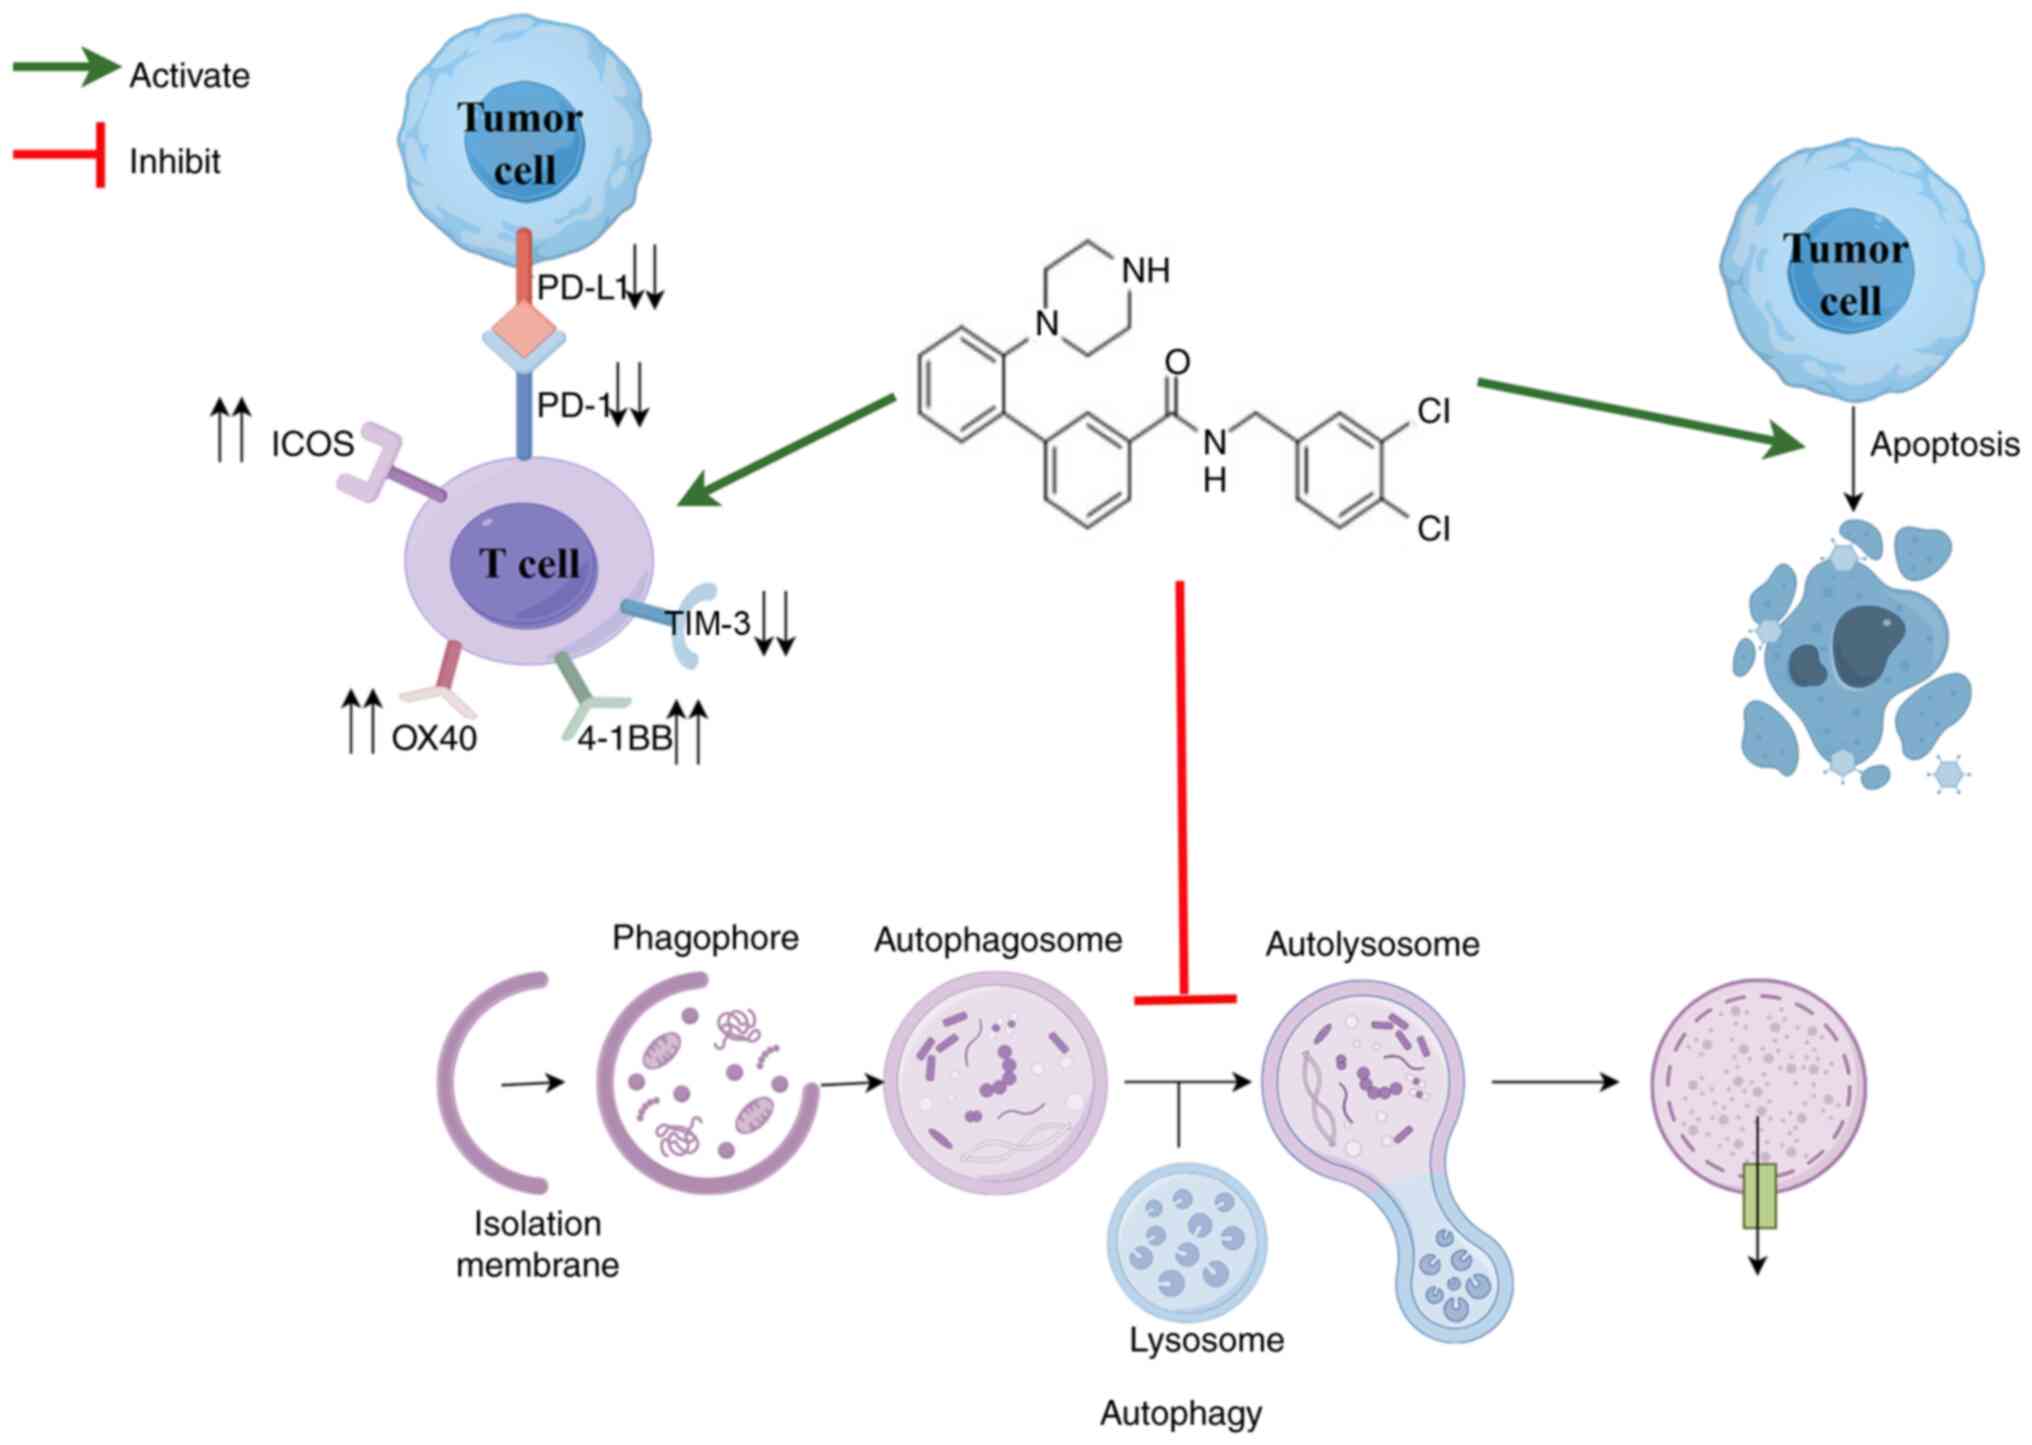
In conclusion, in the present study, small molecule
compounds were selected to investigate their modulatory effects on
autophagy and immune responses in tumor. Notably, the results
showed that the small molecule compound 053 not only inhibited
autophagy but also downregulated the expression of PD-L1 while
promoting the activation and proliferation of T cells by regulating
co-stimulatory and co-inhibitory molecules on the surface of T
cells (Fig. 9). This compound
activated antitumor immunity while inhibiting autophagy, blocking
the self-protective mechanisms of tumor cells under chemotherapy
stress, thereby enhancing their sensitivity to treatment. For
difficult-to-treat subtypes of breast cancer, such as TNBC, this
compound may fill the gap in existing immunotherapy resistance,
providing a novel strategy to overcome resistance to traditional
treatments. Future research should further explore the interaction
between key pathways regulating breast cancer autophagy and the
immune microenvironment. Additionally, investigating the in
vivo efficacy of 053 in metastatic lesions and its ability to
reverse resistance, as well as verifying whether the combination of
053 with chemotherapy drugs or immune checkpoint inhibitors can
improve efficacy, could provide new therapeutic strategies for
multi-target intervention in breast cancer. However, the present
study has certain limitations as it only examined the autophagy
inhibition and immune-promoting effects of compound 053 on breast
cancer cells. To further elucidate the mechanistic relationship
between 053-induced autophagy inhibition and immunomodulation and
to determine whether its immune effects are secondary consequences
or independent mechanisms, genetic knockout of key autophagy genes
in TNBC cells should be performed.
Supplementary Data
Availability of data and materials
The data generated in the present study may be
requested from the corresponding author.
Authors' contributions
JL developed the framework of the study; JL,YY,
LuC, FC and HZ performed the experiments, investigation and
analyzed the data; JL and YY were responsible for drafting the
initial manuscript; JL, SC, PQ, YL, LiC and YS interpreted the data
and wrote and revised the manuscript; HC and QL designed and
supervised the study, interpreted the data and wrote and revised
the manuscript; JL, HC and QL confirm the authenticity of all the
raw data. All authors read and approved the final version of the
manuscript.
Ethics approval and consent to
participate
The in vivo mouse study procedures were
performed in accordance with the regulations of the Laboratory
Animal Ethics Committee of the College of Biological Sciences and
Engineering, Fuzhou University (Fuzhou, China; approval no.
2022-SG-022). Peripheral blood mononuclear cells were isolated from
healthy individuals in compliance with the regulations set forth by
the Ethics Committee of Fujian Cancer Hospital (Fuzhou, China;
approval no. K2023-305-01). This process included obtaining
informed consent documents (approval no. 1.0, 2023.8.18).
Patient consent for publication
Not applicable.
Competing interests
The authors declare that they have no competing
interests.
Acknowledgements
Not applicable.
Funding
The present study was funded by the National Natural Science
Foundation of China (grant no. 82374081), Joint Funds for the
Innovation of Science and Technology, Fujian Province, China (grant
nos. 2023Y9406 and 2021Y9209), Natural Science Foundation of Fujian
(grant no. 2024J011065), Major Scientific Research Program for
Young and Middle-aged Health Professionals of Fujian Province,
China (grant no. 2022ZQNZD008), High-level Talents Training Project
of Fujian Cancer Hospital (grant nos. 2022YNG04 and 2023YNG02) and
The Fuzhou University Testing Fund of Precious Apparatus (grant no.
2024T019).
References
|
1
|
Sung H, Ferlay J, Siegel RL, Laversanne M,
Soerjomataram I, Jemal A and Bray F: Global cancer statistics 2020:
GLOBOCAN estimates of incidence and mortality worldwide for 36
cancers in 185 countries. CA Cancer J Clin. 71:209–249. 2021.
|
|
2
|
Xiong X, Zheng LW, Ding Y, Chen YF, Cai
YW, Wang LP, Huang L, Liu CC, Shao ZM and Yu KD: Breast cancer:
Pathogenesis and treatments. Signal Transduct Target Ther.
10:492025. View Article : Google Scholar :
|
|
3
|
Obidiro O, Battogtokh G and Akala EO:
Triple negative breast cancer treatment options and limitations:
Future outlook. Pharmaceutics. 15:17962023. View Article : Google Scholar :
|
|
4
|
Milane LS, Dolare S, Ren G and Amiji M:
Combination organelle mitochondrial endoplasmic reticulum therapy
(COMET) for multidrug resistant breast cancer. J Control Release.
363:435–451. 2023. View Article : Google Scholar
|
|
5
|
Liu J, Liu Y, Wang Y, Li C, Xie Y,
Klionsky DJ, Kang R and Tang D: TMEM164 is a new determinant of
autophagy-dependent ferroptosis. Autophagy. 19:945–956. 2023.
View Article : Google Scholar
|
|
6
|
Tanida I: Autophagosome formation and
molecular mechanism of autophagy. Antioxid Redox Signal.
14:2201–2214. 2011. View Article : Google Scholar
|
|
7
|
Quan Y, Lei H, Wahafu W, Liu Y, Ping H and
Zhang X: Inhibition of autophagy enhances the anticancer effect of
enzalutamide on bladder cancer. Biomed Pharmacother.
120:1094902019. View Article : Google Scholar : PubMed/NCBI
|
|
8
|
Cocco S, Leone A, Piezzo M, Caputo R, Di
Lauro V, Di Rella F, Fusco G, Capozzi M, Gioia GD, Budillon A and
De Laurentiis M: Targeting autophagy in breast cancer. Int J Mol
Sci. 21:78362020. View Article : Google Scholar : PubMed/NCBI
|
|
9
|
Zhang L, Jiang L, Yu L, Li Q, Tian X, He
J, Zeng L, Yang Y, Wang C, Wei Y, et al: Inhibition of UBA6 by
inosine augments tumour immunogenicity and responses. Nat Commun.
13:54132022. View Article : Google Scholar
|
|
10
|
Zhao H, Yang M, Zhao J, Wang J, Zhang Y
and Zhang Q: High expression of LC3B is associated with progression
and poor outcome in triple-negative breast cancer. Med Oncol.
30:4752013. View Article : Google Scholar : PubMed/NCBI
|
|
11
|
Yu S, Cao Z, Cai F, Yao Y, Chang X, Wang
X, Zhuang H and Hua ZC: ADT-OH exhibits anti-metastatic activity on
triple-negative breast cancer by combinatorial targeting of
autophagy and mitochondrial fission. Cell Death Dis. 15:4632024.
View Article : Google Scholar : PubMed/NCBI
|
|
12
|
Hamurcu Z, Delibaşı N, Geçene S, Şener EF,
Dönmez-Altuntaş H, Özkul Y, Canatan H and Ozpolat B: Targeting LC3
and Beclin-1 autophagy genes suppresses proliferation, survival,
migration and invasion by inhibition of Cyclin-D1 and uPAR/Integrin
β1/Src signaling in triple negative breast cancer cells. J Cancer
Res Clin Oncol. 144:415–430. 2018. View Article : Google Scholar
|
|
13
|
Spinelli FR, Moscarelli E, Ceccarelli F,
Miranda F, Perricone C, Truglia S, Garufi C, Massaro L, Morello F,
Alessandri C, et al: Treating lupus patients with antimalarials:
Analysis of safety profile in a single-center cohort. Lupus.
27:1616–1623. 2018. View Article : Google Scholar : PubMed/NCBI
|
|
14
|
Zheng Z, Liu J, Ma J, Kang R, Liu Z and Yu
J: Advances in new targets for immunotherapy of small cell lung
cancer. Thorac Cancer. 15:3–14. 2024. View Article : Google Scholar :
|
|
15
|
Herrera-Quintana L, Vázquez-Lorente H and
Plaza-Diaz J: Breast cancer: Extracellular matrix and microbiome
interactions. Int J Mol Sci. 25:72262024. View Article : Google Scholar : PubMed/NCBI
|
|
16
|
Duan Z, Shi Y, Lin Q, Hamaï A, Mehrpour M
and Gong C: Autophagy-associated immunogenic modulation and its
applications in cancer therapy. Cells. 11:23242022. View Article : Google Scholar : PubMed/NCBI
|
|
17
|
Galluzzi L, Buqué A, Kepp O, Zitvogel L
and Kroemer G: Immunological effects of conventional chemotherapy
and targeted anticancer agents. Cancer Cell. 28:690–714. 2015.
View Article : Google Scholar
|
|
18
|
Xu X, Araki K, Li S, Han JH, Ye L, Tan WG,
Konieczny BT, Bruinsma MW, Martinez J, Pearce EL, et al: Autophagy
is essential for effector CD8(+) T cell survival and memory
formation. Nat Immunol. 15:1152–1161. 2014. View Article : Google Scholar :
|
|
19
|
Liu YC, Shou ST and Chai YF: Immune
checkpoints in sepsis: New hopes and challenges. Int Rev Immunol.
41:207–216. 2022. View Article : Google Scholar
|
|
20
|
Thomenius MJ, Totman J, Harvey D, Mitchell
LH, Riera TV, Cosmopoulos K, Grassian AR, Klaus C, Foley M,
Admirand EA, et al: Small molecule inhibitors and CRISPR/Cas9
mutagenesis demonstrate that SMYD2 and SMYD3 activity are
dispensable for autonomous cancer cell proliferation. PLoS One.
13:e01973722018. View Article : Google Scholar :
|
|
21
|
Eggert E, Hillig RC, Koehr S, Stöckigt D,
Weiske J, Barak N, Mowat J, Brumby T, Christ CD, Ter Laak A, et al:
Discovery and characterization of a highly potent and selective
aminopyrazoline-based in vivo probe (BAY-598) for the protein
lysine methyltransferase SMYD2. J Med Chem. 59:4578–4600. 2016.
View Article : Google Scholar : PubMed/NCBI
|
|
22
|
Sweis RF, Wang Z, Algire M, Arrowsmith CH,
Brown PJ, Chiang GG, Guo J, Jakob CG, Kennedy S, Li F, et al:
Discovery of A-893, a new cell-active benzoxazinone inhibitor of
lysine methyltransferase SMYD2. ACS Med Chemi Lett. 6:695–700.
2015. View Article : Google Scholar
|
|
23
|
Zhang B, Liao L, Wu F, Zhang F, Sun Z,
Chen H and Luo C: Synthesis and structure-activity relationship
studies of LLY-507 analogues as SMYD2 inhibitors. Bioorg Med Chem
Lett. 30:1275982020. View Article : Google Scholar : PubMed/NCBI
|
|
24
|
Tam S, Al-Zubaidi Y, Rahman MK, Bourget K,
Zhou F and Murray M: The ixabepilone and vandetanib combination
shows synergistic activity in docetaxel-resistant MDA-MB-231 breast
cancer cells. Pharmacol Rep. 74:998–1010. 2022. View Article : Google Scholar : PubMed/NCBI
|
|
25
|
Wang K, Zhu X and Yin Y: Maslinic acid
enhances docetaxel response in human docetaxel-resistant triple
negative breast carcinoma MDA-MB-231 cells via regulating
MELK-FoxM1-ABCB1 signaling cascade. Front Pharmacol. 11:8352020.
View Article : Google Scholar : PubMed/NCBI
|
|
26
|
Taherian A and Mazoochi T: Different
expression of extracellular signal-regulated kinases (ERK) 1/2 and
Phospho-Erk Proteins in MBA-MB-231 and MCF-7 cells after
chemotherapy with doxorubicin or docetaxel. Iran J Basic Med Sci.
15:669–677. 2012.PubMed/NCBI
|
|
27
|
Jones S, Holmes FA, O'Shaughnessy J, Blum
JL, Vukelja SJ, McIntyre KJ, Pippen JE, Bordelon JH, Kirby RL,
Sandbach J, et al: Docetaxel with cyclophosphamide is associated
with an overall survival benefit compared with doxorubicin and
cyclophosphamide: 7-year follow-up of US oncology research trial
9735. J Clin Oncol. 27:1177–1183. 2009. View Article : Google Scholar : PubMed/NCBI
|
|
28
|
Capri G, Tarenzi E, Fulfaro F and Gianni
L: The role of taxanes in the treatment of breast cancer. Semin
Oncol. 23(Suppl 2): S68–S75. 1996.
|
|
29
|
McLeland CB, Rodriguez J and Stern ST:
Autophagy monitoring assay: Qualitative analysis of MAP LC3-I to II
conversion by immunoblot. Methods Mol Biol. 697:199–206. 2011.
View Article : Google Scholar
|
|
30
|
Colosetti P, Puissant A, Robert G, Luciano
F, Jacquel A, Gounon P, Cassuto JP and Auberger P: Autophagy is an
important event for megakaryocytic differentiation of the chronic
myelogenous leukemia K562 cell line. Autophagy. 5:1092–1098. 2009.
View Article : Google Scholar : PubMed/NCBI
|
|
31
|
Mauthe M, Orhon I, Rocchi C, Zhou X, Luhr
M, Hijlkema KJ, Coppes RP, Engedal N, Mari M and Reggiori F:
Chloroquine inhibits autophagic flux by decreasing
autophagosome-lysosome fusion. Autophagy. 14:1435–1455. 2018.
View Article : Google Scholar : PubMed/NCBI
|
|
32
|
Xu Z, Han X, Ou D, Liu T, Li Z, Jiang G,
Liu J and Zhang J: Targeting PI3K/AKT/mTOR-mediated autophagy for
tumor therapy. Appl Microbiol Biotechnol. 104:575–587. 2020.
View Article : Google Scholar
|
|
33
|
Cui Y, Shi J, Cui Y, Zhu Z and Zhu W: The
relationship between autophagy and PD-L1 and their role in
antitumor therapy. Front Immunol. 14:10935582023. View Article : Google Scholar : PubMed/NCBI
|
|
34
|
Kroczek R and Hamelmann E: T-cell
costimulatory molecules: Optimal targets for the treatment of
allergic airway disease with monoclonal antibodies. J Allergy Clin
Immunol. 116:906–909. 2005. View Article : Google Scholar : PubMed/NCBI
|
|
35
|
Roy D, Gilmour C, Patnaik S and Wang LL:
Combinatorial blockade for cancer immunotherapy: Targeting emerging
immune checkpoint receptors. Front Immunol. 14:12643272023.
View Article : Google Scholar : PubMed/NCBI
|
|
36
|
Zhang L, Qiang P, Yu J, Miao Y, Chen Z, Qu
J, Zhao Q, Chen Z, Liu Y, Yao X, et al: Identification of compound
CA-5f as a novel late-stage autophagy inhibitor with potent
anti-tumor effect against non-small cell lung cancer. Autophagy.
15:391–406. 2019. View Article : Google Scholar :
|
|
37
|
Wu ST, Han SS, Xu XM, Sun HJ, Zhou H,
Shang K, Liu ZH and Liang SJ: 3-methyladenine ameliorates
surgery-induced anxiety-like behaviors in aged mice by inhibiting
autophagy-induced excessive oxidative stress. Metab Brain Dis.
38:1913–1923. 2023. View Article : Google Scholar : PubMed/NCBI
|
|
38
|
Shih FC, Lin CF, Wu YC, Hsu CC, Chen BC,
Chang YC, Lin YS, Satria RD, Lin PY and Chen CL:
Desmethylclomipramine triggers mitochondrial damage and death in
TGF-β-induced mesenchymal type of A549 cells. Life Sci.
351:1228172024. View Article : Google Scholar
|
|
39
|
Dong X, Zhao R, Li Y, Yu Q, Chen X, Hu X,
Ma J, Chen X, Huang S and Chen L: Maduramicin inactivation of Akt
impairs autophagic flux leading to accumulated
autophagosomes-dependent apoptosis in skeletal myoblast cells. Int
J Biochem Cell Biol. 114:1055732019. View Article : Google Scholar : PubMed/NCBI
|
|
40
|
Pan SW, Hu LS, Wang H, Li RT, He YJ, Shang
Y, Dai ZL, Chen LX and Xiong W: Resolvin D1 induces
mTOR-independent and ATG5-dependent autophagy in BV-2 microglial
cells. Curr Med Sci. 43:1096–1106. 2023. View Article : Google Scholar : PubMed/NCBI
|
|
41
|
Jain V, Singh MP and Amaravadi RK: Recent
advances in targeting autophagy in cancer. Trends Pharmacol Sci.
44:290–302. 2023. View Article : Google Scholar : PubMed/NCBI
|
|
42
|
Liu Q, Yang Y, Cheng M, Cheng F, Chen S,
Zheng Q, Sun Y and Chen L: The marine natural product, dicitrinone
B, induces apoptosis through autophagy blockade in breast cancer.
Int J Mol Med. 50:1302022. View Article : Google Scholar : PubMed/NCBI
|
|
43
|
Young TM, Reyes C, Pasnikowski E,
Castanaro C, Wong C, Decker CE, Chiu J, Song H, Wei Y, Bai Y, et
al: Autophagy protects tumors from T cell-mediated cytotoxicity via
inhibition of TNFα-induced apoptosis. Sci Immunol. 5:eabb95612020.
View Article : Google Scholar
|
|
44
|
Prabakaran T, Bodda C, Krapp C, Zhang BC,
Christensen MH, Sun C, Reinert L, Cai Y, Jensen SB, Skouboe MK, et
al: Attenuation of cGAS-STING signaling is mediated by a
p62/SQSTM1-dependent autophagy pathway activated by TBK1. EMBO J.
37:e978582018. View Article : Google Scholar : PubMed/NCBI
|
|
45
|
Zhang HJ, Liang CL, Ding XY, Zhang M, Lu
SY and Hou L: Manganese-based nano-delivery system for sensitized
anti-tumor immunotherapy via combined autophagy inhibition. Chinese
Chem Lett. 36:1105252025. View Article : Google Scholar
|
|
46
|
Herhaus L, Gestal-Mato U, Eapen VV,
Mačinković I, Bailey HJ, Prieto-Garcia C, Misra M, Jacomin AC,
Ammanath AV, Bagarić I, et al: IRGQ-mediated autophagy in MHC class
I quality control promotes tumor immune evasion. Cell.
187:7285–7302.e29. 2024. View Article : Google Scholar : PubMed/NCBI
|