Introduction
Ovarian cancer (OC) is the most lethal disease of
the female reproductive system (1,2).
The initial approach for OC treatment is tumor reduction followed
by chemotherapy, including platinum and paclitaxel (PTX) (3). Although PTX has shown good effects
in the clinical practice of OC treatment, some patients eventually
develop drug resistance, which is the main cause of treatment
failure in patients with OC (4,5).
The ABCB1-encoded drug transporter P-glycoprotein is
considered to induce chemoresistance (6); however, a previous study has
revealed that there are other mechanisms responsible for PTX
resistance (7), which might
provide a renewed sense of optimism for the clinical management of
patients with OC with PTX resistance.
Apoptosis, a form of programmed cell death,
influences tumor cell fate decisions (8). Dysregulation in the apoptotic
pathway of OC cells may cause the occurrence of chemoresistance
(9). Apoptosis can be categorized
into two main types: Intrinsic and extrinsic apoptosis (10,11). Intrinsic apoptosis is triggered
when the outer membrane of the mitochondria becomes leaky and
allows cytochrome c to escape from the mitochondria, forming
an apoptosome and activating caspase-9 (12). Extrinsic apoptosis is activated
via membrane receptors, also referred to as death receptors, such
as Fas cell surface death receptor (FAS; also referred to as CD95
and APO-1), tumor necrosis factor receptor-1 and Toll-like
receptors, forming signaling complexes and activating caspase-8
(CASP8) (12,13). The induction of apoptosis is a
hallmark of PTX-treated cancer cells (14) and exploiting this pathway
represents a potential strategy to reverse PTX resistance (15). Nevertheless, the specific
mechanisms of chemoresistance reversal via apoptosis require
further elucidation.
STAT1 is a transcription factor (TF) involved in
diverse biological processes, including the regulation of malignant
behavior in various cancer types (16,17). The STAT1 gene is located at
2q32.2 in the human genome with a total length of 45,215 bp and has
two major transcripts, STAT1α and STAT1β, which are generated
through alternative splicing (18,19). Our previous study has shown that
STAT1α is the main functional variant that serves an important role
in the development of OC (20).
Furthermore, using our Target Finder of Transcription Factor
(TFoTF) tool (21), some
apoptotic genes were predicted to be target genes of STAT1. Based
on this prediction, the present study aimed to elucidate the
mechanisms of STAT1-mediated apoptosis to reverse PTX resistance in
OC cells.
Materials and methods
Cell culture
The human OC cell lines utilized in the present
study are cataloged with Research Resource Identifiers (https://scicrunch.org/resources; Table SI). Each cell line underwent
authentication through short tandem repeat profiling and was
consistently screened to ensure it was free from pathogen and
mycoplasma contamination. SK-OV-3, OVCAR-3 and 293T cells were
purchased from Shanghai Fuheng Biotechnology Co., Ltd. A2780 cells
and their PTX-resistant counterpart A2780-PTX cells were purchased
from Nanjing KeyGen Biotech Co., Ltd. The PTX-resistant OC cell
lines SK3R-PTX and OV3R-PTX were developed from their parental cell
lines SK-OV-3 and OVCAR-3 as previously described (22). For cell culture, 293T, SK-OV-3,
SK3R-PTX, A2780 and A2780-PTX cells were maintained in DMEM (Gibco;
Thermo Fisher Scientific, Inc.) supplemented with 10% FBS
(Invitrogen; Thermo Fisher Scientific, Inc.). OVCAR-3 and OV3R-PTX
cells were maintained in RPMI-1640 (Gibco; Thermo Fisher
Scientific, Inc.) supplemented with 20% FBS. All cells were
cultured at 37°C in a humidified atmosphere with 5%
CO2.
Construction of Tet-On
STAT1-overexpression plasmids and lentiviral infection
Based on our previously generated
STAT1-overexpression plasmids (20), two novel STAT1α and STAT1β
plasmids containing green fluorescent protein (GFP) were
constructed using the Tet-On gene expression system (23) and packaged into lentiviruses. The
lentiviral plasmid pLenti-TET-on-GFP-puro (gift from Professor
Yanyan Zhan, Cancer Research Center, School of Medicine, Xiamen
University, Xiamen, China) was co-transfected with the
second-generation packaging plasmid psPAX2 and the VSV-G envelope
plasmid pMD2.G (both from Addgene, Inc.) into the 293T interim
cells. For a standard 10-cm dish, the transfection mixture
contained 4.0 μg of the lentiviral plasmid, with a mass
ratio of 4:3:1 for the pLenti-TET-on-GFP-puro, psPAX2 and pMD2.G
plasmids, respectively. Transfection was carried out at 37°C with
5% CO2 for 6-8 h, after which the medium was replaced.
Lentiviral particle-containing supernatant was collected at 48 and
72 h post-transfection, pooled, clarified by filtration through a
0.45-μm filter. The empty vector (pLenti-tet-on-GFP) was
used as a negative control (NC). The sequences of primers used for
Tet-On plasmid cloning are listed in Table SII. The inserted sequences of the
two variants are detailed in Table
SIII. The maps of plasmids (pLenti-tet-on-GFP,
pLenti-tet-on-STAT1α-GFP and pLenti-tet-on-STAT1β-GFP) and the
validation of STAT1 protein expression after induction in the
presence of 8 μg/ml doxycycline (at 37°C for 4 days; Dox;
Beyotime Biotechnology) by western blotting are shown in Fig. S1. The STAT1-overexpressing cells
were generated after lentiviral infection at an MOI of 5 per well
in a 6-well plate for 48 h and further culture with puromycin (5
μg/ml) for 10 days to ensure stable integration. GFP
expression was visualized and confirmed using fluorescence
microscopy. The excitation and emission wavelengths for GFP were
488 and 509 nm, respectively.
Cell viability and PTX sensitivity
assays
PTX-resistant cells (SK3R-PTX, OV3R-PTX and
A2780-PTX cells) and their parental sensitive cells (SK-OV-3,
OVCAR-3 and A2780 cells) were seeded in 96-well plates at a density
of 5×10³ cells/well. Lentivirus-infected SK3R-PTX,
OV3R-PTX and A2780-PTX cells with plasmids (pLenti-tet-on-GFP,
pLenti-tet-on-STAT1α-GFP and pLenti-tet-on-STAT1β-GFP) were
replated into 96-well plates at a density of 5×10³
cells/well and induced in the presence of 8 μg/ml Dox at
37°C for 4 days. After treatment with varying concentrations of PTX
(0, 0.0001, 0.001, 0.01, 0.1, 1 and 10 μM) at 37°C for 48 h,
cell viability was assessed using a Cell Counting Kit-8 (CCK-8;
Beyotime Biotechnology). After 2 h of incubation, absorbance was
measured at 450 nm using a Multiscan Spectrum (BioTek; Agilent
Technologies, Inc.). Finally, a nonlinear fit was performed using
the Hill model, and the absolute IC50 value was
calculated. To assess PTX sensitivity, each cell type was treated
with a dose of PTX corresponding to its IC50 values at
37°C. Cell viability was determined using a dose of 0.01 μM
for SK3R-PTX cells, 0.1 μM for OV3R-PTX cells and 0.01
μM for A2780-PTX cells at 0, 24 and 48 h at 37°C.
Xenograft mouse model
The animal experiments were approved by the
Laboratory Animal Welfare and Ethics Committee of the Shanghai
Public Health Clinical Center, Fudan University (approval no.
2020-A027-01; Shanghai, China). A total of 32 female BALB/c nude
mice (3 weeks old with an initial body weight of ~17 g; SPF
Biotechnology Co., Ltd.) were randomly assigned to four groups
(n=8/group): Empty vector + saline, overexpression vector
(oe-)STAT1α + saline, empty vector + PTX and oe-STAT1α + PTX. Each
mouse received a subcutaneous injection of lentivirus-infected
SK3R-PTX cells (5×10⁶ cells in 100 μl FBS-free
DMEM) into the right flank, and mice were housed under specific
pathogen-free conditions in a controlled environment (temperature,
22±2°C; humidity, 50±10%; 12/12-h light/dark cycle) with ad
libitum access to food and autoclaved water. Measurements of
body weight and tumor size (calculated as long diameter × short
diameter2/2) were performed every 2 days. When the tumor
size reached ~50 mm3 (14 days after tumor cells
injection), the mouse was administered an intratumoral injection of
PTX (10 mg/kg; marked as day 0), which was repeated once after 4
days. Starting from the first PTX injection, animals drank
pre-prepared water containing 2 mg/ml Dox and 1.25% sucrose
(24). On day 8, each mouse was
euthanized by administering 200 mg/kg pentobarbital via
intraperitoneal injection. Subsequently, images of mice were
captured using a small-animal live imaging system (Guangzhou
Biolight Biotechnology Co., Ltd.). After sacrificing, the tumors
were excised and images captured.
Treatment with an apoptosis
inhibitor
STAT1-overexpressing PTX-resistant cells were
maintained in complete medium with 0.1 μM PTX in 96-well
plates (5,000 cells/well) and treated with the apoptosis inhibitor
Z-VAD-FMK (20 μM; Beyotime Biotechnology) or solvent control
DMSO (Beyotime Biotechnology) at 37°C for 48 h. The viability of
cells was determined using a CCK-8 assay as aforementioned. The
experiments were repeated three times.
RNA extraction and reverse
transcription-quantitative PCR (RT-qPCR)
Total RNA of cells was isolated using the RNA-Quick
Purification Kit (Shanghai Yeasen Biotechnology Co., Ltd.). The RNA
sample (500 ng) was reverse transcribed into cDNA using the
Transcriptor First Strand cDNA Synthesis Kit (Roche Diagnostics) at
42°C for 1 h. RT-qPCR was carried out with BeyoFast SYBR Green
RT-qPCR Mix (Beyotime Biotechnology) according to the
manufacturer's protocols. The primer sequences for RT-qPCR are
listed in Table SIV. The PCR
cycling settings included an initial denaturation step (95°C for 1
min), followed by 40 cycles of denaturation (95°C for 10 sec) and
annealing/extension (60°C for 30 sec). The threshold cycle (Cq)
value was measured using the 7300 real-time PCR system (version
1.4; Applied Biosystems; Thermo Fisher Scientific, Inc.). β-actin
served as the internal control for normalizing gene expression.
Relative target gene expression was calculated using the
2−ΔΔCq method (25).
The experiments were repeated at least three times.
Protein extraction and western blot
analysis
Total protein of cells was isolated using SDS Lysis
Buffer (Nanjing KeyGen Biotech Co., Ltd.) supplemented with
phenylmethanesulfonyl fluoride and phosphatase inhibitors (Nanjing
KeyGen Biotech Co., Ltd.). The concentration of extracted protein
was determined using a BCA protein assay kit (Beyotime
Biotechnology) and a microplate spectrophotometer (Epoch; BioTek;
Agilent Technologies, Inc.). Total protein (20 μg/lane) was
run on a 10% SDS-PAGE gel and subsequently transferred to a PVDF
membrane (MilliporeSigma). The membrane was blocked with 5% non-fat
milk for 1 h at room temperature and then incubated with a primary
antibody overnight at 4°C, followed by incubation with a secondary
antibody for 1 h at room temperature. The following primary
antibodies were used: Anti-STAT1 (cat. no. 42H3; dilution, 1:1,000)
from Cell Signaling Technology, Inc.; and anti-FAS (cat. no.
13098-1-AP; dilution, 1:1,000), anti-CASP8 (cat. no. 66093-1-Ig;
dilution, 1:1,000; this antibody can recognize pre- and
cleaved-CASP8) and anti-β-actin (cat. no. 66009-1-Ig; dilution,
1:5,000) from Proteintech Group, Inc. The following secondary
antibodies were used: HRP-conjugated goat anti-mouse IgG (cat. no.
SA00001-1; dilution, 1:5,000) and HRP-conjugated goat anti-rabbit
IgG (cat. no. SA00001-2; dilution, 1:5,000) from Proteintech Group,
Inc. Protein bands were visualized using the BeyoECL Moon
chemiluminescence kit (cat. no. P0018FS; Beyotime Biotechnology),
and images were captured and analyzed using the Tanon-4500 imaging
system (Tanon Science and Technology Co., Ltd.).
Apoptosis assay
STAT1-overexpressing PTX-resistant cells were
cultured in complete medium. After treatment with PTX (0, 0.1, 1
and 10 μM) at 37°C for 24 h, cells were harvested, washed
with PBS, resuspended in 500 μl 1X binding buffer, and
stained with 3 μl FITC Annexin V (BD Biosciences) and 5
μl PI (BD Biosciences) for 15 min. Apoptotic cells were
detected using flow cytometry (GALLIOS™; Beckman Coulter, Inc.)
according to the manufacturer's instructions. Data were evaluated
and analyzed using ModFit software (v 3.1; Verity Software House,
Inc.). The experiments were repeated three times.
Immunofluorescence staining
Cells were plated in a 35-mm confocal culture dish
featuring a 20-mm glass bottom at 1×10⁵ cells/dish and
cultured in medium with 8 μg/ml Dox at 37°C for 4 days. Once
the cells reached 50-70% confluence, they were fixed with 4%
paraformaldehyde at room temperature for 15 min and subsequently
washed with PBS for 5 min. Following permeabilization with 0.1%
Triton X-100 in PBS for 15 min, the cells were treated with
QuickBlock Blocking Buffer for Immunol Staining (Beyotime
Biotechnology) for 1 h at room temperature. Cells were incubated
with either rabbit anti-FAS antibody (cat. no. 13098-1-AP;
dilution, 1:400; Proteintech Group, Inc.) or mouse anti-CASP8
antibody (cat. no. 66093-1-Ig; dilution, 1:400; Proteintech Group,
Inc.) at 4°C for 12 h, followed by incubation with rabbit
anti-STAT1 antibody (cat. no. 42H3; dilution, 1:4,000; Cell
Signaling Technology, Inc.) at 4°C for another 12 h. Subsequently,
the cells were treated with Alexa Fluor 594-conjugated goat
anti-rabbit IgG (cat. no. 8760S; dilution, 1:1,000) or Alexa Fluor
647-conjugated goat anti-mouse IgG (cat. no. 4410S; dilution,
1:1,000) secondary antibody (Cell Signaling Technology, Inc.) for 2
h at room temperature in the dark. After staining the nucleus with
DAPI (Beyotime Biotechnology) for 5 min at room temperature,
fluorescence images were acquired using a fluorescence microscope
(Olympus Corporation) and analyzed using Adobe Photoshop (version
24.3.0; Adobe Systems, Inc.).
Dual-luciferase reporter gene assay
The plasmid of the firefly luciferase reporter gene
was constructed by the insertion of PCR products of FAS or CASP8
cDNAs amplified using a promoter region as a template from cultured
cells. The thermocycling conditions were: initial denaturation at
95°C for 1 min, 15 cycles of denaturation at 95°C for 15 sec,
annealing at 65°C (the temperature was reduced by 1°C after each
cycle) for 15 sec and extension at 72°C for 30 sec, 25 cycles of
denaturation at 95°C for15 sec, annealing at 58°C for 15 sec and 7
extension at 2°C for 30 sec and final extension at 72°C for 5 min.
The template DNA were extracted using a TIANamp Genomic DNA Kit
(Tiangen Biotech Co., Ltd.) according to the standard
manufacturer's instructions. PrimeSTAR Max DNA Polymerase (cat. no.
R047A; Takara Bio, Inc.) was used for PCR, and experiments were
performed according to the manufacturer's instruction. The
sequences of primers are listed in Table SV. 293T cells were co-transfected
with pGL4.10 firefly luciferase reporter and pRL-TK Renilla
luciferase reporter plasmids (Promega Corporation) and oe-STAT1α/β
plasmid or empty vector using Lipo8000™ Transfection Reagent (cat.
no. C0533-0.5ml; Beyotime Biotechnology). Luciferase activity was
determined using a Dual-Luciferase Reporter Gene Assay Kit
(Shanghai Yeasen Biotechnology Co., Ltd.) and a Fluoroskan Ascent
FL (Thermo Fisher Scientific, Inc.) after 48 h of transfection. The
experiments were conducted according to the manufacturer's protocol
and were repeated three times. Results were calculated and
normalized using the following formula: Relative activity (fold
change)=mean value of experimental group (FLUC/RLUC)/mean value of
control group (FLUC/RLUC), where FLUC indicates firefly luciferase
readings and RLUC indicates Renilla luciferase readings.
Bioinformatics analysis
To distinguish gene expression between A2780-PTX and
A2780 cells, mRNA-sequencing was performed (26). Total RNA was extracted by
RNA-Quick Purification Kit (ESScience) according to the
manufacturer's instructions. mRNA-sequencing analysis was performed
by Gene Denovo Co. Ltd. (Guangzhou, Guangdong, China). The
differentially expressed TFs based on mRNA-sequencing were analyzed
using Gene Ontology (GO) using the 'clusterProfiler' (ver. 4.18.1)
(27) and 'GOplot' (ver. 1.0.2)
(28) R packages (ver. 4.2.2;
https://www.r-project.org/). The target
genes of STAT1 were predicted by TFoTF (ver. 1.0) with default
settings, and position weight matrix (PWM) scores were calculated
to evaluate the regulatory relations (21). The PWM of each TF was obtained
using the R package JASPAR2020 (version 0.99.10; http://jaspar.genereg.net/). The pan-cancer
transcriptome expression data were obtained from The Cancer Genome
Atlas (TCGA; https://www.cancer.gov/ccg/research/genome-sequencing/tcga).
Samples from each type of cancer were classified into a STAT1-high
group (expression levels >80th percentile in all types of
cancer) and a STAT1-low group (expression levels <20th
percentile in all types of cancer). The differences between the
STAT1-high and -low groups in terms of functional annotations were
analyzed using Gene Set Enrichment Analysis (GSEA; version 4.2.2;
https://www.gsea-msigdb.org/gsea/index.jsp) and
hallmark gene sets (version 7.5.1) (29). Kaplan-Meier survival analysis was
performed using the 'lifelines' Python package (ver. 0.30.0)
(30) based on the OC
transcriptome expression data and survival data downloaded from
TCGA (TCGA-OV). The parameters were set as default following the
official user guide. The cut-off values were defined as: Patients
with gene expression levels >80th percentile were considered to
be high-expressed, and gene expression levels <20th percentile
were considered to be low-expressed. The significance was
determined by log-rank test. The chromatin
immunoprecipitation-sequencing (ChIP-seq) peak data (GSM320736)
were obtained from Gene Expression Omnibus (GEO; https://www.ncbi.nlm.nih.gov/geo/) (31,32) and analyzed by peak annotation
analysis using the 'ChIPseeker' (ver. 1.32.1) (33) and 'GenomicFeatures' (ver. 1.62.0)
R packages (34). Transcriptome
expression data (GSE51373) of chemotherapy-sensitive and -resistant
patients downloaded from the GEO database were analyzed for
differential gene expression analysis (35). The Pearson correlation between the
cell line transcriptome expression and chemotherapeutic agent
sensitivity was analyzed with the 'SciPy' Python package (ver.
1.16.3) (36). The drug
sensitivity data were sourced from CellMiner (https://discover.nci.nih.gov/cellminer/). The Python
version used was 3.12.11 (https://www.python.org/).
Statistical analysis
Data were analyzed using the 'SciPy' and
'statsmodels' packages (ver. 0.14.4; https://www.statsmodels.org/stable/index.html) in the
Python environment, if not otherwise stated, and were plotted using
the 'Matplotlib' Python package (ver. 3.9.0; https://matplotlib.org/) and the 'ggplot2' R package
(ver. 4.0.0; https://ggplot2.tidyverse.org/) using GraphPad Prism 8
software (Dotmatics). The data are presented as the mean ± SD or
standard error of the mean. The linear trend test was performed
using GraphPad Prism 8. Differences between two groups were
analyzed using an unpaired Student's t-test. Differences among more
than two groups were analyzed using one-way or two-way ANOVA
followed by Tukey's Honestly Significant Difference test. P<0.05
was considered to indicate a statistically significant
difference.
Results
STAT1 is a marker of PTX resistance and
enhances PTX sensitivity in OC cells
PTX resistance was confirmed in the resistant cell
lines (SK3R-PTX, OV3R-PTX and A2780-PTX) by demonstrating reduced
sensitivity across a range of PTX concentrations compared with
their parental counterparts (SK-OV-3, OVCAR-3 and A2780) (Fig. 1A). After treatment with different
dose of PTX for 48 h, the absolute IC50 values of PTX
were 0.044 μM in SK3R-PTX cells vs. 0.012 μM in
SK-OV-3 cells, 4.016 μM in OV3R-PTX cells vs. 1.800
μM in OVCAR-3 cells, and 0.480 μM in A2780-PTX cells
vs. 0.001 μM in A2780 cells. Screening of differentially
expressed TF genes between A2780 and A2780-PTX cells using
mRNA-sequencing data from the JASPAR database showed that 34.2% of
TF genes were changed at the expression level (fold change, <0.4
or >2.5; P<0.05). Among the 588 differentially expressed TF
genes, 48.8% were downregulated and 51.2% were upregulated
(Fig. 1B). Further analyses of TF
genes with significantly altered gene expression showed that
STAT1 expression was lower in PTX-resistant A2780-PTX cells
(Fig. 1C). The significantly
altered expression of TF genes was classified by JASPAR annotation
and GO term analyses and these differentially expressed TFs between
A2780 and A2780-PTX cells may reflect the process of PTX resistance
(Fig. S2A-C). STAT1 mRNA
expression was lower in PTX-resistant cells than their counterpart
PTX-sensitive cells (P<0.01), except for STAT1β expression in
SK3R cells (P>0.05), based on RT-qPCR (Fig. 1D), and these changes were
confirmed at the protein level based on total STAT1 expression as
analyzed using western blotting (Fig.
1E). Overexpression of STAT1 using oe-STAT1 (mainly STAT1α)
lentiviral infection increased the PTX sensitivity (Fig. 1F-H) and decreased cell viability
(Fig. 1I-K) in three
PTX-resistant cell lines. Specifically, the absolute
IC50 values of PTX were 0.050, 0.029 and 0.211 μM
in SK3R-PTX cells, 5.329, 2.132 and 1.040 μM in OV3R-PTX
cells, and 0.883, 0.882 and 0.831 μM in A2780-PTX cells
after infection with empty vector, oe-STAT1α and oe-STAT1β,
respectively. Overexpression of STAT1 after Tet-On system-based
plasmid lentiviral infection was verified in three PTX-resistant
cell lines treated with or without 8 μg/ml Dox for 4 days as
immunofluorescent signals were captured by immunofluorescence
microscopy (Fig. S3A-C).
![Detection of STAT1 expression, and
effect of STAT1 on PTX sensitivity and viability in PTX-resistant
OC cells (SK3R-PTX, OV3R-PTX and A2780-PTX cells) and their
sensitive counterpart cells (SK-OV-3, OVCAR-3 and A2780 cells). (A)
Validation of PTX resistance in OC cells. The dots and curves in
the graphs indicate the relative cell viability at the
corresponding PTX concentrations and non-linear regression fitting
curves. Differences between sensitive cells and resistant cells
were analyzed using two-way ANOVA followed by a Tukey's HSD test.
Data are presented as the mean ± SD (n=3). (B) Differentially
expressed TF genes in PTX-sensitive and PTX-resistant OC cells. The
pie chart on the left represents the percentage of TF genes that
were differentially expressed at a significant level (expression FC
>2.5 and P<0.05). The pie chart on the right represents the
percentage of upregulated and downregulated TF genes. (C) Volcano
plot showing the alteration of TF gene expression between A2780 and
A2780-PTX cells based on the mRNA-sequencing results (n=3). The
gray horizontal line represents the P-value of 0.05, and the two
gray vertical lines represent the locations of FC >2 in gene
expression (A2780-PTX vs. A2780 cells). TF genes with significantly
altered expression (defined as FC <0.4 or >2.5 and P<0.05)
were marked with red dots. The red star indicates STAT1. (D)
Detection of total STAT1, STAT1α and STAT1β mRNA expression in
three paired cells [PTX-sensitive cells (SK-OV-3, OVCAR-3 and
A2780) vs. counterpart resistant cells (SK3R-PTX, OV3R-PTX and
A2780-PTX)] by reverse transcription-quantitative PCR. Expression
values for each group were normalized using β-actin as an internal
reference. Differences between PTX-sensitive cells and
PTX-resistant cells were analyzed using unpaired Student's t-test.
Data are presented as the mean ± SD (n=3). (E) Detection of STAT1
protein expression in three paired cells by western blotting.
Detection of PTX sensitivity in (F) SK3R-PTX, (G) OV3R-PTX and (H)
A2780-PTX cells after overexpression of STAT1α or STAT1β in the
presence of 8 μg/ml Dox and different doses of PTX. The dots
and curves in the graphs indicate the relative cell viability based
on the Cell Counting Kit-8 assay. Blue, red and green vertical
dotted lines in each panel indicated the absolute IC50.
Differences among groups were analyzed by two-way ANOVA followed by
Tukey's HSD test. Data are presented as the mean ± SD [n=4 for (F
and G); n=3 for (H)]. Determination of growth inhibitory effect of
PTX in (I) SK3R-PTX, (J) OV3R-PTX and (K) A2780-PTX cells after
induction of STAT1 overexpression by Dox. A cell viability assay
was performed. Differences among multiple groups were analyzed by
one-way ANOVA followed by Tukey's HSD test. Data are presented as
the mean ± SD (n=3). *P<0.05; **P<0.01;
***P<0.001; ****P<0.0001 resistant
cells vs. sensitive cells in each pair in (A) and (D) or
oe-STAT1α/β vs. oe-NC in (F-K). Dox, doxycycline; FC, fold change;
HSD, Honestly Significant Difference; NC, negative control; ns, not
significant; OC, ovarian cancer; OD, optical density; oe,
overexpression vector; PTX, paclitaxel; TF, transcription
factor.](/article_images/ijo/68/2/ijo-68-02-05832-g00.jpg) | Figure 1Detection of STAT1 expression, and
effect of STAT1 on PTX sensitivity and viability in PTX-resistant
OC cells (SK3R-PTX, OV3R-PTX and A2780-PTX cells) and their
sensitive counterpart cells (SK-OV-3, OVCAR-3 and A2780 cells). (A)
Validation of PTX resistance in OC cells. The dots and curves in
the graphs indicate the relative cell viability at the
corresponding PTX concentrations and non-linear regression fitting
curves. Differences between sensitive cells and resistant cells
were analyzed using two-way ANOVA followed by a Tukey's HSD test.
Data are presented as the mean ± SD (n=3). (B) Differentially
expressed TF genes in PTX-sensitive and PTX-resistant OC cells. The
pie chart on the left represents the percentage of TF genes that
were differentially expressed at a significant level (expression FC
>2.5 and P<0.05). The pie chart on the right represents the
percentage of upregulated and downregulated TF genes. (C) Volcano
plot showing the alteration of TF gene expression between A2780 and
A2780-PTX cells based on the mRNA-sequencing results (n=3). The
gray horizontal line represents the P-value of 0.05, and the two
gray vertical lines represent the locations of FC >2 in gene
expression (A2780-PTX vs. A2780 cells). TF genes with significantly
altered expression (defined as FC <0.4 or >2.5 and P<0.05)
were marked with red dots. The red star indicates STAT1. (D)
Detection of total STAT1, STAT1α and STAT1β mRNA expression in
three paired cells [PTX-sensitive cells (SK-OV-3, OVCAR-3 and
A2780) vs. counterpart resistant cells (SK3R-PTX, OV3R-PTX and
A2780-PTX)] by reverse transcription-quantitative PCR. Expression
values for each group were normalized using β-actin as an internal
reference. Differences between PTX-sensitive cells and
PTX-resistant cells were analyzed using unpaired Student's t-test.
Data are presented as the mean ± SD (n=3). (E) Detection of STAT1
protein expression in three paired cells by western blotting.
Detection of PTX sensitivity in (F) SK3R-PTX, (G) OV3R-PTX and (H)
A2780-PTX cells after overexpression of STAT1α or STAT1β in the
presence of 8 μg/ml Dox and different doses of PTX. The dots
and curves in the graphs indicate the relative cell viability based
on the Cell Counting Kit-8 assay. Blue, red and green vertical
dotted lines in each panel indicated the absolute IC50.
Differences among groups were analyzed by two-way ANOVA followed by
Tukey's HSD test. Data are presented as the mean ± SD [n=4 for (F
and G); n=3 for (H)]. Determination of growth inhibitory effect of
PTX in (I) SK3R-PTX, (J) OV3R-PTX and (K) A2780-PTX cells after
induction of STAT1 overexpression by Dox. A cell viability assay
was performed. Differences among multiple groups were analyzed by
one-way ANOVA followed by Tukey's HSD test. Data are presented as
the mean ± SD (n=3). *P<0.05; **P<0.01;
***P<0.001; ****P<0.0001 resistant
cells vs. sensitive cells in each pair in (A) and (D) or
oe-STAT1α/β vs. oe-NC in (F-K). Dox, doxycycline; FC, fold change;
HSD, Honestly Significant Difference; NC, negative control; ns, not
significant; OC, ovarian cancer; OD, optical density; oe,
overexpression vector; PTX, paclitaxel; TF, transcription
factor. |
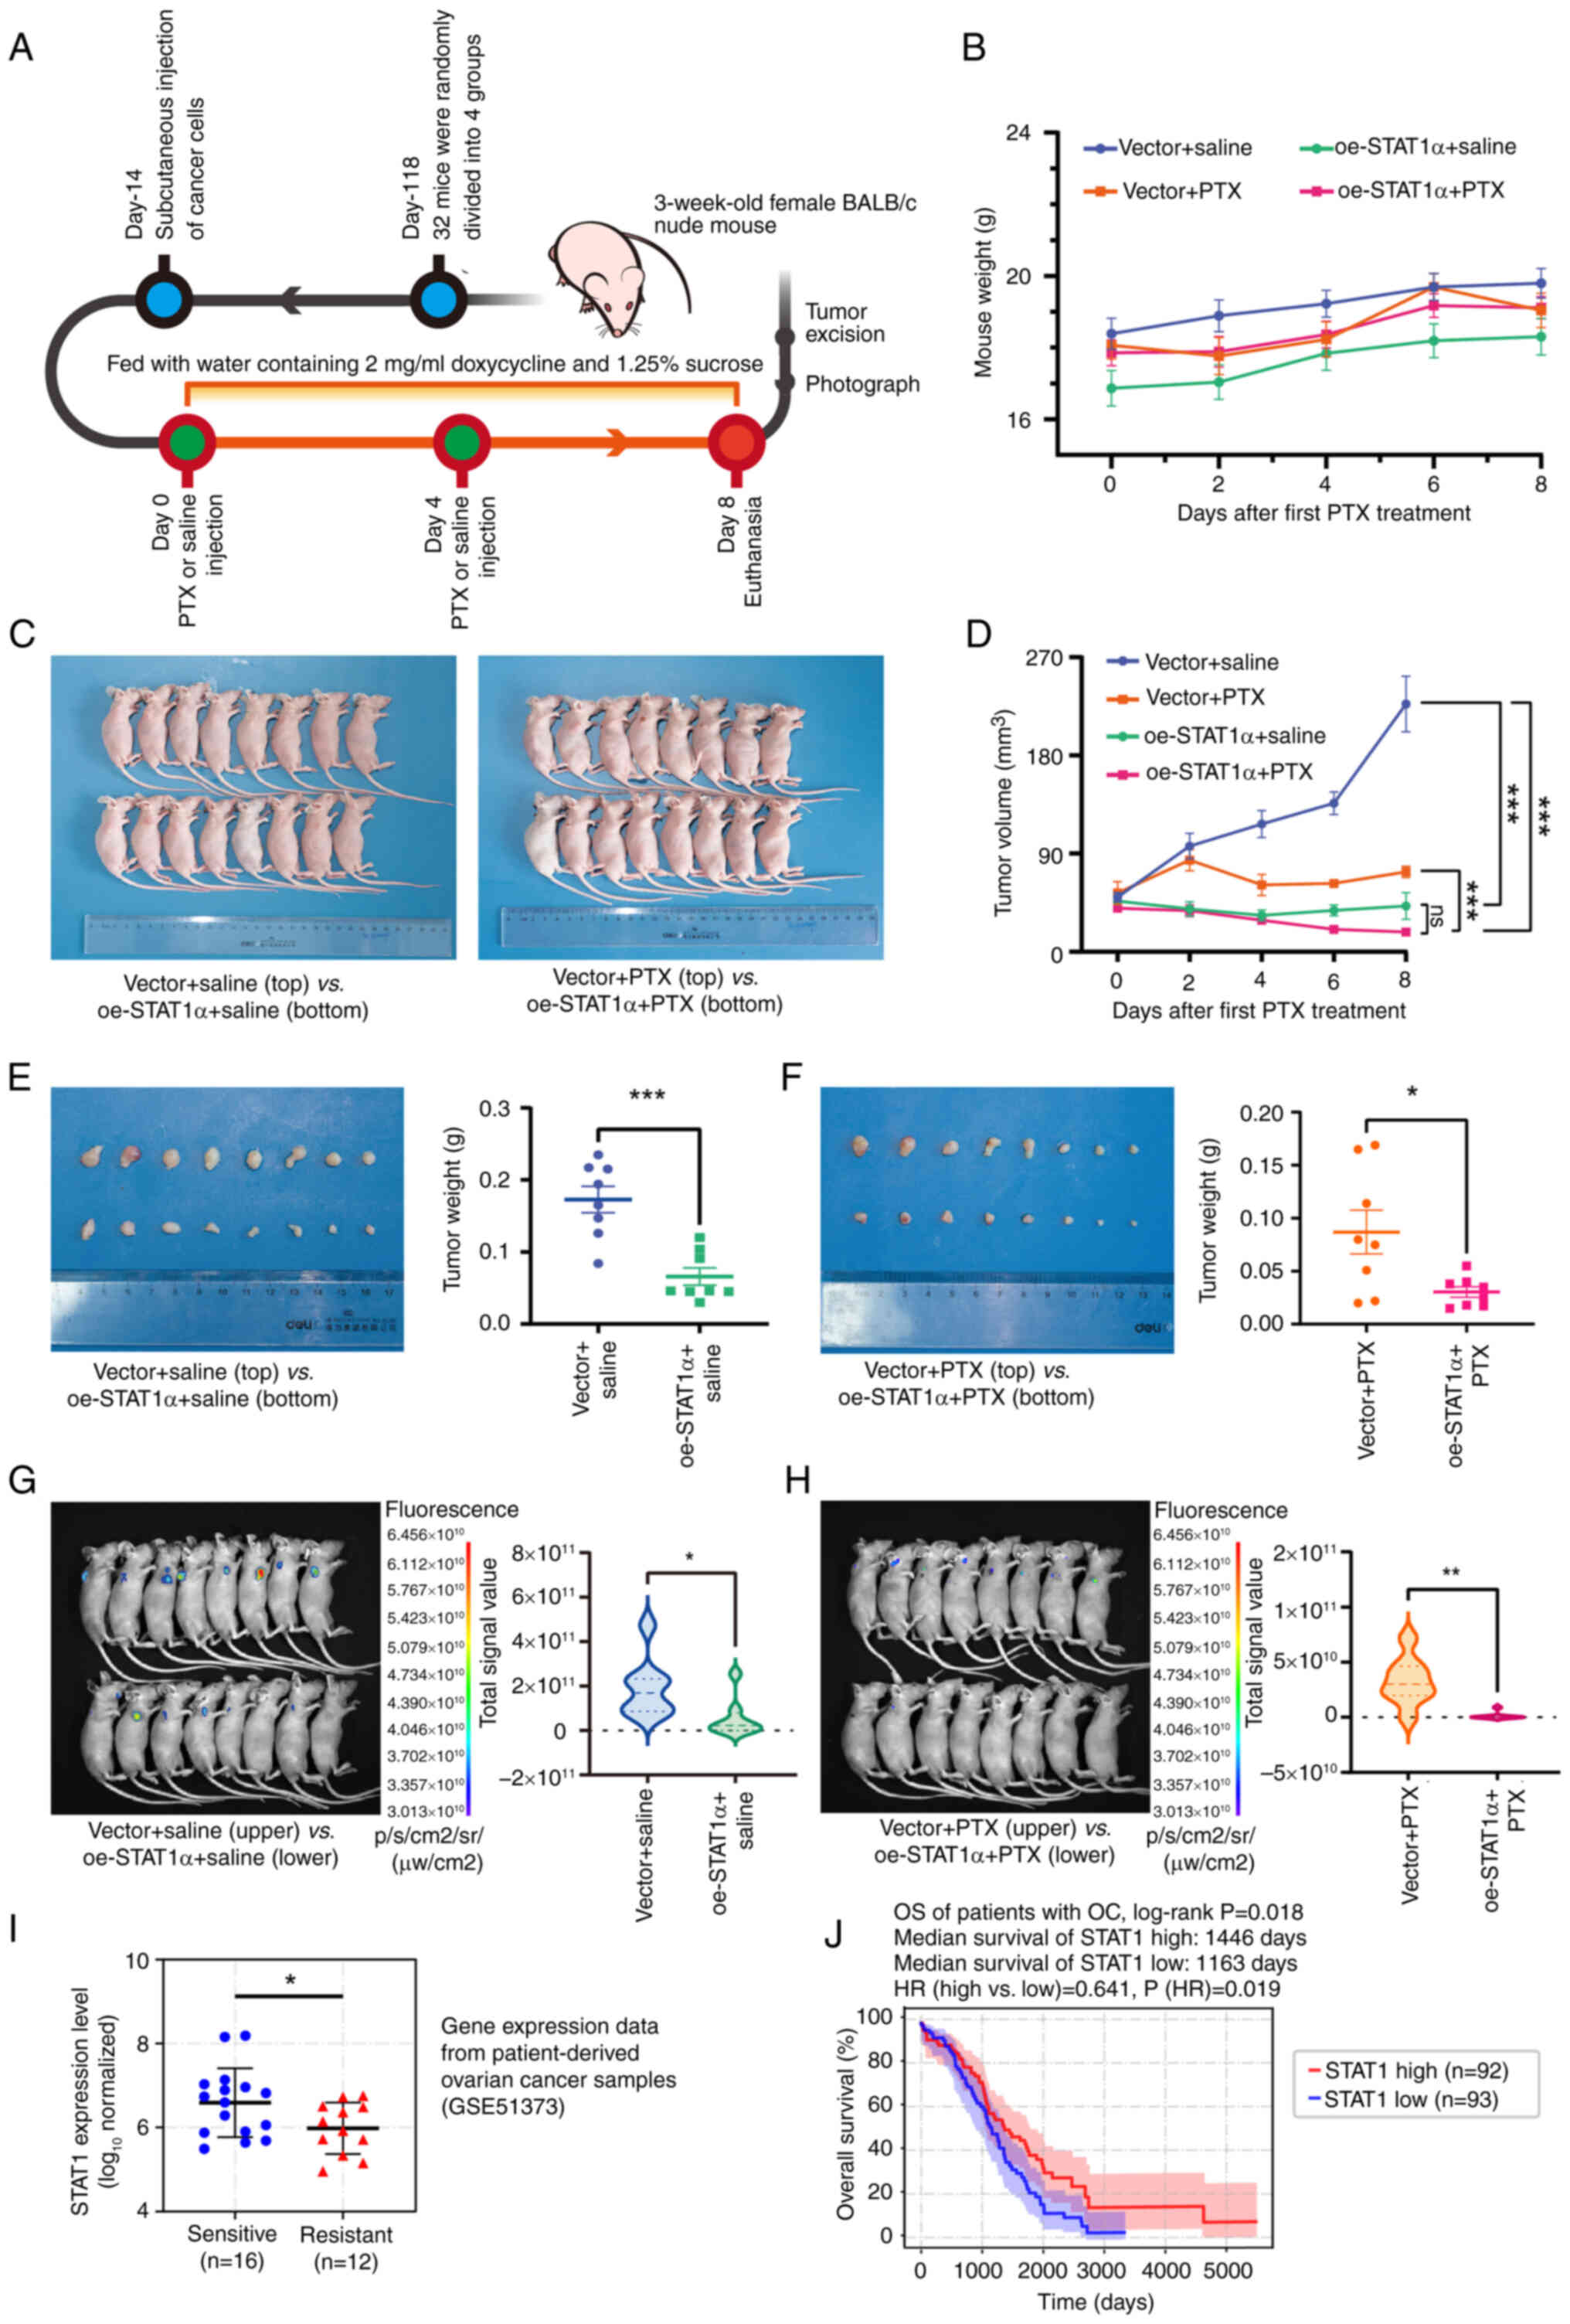
Overexpression of STAT1 inhibits tumor
formation in xenograft mice and is a favorable factor in the
overall survival of patients
To clarify the biological effect of STAT1 on PTX
resistance of tumors, an in vivo xenograft mouse model was
used. Considering that STAT1α was the major transcript in OC cells
(Fig. S4A-B),
STAT1α-overexpressing SK3R-PTX cells were generated. As
aforementioned, SK3R-PTX cells were stably infected with oe-STAT1α
or control vector, and were subcutaneously injected into nude mice
(Fig. 2A). The body weight of the
mice in each group was compared at each timepoint and was not
significantly changed during the experimental intervention
(Fig. 2B and C). Overexpression
of STAT1 significantly decreased the tumor volume regardless of PTX
treatment at post-intervention day 8 (Fig. 2D and E). Furthermore,
overexpression of STAT1 sensitized PTX responses in vivo
(Fig. 2F) as the tumor weight in
the oe-STAT1α group was markedly lower than the vector group after
PTX treatment. Since STAT1-GFP expression in the cells used for the
subcutaneous implantation was inducible in the presence of Dox,
small-animal live imaging was used to observe tumor formation. The
fluorescence signal was significantly lower in the
STAT1α-overexpressing group than in the vector control group
without or with PTX treatment (Fig.
2G and H). These data further indicated that oe-STAT1α
inhibited tumorigenicity and increased PTX sensitivity in resistant
cells. To clarify the impact of STAT1 in patients with OC, clinical
datasets were downloaded from GEO and TCGA and analyzed. The
expression levels of STAT1 were significantly lower in
chemoresistant patients compared with chemosensitive patients
(Fig. 2I). The survival analysis
using TCGA datasets revealed a significant difference in the
overall survival of patients with OC between the STAT1-high and
STAT1-low expression groups (P=0.018; Fig. 2J). The median survival time in the
STAT1-high and STAT1-low groups was 1,446 and 1,163 days,
respectively. The hazard ratio in the STAT1-high group compared
with the STAT-low group was 0.641 (P=0.019). These data indicated
that STAT1 was a favorable factor in the overall survival of
patients with OC.
Overexpression of STAT1 reverses PTX
resistance through the apoptosis pathway
Since overexpression of STAT1 decreased OC cell
viability in some cell lines (Fig.
1F-K), a wide-ranging analysis of the biological functions of
STAT1 in pan-cancer was performed. GSEA revealed that high STAT1
expression was closely associated with 'IL6 JAK STAT3 signaling',
'PI3K AKT mTOR signaling', and 'apoptosis' in a number of cancer
types (Fig. 3A). Further analysis
of 'HALLMARK_APOPTOSIS' between STAT1 high and low expression
(expression level <20th percentile) samples of OC using GSEA
revealed that apoptosis was significantly enriched (Fig. 3B). Overexpression of STAT1α
decreased the viability of SK3R-PTX, OV3R-PTX and A2780-PTX cells
in the presence of PTX, whereas these effects of STAT1α were
completely abolished in OV3R-PTX and A2780-PTX cells and partially
abolished in SK3R-PTX cells in the presence of a caspase blocker
(Z-VAD-FMK; 20 μM) (Fig.
3C). DMSO was used as a control for comparison. Because STAT1
is a TF protein, TFoTF was used to predict target genes of STAT1
using the apoptosis gene set 'HALLMARK_APOPTOSIS', which was
downloaded from the GSEA database (Hallmark gene sets; Ver 7.5.1)
(29). FAS and CASP8, the two key
genes of the apoptosis pathway, were ranked among the
highest-scoring genes and might be target genes of STAT1 (Fig. 3D). Furthermore, Pearson
correlation analysis revealed that FAS and CASP8 exhibited a weakly
negative correlation with PTX resistance (Fig. 3E), which was confirmed by TFoTF
with high scores (Fig. 3F). These
data indicated that STAT1 affected PTX resistance mainly through
the apoptosis pathway.
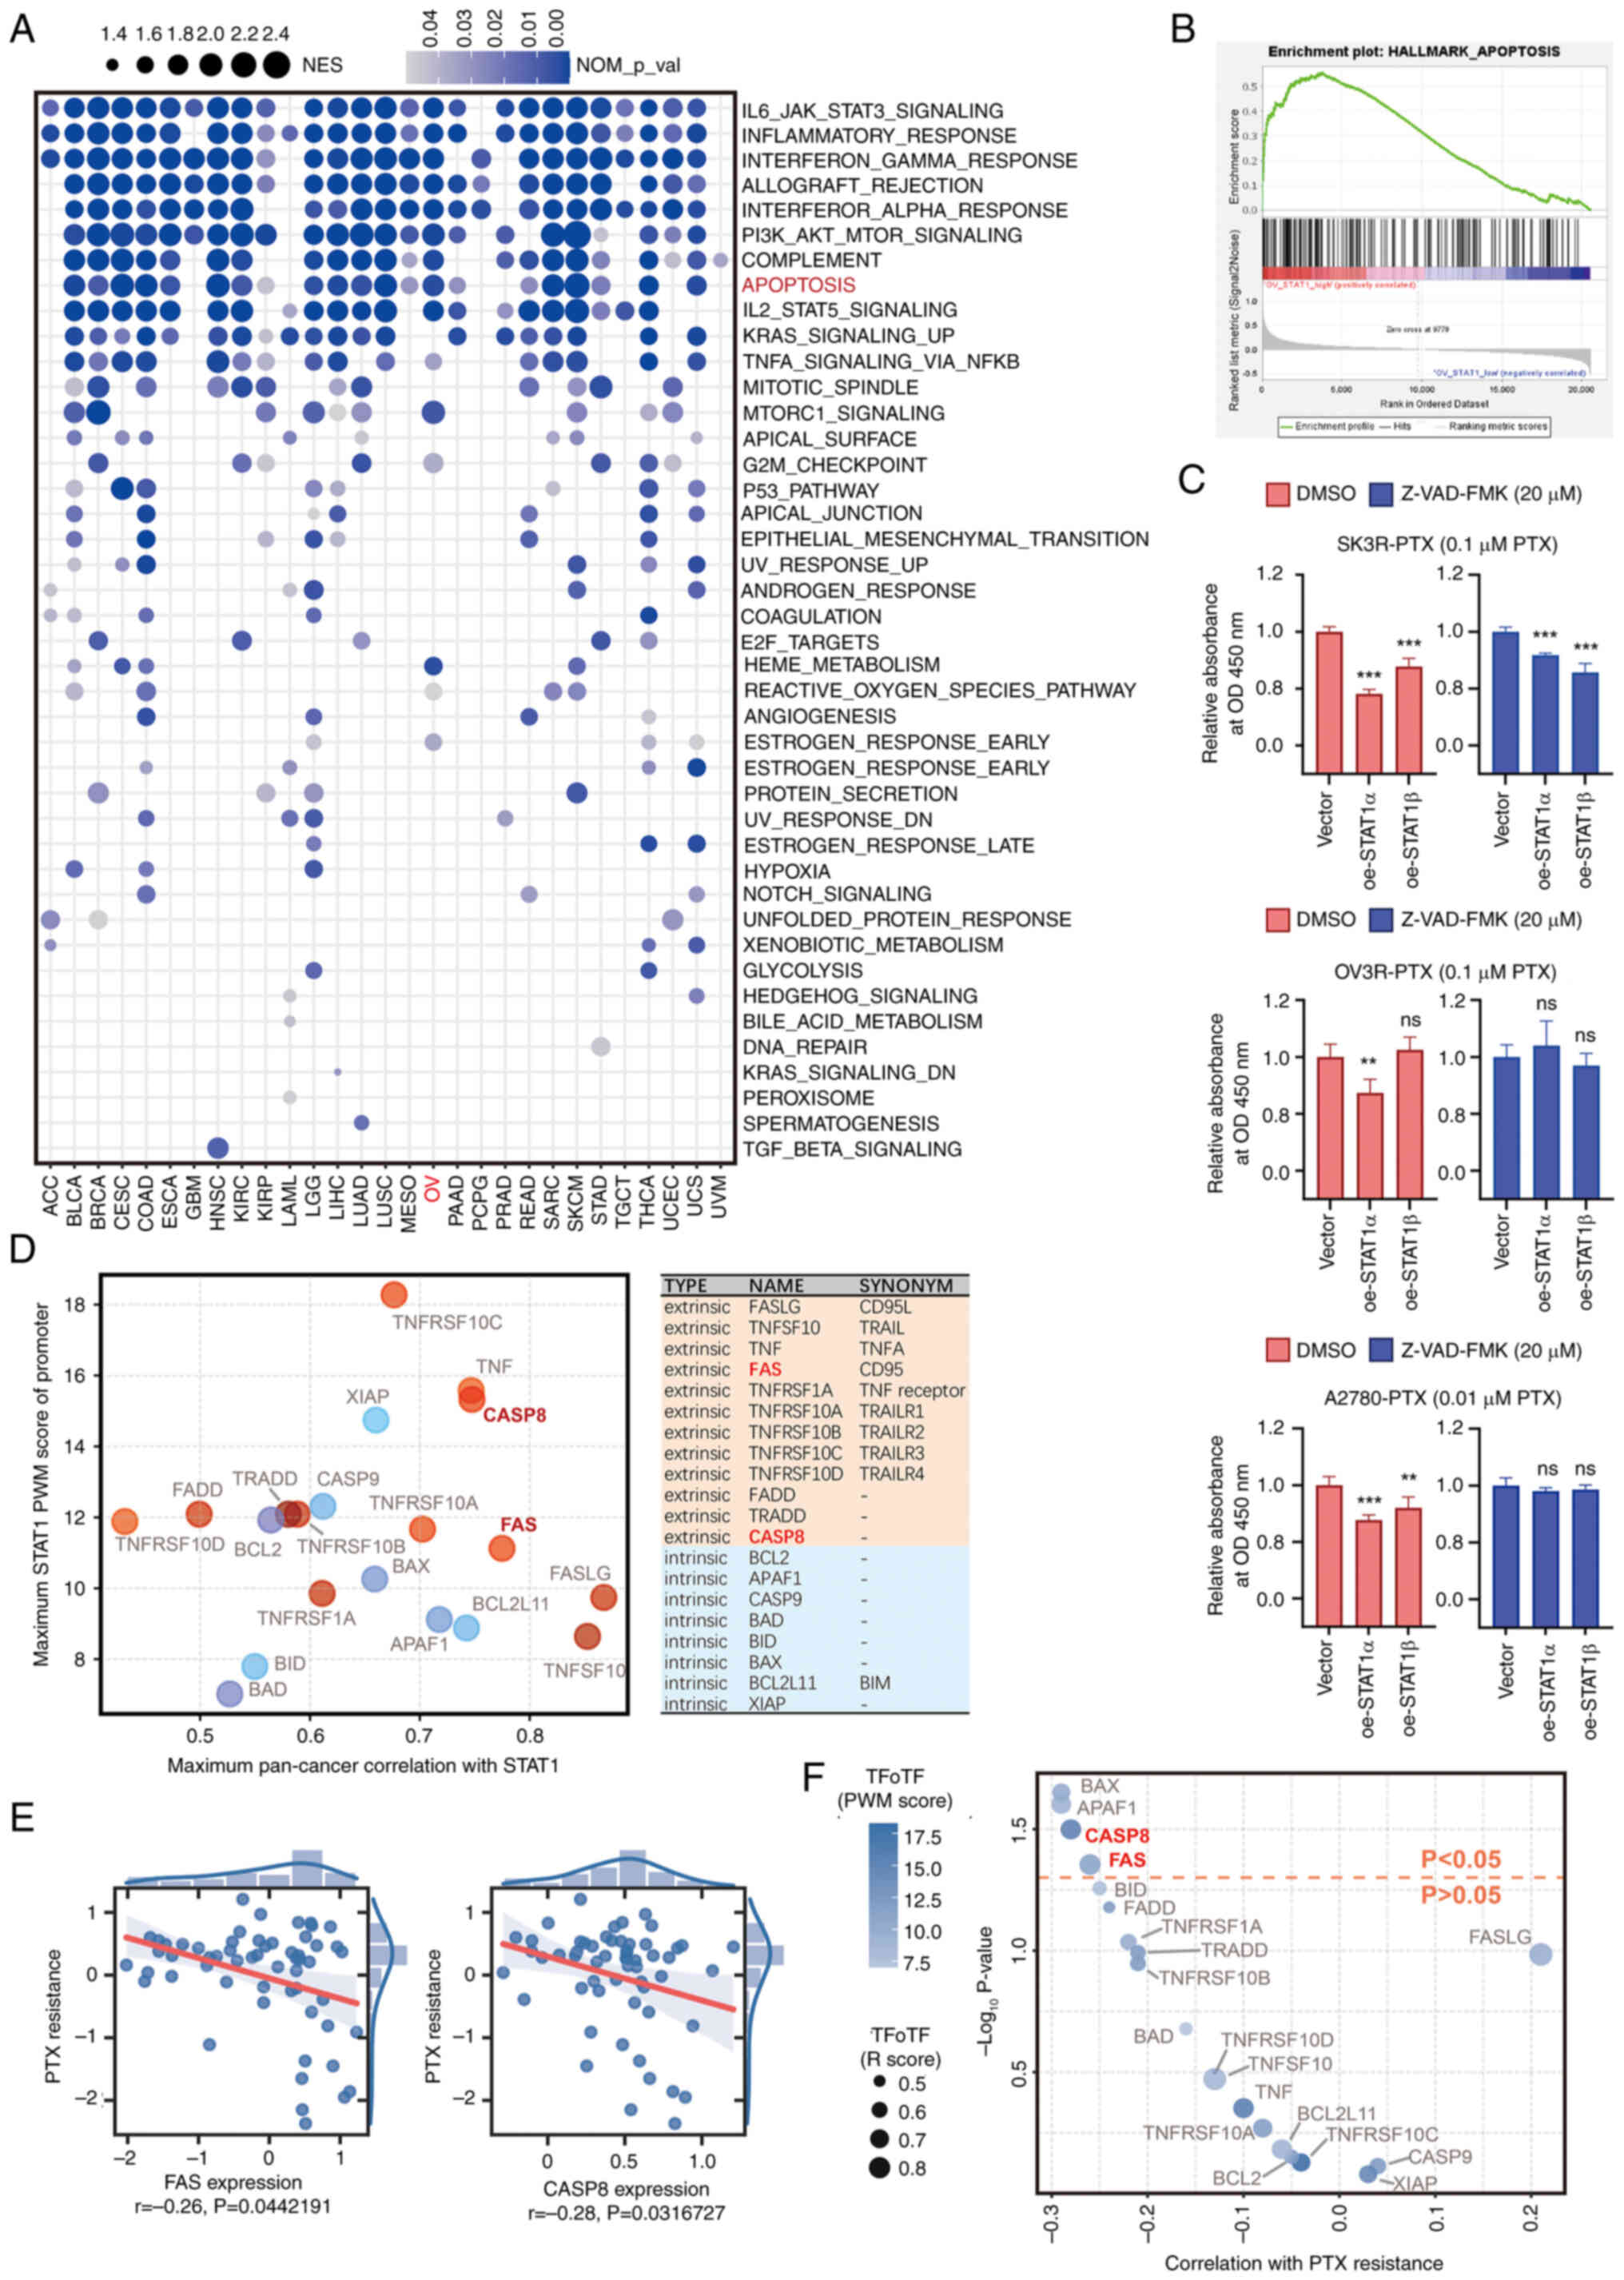 | Figure 3Association of STAT1 with PTX
resistance. (A) Analysis of the biological functions of STAT1. High
STAT1 expression (expression level >80th percentile) based on
pan-cancer transcriptomics data was associated with enriched
pathways. Horizontal coordinates indicate the different types of
cancer in The Cancer Genome Atlas and vertical coordinates indicate
the names of cell biological functions. The significance of each
enrichment result was determined using the default setting. (B)
Gene Set Enrichment Analysis of 'HALLMARK_APOPTOSIS' between STAT1
high and low expression samples of ovarian cancer (expression level
>80th and <20th percentile, respectively). (C) Effect of
apoptosis inhibitor Z-VAD-FMK in STAT1-overexpressing PTX-resistant
cells. SK3R-PTX, OV3R-PTX and A2780-PTX cells were stably infected
with empty vector, STAT1α or STAT1β plasmids in the presence of
PTX, followed by 20 μM Z-VAD-FMK or solvent DMSO treatment
for 48 h. Cell viability was detected using a Cell Counting Kit-8
assay. Data were normalized using reads from the empty vector
group. Differences among multiple groups were analyzed by one-way
ANOVA followed by Tukey's Honestly Significant Difference test.
Data are presented as the mean ± SD (n=5). **P<0.01;
***P<0.001 (oe-STAT1α/β vs. Vector). (D) Analysis of
genes closely related to apoptotic pathways obtained after TFoTF
prediction and screening of the apoptosis gene set
('HALLMARK_APOPTOSIS'). Information about these genes is shown in
the table on the right. The scatterplot on the left shows the
visualization of the TFoTF prediction outcomes for these genes. The
horizontal coordinate indicates the R score based on TFoTF and the
vertical coordinate indicates the PWM score
(kmax1). The red circles denote genes in the
extrinsic apoptosis pathway, and the blue circles denote genes in
the intrinsic apoptosis pathway. (E) Correlation of CASP8 and FAS
expression with cellular PTX resistance. The significance of each
regression coefficient was determined using the Wald test with a
t-distribution using the SciPy Python package. (F) Analysis and
screening of STAT1-targeted PTX resistance-associated apoptotic
genes. In the bubble plot, the horizontal coordinate indicates the
Pearson correlation coefficient between the target gene of STAT1
and PTX resistance. The vertical coordinate indicates the
statistical significance of the correlation. The red horizontal
dashed line indicates the position of the regression P-value of
0.05. The size of each bubble indicates the R score based on TFoTF.
The color depth of each bubble indicates the PWM score based on
TFoTF (kmax1). CASP8, caspase-8; FAS, Fas cell
surface death receptor; NES, normalized enrichment score;
NOM_p_val, normalized P-value; ns, not significant; OD, optical
density; oe, overexpression vector; PTX, paclitaxel; PWM, position
weight matrix; r, R-value; TFoTF, Target Finder of Transcription
Factor. |
PTX enhances the expression of STAT1 and
apoptotic factors, and overexpression of STAT1 induces
PTX-resistant cell apoptosis
The effect of PTX on the expression levels of STAT1
and apoptotic factors CASP8 and FAS in PTX-sensitive cells was
first confirmed. Time-course (6, 12, 18 and 24 h) and
dose-dependent (0.001, 0.01 and 0.1 μM) experiments showed
that STAT1, CASP8 and FAS mRNA expression was upregulated in
PTX-sensitive cells after PTX treatment, albeit at different levels
in OVCAR-3, A2780 cells and SK-OV-3 cells (Figs. 4A and B, and S5A). The expression values of each gene
at different time points were further analyzed and confirmed using
the linear trend test. The mRNA expression levels of STAT1, CASP8
and FAS were gradually increased in the time-course experiment
after PTX treatment (Figs. 4C and
D, and S5B), and the trends were more significant at specific
PTX concentrations, such as 0.001 μM in OVCAR-3 and A2780
cells and 0.1 μM in SK-OV-3 cells. Notably, a decrease in
STAT1β expression was observed in SK-OV-3 cells after PTX treatment
at 12, 18 and 24 h compared with 6 h (Fig. S5A). Next, it was confirmed that
overexpression of STAT1 enhanced PTX sensitivity to induce
PTX-resistant cell apoptosis. Flow cytometry was performed to
detect PTX-induced apoptosis in oe-STAT1-infected OV3R-PTX and
A2780-PTX cells compared with oe-NC cells (Fig. 4E and F). Quantitative analysis of
flow cytometry data showed that overexpression of STAT1α induced
apoptosis under different PTX treatments. oe-STAT1α, compared with
oe-NC, increased the percentage of apoptotic cells to 53.20±0.92%
and 36.74±0.77% in OV3R-PTX and A2780-PTX cells, respectively,
after 1 μM PTX treatment for 24 h (P<0.01) (Fig. 4G and H).
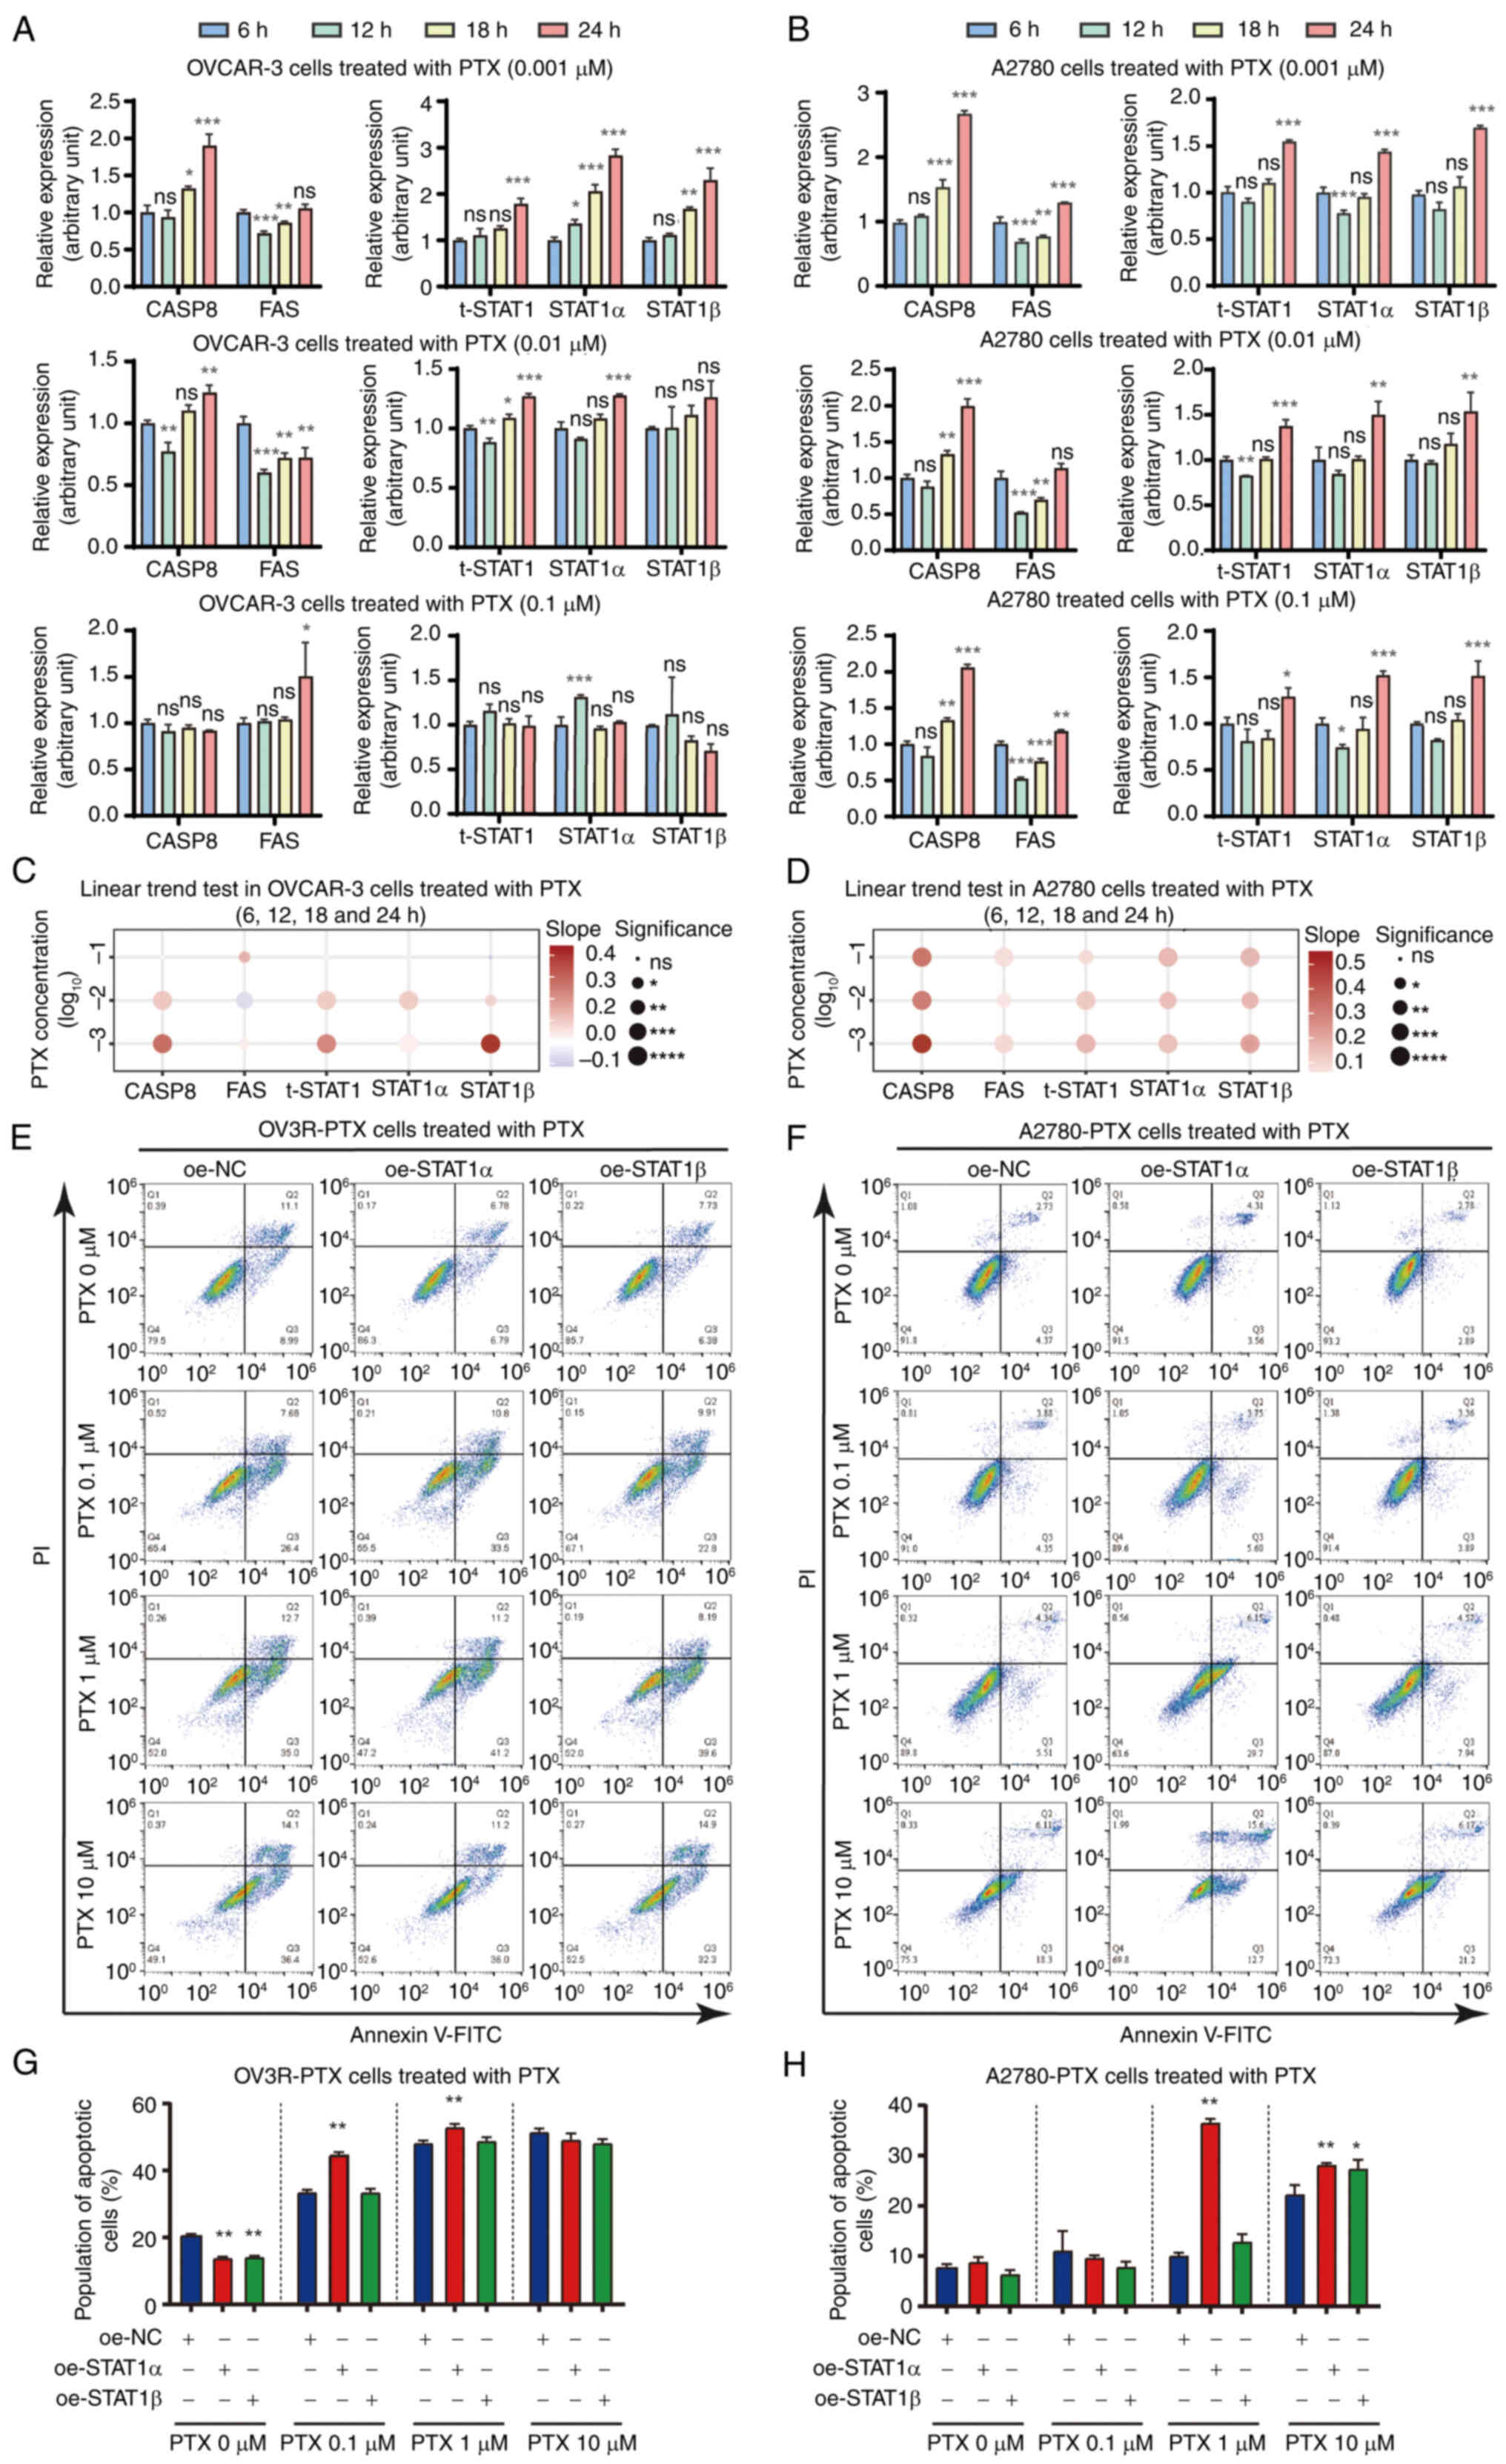 | Figure 4Effect of PTX on CASP8, FAS and STAT1
expression in time-course and dose-dependent experiments, and
effect of STAT1 on apoptosis. mRNA expression levels of CASP8, FAS,
t-STAT1, STAT1α and STAT1β were detected by reverse
transcription-quantitative PCR in (A) OVACR-3 and (B) A2780 cells
after treatment with 0.001, 0.01 and 0.1 μM PTX for 6, 12,
18 and 24 h. Expression values for each group were normalized using
β-actin as an internal reference. Differences among multiple groups
were analyzed using one-way ANOVA followed by Tukey's Honestly
Significant Difference test. Data are presented as the mean ± SD
(n=3). (C) Results of linear trend test for changes in (A). The
vertical coordinate indicates the concentration of PTX, and the
horizontal coordinate indicates the genes. The color of the bubble
represents the slope of the change trend, while the size of the
bubble represents the statistical significance.
*P<0.05; **P<0.01;
***P<0.001; ****P<0.0001. (D) Results
of linear trend test for changes in (B). The vertical coordinate
indicates the concentration of PTX, and the horizontal coordinate
indicates the genes. The color of the bubble represents the slope
of the change trend, while the size represents the statistical
significance. *P<0.05; **P<0.01;
***P<0.001; ****P<0.0001. Detection of
apoptosis in (E) OV3R-PTX and (F) A2780-PTX cells using flow
cytometry. OV3R-PTX and A2780-PTX cells were infected with either
oe-STAT1α or oe-STAT1β in the presence or absence of 0.1, 1 and 10
μM PTX. Quantification of apoptotic cells based on flow
cytometry in STAT1α/β-overexpressing (G) OV3R-PTX and (H) A2780-PTX
cells in the presence or absence of PTX. Data were evaluated and
analyzed using ModFit software and are presented as the mean ± SD
(n=3). *P<0.05; **P<0.01;
***P<0.001 vs. 6 h in (A) and (B) and vs. oe-NC in
(G) and (H). CASP8, caspase-8; FAS, Fas cell surface death
receptor; NC, negative control; ns, not significant; oe,
overexpression vector; PTX, paclitaxel; t-STAT1, total STAT1. |
Overexpression of STAT1 upregulates CASP8
and FAS expression
Since PTX can induce apoptosis (14), and since PTX can upregulate STAT1
(Fig. 4), the present study
subsequently investigated the effect of STAT1 on CASP8 and FAS
expression in PTX-resistant cells. The Dox-induced overexpression
of STAT1α and STAT1β was confirmed by RT-qPCR in SK3R-PTX, OV3R-PTX
and A2789-PTX cells after infection with oe-STAT1α and oe-STAT1β
lentivirus, respectively (Fig.
S6A-C). The overexpression of STAT1α and STAT1β significantly
enhanced the mRNA expression levels of CASP8 and FAS detected by
RT-qPCR in most PTX-resistant cells, except A2780-PTX cells, in
which no significant change in CASP8 expression was found after
STAT1 lentiviral infection (Fig. 5A
and B). Finally, the protein expression levels of CASP8 and FAS
were evaluated by western blotting (Fig. 5C and D) and immunofluorescence
staining (Fig. 5E and F). Despite
some cell line-specificity, these data indicated that CASP8 and FAS
expression could be upregulated by STAT1.
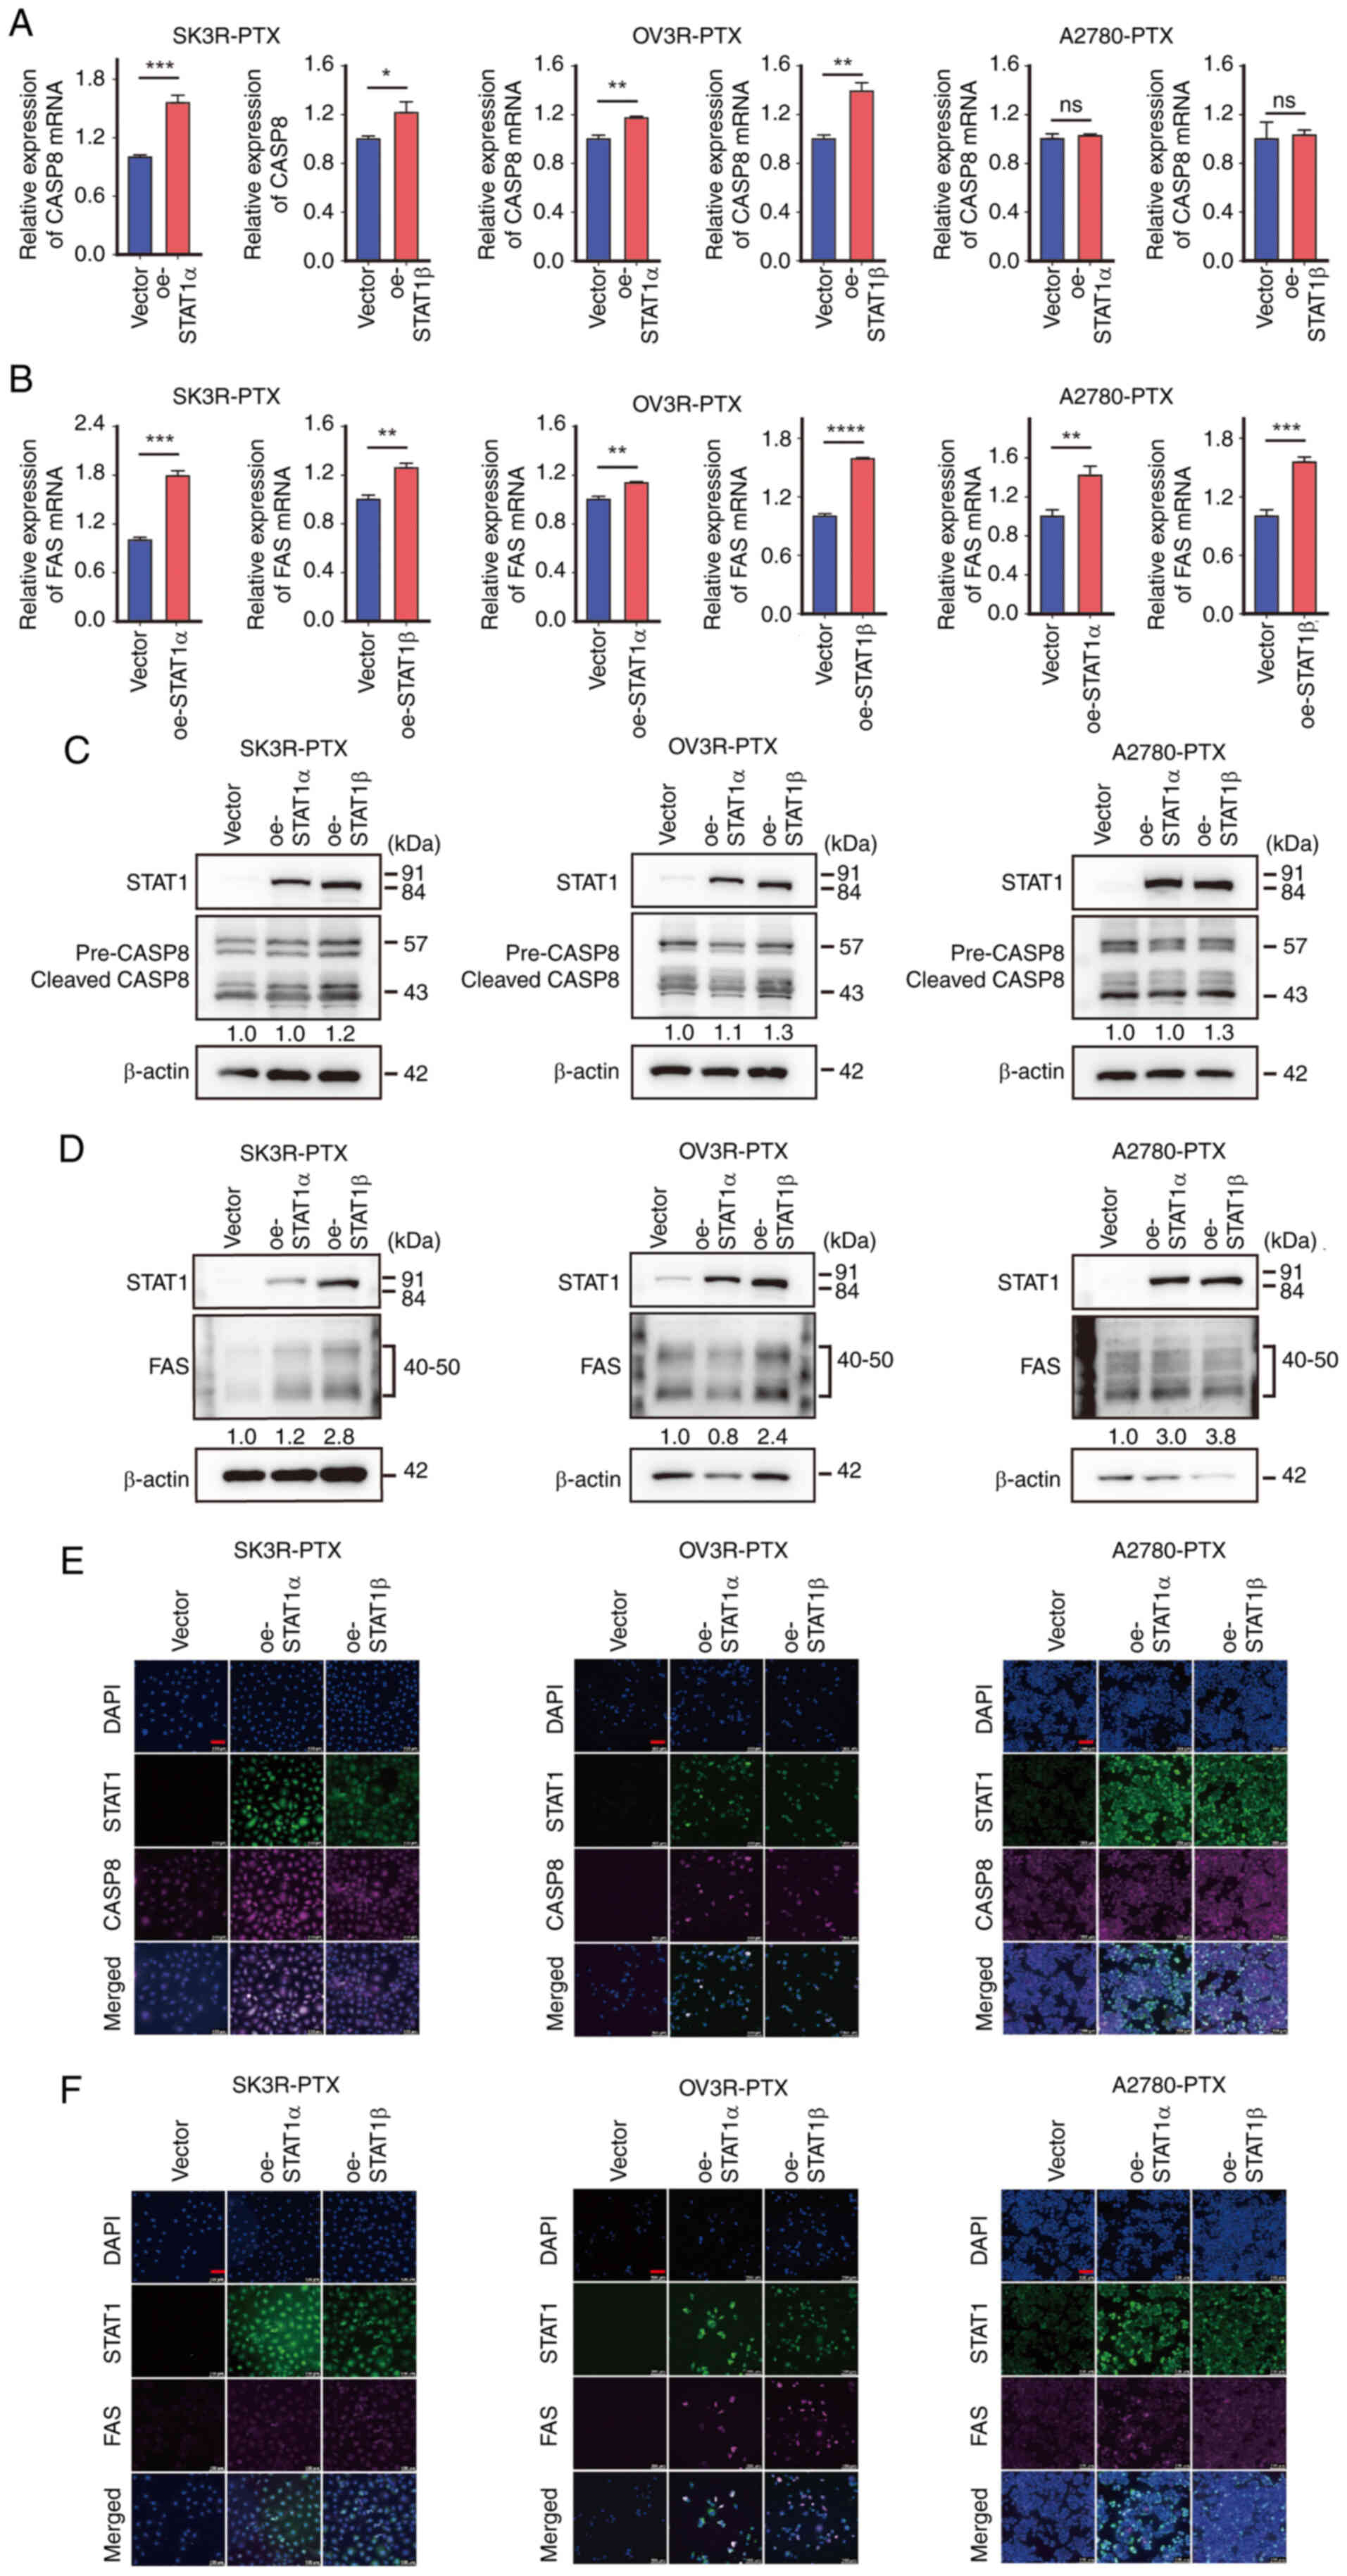 | Figure 5Effect of STAT1 on CASP8 and FAS
expression in PTX-resistant cells. Detection of (A) CASP8 and (B)
FAS mRNA expression in oe-STAT1α- and oe-STAT1β-lentivirus-infected
SK3R-PTX, OV3R-PTX and A2780-PTX cells by reverse
transcription-quantitative PCR. Expression values for each group
were normalized using β-actin as an internal reference. Differences
between the two groups were analyzed using Student's t-test. Data
are presented as the mean ± SD (n=3). *P<0.05;
**P<0.01; ***P<0.001;
****P<0.0001. Detection of STAT1, (C) CASP8 and (D)
FAS protein expression in oe-STAT1α- and
oe-STAT1β-lentivirus-infected SK3R-PTX, OV3R-PTX and A2780-PTX
cells by western blotting. The specific antibodies recognized a
specific target. STAT1α, 91 kDa; STAT1β, 84 kDa; pre-CASP8, 57 kDa;
cleaved-CASP8, 43 kDa; FAS, 40-50 kDa; β-actin, 42 kDa. The numbers
under the bands indicate the densitometric value of the protein
(total CASP3 and FAS) after normalization. Detection of STAT1, (E)
CASP8 and (F) FAS protein expression in oe-STAT1α- and
oe-STAT1β-lentivirus-infected SK3R-PTX, OV3R-PTX and A2780-PTX
cells by immunofluorescence staining. The immunofluorescent signals
were detected after the induction of STAT1α and STAT1β using
doxycycline. DAPI was used to stain the nucleus. Red scale bar, 100
μm. CASP8, caspase-8; FAS, Fas cell surface death receptor;
ns, not significant; oe, overexpression vector; pre-CASP8,
caspase-8 precursor; cleaved-CASP8, cleaved caspase-8; PTX,
paclitaxel. |
STAT1 directly binds to the promoter
regions of CASP8 and FAS
ChIP-seq data of STAT1 were obtained from GEO
(GSM320736). Data analysis revealed the potential binding sites of
multiple genome-associated fragments of CASP8 and FAS with STAT1,
and some of the fragments were located in the proximal promoter
regions of CASP8 and FAS (Fig.
S7). The STAT1 binding sites were found to be clustered within
the promoter regions of CASP8, which was predicted using PWM
scoring. The motif logo was drawn, and the specific values of the
PWM were calculated (Fig. 6A).
This logo visualized the conservation and preference for specific
nucleotides at different positions in a DNA sequence. There were
four and two clusters of binding sites within the promoter region
of CASP8 and FAS, respectively (Fig.
6B). Subsequently, correlation analysis revealed that the
expression of CASP8 and FAS was correlated with STAT1 expression in
ovarian cancer as determined by the Wald test with t-distribution
using the SciPy Python package (P<0.001; Fig. 6C). Subsequently, the binding sites
for STAT1 were validated using dual-luciferase reporter gene
assays. Based on the sequences of the predicted binding sites,
plasmids of a full-length promoter and several truncated fragments
of CASP8 and FAS were constructed. For CASP8, four constructs were
generated. A full-length plasmid (pGL4-CASP8-2000) contained all
four binding sites. The three truncated fragments, pGL4-CASP8-1557,
pGL4-CASP8-1249 and pGL4-CASP8-863, contained three, two and one
proximal binding sites, respectively (Fig. 6D). The relative luciferase
activity in each transfection group was measured in 293T cells
after co-transfection with a dual-luciferase reporter gene plasmid
and a STAT1-overexpression plasmid (oe-STAT1α, oe-STAT1β or empty
vector). For the pGL4-CASP8-2000 and pGL4-CASP8-1249 plasmids, the
relative luciferase activity was enhanced in the presence of STAT1α
(Fig. 6E). For the
pGL4-CASP8-1557 and pGL4-CASP8-863 plasmids, the relative
luciferase activity was enhanced in the presence of STAT1α or
STAT1β. For FAS, two constructs were generated, including a
full-length plasmid (pGL4-FAS-2000) containing two binding sites
and a truncated fragment plasmid (pGL4-FAS-1019) containing one
proximal binding site (Fig. 6F).
For the pGL4-FAS-2000 plasmid, the relative luciferase activity was
enhanced in the presence of STAT1α rather than STAT1β (Fig. 6G). There was no change in the
relative luciferase activity for the pGL4-FAS-1019 plasmid. These
data indicate that STAT1α could directly bind to the promoters of
CASP8 and FAS to regulate their expression at the transcription
level.
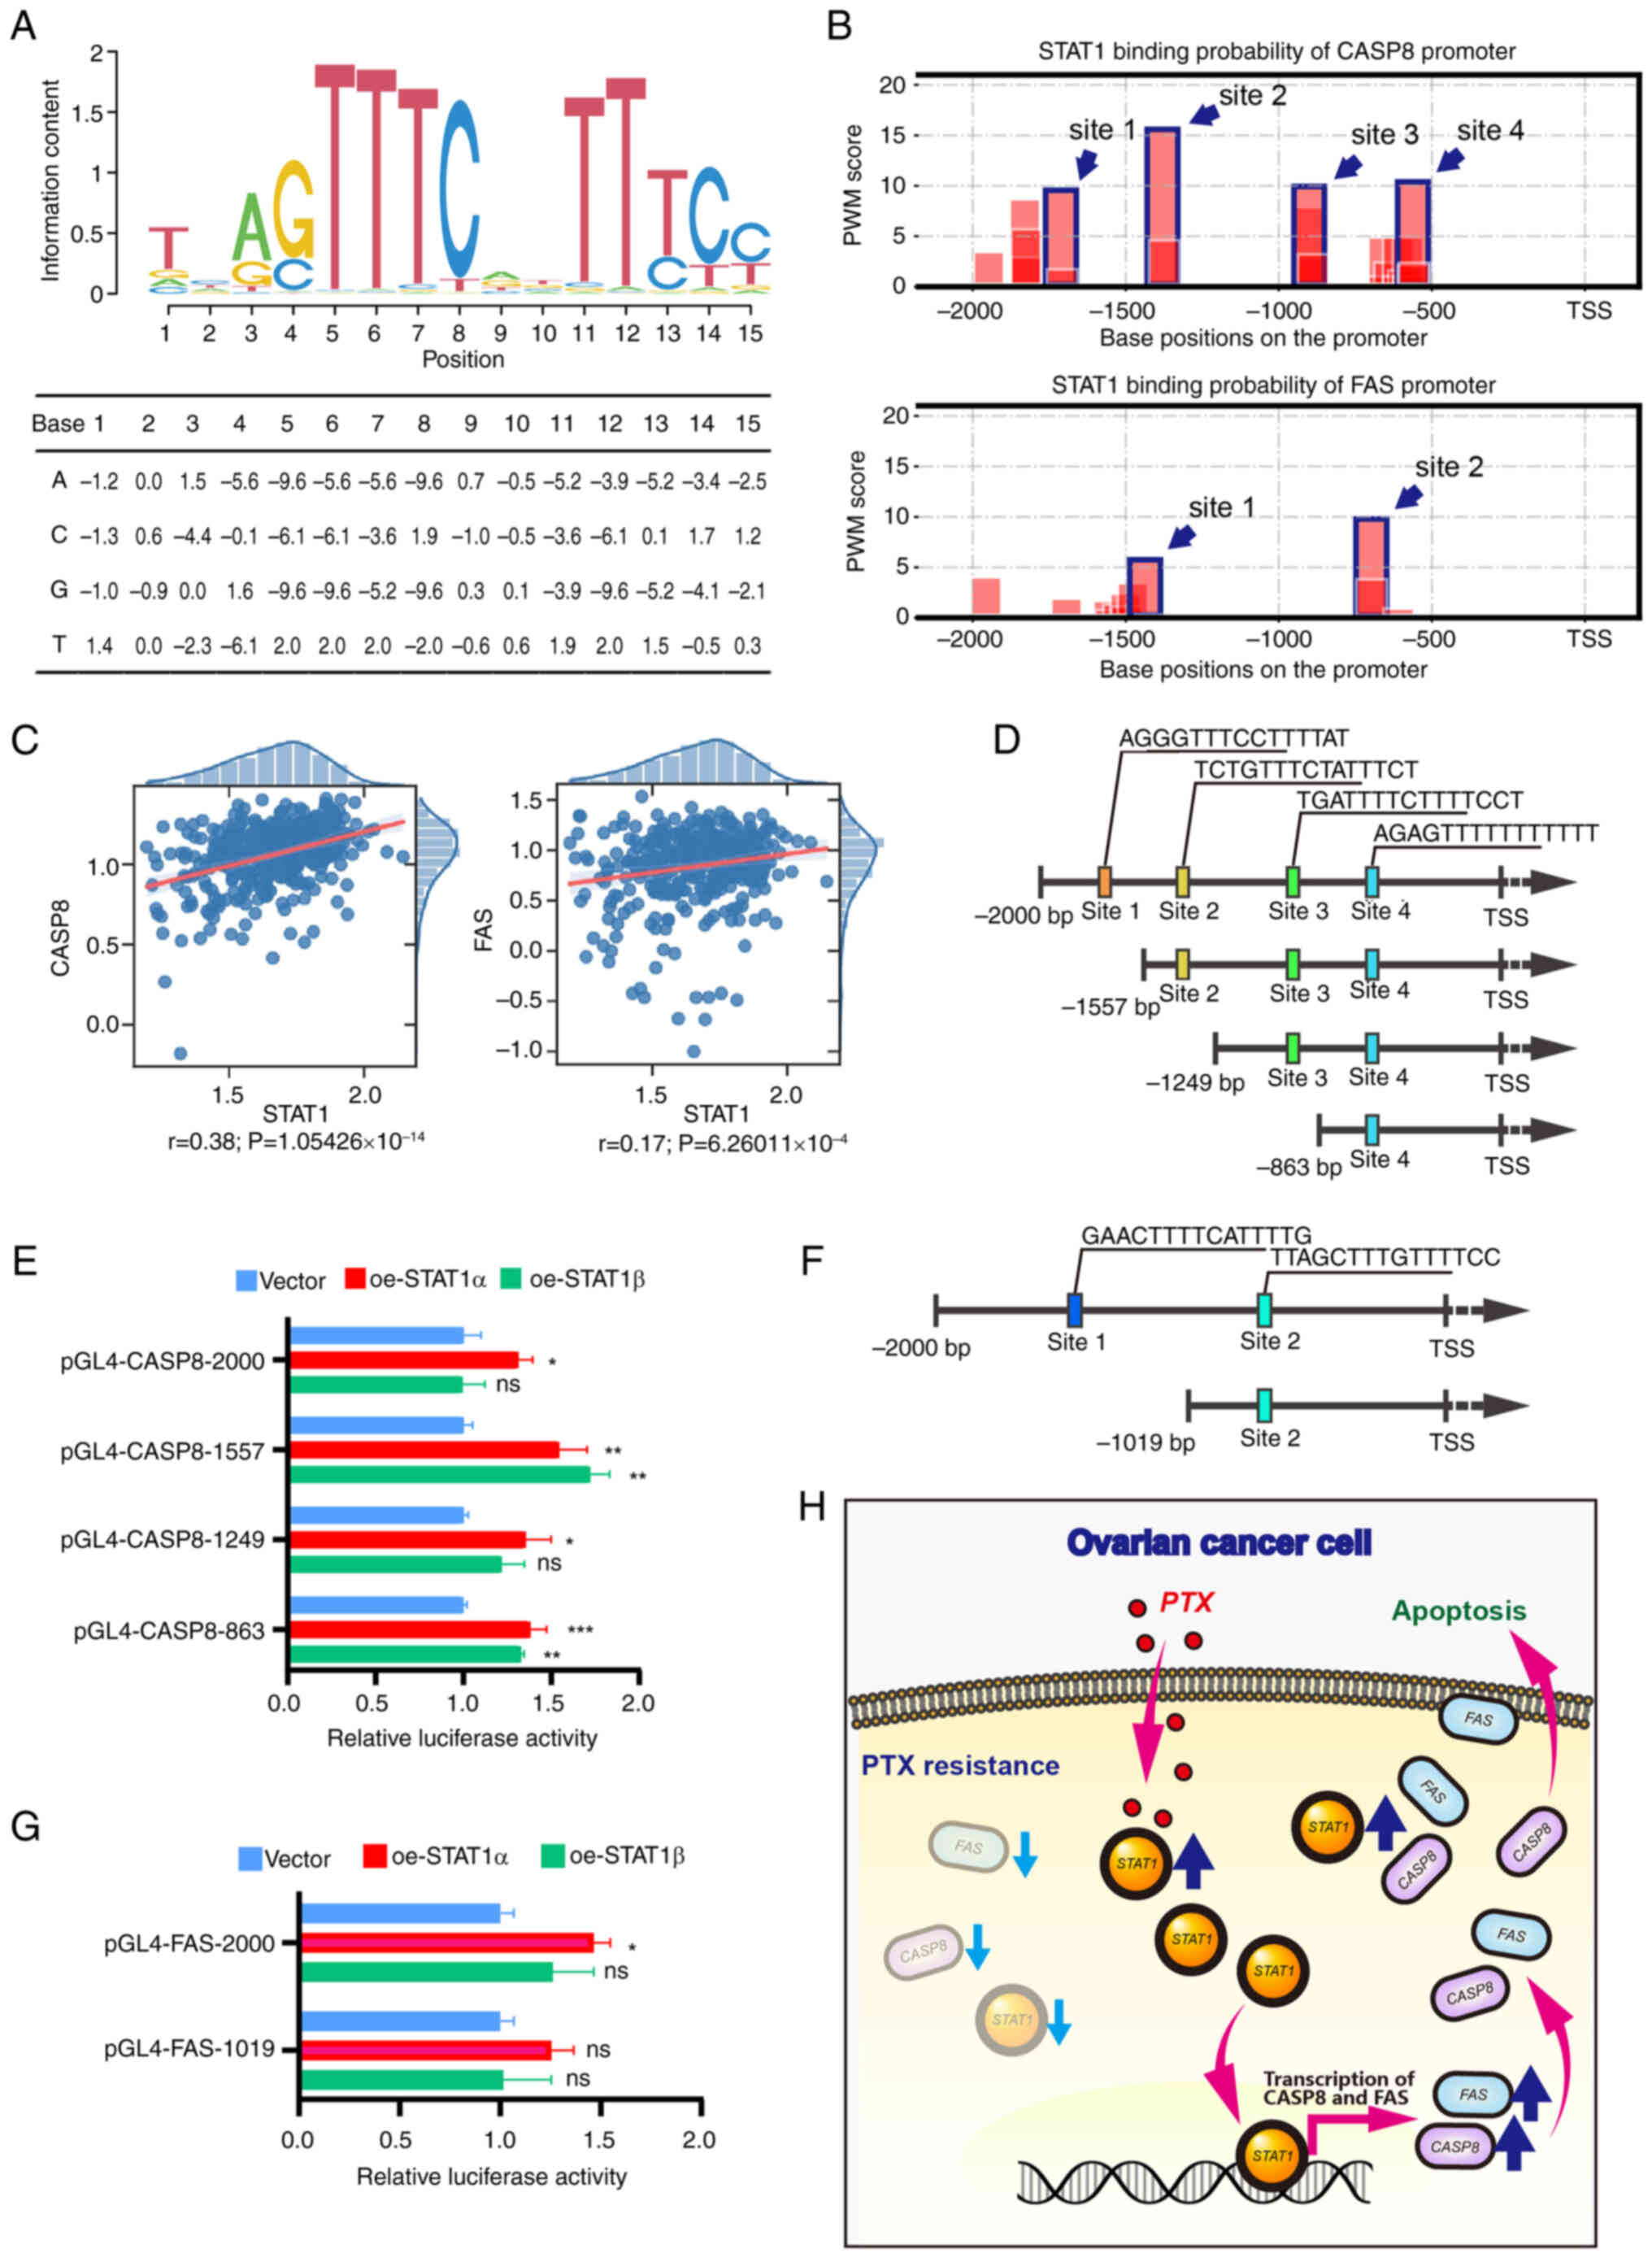 | Figure 6Detection of the interaction of STAT1
with CASP8 and FAS. (A) Prediction of STAT1 binding site sequence.
The PWM of STAT1 was used to predict the binding site in the
promoter region. The visualized sequence logo of the PWM is
illustrated at the top, and the specific values of the PWM are
shown in the table at the bottom. The x-axis represents the
position in the sequence alignment. The y-axis represents the
information content in bits. A higher value means that position is
highly conserved. (B) Prediction of STAT1 binding sites in the
CASP8 and FAS promoter regions using PWM analysis. Blue wireframes
and arrows indicate high-scoring binding sites (four sites on the
CASP8 promoter and two sites on the FAS promoter). (C) The
correlation regression results of CASP8 and FAS with STAT1 in OC.
The significance of each regression was determined using the Wald
test with the t-distribution using the SciPy Python package. (D)
Schematic diagram showing the full-length promoter (top) and three
truncated fragments of CASP8 with colored squares indicating
predicted binding sites and sequences. (E) Detection of STAT1
binding to CASP8 promoter DNA using dual-luciferase reporter gene
assays. (F) Schematic diagram showing the full-length promoter
(top) and one truncated fragment of FAS (bottom) with colored
squares indicating predicted binding sites and sequences. (G)
Detection of STAT1 directly binding to FAS promoter DNA using
dual-luciferase reporter gene assays. 293T cells were
co-transfected with a dual-luciferase reporter gene plasmid and
oe-STAT1α, oe-STAT1β or empty vector. Differences among multiple
groups were analyzed using one-way ANOVA followed by Tukey's
Honestly Significant Difference test. Data are presented as the
mean ± standard error of the mean (n=3). *P<0.05;
**P<0.01; ***P<0.001 vs. vector. (H)
Schematic illustration of the regulatory mechanism of STAT1 on the
reversal of PTX resistance in OC cells. In PTX-resistant cells, the
expression levels of STAT1 and apoptotic factors FAS and CASP3 were
low. Administration of PTX increased STAT1 expression and the
overexpression of STAT1 upregulated FAS and CASP8 at the
transcriptional level, thus promoting PTX-resistant cell apoptosis.
CASP8, caspase-8; FAS, Fas cell surface death receptor; ns, not
significant; oe, overexpression vector; OC, ovarian cancer; PTX,
paclitaxel; PWM, position weight matrix; r, R-value; TSS,
transcription start site. |
Discussion
Chemoresistance is one of the major obstacles in
anticancer treatment. The present study explored the role and
regulatory mechanism of STAT1 in PTX-resistant OC cells.
Overexpression of STAT1 upregulated the expression levels of
apoptosis-related genes CASP8 and FAS, thereby
enhancing the PTX sensitivity in resistant cells in vitro
and in vivo.
In the present study, analyses using mRNA-sequencing
revealed that STAT1 was differentially expressed between
PTX-sensitive and PTX-resistant OC cells. Low levels of STAT
expression were detected in PTX-resistant cells compared with
PTX-sensitive cells. Overexpression of STAT1 enhanced the PTX
sensitivity in resistant cells, suggesting that STAT1 is an
important factor in mediating the processes of PTX resistance. It
has been demonstrated that STAT1 serves a dual role in
tumorigenesis, exhibiting upregulation or downregulation in other
cancer types (18,37). Some unphosphorylated STAT1
molecules also exhibit transcriptional activity (38). Our previous study demonstrated
that STAT1 was upregulated in OC cells compared with normal ovarian
cells (39), and overexpression
of STAT1 blocked the function of the TGF-β signaling pathway
(20). The present study further
demonstrated that STAT1 was a potential biomarker and target for
OC. Notably, similar outcomes have been shown by other groups. For
example, STAT1 negatively regulated the proliferative capacity in
hepatocellular carcinoma cells (40) and was a favorable factor affecting
the prognosis of colorectal cancer (41). Another study demonstrated that
STAT1 activity was associated with the degree of disease
progression from ductal carcinoma in situ to invasive
carcinoma in both human and mouse mammary tumors (42). Furthermore, STAT1 is a promoter of
leukemia progression (43). Our
previous meta-analysis reviewed the clinical impact of STAT1; high
STAT1 expression was associated with longer overall survival in
patients with OC, rectum adenocarcinoma, sarcoma and cutaneous
melanoma, but was associated with poor prognosis in patients with
lung adenocarcinoma, renal cancer, brain lower-grade glioma and
pancreatic cancer (44). Existing
evidence indicates that STAT1 serves a dual role and has both
tumor-suppressing and tumor-promoting functions (18). The functional effect of STAT1 on
tumor progression is highly context-dependent, varying with disease
stage, genetic backgrounds and tissue origins (44). Therefore, targeting STAT1 for
cancer therapy demands a precision medicine approach, where its
activity is modulated based on the specific tumor context.
STAT1 has some common characteristics of TFs that
can be targeted in anticancer therapy (45). The number of oncogenes identified
is much larger than the number of TF genes. Considering that TFs
are the initiators of gene expression, a series of downstream
functional oncogenes and tumor suppressor genes can be activated or
inhibited if the activity of specific cancer-related TFs is altered
(46). Nevertheless, the
regulatory mechanisms are not fully understood. The biological
functions of TFs rely on protein-DNA or protein-protein
interactions (47,48). Compared with the more tractable
enzyme or kinase interactions, inhibitors of protein-DNA or
protein-protein binding are deficient, leading to the difficulty of
directly targeting the functional processes of TFs (49). In addition, it is also challenging
to identify the cancer-related molecules that can be manipulated
for therapeutic purposes (50)
since the downstream target genes of specific TFs are numerous and
may have different functions.
FAS and CASP8 are two key proteins for the
regulation of the apoptosis pathway. FAS is a death receptor that
can directly interact with CASP8 to form a complex and initiate
programmed cell death, and PTX can induce apoptosis (51,52). In the present study, the viability
of PTX-resistant cells was decreased after oe-STAT1α infection in
the presence of PTX. These effects of STAT1α were completely
abolished in OV3R-PTX and A2780-PTX cells and partially abolished
in SK3R-PTX cells in the presence of the caspase inhibitor
Z-VAD-FMK, whereas the effect of STAT1β was minor. The difference
among these cell types was most likely due to multiple factors,
such as cell type specificity, infection efficiency and the
sensitivity of the inhibitor. To the best of our knowledge, the
present study was the first to demonstrate that STAT1 increased FAS
and CASP8 expression in PTX-resistant cells by directly binding to
their promoters to regulate them at the transcriptional level.
These data suggested that STAT1 reversed PTX resistance, at least
in part, through FAS/CASP8-induced apoptosis.
Our previous study demonstrated that STAT1 increased
OC cell proliferation (20).
STAT1 exists in two isoforms. STAT1α is considered to be the
full-length STAT1 protein, which consists of 750 amino acids and
has two important phosphorylation sites located in the C-terminal
transactivation domain (TAD), namely, tyrosine residue 701 (Y701)
and serine residue 727. STAT1β consists of 712 amino acids and has
only one phosphorylation site, Y701 (53). It has been shown that the
C-terminal TAD of STAT1 can serve an important trans-regulatory
role at the transcriptional level by recruiting different cofactors
(54). On the other hand, the
C-terminal TAD also interacts with the histone acetyltransferase
CBP/p300, which promotes the DNA-binding activity of STAT1
(55). Therefore, the functional
differences between STAT1α and STAT1β may partially be due to their
sequence and structural differences in the C-terminal TAD. The
present study demonstrated that overexpression of STAT1α decreased
PTX-resistant OC cell viability and inhibited tumor formation in
xenograft mice. Our previous work also revealed that STAT1α was the
main STAT1 isoform expressed in OC cells (20,38). However, STAT1β may also serve a
role in PTX-resistant cells. For example, the protein levels of FAS
were higher after STAT1β overexpression than after STAT1α
overexpression in SK3R-PTX cells as detected by western blotting,
and STAT1β had a stronger transcription-promoting activity in the
pGL4-CASP8-1557 group in the dual luciferase reporter gene assay
compared with STAT1α. These data suggest that the two isoforms of
STAT1 have certain respective functions, depending on the targets
and cancer types.
The present study had some limitations that require
further exploration. First, the current study lacked clinical
validation. Future studies should include prospective data as well
as retrospective data analyses to evaluate the role of STAT1. The
collection of patient samples is most useful to examine the
expression of STAT1 associated with PTX resistance. Second, the
role of STAT1β in PTX-resistant cells is not fully understood and
requires further investigation. Future studies should investigate
the upstream molecular mechanisms that regulate STAT1. For example,
post-translational modifications might switch STAT1β activation.
Specific signals such as TGF-β or IL could be controlling STAT1
isoforms in PTX-resistant cells. Third, whether STAT1-influenced
PTX resistance was involved in the intrinsic apoptotic pathway is
unknown and would be interesting to investigate in future studies.
To strengthen the effect of STAT1, a potential strategy would be
targeting it in combination with PTX to overcome resistance and
improve treatment efficacy. Since low STAT1 expression is a marker
of PTX resistance, raising the STAT1 level in PTX-resistant
patients may be a potential treatment option. For example, to
re-sensitize OC to PTX, STAT1 could be introduced using viral
vectors such as adenoviruses to deliver a healthy copy of the gene
encoding STAT1 directly into OC cells as a gene therapy, thereby
reversing their drug resistance or re-sensitizing them to PTX.
Furthermore, high levels of STAT1 in tumors could predict a better
response to PTX therapy. Therefore, STAT1 can be utilized as a
biomarker to predict how a patient will react to PTX treatment.
In conclusion, the present study demonstrated that
STAT1 expression was downregulated in PTX-resistant OC cells.
Overexpression of STAT1 upregulated the key apoptotic factors FAS
and CASP8 at the transcriptional level, thereby triggering the
apoptotic pathway to reverse PTX resistance (Fig. 6H). These findings may provide a
potential therapeutic strategy to reverse PTX resistance in OC
patients by targeting STAT1.
Supplementary Data
Availability of data and materials
The data generated in the present study may be
requested from the corresponding author.
Authors' contributions
FW contributed to experiments, data analyses, figure
generation and manuscript drafts. XX and BG contributed to the
bioinformatics analysis and in vitro experimental
validation. XL, JY, WG, JC, JF and QL contributed to the primer
design, and animal and cellular experiments. GX contributed to the
supervision, conceptualization, funding acquisition and project
administration, and wrote and edited the final manuscript. FW and
GX confirm the authenticity of all the raw data. All authors read
and approved the final version of the manuscript.
Ethics approval and consent to
participate
The animal studies were approved by the Ethics
Committee of Jinshan Hospital, Fudan University (approval no.
JIEC-2023-S68; Shanghai, China) and the Laboratory Animal Welfare
and Ethics Committee of the Shanghai Public Health Clinical Center,
Fudan University (approval no. 2020-A027-01; Shanghai, China).
Patient consent for publication
Not applicable.
Competing interests
The authors declare that they have no competing
interests.
Authors' information
GX ORCID: 0000-0002-9074-8754.
Abbreviations:
|
CASP8
|
caspase-8
|
|
Dox
|
doxycycline
|
|
FAS
|
Fas cell surface death receptor
|
|
GEO
|
Gene Expression Omnibus
|
|
GFP
|
green fluorescent protein
|
|
GSEA
|
Gene Set Enrichment Analysis
|
|
NC
|
negative control
|
|
OC
|
ovarian cancer
|
|
PTX
|
paclitaxel
|
|
RT-qPCR
|
reverse transcription-quantitative
PCR
|
|
TCGA
|
The Cancer Genome Atlas
|
Acknowledgements
The authors would like to thank Professor Yanyan
Zhan (Cancer Research Center, School of Medicine, Xiamen
University, Xiamen, China) for providing the original plasmid of
the tet-on system.
Funding
The present study was supported by grants from the National
Natural Science Foundation of China (grant no. 81872121) and the
Natural Science Foundation of Shanghai Municipality (grant no.
23ZR1408900).
References
|
1
|
Siegel RL, Kratzer TB, Giaquinto AN, Sung
H and Jemal A: Cancer statistics, 2025. CA Cancer J Clin. 75:10–45.
2025.PubMed/NCBI
|
|
2
|
Caruso G, Weroha SJ and Cliby W: Ovarian
cancer: A review. JAMA. 334:1278–1291. 2025. View Article : Google Scholar : PubMed/NCBI
|
|
3
|
Rodolakis I, Pergialiotis V, Liontos M,
Haidopoulos D, Loutradis D, Rodolakis A, Bamias A and Thomakos N:
Chemotherapy response score in ovarian cancer patients: An overview
of its clinical utility. J Clin Med. 12:21552023. View Article : Google Scholar : PubMed/NCBI
|
|
4
|
Kampan NC, Madondo MT, McNally OM, Quinn M
and Plebanski M: Paclitaxel and its evolving role in the management
of ovarian cancer. Biomed Res Int. 2015:4130762015. View Article : Google Scholar : PubMed/NCBI
|
|
5
|
Olawaiye AB, Kim JW, Bagameri A, Bishop E,
Chudecka-Głaz A, Devaux A, Gladieff L, Gordinier ME, Korach J,
McCollum ME, et al: Clinical trial protocol for ROSELLA: A phase 3
study of relacorilant in combination with nab-paclitaxel versus
nab-paclitaxel monotherapy in advanced platinum-resistant ovarian
cancer. J Gynecol Oncol. 35:e1112024. View Article : Google Scholar : PubMed/NCBI
|
|
6
|
Vaidyanathan A, Sawers L, Gannon AL,
Chakravarty P, Scott AL, Bray SE, Ferguson MJ and Smith G: ABCB1
(MDR1) induction defines a common resistance mechanism in
paclitaxel- and olaparib-resistant ovarian cancer cells. Br J
Cancer. 115:431–441. 2016. View Article : Google Scholar : PubMed/NCBI
|
|
7
|
Pei Y, Yang Z, Li B, Chen X, Mao Y and
Ding Y: Unraveling the molecular mechanisms of paclitaxel in
high-grade serous ovarian cancer through network pharmacology. Sci
Rep. 15:164452025. View Article : Google Scholar : PubMed/NCBI
|
|
8
|
Hanahan D: Hallmarks of cancer: New
dimensions. Cancer Discov. 12:31–46. 2022. View Article : Google Scholar : PubMed/NCBI
|
|
9
|
Zhang Y, Qiu JG, Wang W, Sun FL, Wang X,
Liu WJ, Jia XY, Ji H, Wang L and Jiang BH: Suppression of CYLD by
HER3 confers ovarian cancer platinum resistance via inhibiting
apoptosis and by inducing drug efflux. Exp Hematol Oncol.
14:212025. View Article : Google Scholar : PubMed/NCBI
|
|
10
|
Mosadegh M, Noori Goodarzi N and Erfani Y:
A comprehensive insight into apoptosis: Molecular mechanisms,
signaling pathways, and modulating therapeutics. Cancer Invest.
43:33–58. 2025. View Article : Google Scholar : PubMed/NCBI
|
|
11
|
Fulda S and Debatin KM: Extrinsic versus
intrinsic apoptosis pathways in anticancer chemotherapy. Oncogene.
25:4798–4811. 2006. View Article : Google Scholar : PubMed/NCBI
|
|
12
|
Carneiro BA and El-Deiry WS: Targeting
apoptosis in cancer therapy. Nat Rev Clin Oncol. 17:395–417. 2020.
View Article : Google Scholar : PubMed/NCBI
|
|
13
|
Bertheloot D, Latz E and Franklin BS:
Necroptosis, pyroptosis and apoptosis: An intricate game of cell
death. Cell Mol Immunol. 18:1106–1121. 2021. View Article : Google Scholar : PubMed/NCBI
|
|
14
|
Cai W, Rong D, Ding J, Zhang X, Wang Y,
Fang Y, Xiao J, Yang S and Wang H: Activation of the PERK/eIF2α
axis is a pivotal prerequisite of taxanes to cancer cell apoptosis
and renders synergism to overcome paclitaxel resistance in breast
cancer cells. Cancer Cell Int. 24:2492024. View Article : Google Scholar
|
|
15
|
McFadden M, Singh SK, Kinnel B, Varambally
S and Singh R: The effect of paclitaxel- and fisetin-loaded PBM
nanoparticles on apoptosis and reversal of drug resistance gene
ABCG2 in ovarian cancer. J Ovarian Res. 16:2202023. View Article : Google Scholar : PubMed/NCBI
|
|
16
|
Souto EP, Gong P, Landua JD, Rajaram
Srinivasan R, Ganesan A, Dobrolecki LE, Purdy SC, Pan X, Zeosky M,
Chung A, et al: Lineage tracing and single-cell RNA sequencing
reveal a common transcriptional state in breast cancer
tumor-initiating cells characterized by IFN/STAT1 activity. Cancer
Res. 85:1390–1409. 2025. View Article : Google Scholar : PubMed/NCBI
|
|
17
|
Han H, Gong C, Zhang Y, Liu C, Wang Y,
Zhao D, Huang J and Gong Z: RBM30 recruits DOT1L to activate STAT1
transcription and drive immune evasion in hepatocellular carcinoma.
Oncogene. 44:3955–3973. 2025. View Article : Google Scholar : PubMed/NCBI
|
|
18
|
Li X, Wang F, Xu X, Zhang J and Xu G: The
dual role of STAT1 in ovarian cancer: Insight into molecular
mechanisms and application potentials. Front Cell Dev Biol.
9:6365952021. View Article : Google Scholar : PubMed/NCBI
|
|
19
|
Gerhard DS, Wagner L, Feingold EA, Shenmen
CM, Grouse LH, Schuler G, Klein SL, Old S, Rasooly R, Good P, et
al: The status, quality, and expansion of the NIH full-length cDNA
project: The mammalian gene collection (MGC). Genome Res.
14:2121–2127. 2004. View Article : Google Scholar : PubMed/NCBI
|
|
20
|
Tian X, Guan W, Zhang L, Sun W, Zhou D,
Lin Q, Ren W, Nadeem L and Xu G: Physical interaction of STAT1
isoforms with TGF-β receptors leads to functional crosstalk between
two signaling pathways in epithelial ovarian cancer. J Exp Clin
Cancer Res. 37:1032018. View Article : Google Scholar
|
|
21
|
Wang F, Xu X, Li X, Yuan J, Gao X, Wang C,
Guan W and Xu G: Target finder of transcription factor (TFoTF): A
novel tool to predict transcription factor-targeted genes in
cancer. Mol Oncol. 17:1246–1262. 2023. View Article : Google Scholar : PubMed/NCBI
|
|
22
|
Zhang J, Guan W, Xu X, Wang F, Li X and Xu
G: A novel homeostatic loop of sorcin drives paclitaxel-resistance
and malignant progression via Smad4/ZEB1/miR-142-5p in human
ovarian cancer. Oncogene. 40:4906–4918. 2021. View Article : Google Scholar : PubMed/NCBI
|
|
23
|
Das AT, Tenenbaum L and Berkhout B: Tet-on
systems for doxycycline-inducible gene expression. Curr Gene Ther.
16:156–167. 2016. View Article : Google Scholar : PubMed/NCBI
|
|
24
|
Tönjes M, Barbus S, Park YJ, Wang W,
Schlotter M, Lindroth AM, Pleier SV, Bai AHC, Karra D, Piro RM, et
al: BCAT1 promotes cell proliferation through amino acid catabolism
in gliomas carrying wild-type IDH1. Nat Med. 19:901–908. 2013.
View Article : Google Scholar : PubMed/NCBI
|
|
25
|
Livak KJ and Schmittgen TD: Analysis of
relative gene expression data using real-time quantitative PCR and
the 2(-delta delta C(T)) method. Methods. 25:402–408. 2001.
View Article : Google Scholar
|
|
26
|
Xu X, Wang C, Guan W, Wang F, Li X, Yuan J
and Xu G: Protoporphyrin IX-loaded albumin nanoparticles reverse
cancer chemoresistance by enhancing intracellular reactive oxygen
species. Nanomedicine. 51:1026882023. View Article : Google Scholar : PubMed/NCBI
|
|
27
|
Wu T, Hu E, Xu S, Chen M, Guo P, Dai Z,
Feng T, Zhou L, Tang W, Zhan L, et al: clusterProfiler 4.0: A
universal enrichment tool for interpreting omics data. Innovation
(Camb). 2:1001412021.PubMed/NCBI
|
|
28
|
Walter W, Sánchez-Cabo F and Ricote M:
GOplot: An R package for visually combining expression data with
functional analysis. Bioinformatics. 31:2912–2914. 2015. View Article : Google Scholar : PubMed/NCBI
|
|
29
|
Liberzon A, Birger C, Thorvaldsdóttir H,
Ghandi M, Mesirov JP and Tamayo P: The molecular signatures
database (MSigDB) hallmark gene set collection. Cell Syst.
1:417–425. 2015. View Article : Google Scholar
|
|
30
|
Davidson-Pilon C: lifelines: survival
analysis in Python. J Open Source Softw. 4:13172019. View Article : Google Scholar
|
|
31
|
Rozowsky J, Euskirchen G, Auerbach RK,
Zhang ZD, Gibson T, Bjornson R, Carriero N, Snyder M and Gerstein
MB: PeakSeq enables systematic scoring of ChIP-seq experiments
relative to controls. Nat Biotechnol. 27:66–75. 2009. View Article : Google Scholar : PubMed/NCBI
|
|
32
|
Auerbach RK, Euskirchen G, Rozowsky J,
Lamarre-Vincent N, Moqtaderi Z, Lefrançois P, Struhl K, Gerstein M
and Snyder M: Mapping accessible chromatin regions using Sono-Seq.
Proc Natl Acad Sci USA. 106:14926–14931. 2009. View Article : Google Scholar : PubMed/NCBI
|
|
33
|
Yu G, Wang LG and He QY: ChIPseeker: An
R/Bioconductor package for ChIP peak annotation, comparison and
visualization. Bioinformatics. 31:2382–2383. 2015. View Article : Google Scholar : PubMed/NCBI
|
|
34
|
Lawrence M, Huber W, Pagès H, Aboyoun P,
Carlson M, Gentleman R, Morgan MT and Carey VJ: Software for
computing and annotating genomic ranges. PLoS Comput Biol.
9:e10031182013. View Article : Google Scholar : PubMed/NCBI
|
|
35
|
Koti M, Gooding RJ, Nuin P, Haslehurst A,
Crane C, Weberpals J, Childs T, Bryson P, Dharsee M, Evans K, et
al: Identification of the IGF1/PI3K/NF κB/ERK gene signalling
networks associated with chemotherapy resistance and treatment
response in high-grade serous epithelial ovarian cancer. BMC
Cancer. 13:5492013. View Article : Google Scholar
|
|
36
|
Virtanen P, Gommers R, Oliphant TE,
Haberland M, Reddy T, Cournapeau D, Burovski E, Peterson P,
Weckesser W, Bright J, et al: SciPy 1.0: Fundamental algorithms for
scientific computing in python. Nat Methods. 17:261–272. 2020.
View Article : Google Scholar : PubMed/NCBI
|
|
37
|
Zhang Y and Liu Z: STAT1 in cancer: Friend
or foe? Discov Med. 24:19–29. 2017.PubMed/NCBI
|
|
38
|
Meissl K, Macho-Maschler S, Müller M and
Strobl B: The good and the bad faces of STAT1 in solid tumours.
Cytokine. 89:12–20. 2017. View Article : Google Scholar
|
|
39
|
Liu F, Liu J, Zhang J, Shi J, Gui L and Xu
G: Expression of STAT1 is positively correlated with PD-L1 in human
ovarian cancer. Cancer Biol Ther. 21:963–971. 2020. View Article : Google Scholar : PubMed/NCBI
|
|
40
|
Chen G, Wang H, Xie S, Ma J and Wang G:
STAT1 negatively regulates hepatocellular carcinoma cell
proliferation. Oncol Rep. 29:2303–2310. 2013. View Article : Google Scholar : PubMed/NCBI
|
|
41
|
Gordziel C, Bratsch J, Moriggl R, Knösel T
and Friedrich K: Both STAT1 and STAT3 are favourable prognostic
determinants in colorectal carcinoma. Br J Cancer. 109:138–146.
2013. View Article : Google Scholar : PubMed/NCBI
|
|
42
|
Hix LM, Karavitis J, Khan MW, Shi YH,
Khazaie K and Zhang M: Tumor STAT1 transcription factor activity
enhances breast tumor growth and immune suppression mediated by
myeloid-derived suppressor cells. J Biol Chem. 288:11676–11688.
2013. View Article : Google Scholar : PubMed/NCBI
|
|
43
|
Kovacic B, Stoiber D, Moriggl R, Weisz E,
Ott RG, Kreibich R, Levy DE, Beug H, Freissmuth M and Sexl V: STAT1
acts as a tumor promoter for leukemia development. Cancer Cell.
10:77–87. 2006. View Article : Google Scholar : PubMed/NCBI
|
|
44
|
Zhang J, Wang F, Liu F and Xu G:
Predicting STAT1 as a prognostic marker in patients with solid
cancer. Ther Adv Med Oncol. 12:17588359209175582020. View Article : Google Scholar : PubMed/NCBI
|
|
45
|
Darnell JE Jr: Transcription factors as
targets for cancer therapy. Nat Rev Cancer. 2:740–749. 2002.
View Article : Google Scholar : PubMed/NCBI
|
|
46
|
Lee TI and Young RA: Transcriptional
regulation and its misregulation in disease. Cell. 152:1237–1251.
2013. View Article : Google Scholar : PubMed/NCBI
|
|
47
|
Lambert SA, Jolma A, Campitelli LF, Das
PK, Yin Y, Albu M, Chen X, Taipale J, Hughes TR and Weirauch MT:
The human transcription factors. Cell. 175:598–599. 2018.
View Article : Google Scholar : PubMed/NCBI
|
|
48
|
Spitz F and Furlong EE: Transcription
factors: From enhancer binding to developmental control. Nat Rev
Genet. 13:613–626. 2012. View Article : Google Scholar : PubMed/NCBI
|
|
49
|
Bushweller JH: Targeting transcription
factors in cancer-from undruggable to reality. Nat Rev Cancer.
19:611–624. 2019. View Article : Google Scholar : PubMed/NCBI
|
|
50
|
Lambert M, Jambon S, Depauw S and
David-Cordonnier MH: Targeting transcription factors for cancer
treatment. Molecules. 23:14792018. View Article : Google Scholar : PubMed/NCBI
|
|
51
|
Blagosklonny MV, Robey R, Sheikh MS and
Fojo T: Paclitaxel-induced FasL-independent apoptosis and slow
(non-apoptotic) cell death. Cancer Biol Ther. 1:113–117. 2002.
View Article : Google Scholar : PubMed/NCBI
|
|
52
|
Wang TH, Wang HS and Soong YK:
Paclitaxel-induced cell death: Where the cell cycle and apoptosis
come together. Cancer. 88:2619–2628. 2000. View Article : Google Scholar : PubMed/NCBI
|
|
53
|
Oda K, Matoba Y, Irie T, Kawabata R,
Fukushi M, Sugiyama M and Sakaguchi T: Structural basis of the
inhibition of STAT1 activity by sendai virus C protein. J Virol.
89:11487–11499. 2015. View Article : Google Scholar : PubMed/NCBI
|
|
54
|
Parrini M, Meissl K, Ola MJ, Lederer T,
Puga A, Wienerroither S, Kovarik P, Decker T, Müller M and Strobl
B: The C-terminal transactivation domain of STAT1 has a
gene-specific role in transactivation and cofactor recruitment.
Front Immunol. 9:28792018. View Article : Google Scholar : PubMed/NCBI
|
|
55
|
Wojciak JM, Martinez-Yamout MA, Dyson HJ
and Wright PE: Structural basis for recruitment of CBP/p300
coactivators by STAT1 and STAT2 transactivation domains. EMBO J.
28:948–958. 2009. View Article : Google Scholar : PubMed/NCBI
|