Introduction
According to 2022 cancer statistics, among 36
tumors, the global incidence and mortality rates of liver cancer
rank sixth and fourth, respectively (1). Hepatocellular carcinoma (HCC) is the
primary histological subtype of primary liver cancer, accounting
for 75-85% of cases (2,3). Due to the lack of individualized
diagnostic markers, HCC is often diagnosed late, which is the main
reason for its poor prognosis (4). The treatment bottlenecks of HCC
mainly include tumor heterogeneity, drug resistance and
optimization of multidisciplinary comprehensive treatment and
biomarker indicators are essential to guide treatment selection
(5). Mitochondria, as essential
organelles in eukaryotic cells, play a central role in energy
metabolism, maintaining redox balance and regulating cell
apoptosis. Mitochondrial DNA (mtDNA) mutations, electron transport
chain defects, oxidative stress, mitochondrial autophagy and other
types of mitochondrial dysfunction are closely related to the
occurrence of tumors (6). In
addition, strategies that target mitochondria serve an important
role in tumor treatment (7).
Kynurenine (Kyn) 3-monooxygenase (KMO) is one of the
three rate-limiting enzymes [indoleamine-2,3-dioxygenase (IDO),
tryptophan (Try)-2,3-dioxygenase (TDO) and KMO] of the Try-Kyn
pathway and is located on the outer membrane of mitochondria
(8,9). However, studies regarding the role
of KMO in mitochondrial structural and function are insufficient.
Maddison et al (10)
reported that deficiency in the KMO ortholog (cinnabar) in
Drosophila triggered morphological elongation and a
reduction in respiratory capacity in mitochondria. At present, it
is widely known that mitochondrial dynamics are involved in a range
of diseases, including cancer (11). Dysregulated mitochondrial dynamics
can promote cancer development by affecting tumor cell
proliferation, metastasis, drug resistance and the tumor
microenvironment, which highlights the potential of targeting
mitochondrial dynamics as a promising anticancer strategy (11).
KMO has a dual effect on tumor progression in
various types of cancer, influencing tumor occurrence, development
and immune escape. KMO is highly expressed in breast cancer and
colon cancer and is associated with poor prognosis, whereas its
expression is downregulated in clear cell and chromophobe cell
renal cell carcinoma, as well as in endometrial carcinoma and
nasopharyngeal carcinoma (12-16). These studies suggest the
complexity of the function of KMO in tumors and the research on KMO
in tumor progression is in its infancy (17). As research on Try metabolism in
tumors advances, targeting key enzymes such as IDO1 and TDO to
disrupt immunosuppressive signaling has emerged as a promising
strategy. However, the inconsistent outcomes of IDO1 inhibitors in
advanced trials underscore the necessity for further investigation
into Try metabolism within cancer contexts (18). In HCC, Jin et al (19) reported that KMO expression was
higher in cancer tissues than in adjacent tissues and its
expression in liver cancer cells promoted the malignant progression
of tumor cells. However, Shi et al (20) revealed that KMO and the Kyn
derivative 3-hydroxyanthranilic acid (3-HAA), also the downstream
product of KMO, may inhibit tumor formation by inducing cell
apoptosis via activating the transcription factor Yin Yang 1 (YY1).
Notably, there is a lack of research on whether KMO located on the
mitochondria promotes the progression of HCC by affecting
mitochondrial homeostasis and whether the effect of KMO-induced
mitochondrial disorder is related to Try metabolism.
The present study systematically investigated the
role of KMO-mediated mitochondrial dysfunction in the malignant
progression of HCC using public data, clinical samples and HCC cell
lines. The differential expression of genes related to
mitochondria, including KMO, were initially screened across
multiple public HCC datasets. Subsequently, the expression of KMO
was validated in clinical samples of HCC. Furthermore, by
interfering with KMO expression in HCC cells, changes in
mitochondrial mass and function were observed. The current study
also explored the impact of KMO-mediated downstream
3-hydroxyanthranilic acid (3-HAA) on mitochondrial mass and
function, aiming to clarify the potential mechanisms underlying
KMO-mediated mitochondrial dysfunction in HCC and to provide new
strategies for HCC treatment.
Materials and methods
Patients and specimens
A total of 31 pairs of tissue specimens, including
tumor and adjacent tissues (distance from tumor edge >1 cm),
from 31 patients with pathologically confirmed HCC were collected
from the Department of Oncology and Vascular Intervention, First
Hospital of Shanxi Medical University between January 2021 and
December 2022. The patients (29 men and 2 women) ranged in age from
50-78 years. The clinicopathological features of these patients
with HCC is shown in Table SI.
This study was approved by the ethics committee of the First
Hospital of Shanxi Medical University (approval number:
2021SLL086). All patients provided written informed consent. All
research was conducted in strict accordance with the Helsinki
Declaration and relevant institutional and national
regulations.
Public database
The HCC-related GSE101728, GSE45050, GSE84598 and
GSE121248 datasets from the Gene Expression Omnibus (GEO) database
(https://www.ncbi.nlm.nih.gov/gds/?term=) were used for
screening of shared differentially expressed genes (DEGs). The
Cancer Genome Atlas (TCGA)-liver hepatocellular carcinoma (LIHC)
dataset containing the clinical information and mRNA expression
data of 371 HCC patients and 50 normal controls was downloaded from
the TCGA database (https://portal.gdc.cancer.gov/). The somatic mutation
profiles of HCC patients were obtained from the University of
California, Santa Cruz (UCSC Xena Browser, https://xenabrowser.net/datapages/). HCC related
single cell sequencing dataset GSE202642 came from the GEO
database.
DEGs screening
DEGs from the HCC-related GSE101728, GSE45050,
GSE84598 and GSE121248 datasets were screened using the GEO 2R
analysis tool (https://www.ncbi.nlm.nih.gov/geo/geo2r/). The 'limma'
R package (version 3.52.0; https://bioinf.wehi.edu.au/limma/)was used to
normalize the TCGA-LIHC dataset and identify DEGs. Thresholds were
set as P<0.05 and |logFC|>1.
Mitochondrial-related DEGs (MRDEGs)
identification
The list of mitochondrial-related genes was obtained
from MitoCarta3.0 (https://www.broadinstitute.org/mitocarta/mitocarta30-inventory-mammalianmitochondrialproteins-and-pathways),
which includes 1,136 human mitochondrial-related genes.
Mitochondrial-related genes were intersected with the DEGs from the
four HCC-related GEO datasets to obtain MRDEGs.
Analysis of single cell sequencing
data
The GSE202642 dataset comprising seven HCC samples
and 4 adjacent non-tumor samples was analyzed, it contained a total
of 115,732 cells and 36,601 genes. The 'Seurat' R package (version
4.3.0; https://github.com/satijalab/seurat) was used to
process single cell sequencing data as follows: i) 'DoubletFinder'
was applied to remove doublets; ii) the 'PercentageFeatureSet'
function calculated mitochondria and red blood cells content per
cell. Quality control was performed using the criteria: i) Detected
genes per cell >500; ii) detected genes per cell <6,000; iii)
mitochondrial genes <20; iv) red blood cells <1.
'NormalizeData' and 'ScaleData' functions were then used to
normalize and scale the data. 'RunPCA' function performed linear
dimensionality reduction with dim=20. 'FindClusters' function
clustered cells with resolution=0.9. 'RunTSNE' function performed
tSNE dimensionality reduction. 'FindAllMarkers' function identified
DEGs in each cell cluster. The 'SingleR' R package (version 2.0.0;
https://github.com/SingleR-inc/SingleR) was used to
identify and annotate cell types. KMO expression levels in normal
and HCC samples were compared across different cell types.
Survival analysis
Overall Survival analysis of genes in HCC patients
was performed using the Kaplan-Meier Plotter online tool
(http://kmplot.com/analysis/).
Weighted gene co-expression network
analysis (WGCNA)
WGCNA was constructed using the DEGs matrix of 340
HCC samples via the 'WGCNA' R package (version 1.71; https://CRAN.R-project.org/package=WGCNA). Sample
clustering was performed using the 'hcluster' function to identify
and remove outliers. The optimal soft threshold power β for network
construction was determined using the 'pickSoftThreshold' function.
The adjacency degree matrix was transformed into a topological
overlap matrix (TOM) using 'TOMsimilarity'. Gene expression
similarity was then calculated and the minimum value of module
genes was set to 30 genes. According to the similarity, genes were
divided into different co-expression modules and the module
allocation diagram under gene tree diagram was drawn by
DynamicTreeCut. HCC samples were divided into high and low KMO
expression groups based on the median value of KMO expression.
Correlation analysis was performed between gene co-expression
module and KMO expression status. Pearson's correlation coefficient
and P-value were calculated using the 'cor' function. The
co-expression module with the largest correlation coefficient
P<0.05 was regarded as the key functional module and the genes
within this module were considered KMO-co-expressed hub genes.
Gene enrichment analysis
Gene Ontology (GO) analysis and Kyoto Encyclopedia
of Genes and Genomes (KEGG) analysis were performed using
clusterProfiler (version 4.8.0; https://yulab-smu.top/contribution-knowledge-mining/)
and ggplot2 (version 3.4.1; https://CRAN.R-project.org/package=ggplot2) packages
in R.
Protein-protein interaction (PPI) and
correlation analysis
To investigate the relationship between KMO and Try
metabolic pathway genes, Try metabolic pathway genes were
downloaded from the GSEA official website (https://www.gsea-msigdb.org/gsea/msigdb/index.jsp) and
analyzed using the STRING database (https://string-db.org/). The PPI network was
visualized using Cytoscape 3.9.0 software (https://cytoscape.org/). The hub genes related to KMO
were captured using CytoHubba of Cytoscape. Correlation heatmaps
and lollipop plots were generated using the online SRplot tool
(http://www.bioinformatics.com.cn/SRplot) (21).
Cell culture and KMO expression cell
model
The HCC cell lines MHCC-97H and HCCLM3 (Cell
Resource Center, Institute of Basic Medicine, Chinese Academy of
Medical Sciences) were cultured in DMEM supplemented with 10% FBS
at 37°C with 5% CO2.
KMO-overexpressing lentivirus were constructed by
Shanghai GenePharma Co., Ltd. using the 3rd lentiviral, LV5
(EF-1a/GFP&Puro). 293T cells (Cell Bank of Chinese Academy of
Sciences) was selected to package the lentivirus using shuttle
plasmid H6370 and packaging plasmid (pGag/Pol, pRev, pVSV-G). The
lentivirus titer of 293T cells after 72 h of infection with the
collected lentivirus stock solution was 9×10⁸ TU/ml.
Multiplicity of infection (MOI) was calculated according to virus
titer and the optimal MOI (1 number/cell) was determined for HCC
cell infection by pre-experiment. For lentiviral overexpression,
cells were seeded in 24-well plates at 5×10⁴ cells/well.
When confluence reached 40-60%, cells were infected with
KMO-overexpressing lentivirus at 1×10⁵ TU/ml. After 24
h, the medium was replaced with fresh culture medium. Upon reaching
70-80% confluence, positive cells were screened using 1
µg/ml puromycin concentration (the optimal concentration
determined by puromycin concentration gradient experiment), and 0.5
µg/ml was the maintenance concentration of cultured cells.
For short interfering (si)RNA knockdown, siRNA targeting KMO
(5′-GGA GCC TAT TCA ACT GTC A-3′, 5′-GCG AGC ACA TGT CAA CTC A-3′
and 5′-CCA AGG TAT TCC CAT GAG A-3′) and control siRNA was designed
and synthesized by Guangzhou RiboBio Co., Ltd. Cells were seeded in
6-well plates at 3×10⁵ cells per well and transfected at
70-80% confluence using Lipo8000 reagent (Beyotime Institute of
Biotechnology) with the screened siRNA sequence (5′-CCA AGG TAT TCC
CAT GAG A-3′) having the highest knockdown efficiency and a control
siRNA. Overexpression and knockdown efficiencies were assessed
using qPCR and western blotting. KMO stably overexpressing cell
lines and transiently transfected KMO-knockdown cells (harvested at
48 h) were used for subsequent studies.
Immunofluorescence
Cells were cultured in confocal dishes (1,000
cells/dish) for 24 h, then stained with Mito-tracker at 37°C for 25
min in the dark. After washing with ice-cold PBS, cells were fixed
with 4% paraformaldehyde at 37°C for 1 h, permeabilized with 0.2%
TritonX-100 for 10 min, after TBST wash buffer (0.05% Tween 20)
washing 3 times (5 min/time), cells were blocked with 2% BSA
(Beijing Solarbio Science & Technology Co., Ltd.) for 10 min.
Cells were incubated with 1:100 diluted KMO or NR4A1 primary
antibody (cat no. 10698-1-AP and 12235-1-AP, Proteintech Group,
Inc.) overnight at 4°C, followed by fluorescent secondary antibody
(1:200; cat no. SA00013-2; Proteintech Group, Inc.) at room
temperature for 1 h. After DAPI staining (1:200) at room
temperature for 15 min, cells were imaged at a magnification of
×100.
Immunohistochemical staining
Paraffin-embedded sections (thickness: 5 µm)
were dewaxed, cleaned with PBS and treated with 3%
H2O2 to block endogenous peroxidase at room
temperature for 10 min. Antigen retrieval was performed using
sodium citrate buffer, followed by PBS washing. Sections were
blocked with 5% BSA at 37°C for 30 min, then incubated with 1:100
diluted KMO primary antibody (cat no. 10698-1-AP, Proteintech
Group, Inc.) overnight at 4°C. After washing, sections were
incubated with 1:1,000 diluted HRP-conjugated secondary antibody
(cat no. KIT-5010; Maxim Biomedical, Inc.) for 30 min at room
temperature. DAB staining was performed for 1 min, followed by
hematoxylin counterstaining for 5 min. Sections were dehydrated,
mounted and imaged using a light microscope. The staining intensity
(SI) and percentage of positive cells (PP) were used to calculate
the IHC score (22). SI was
graded as follows: 0 for negative, 1 for low positive, 2 for
moderate positive, and 3 for high positive. PP was classified into
four categories: 0 (0-9% positive cells), 1 (10-25%), 2 (26-50%), 3
(50-75%), and 4 (76-100%). The final immunohistochemical score (IS)
was derived by multiplying SI and PP (IS=SI x PP). Quantitative
analysis was performed using ImageJ software (version 1.53a,
National Institutes of Health).
mRNA extraction and reverse
transcription-quantitative (RT-q) PCR
Total RNA was extracted from tissue samples or
cultured cells using RNAiso Plus (Takara Bio, Inc.). RNA was
reverse-transcribed into cDNA using the PrimeScript RT Master Mix
Reverse Transcription Kit (Takara Bio, Inc.). The target gene
expression was quantified by two-step qPCR using TB
Green® Premix Ex Taq II (Takara Bio, Inc.) with the
procedure: pre-denaturation at 95°C for 30 sec, 1 cycle; denatured
at 95°C for 5 sec, annealed at 60°C and extended for 30 sec, 40
cycles. All operations of RNA extraction, cDNA synthesis, and qPCR
were carried out according to the manufacturer's protocols.
Relative expression levels were calculated using the
2−ΔΔCq method according to previous study (23). Primer sequences are listed in
Table I. Each sample was analyzed
in triplicate in three independent experiments.
 | Table IPrimer sequences used in reverse
transcription-quantitative PCR. |
Table I
Primer sequences used in reverse
transcription-quantitative PCR.
| Gene | Primers (5′ to
3′) |
|---|
| KMO | Forward:
CACTGTGTACTGCTGGGAGA |
| Reverse:
ATCGCGTGATCATCTGGGAT |
| β-actin | Forward:
ACTCTTCCAGCCTTCCTTCC |
| Reverse:
TCTCCTTCTGCATCCTGTCG |
| KYNU | Forward:
TGCTGAGTTCATGGCCAAAC |
| Reverse:
AGTGATCCTGTTCAGTGGGG |
| ND1 | Forward:
CCCTAAAACCCGCCACATCT |
| Reverse:
GAGCGATGGTGAGAGCTAAGGT |
| HGB | Forward:
GTGCACCTGACTCCTGAGGAGA |
| Reverse:
CCTTGATACCAACCTGCCCAG |
| MT-ATP6 | Forward:
ACAGTGATTATAGGCTTTCGCTCTAAG |
| Reverse:
ATTGGTTGAATGAGTAGGCTGATGG |
| MT-CO1 | Forward:
GCAGGAACAGGTTGAACAGTCTAC |
| Reverse:
TAGGTGTAAGGAGAAGATGGTTAGGTC |
| SOX4 | Forward:
GCAAGATCATGGAGCAGTCG |
| Reverse:
CCGGACTTCACCTTCTTCCT |
| HMGA1 | Forward:
GTAGGGAGTCAGAAGGAGCC |
| Reverse:
CCTCCTCTTCCTCCTTCTCC |
| NR4A1 | Forward:
AGAAGATCCCTGGCTTTGCT |
| Reverse:
CAGGGACATCGACAAGCAAG |
| FOXO1 | Forward:
CCGAGCTGCCAAGAAGAAAG |
| Reverse:
ATGCACATCCCCTTCTCCAA |
Protein extraction and western
blotting
Cells were lysed in RIPA buffer (Beyotime Institute
of Biotechnology), incubated on ice for 30 min and centrifuged at
12,000 × g for 20 min at 4°C. The supernatant was collected and
protein concentration was measured using a BCA kit (Beyotime
Institute of Biotechnology) at 562 nm.
Equal amounts of protein (≥20 µg) were
separated by 10% SDS-PAGE and subsequently transferred to the PVDF
membrane at 100 V for 1 h. Membranes were blocked with 5% non-fat
milk for 1 h at room temperature. The membrane was incubated with
1:500 diluted KMO (cat no. 10698-1-AP; Proteintech Group, Inc.) or
1:10,000 diluted β-Actin (cat no. 66009-1-Ig; Proteintech Group,
Inc.) primary antibodies overnight at 4°C. After washing, membranes
were incubated with 1:10,000 diluted horseradish
peroxidase-conjugated secondary antibody (cat no. SA00001-2;
Proteintech Group, Inc.) for 1 h at room temperature. Finally, the
chemiluminescent substrate (1:1 ratio of solutions A and B) was
added to the PVDF membrane for imaging after washing. Relative
protein expression was calculated using ImageJ software (version
1.53a, National Institutes of Health).
CCK-8 assay
Cell viability was assessed using the CCK-8 assay
kit (MeilunBio Co., Ltd.). Cells were seeded in 96-well plates at
3,000 cells per well. Upon cells reaching the logarithmic growth
phase, siRNA transfected experiment was performed. For the 3-HAA
group, the medium was replaced with one containing 100 µM
3-HAA (24). CCK-8 reagent was
added at 0, 24, 48, 72 and 96 h post-transfection and incubated at
37°C for 2 h. Absorbance at 450 nm was measured using a
multifunctional enzyme-linked immunosorbent assay instrument.
EdU staining experiment
Cell proliferation was assessed using the EdU assay
kit (Guangzhou RiboBio Co., Ltd.). Cells were seeded in a 96-well
plate at 3,000 cells per well and treated as described. After 24 h,
cells were transferred to confocal dishes. After 48 h, 200
µl of 50 µM EdU was added and incubated at 37°C for 2
h in the dark. Cells were then treated sequentially with glycine (2
mg/ml, room temperature, 5 min), Triton X-100 (0.5%, room
temperature, 10 min), Apollo (30 min, room temperature, in the
dark) and Hoechst 33342 staining for 30 min (room temperature, in
the dark).
Clonal formation assay
Cells were seeded in a 6-well plate at 500 cells per
well. When visible colonies appeared after 10-14 days, cells were
fixed with 4% paraformaldehyde at room temperature for 15 min, then
stained with 0.1% crystal violet at room temperature for 30 min.
Colonies were defined as cell clusters containing ≥50 cells. Plates
were rinsed, inverted and colonies were photographed and
counted.
Scratch and transwell tests
The HCC cell lines MHCC-97H and HCCLM3 were cultured
for 24 h to 80% confluence, then scratched with a 200 µl
pipette tip. For siKMO groups, cells were transfected with siKMO
RNA or siControl RNA (20 nM) and cultured at 37°C. After 6 h of
transfection, the complete medium was replaced and the culture
medium was replaced with fresh medium containing 1% FBS after 24 h
of transfection. For KMO overexpression groups, the cells with
stable overexpression of KMO and the EV control group were directly
scratched after 24 h of culture and then cultured in 1% FBS medium.
The wound closure was imaged at 0 and 48 h after scratch and ImageJ
software (version 1.53a, National Institutes of Health) was used to
quantify the migration distance. For other cells to be tested by
Transwell, transfection was performed followed by 24 h of culture.
A 24-well plate was prepared with 700 µl of complete medium
per well. 200 µl of serum-starved cell suspension (KMO
knockdown, KMO overexpression, or corresponding control cells) was
added to each well and cultured for 48 h. Non-migrated cells on the
upper layer of the chamber membrane were removed with a cotton swab
and cells on the lower surface were fixed with methanol at room
temperature for 10 min, then stained with crystal violet at room
temperature for 20 min and counted under a light microscope.
Flow cytometry analysis of apoptosis
Following the instructions for the Annexin V-FITC
apoptosis detection kit (Bestbio Technology Co., Ltd.), cells were
washed twice with pre-cooled PBS to obtain cell pellets, then
re-suspended in binding buffer. Cells were stained with 5 µl
Annexin V-FITC at 4°C for 15 min, followed by 10 µl
propidium iodide dye for 10 min at 4°C in the dark. Samples were
immediately detected using flow cytometry (FACSCelesta; BD
Biosciences). And the apoptotic rate of HCC cells (the sum of the
percentages of early + late apoptotic cells) was analyzed using
FlowJo 7.6 software (BD Biosciences).
MitoTracker staining
Mitochondrial biogenesis was detected by using
MitoTracker staining method. Cells were seeded in confocal dishes
at 1,000 cells/dish. At 48 h after siKMO transfection or 100
µM 3-HAA treatment, cells were stained with MitoTracker (200
nM) for 25 min at 37°C in the dark. After washing twice with DMEM,
cells were imaged by confocal microscopy at a magnification of
×100. The total mitochondrial fluorescence intensity was quantified
using ImageJ (version 1.53a, National Institutes of Health).
High performance liquid chromatography
(HPLC) combined with mass spectrometry (MS)
Targeted Try metabolism analysis was performed by
Shanghai Zhongke New Life Biotechnology Co. Ltd.
Sample preparation
Cells were harvested, washed three times with PBS
and scraped with 1 ml precooled methanol/acetonitrile/water (2:2:1,
v/v). Samples were collected, labeled, sealed and stored at -80°C
until analysis.
Chromatographic conditions
Samples were analyzed on an Agilent 1290 UHPLC
system (Agilent Technologies, Inc.) with a 4°C autosampler and
column oven at 40°C. Mobile phases: A (20 mM ammonium formate +
0.2% formic acid in water), B (0.2% formic acid in methanol). Flow
rate: 400 µl/min; injection volume: 5 µl. Gradient
elution: 0-2 min, 10% B; 2-9 min, 10 to 100% B; 9-11 min, 100% B;
11-11.5 min, 100 to 10% B; 11.5-14 min, 10% B.
Mass spectrometry conditions
Analysis was performed on a 5500 QTRAP mass
spectrometer (SCIEX) used in positive/ negative ion mode. Source
temp: 450°C; Gas1/Gas2: 45; CUR: 40; ISVF: ±4,500 V. Multiple
reaction monitoring was used for detection.
MtDNA copy number detection
Cells were seeded in a 6-well plate at a density of
approximately 3×10⁵ cells per well. For KMO knockdown
groups, after 24 h of culture, the cells were transfected with
siKMO small interfering RNA or siControl RNA using
Lipo8000® transfection reagent (Beyotime Biotechnology).
For the siKMO + 3-HAA treated groups, upon reaching 70-80%
confluence, the medium was changed to 2 ml culture medium
containing 100 µM 3-HAA or an equivalent volume of DMSO
(control). The cells were then transfected with siKMO small
interfering RNA. At 48 h after transfection, cell DNA was extracted
using a DNA extraction kit (Tiangen Biotech Co., Ltd.) according to
the manufacturer's protocol. For KMO overexpression groups, DNA was
extracted after 48 h of culture. mtDNA copy number was detected by
qPCR using primers specific for the mitochondrial gene ND1 and HGB
was used as reference gene.
Cellular ATP level measurement
Cells were lysed using ATP detection lysate, then
centrifuged at 12,000 × g, for 5 min at 4°C. The supernatant was
collected as the test sample. An ATP standard curve was generated
by diluting the ATP standard solution (10 µM) to
concentrations ranging from 0.01-10 µM. The ATP detection
working solution was prepared at a 1:9 ratio of reagent to diluent.
Working solution (100 µl) was added to 96-well black plate
and incubated at room temperature for 5 min. Subsequently, 20
µl of sample or standard was added to each well, mixed and
the relative light unit value was measured after 2 sec. ATP
concentration was calculated using the standard curve.
Intercellular reactive oxygen species
(ROS) level detection
Cells were collected in a 5 ml centrifuge tube. The
ROS fluorescent probe (Bestbio Technology Co., Ltd.),
2,7-dichlorofluorescein acetate DCFH-DA, was prepared at a final
concentration of 10 µM (diluted 1:1,000 in serum-free DMEM).
500 µl of the DCFH-DA working solution was added to each
tube and the mixture was incubated at 37°C for 20 min in the dark.
The unbound DCFH-DA probe was removed by washing with serum-free
medium. Cells were re-suspended in DMEM and then analyzed by flow
cytometry (FACSCelesta, BD Biosciences) with excitation at 488 nm
(25). The results were analyzed
using FlowJo 7.6 software (BD Biosciences).
Statistical analysis
Statistical analyses were performed using R (version
4.2.2, http://www.R-project.org/), GraphPad
Prism (version 8.0; Dotmatics) and SPSS (version 25; IBM Corp.).
All experiments were performed three times independently. The data
were presented as the mean ± SD. The unpaired Student's t-test was
employed for comparisons between two groups with normally
distributed continuous variables, while Mann-Whitney U test was
used for non-normally distributed data. One-way ANOVA with Tukey's
post hoc test was used for comparisons among three groups.
Correlations between continuous variables were assessed using
Spearman's rank correlation analysis. Categorical variables were
compared between groups using the χ2 test. P<0.05 was
considered to indicate a statistically significant difference.
Results
Downregulation of KMO expression is
related to the poor prognosis in HCC
Analysis of GSE101728, GSE45050, GSE84598 and
GSE121248 datasets identified 31 upregulated and 109 downregulated
genes commonly associated with HCC (Fig. S1A-C). Intersection with
mitochondrial-related genes yielded one upregulated and 14
downregulated MRDEGs (Fig. S1D).
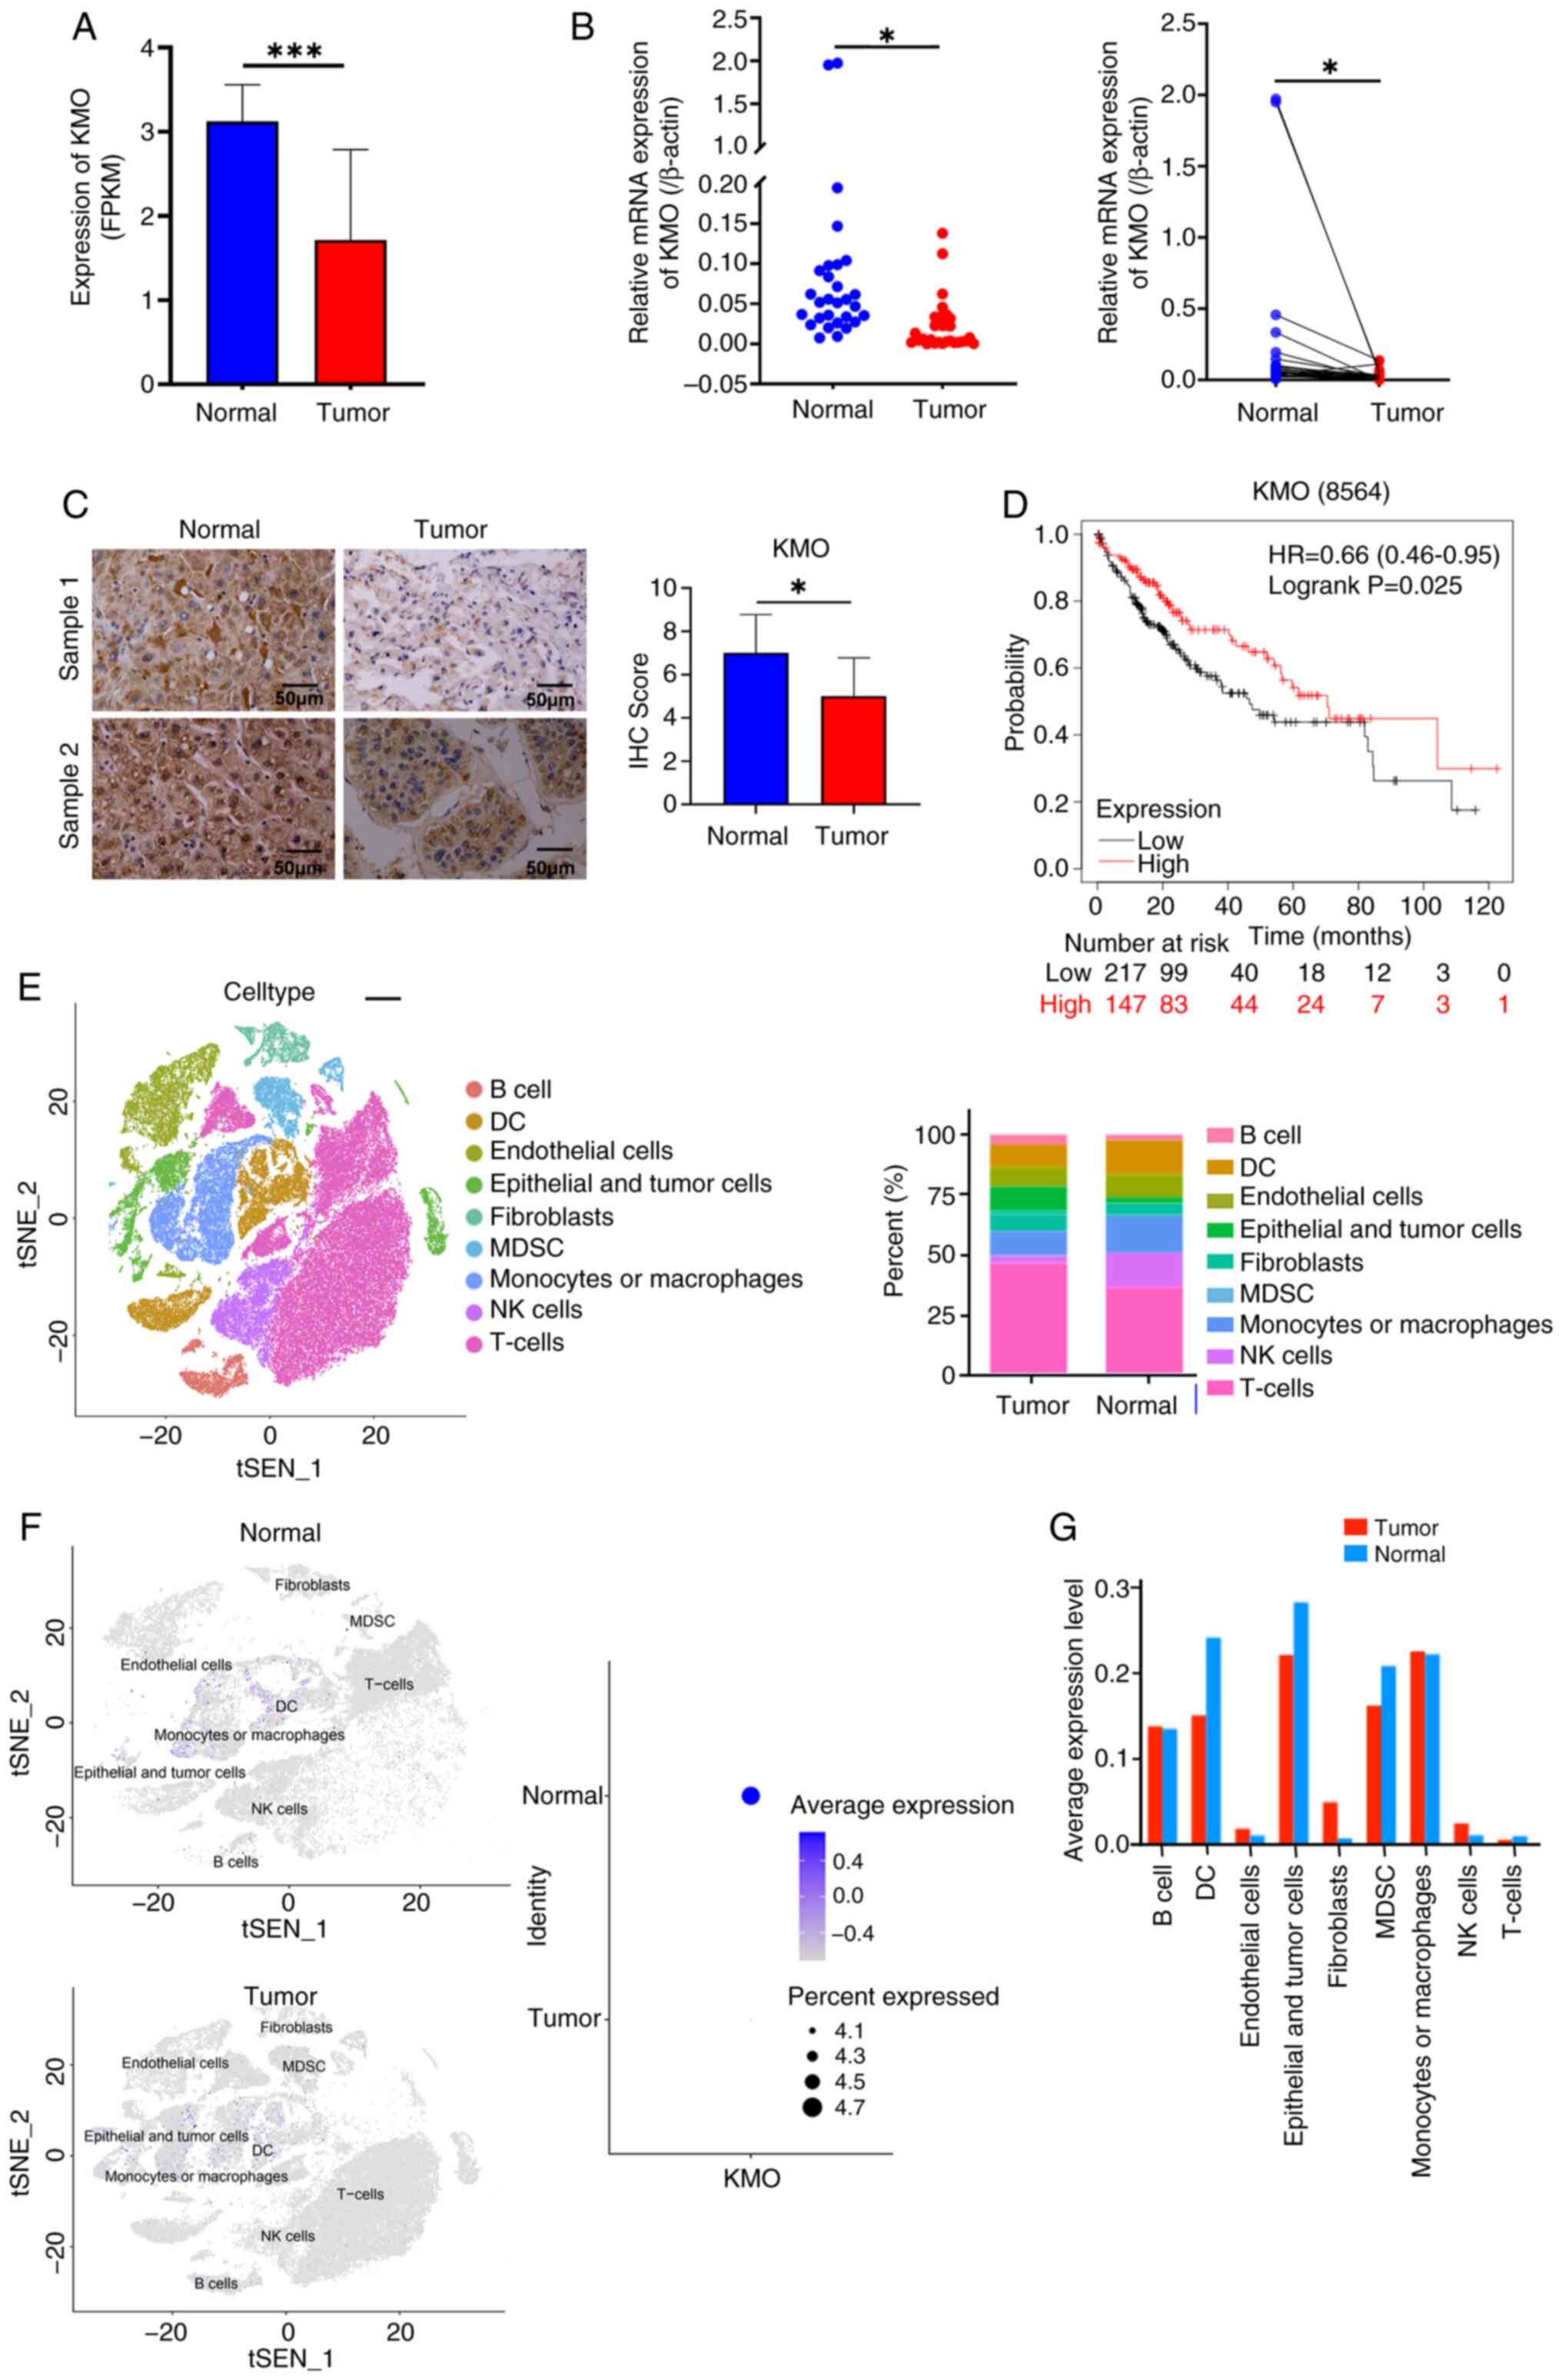
Notably, KMO expression was consistently downregulated across all
four datasets (LogFC ranging from -2.094 to -3.453; Fig. S1E). The finding was validated in
TCGA data which demonstrated significantly lower KMO expression in
HCC patients compared to normal individuals (Fig. 1A). qPCR and immunohistochemical
results both showed that compared with matched adjacent normal
tissues, the expression of KMO in HCC tumor tissues decreased
(Fig. 1B and C). The present
study grouped HCC tumor samples from TCGA database according to KMO
median expression value, including 183 samples in KMO high
expression group and 182 samples in KMO low expression group.
Association analysis between KMO and clinicopathological features
of HCC patients in TCGA database are shown in Table II. The results showed that KMO
expression was related to Grade, T stage and tumor stage.
Kaplan-Meier survival analysis demonstrated that the overall
survival time of HCC patients with low KMO expression was
significantly shorter than those with high expression (Fig. 1D).
| Table IIRelationship between KMO expression
level and clinicopathological characteristics of patients with HCC
in TCGA. |
Table II
Relationship between KMO expression
level and clinicopathological characteristics of patients with HCC
in TCGA.
| Variable | KMO Expression
| P-value |
|---|
| Low (n=182) | High (n=183) |
|---|
| Age | | | 0.716 |
| ≤60 | 88 | 85 | |
| >60 | 94 | 98 | |
| Sex | | | 0.765 |
| Male | 124 | 122 | |
| Female | 58 | 61 | |
| Child Pugh
classification grade | | | 0.252 |
| Grade A | 100 | 116 | |
| Grade B and C | 13 | 9 | |
| N/A | 69 | 58 | |
| Grade | | | <0.001 |
| Grade1-2 | 97 | 133 | |
| Grade3-4 | 82 | 48 | |
| N/A | 3 | 2 | |
| M | | | 0.937 |
| M0 | 138 | 125 | |
| M1 | 1 | 2 | |
| MX | 43 | 56 | |
| N | | | 1.000 |
| N0 | 124 | 125 | |
| N1 | 2 | 2 | |
| NX | 56 | 56 | |
| T | | | 0.004 |
| T1-2 | 123 | 148 | |
| T3-4 | 57 | 34 | |
| TX | 2 | 1 | |
| Stage | | | 0.004 |
| Stage I-II | 113 | 142 | |
| Stage III-IV | 54 | 33 | |
| N/A | 15 | 8 | |
| Survival
status | | | 0.559 |
| Alive | 114 | 120 | |
| Dead | 68 | 63 | |
The present study also analyzed the KMO expression
within the HCC tumor microenvironment using single cell sequencing
data. Analysis of 85,168 cells (28,998 genes) identified 10 cell
types. Compared with normal tissues, HCC samples exhibited
increased proportions of T cells, fibroblasts, epithelial and tumor
cells, with decreases in endothelial cells, dendritic cell (DC),
myeloid suppressor cell (MDSC) and natural killer cells (Fig. 1E). The expression of KMO in HCC
was lower in HCC compared with that in normal (Fig. 1F) and was specifically reduced in
DC, epithelial and tumor cells and MDSC (Fig. 1G), suggesting KMO may play
important roles in these cells.
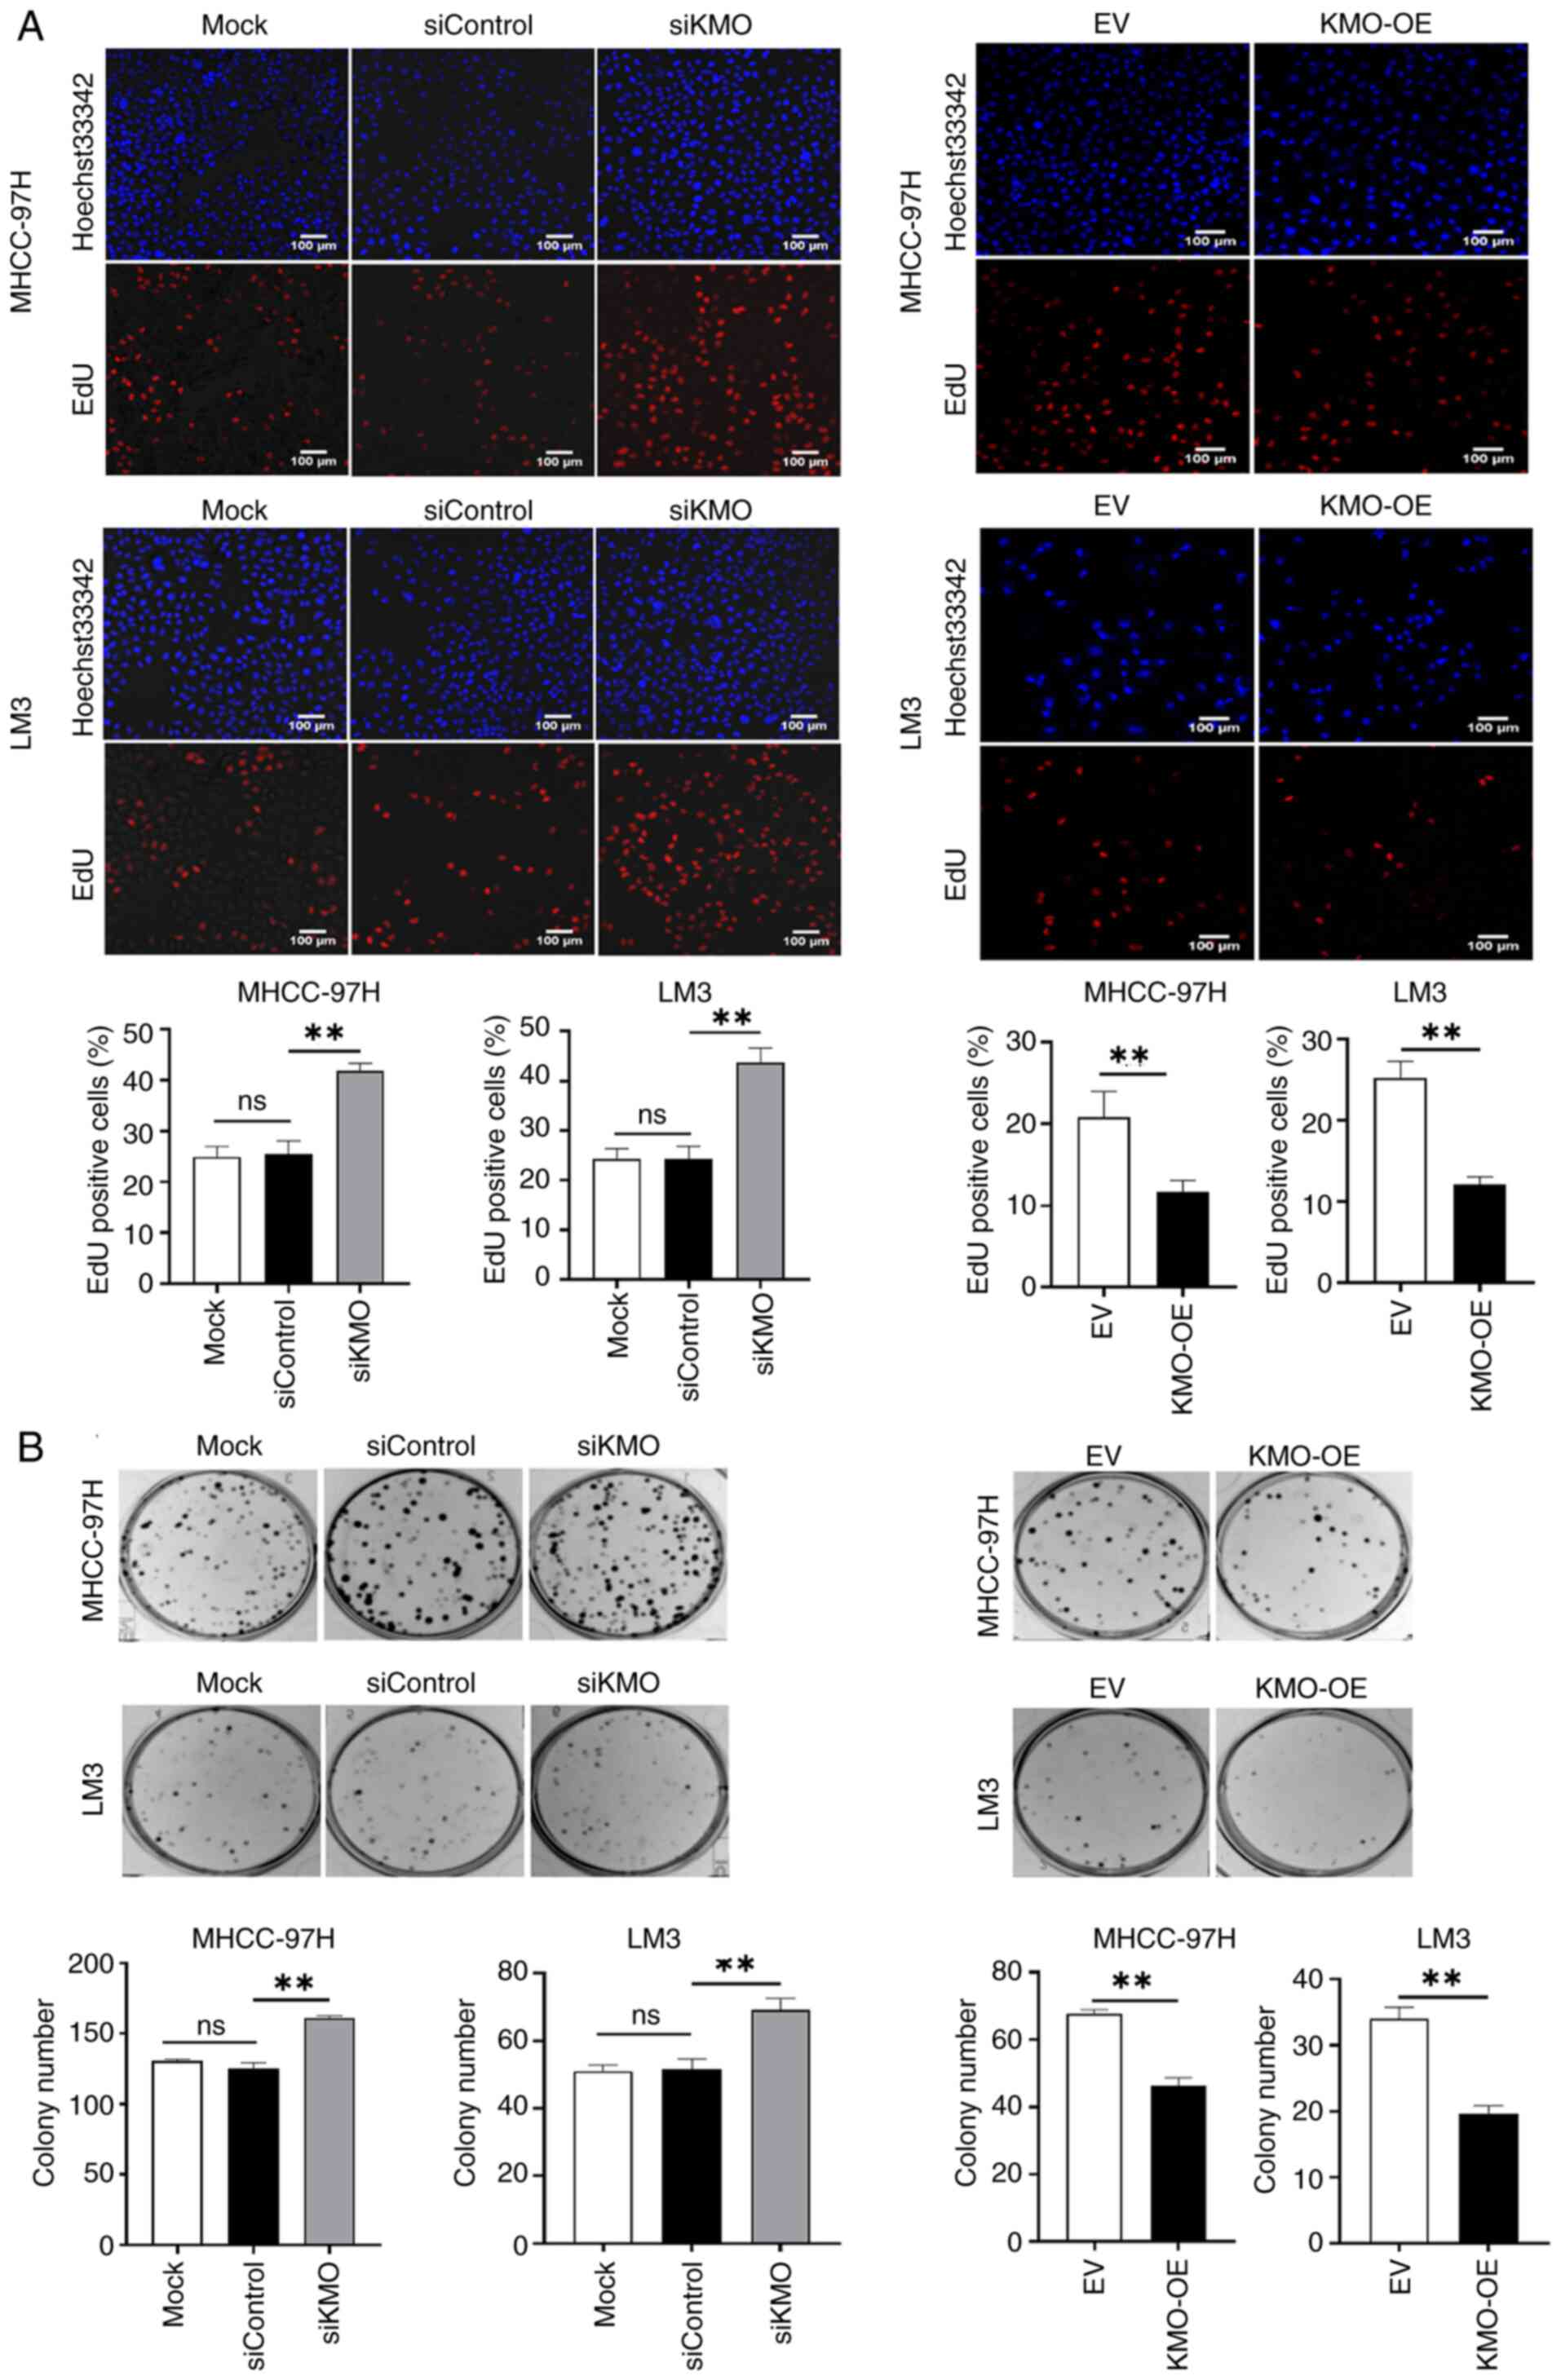
Downregulation of KMO in HCC cells
promotes malignant progression of tumor
Using KMO knockdown and overexpression HCC cell
models (Fig. S2), the present
study evaluated the role of KMO in tumor progression. The CCK-8
test, EdU assay and colony formation experiment revealed that,
compared with siControl group, the cell viability, cell
proliferation and cell clone formation in siKMO group were
increased significantly. Conversely, compared with empty vector
(EV) control group, the cell viability, cell proliferation and cell
clone formation in KMO-OE group were significantly decreased
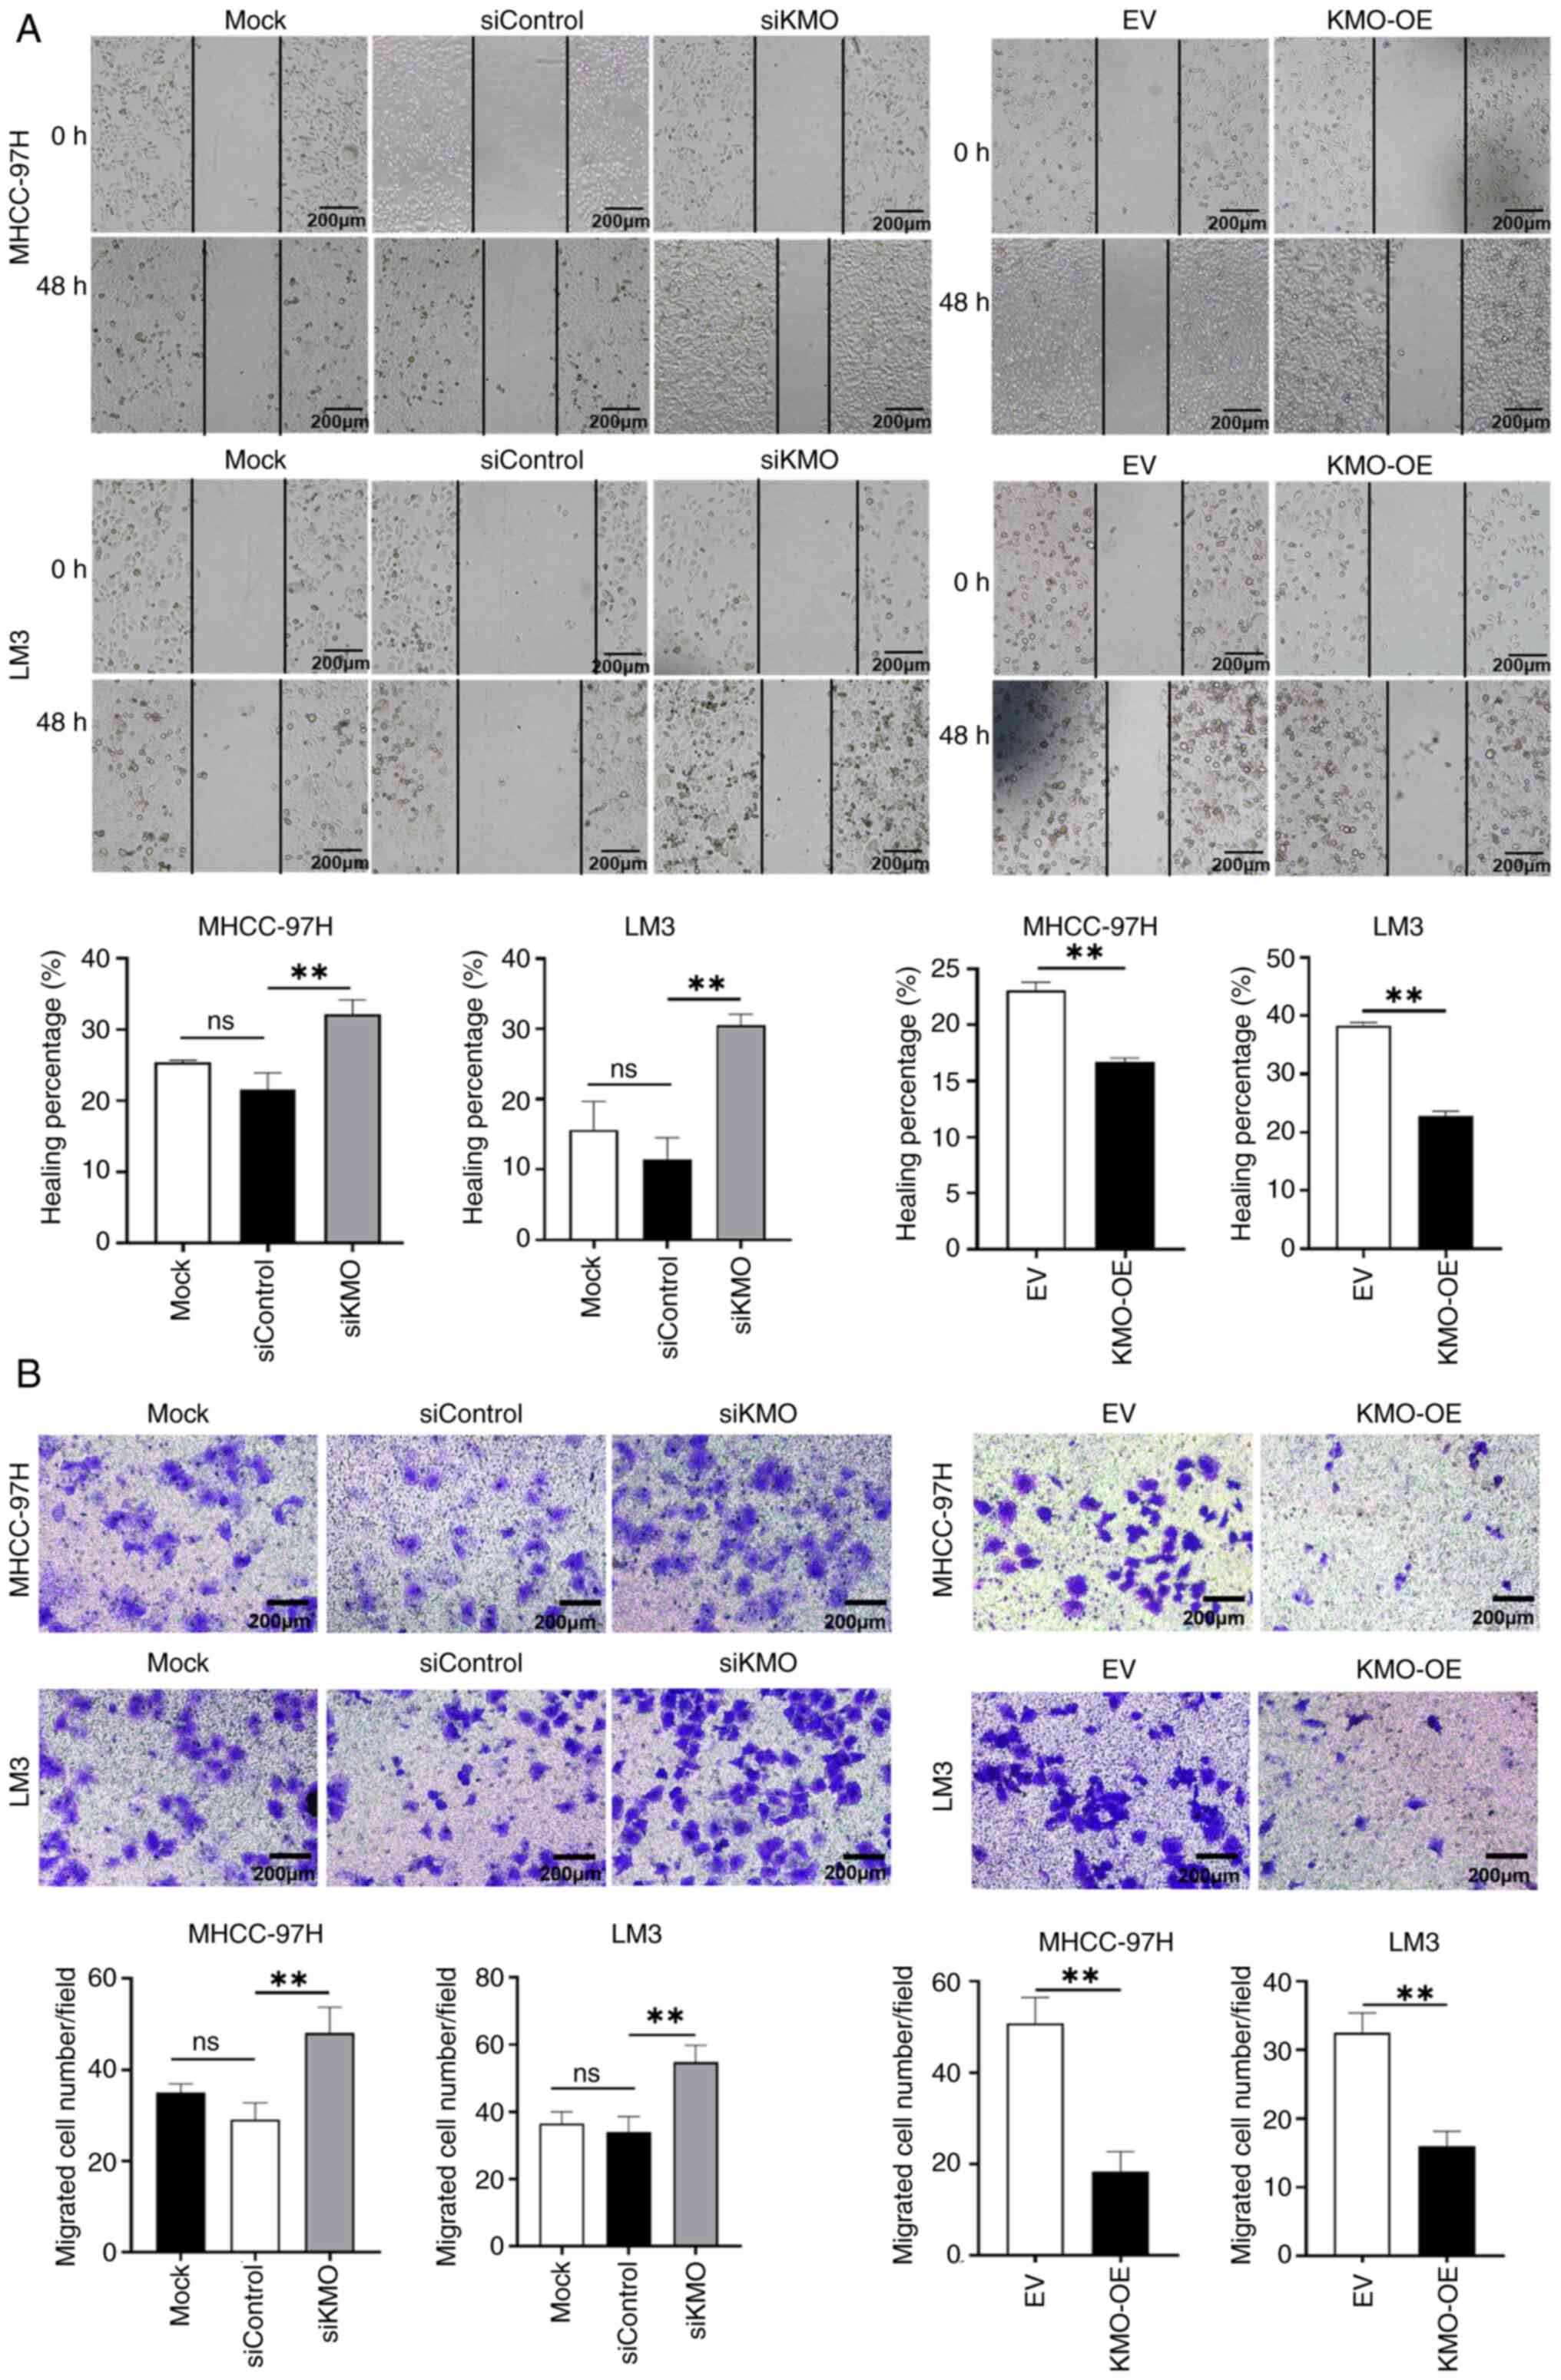
(Fig. 2). The scratch and
Transwell assays demonstrated that cell migration ability in siKMO
group were increased significantly, whereas the opposite effect was
observed in KMO-OE group (Fig.
3). Flow cytometry analysis of cell apoptosis indicated that
the apoptosis rate was increased in KMO-OE group compared with that
in EV control group (Fig.
S3).
Collectively, these results suggested that
downregulation of KMO in HCC cells is associated with enhanced
malignant progression.
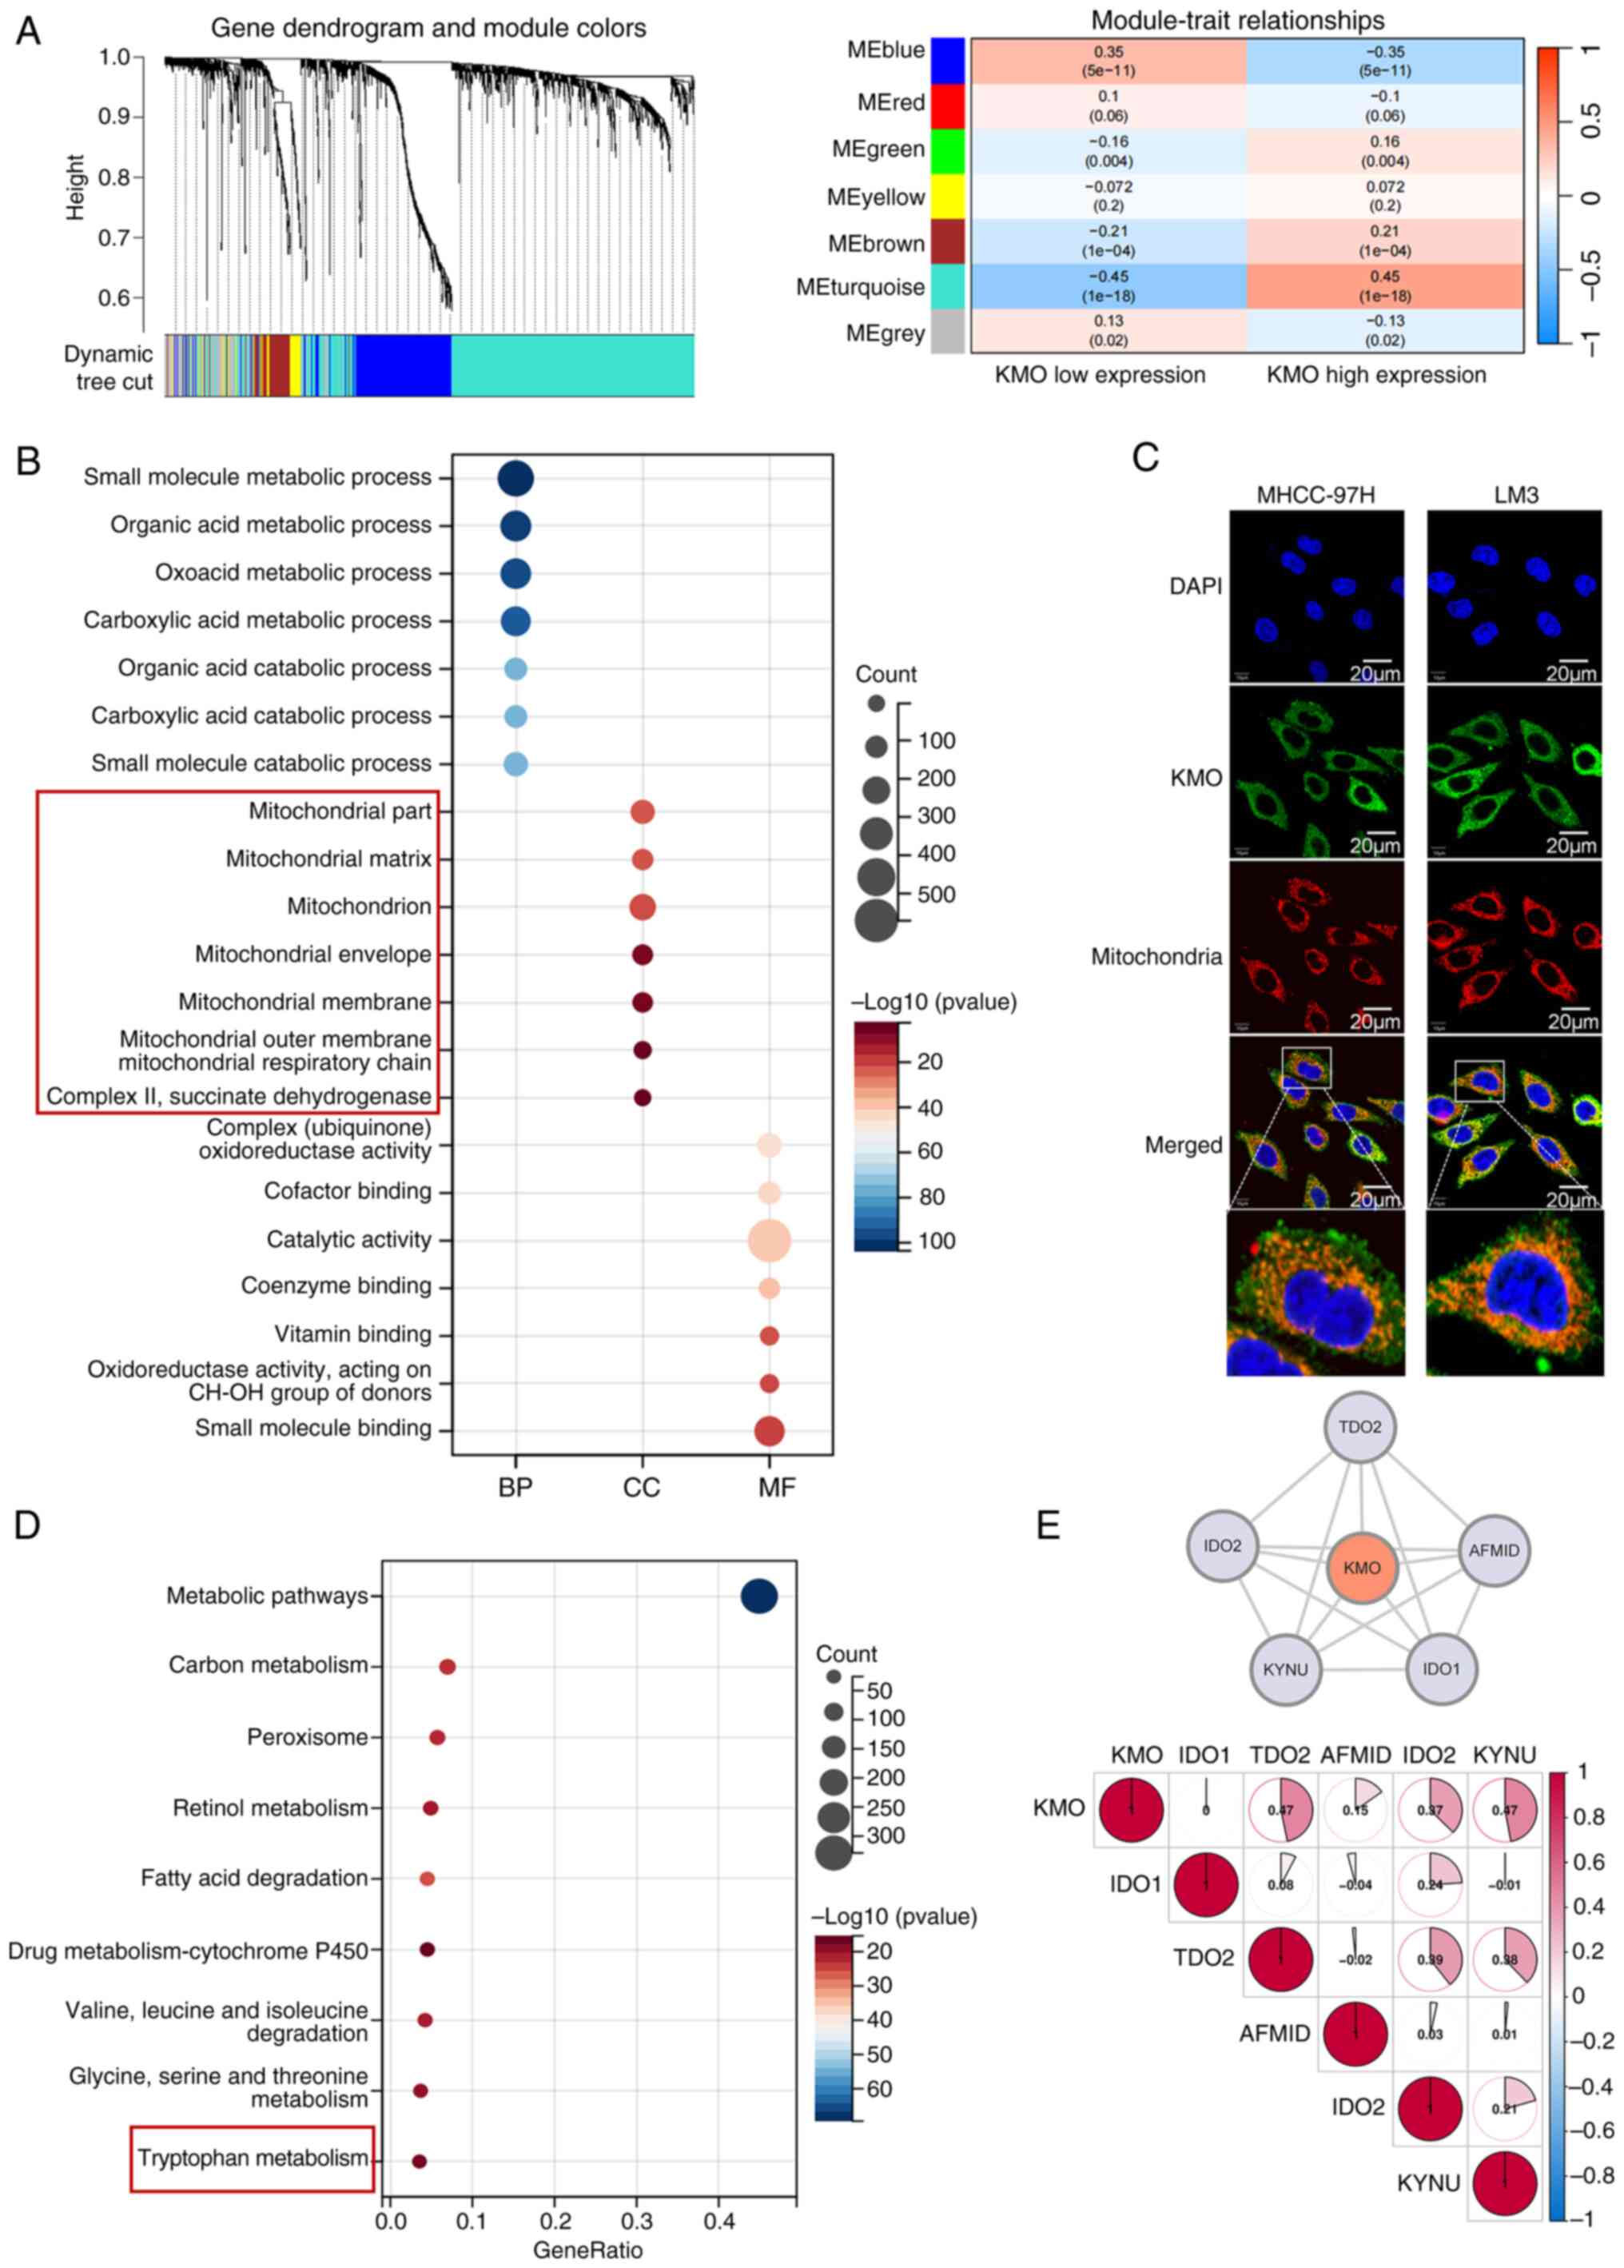
KMO may localize to mitochondria and is
associated with Try-kyn metabolism
WGCNA showed MEturquoise module was correlated with
KMO expression with a biggest correlation coefficient (0.45) and
designating it as a key gene module that may be co-expressed with
KMO (Fig. 4A). A total of 1,433
genes in MEturquoise module were extracted for gene function
enrichment analysis. GO enrichment analysis showed in biological
processing, KMO co-expressed related genes participated in
metabolic related pathways; in terms of cell components, KMO
co-expression related genes are closely related to mitochondria; In
terms of molecular function, KMO co-expression related genes may
affect oxidoreductase activity, cofactor and coenzyme binding
(Fig. 4B). These findings suggest
KMO's potential role in many metabolic processes and its close
association with mitochondrial structure and function, which was
further supported by immunofluorescence experiments confirming the
co-localization of KMO with mitochondria in HCC cells (Fig. 4C). KEGG enrichment results
indicated that KMO co-expression related genes were related to Try
metabolism (Fig. 4D). A PPI
network constructed by six key genes of Try metabolic pathway from
GSEA official website showed that KMO had direct interaction with
IDO1, TDO2, IDO2, arylformamidase (AFMID), TDO2 and kynureninase
(KYNU) with the correlation coefficients were 0, 0.47, 0.15, 0.37
and 0.47 respectively (Fig. 4E).
These results suggest that KMO may reside in mitochondria and
functionally interacts with other genes to influence the Try
metabolic pathway.
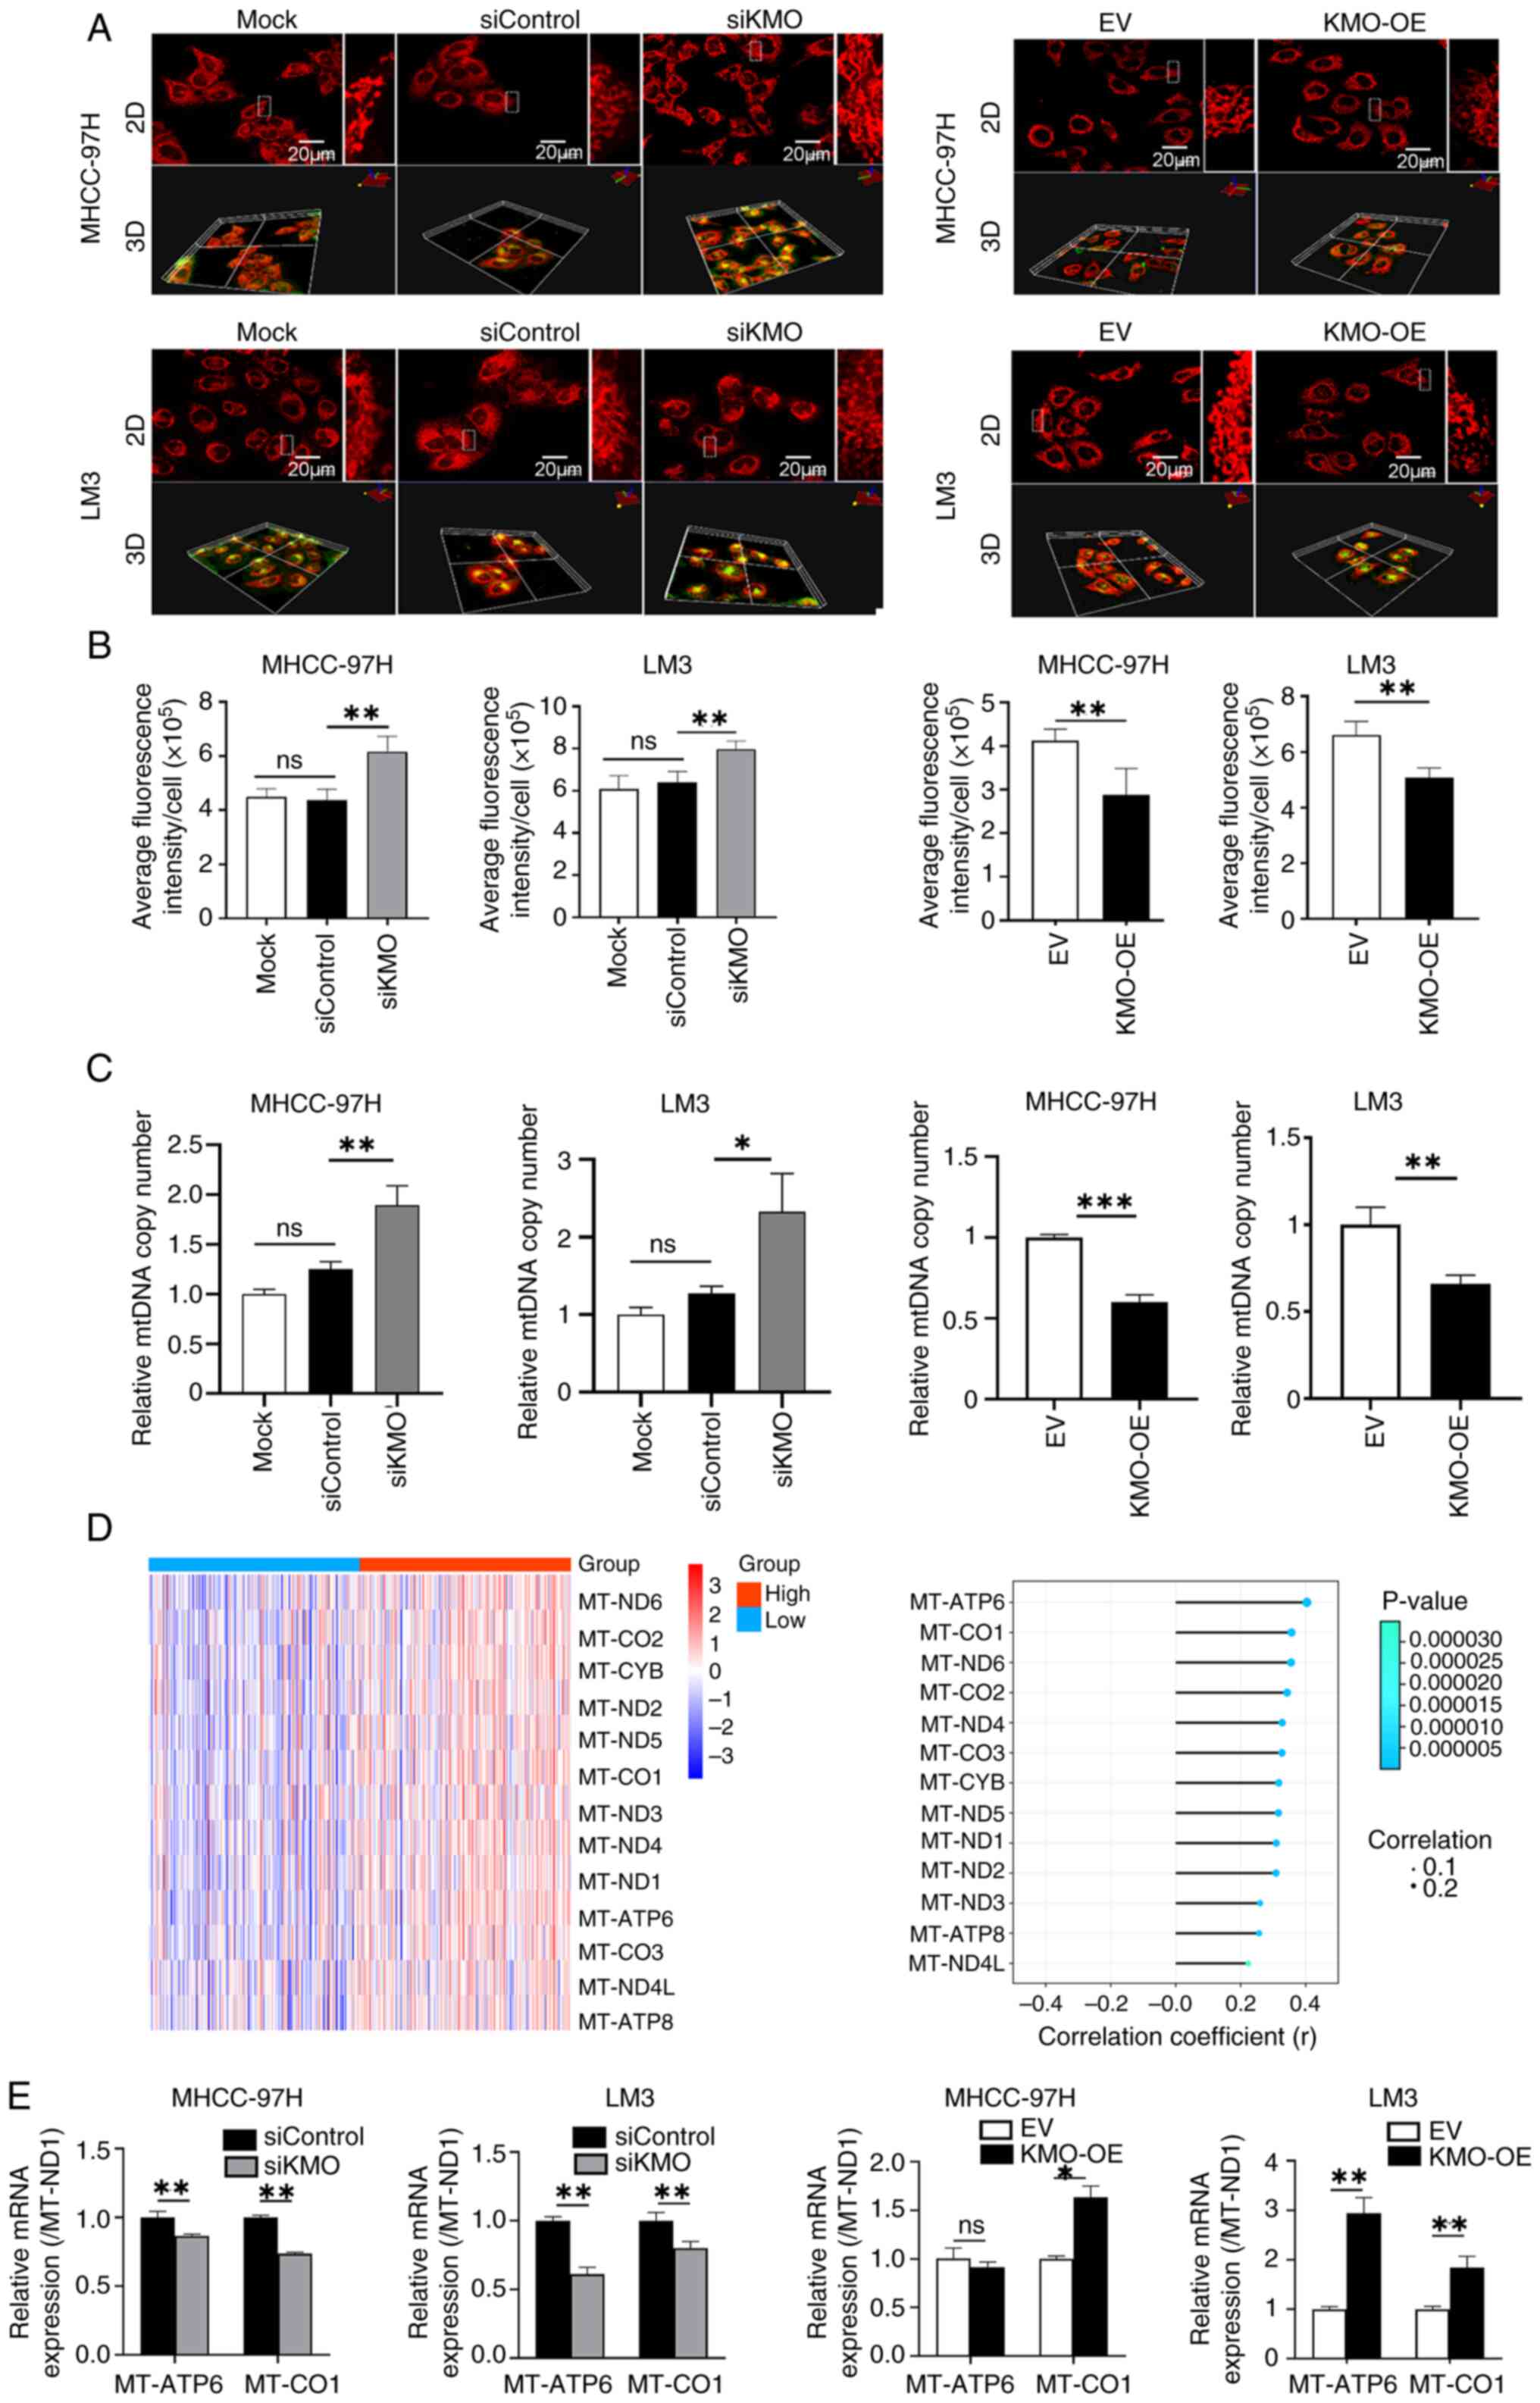
KMO downregulation increases
mitochondrial mass
Mitochondrial dysfunction is closely related to
mitochondrial metabolic disorder and the occurrence and progression
of HCC. Mito-Tracker staining was used to detect mitochondrial
biogenesis and the 3D image statistical results showed that in
MHCC-97H cells and LM3 cells, the mitochondrial mass in siKMO group
was increased compared with that in siControl group. Conversely,
KMO overexpression reduced mitochondrial mass relative to the EV
control group (Fig. 5A and B).
The present study detected the copy number of mtDNA coding gene ND1
to further verify whether KMO is related to mitochondrial
biogenesis. The results showed that compared with siControl group,
the ND1 copy number in siKMO group was increased significantly.
Compared with EV group, ND1 copy number in KMO-OE group was
decreased (Fig. 5C).
In addition, analysis of transcriptomic data
revealed that all 13 genes encoded by the mitochondrial genome were
upregulated in high-KMO expression patient samples and were
positively correlated with KMO expression (Fig. 5D). Then the expression of two
genes with the strongest correlation with KMO, MT-ATP6 and MT-CO1
was validated by using qPCR in KMO knockdown and overexpression HCC
cells (Fig. 5E).
These results indicated that the downregulation of
KMO in HCC cells promoted mitochondrial biogenesis. The
uncoordinated changes in mitochondrial DNA copy number and
mitochondrial gene expression suggested that KMO dysregulation can
lead to imbalances in mitochondrial mass and function.
KMO downregulation promotes HCC cells
proliferation and mitochondrial alterations by reducing 3-HAA
production
In order to investigate how KMO influences Try
metabolism, HPLC-MS methods were used to test the content of Try
metabolites in HCC LM3 cells overexpressing KMO. Fig. S4 showed the total ion flow mass
spectrometry of HCC cells. Among the total 16 metabolites detected,
3-HAA was the only one significantly elevated in HCC cells
overexpressing KMO (Figs. S5 and 6A
and B). Next, the expression of kynureninase (KYNU), the enzyme
immediately downstream of KMO that catalyzes the conversion of
3-hydroxykynurenine (3-HK) to 3-HAA was detected. No statistical
significance was found in siKMO or KMO-OE group compared with their
control groups (Fig. 6C),
suggesting the changes in 3-HAA levels was directly mediated by KMO
and independent of KYNU.
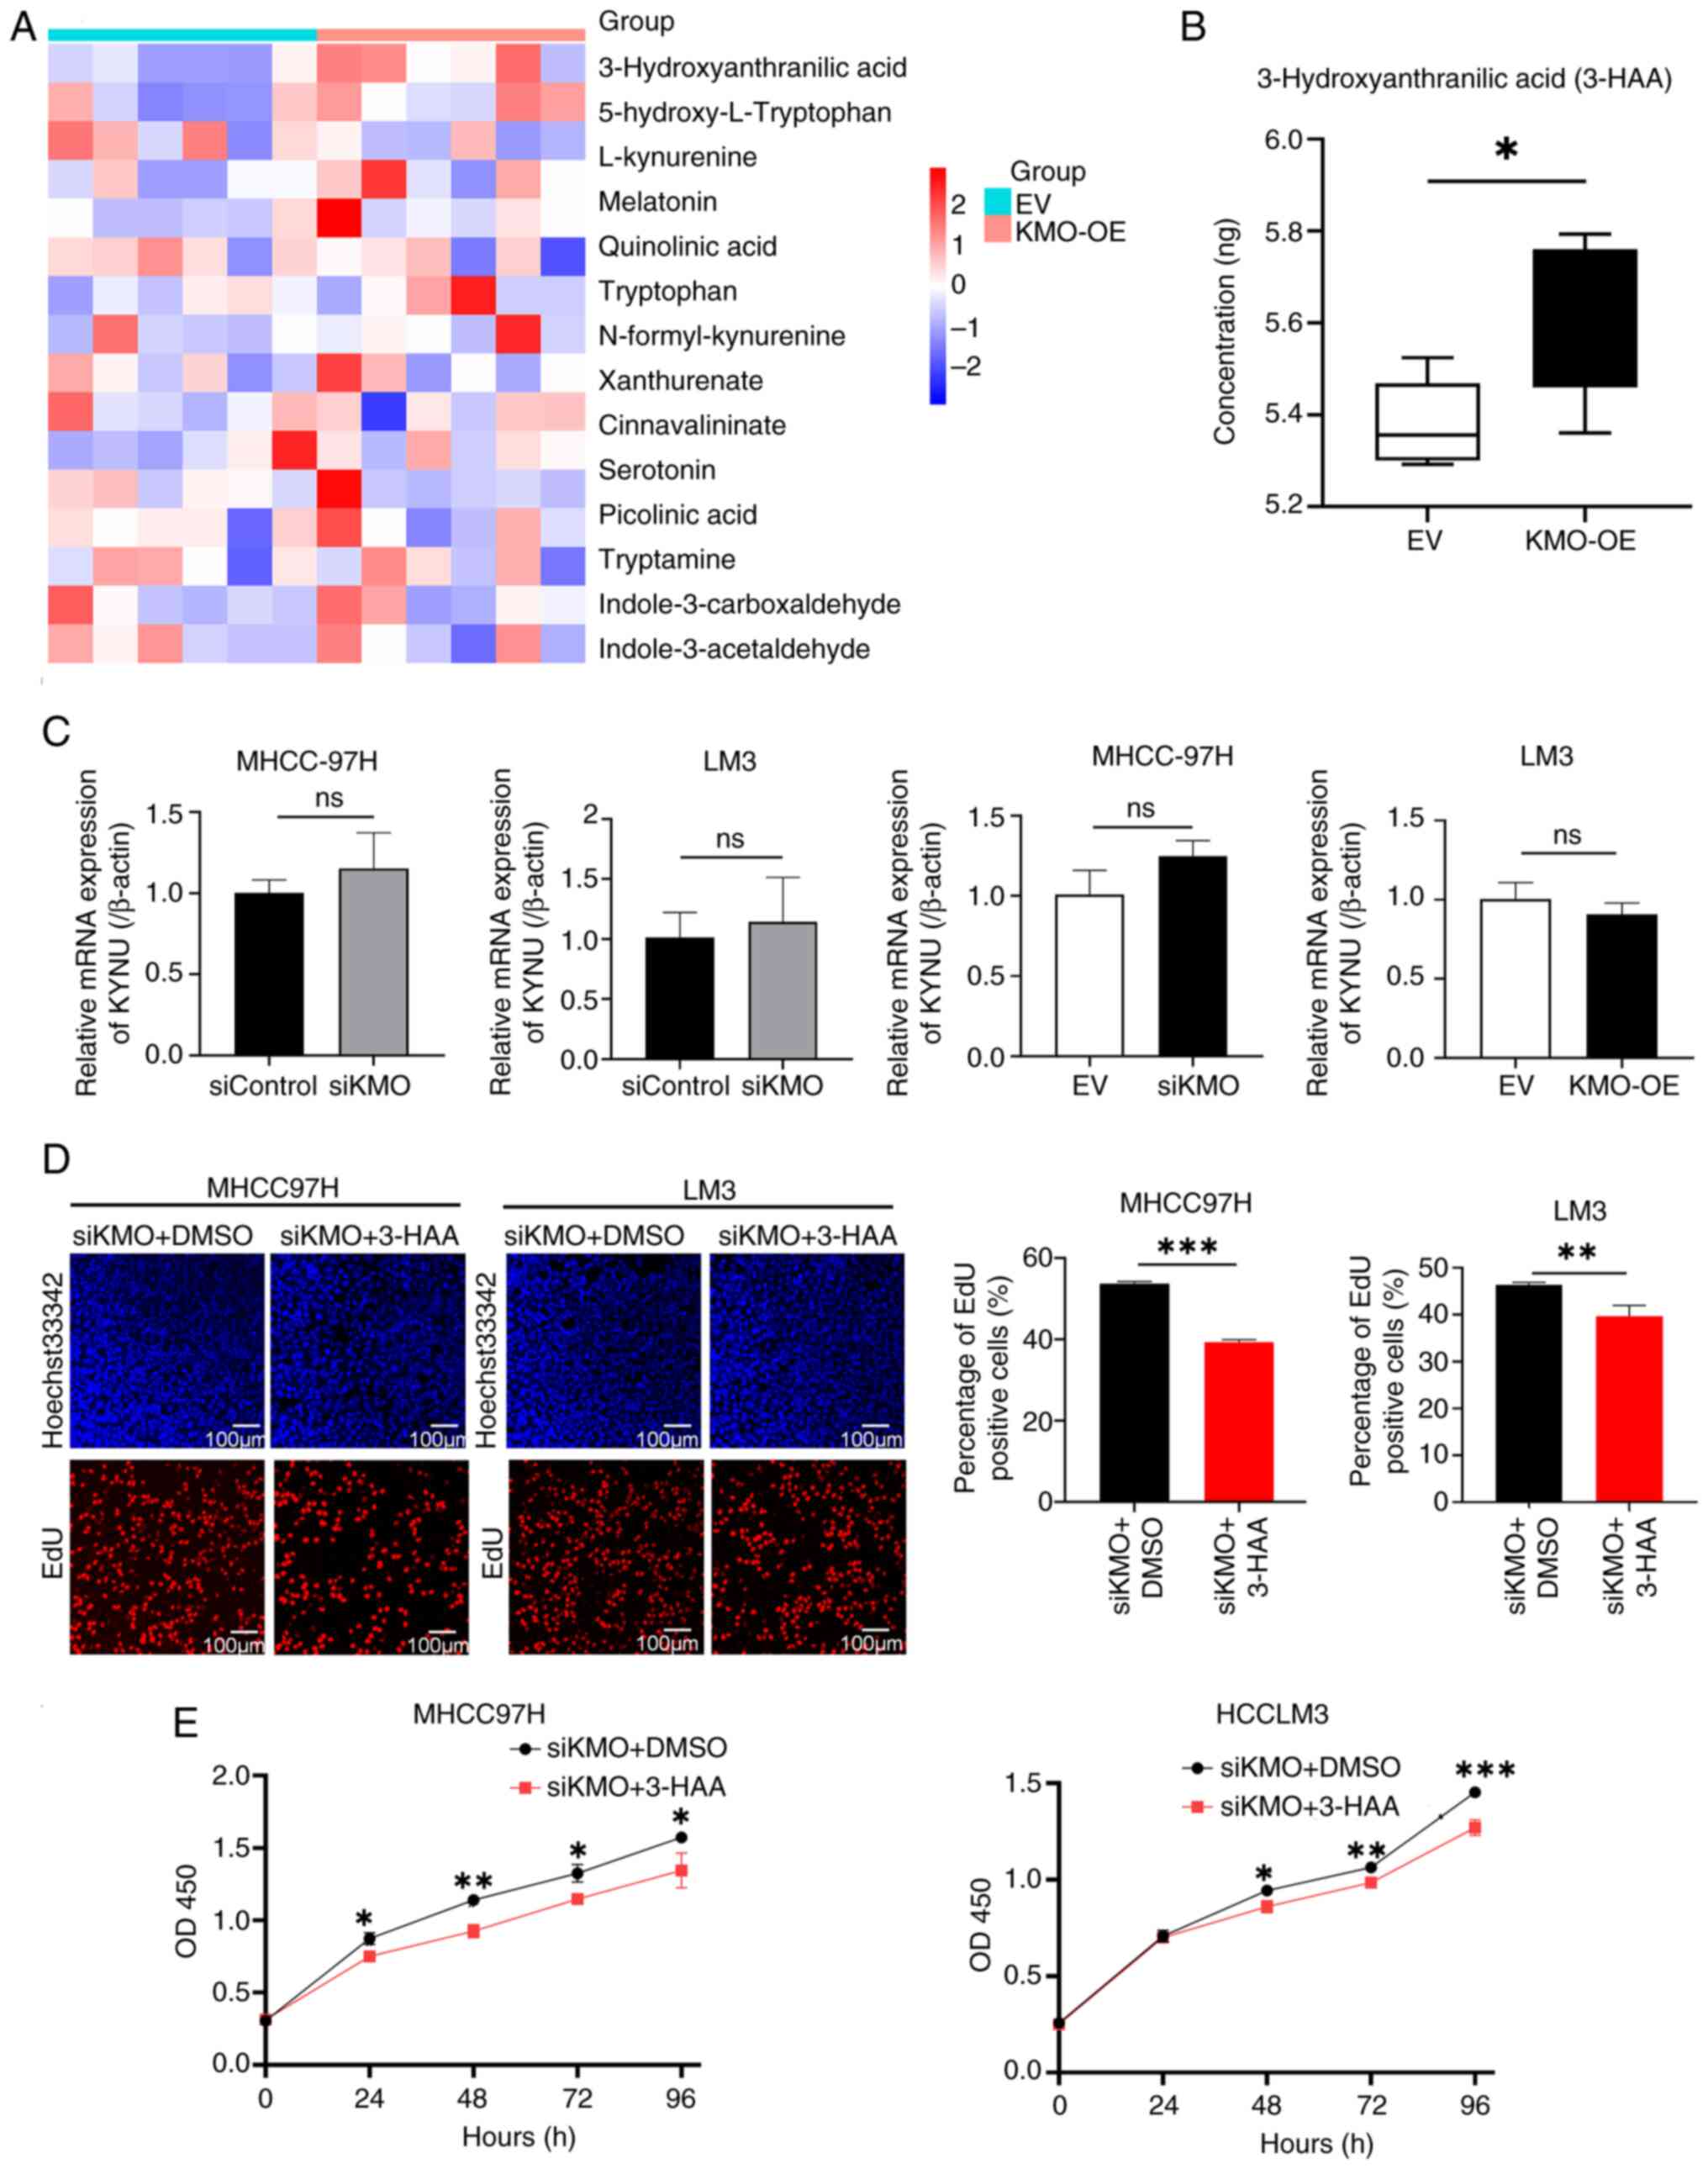 | Figure 6Downregulation of KMO induced the
decrease of 3-HAA level promotes HCC cells proliferation. (A)
Heatmap showed tryptophan metabolites levels in KMO overexpression
and control HCC cell groups. (B) Comparison of 3-HAA levels between
KMO overexpression group and control group. (C) mRNA expression of
KYNU in KMO knockdown and overexpression HCC cells by using reverse
transcription-quantitative PCR. (D) Effect of 3-HAA on cell
proliferation in KMO knockdown HCC cells by using EdU detection.
EdU labeled newly proliferated cells (red) and Hoechst33342 labeled
cell nucleus (blue). Positive cells rate (red/blue) were counted
and compared between KMO-knockdown cells treated with DMSO
(control) and KMO-knockdown cells treated with 3-HAA groups. Scale
bar, 100 µm. (E) Effect of 3-HAA on cell viability in KMO
knockdown HCC cells by using CCK8 test on 0, 24, 48, 72 and 96 h.
The cell proliferation rates of KMO knockdown cells treated with
3-HAA or DMSO at the same time were compared. Final working
concentration of 3-HAA: 100 µM. *P<0.05,
**P<0.01, ***P<0.001, ns, P>0.05.
KMO, kynurenine 3-monooxygenase; 3-HAA, 3-hydroxyanthranilic acid;
KYNU, kynureninase. |
The present study further explored whether KMO
downregulation induced cell proliferation is caused by 3-HAA. In
siKMO HCC cells, 3-HAA can reverse the increased cell proliferation
and vitality caused by KMO knockdown (Fig. 6D and E).
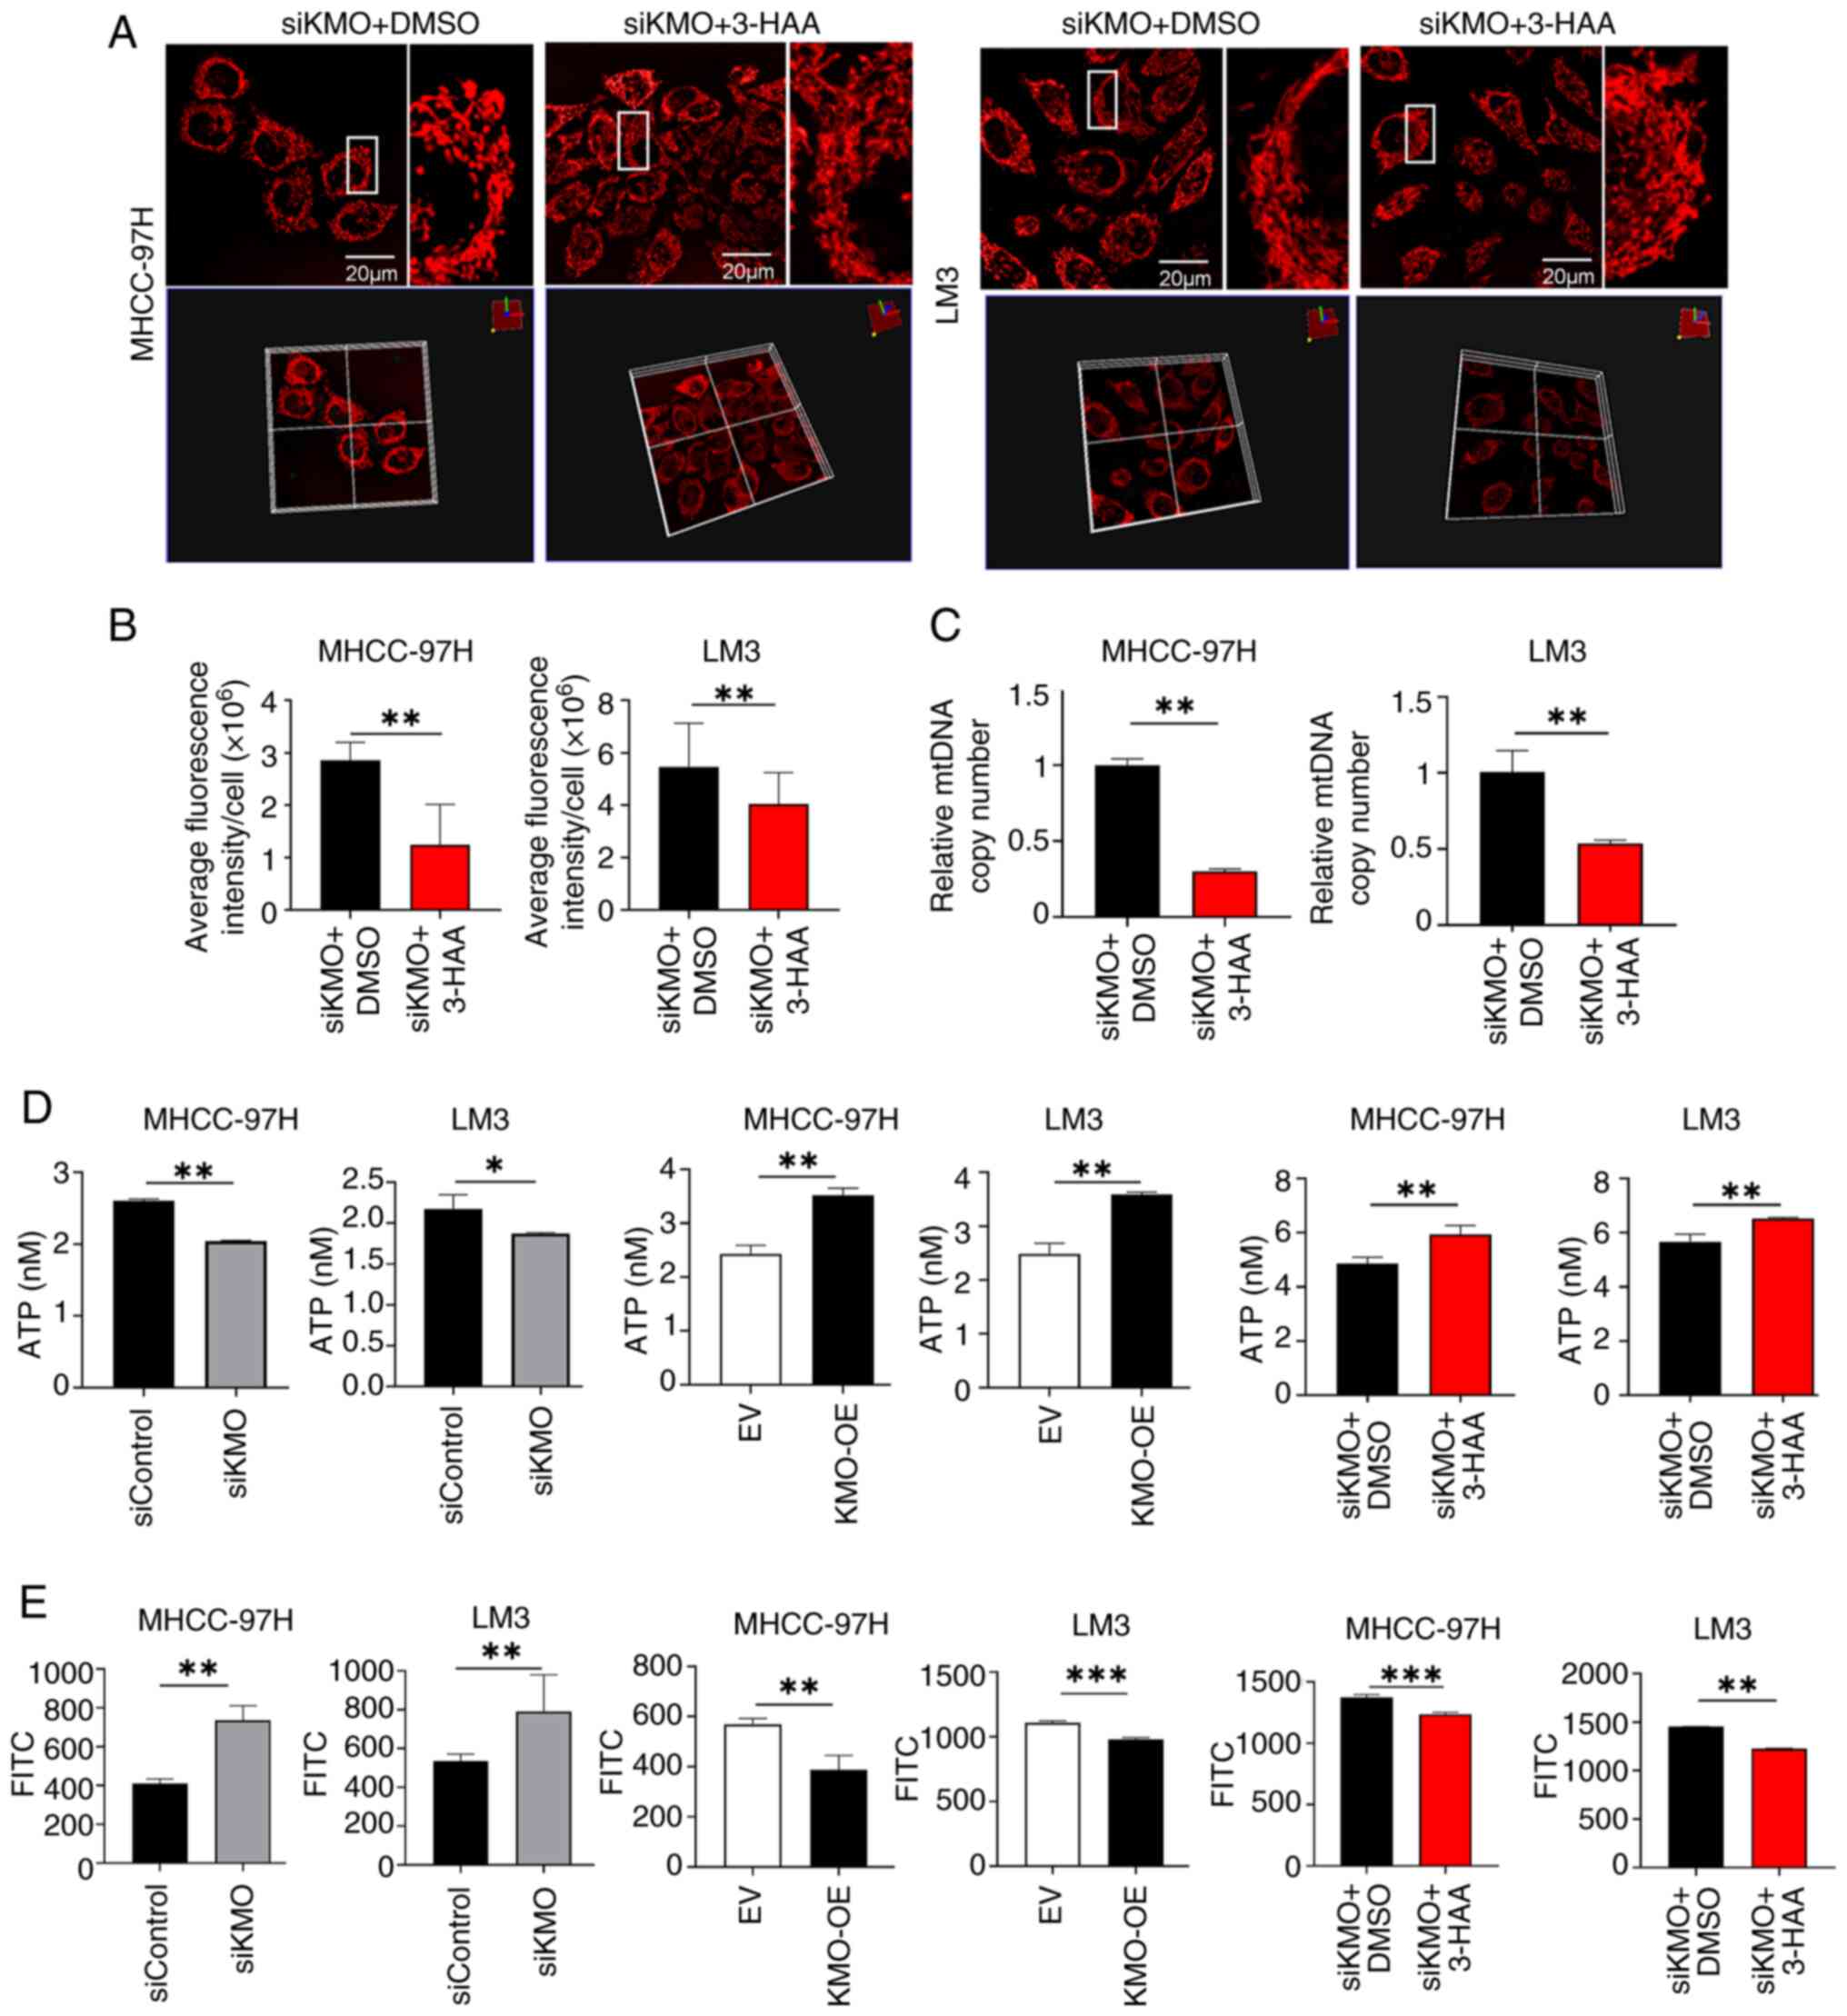
Similarly, it was investigated whether the
mitochondrial changes induced by KMO are mediated by 3-HAA. As
shown in Fig. 7A and B, in both
MHCC97H and LM3 cells, after treatment with 3-HAA in siKMO cells
for 48 h, the mitochondrial mass was decreased compared with the
control group. The mtDNA copy number was significantly reduced in
siKMO cells treated with 3-HAA compared to those treated with DMSO
(Fig. 7C). ATP content in siKMO
HCC cells was lower than that in control cells, while in KMO-OE HCC
cells was higher. And 3-HAA can up regulate the ATP content
decreased by KMO knockdown (Fig.
7D). ROS generation showed an opposite trend to ATP production
and 3-HAA inhibited the ROS generation upregulated by KMO knockdown
(Fig. 7E)
These results indicate that downregulation of KMO in
HCC reduces the production of its downstream metabolite 3-HAA,
thereby promoting HCC progression and inducing alterations in
mitochondrial mass and function.
KMO downregulation reduces the expression
of nuclear receptor subfamily 4 group A member 1 (NR4A1) and
promotes its mitochondria translocation in a 3-HAA-dependent
manner
To investigate the mechanisms underlying the
mitochondrial alterations induced by KMO downregulation, the
present study screened mitochondrial transcription factors
associated with KMO expression. A total of 1,670 transcription
factor genes downloaded from GTRD website (http://gtrd.biouml.org), were intersected with 2,030
mitochondrial-related genes and 1,721 DEGs between KMO high and low
groups (26). A total of four KMO
related mitochondrial transcription factors were obtained (Fig. 8A). In these four transcription
factors, the expression of KMO was positively correlated with the
expression of FOXO1 and NR4A1, while negatively correlated with the
expression of HMGA1 and SOX4 (Fig.
8B). After qPCR verification, only NR4A1 expression was
consistent with the data analysis: It positively correlated with
KMO expression in HCC cells and 3-HAA treatment rescued in the
downregulation of NR4A1 expression caused by KMO knockdown
(Fig. 8C). Low NR4A1 expression
was associated with poor prognosis in HCC patients (Fig. 8D). Similar to KMO, NR4A1
expression was positively correlated with the expression of ten
mitochondrial genome-encoded genes (Fig. 8E).
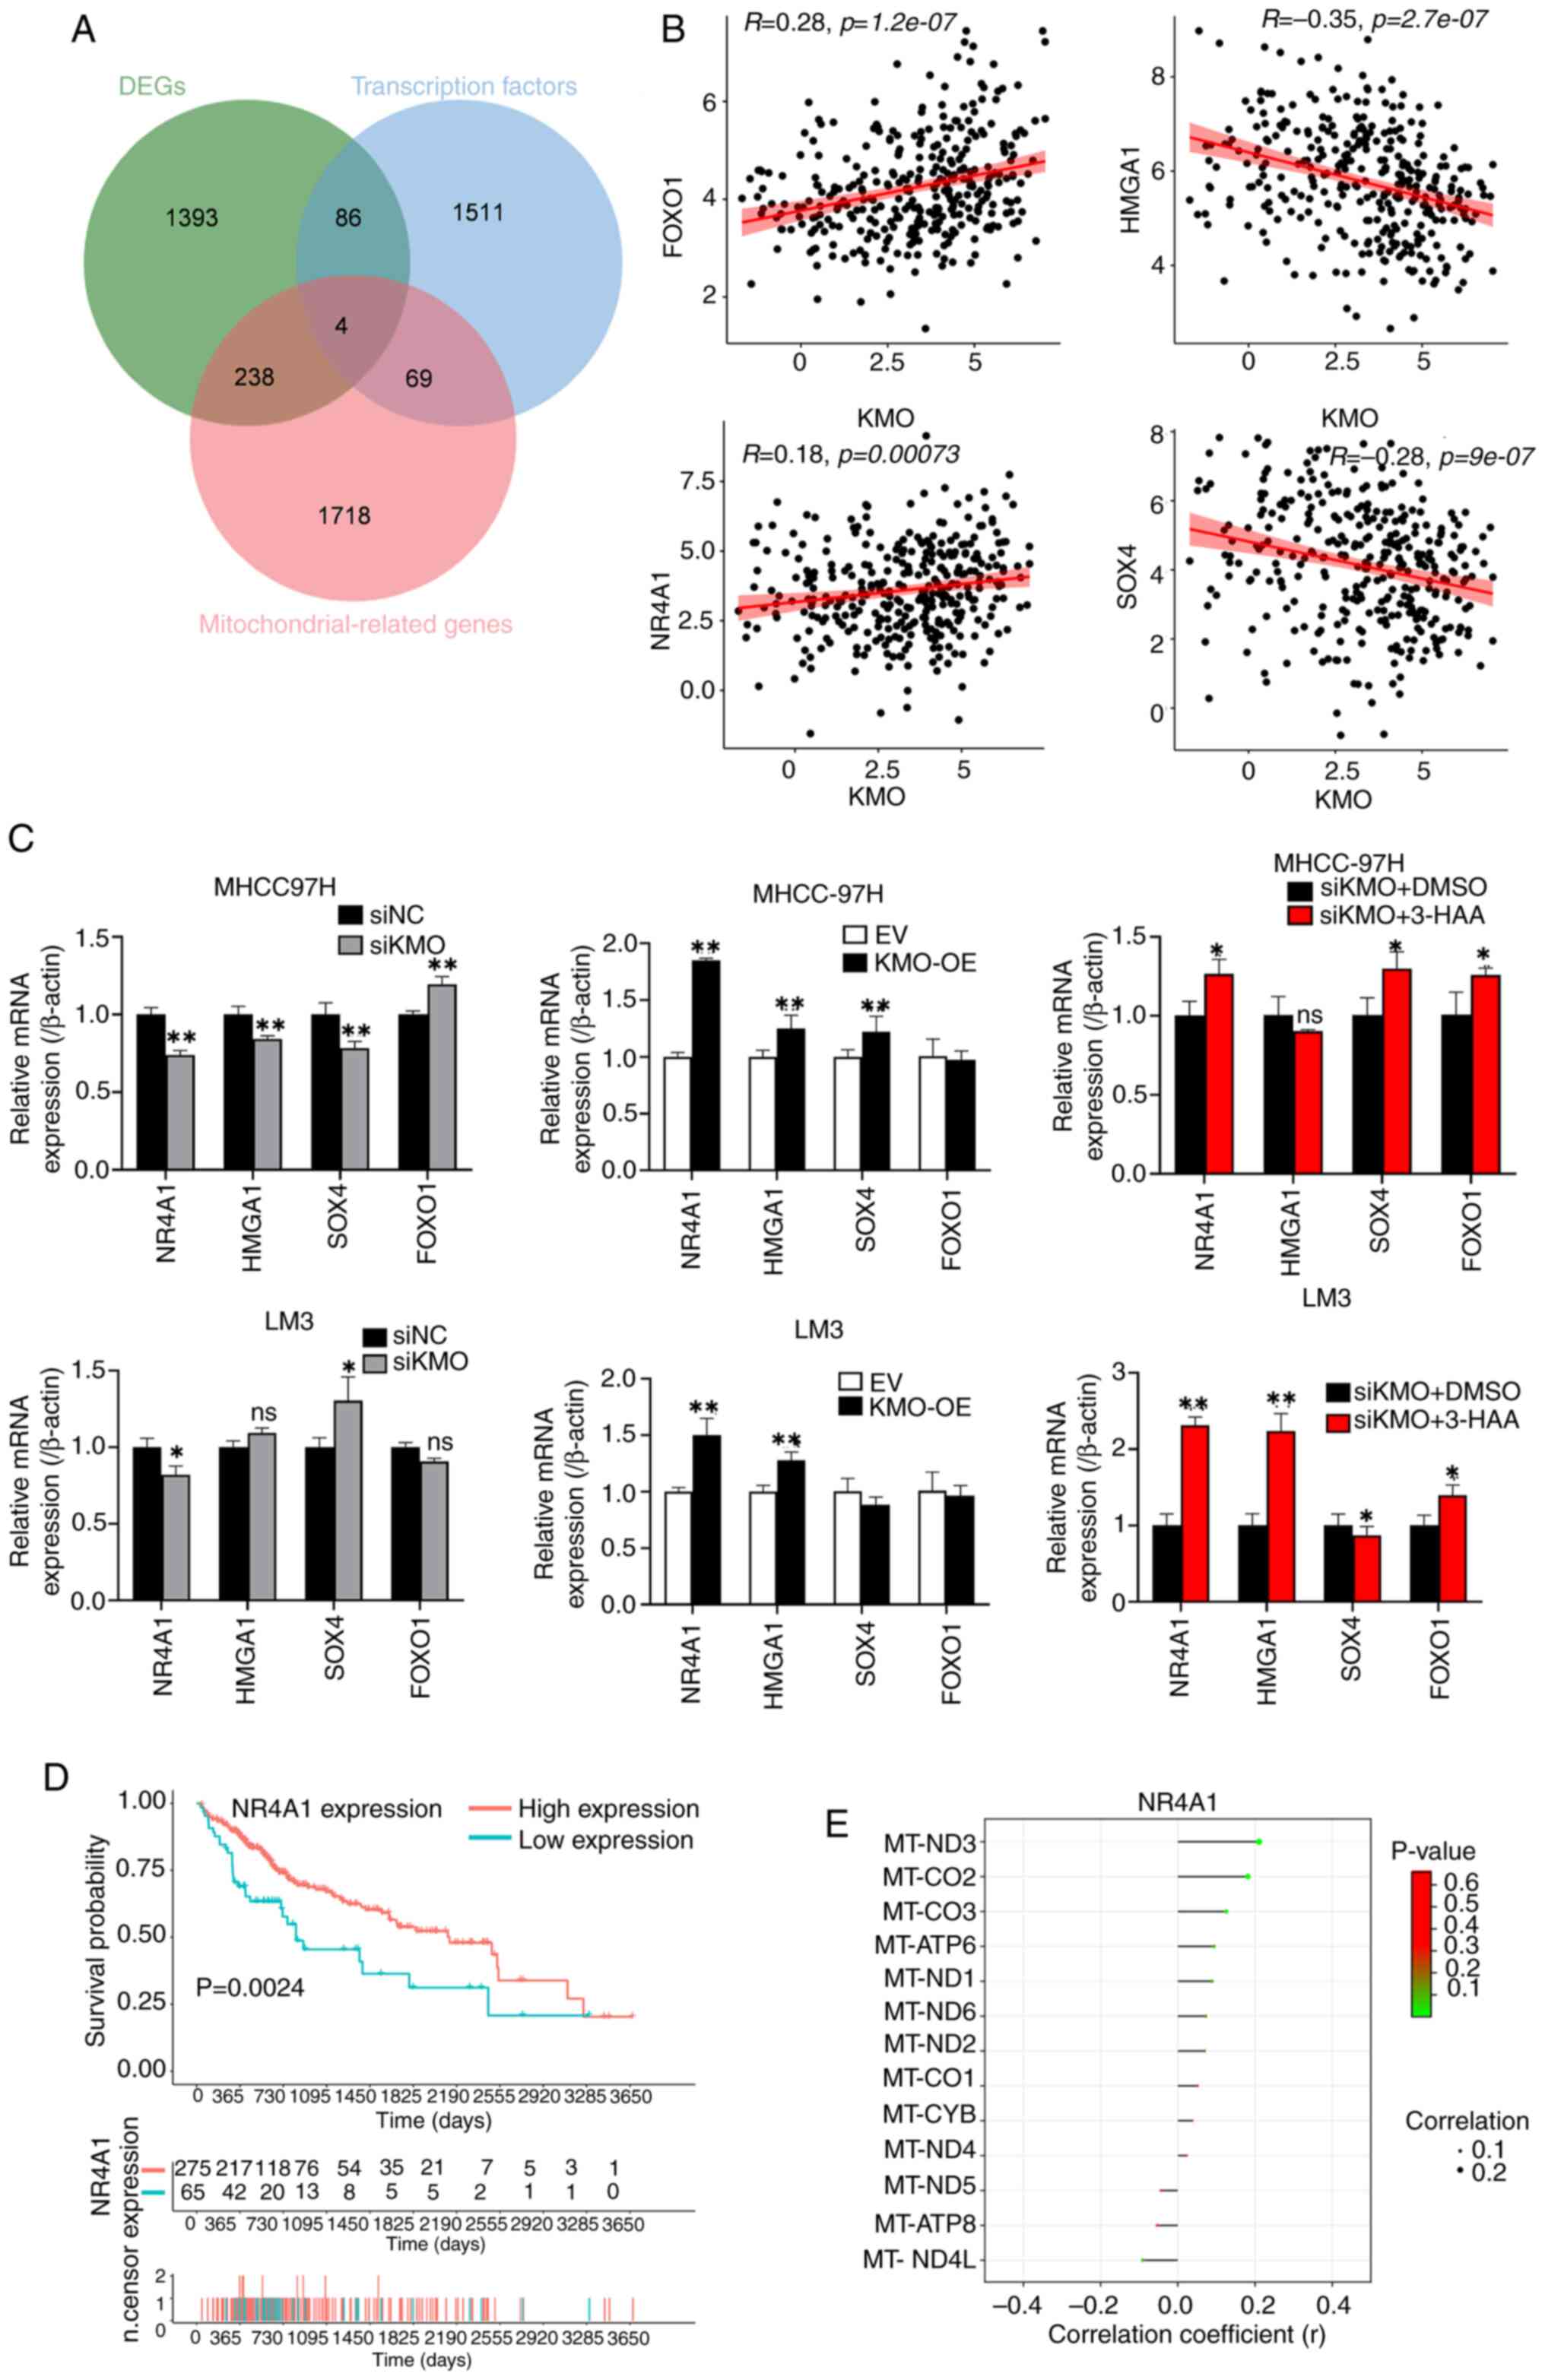 | Figure 8Downregulation of KMO promotes the
decrease of NR4A1 in HCC cells. (A) Venn diagram among KMO related
DEGs, transcription factors and mitochondrial related genes. The
overlapped four genes are the screened mitochondrial related
transcription factors from KMO related DEGs. (B) Correlation
analysis between KMO and four mitochondrial related transcription
factors screened using TCGA database. (C) mRNA expression of four
mitochondrial related transcription factors in KMO-knockdown,
overexpression and 3-HAA treated KMO-knockdown HCC cells and the
corresponding controls. (D) Survival analysis of NR4A1 in HCC
patients in TCGA database. (E) The correlation analysis between
NR4A1 and mitochondrial DNA-encoded genes in HCC. Final working
concentration of 3-HAA: 100 µM. *P<0.05,
**P<0.01, ns: P>0.05. KMO, kynurenine
3-monooxygenase; NR4A1, nuclear receptor subfamily 4 group A member
1; HCC, hepatocellular carcinoma; DEGs, differentially expressed
genes; TCGA, the Cancer Genome Atlas; 3-HAA, 3-hydroxyanthranilic
acid. |
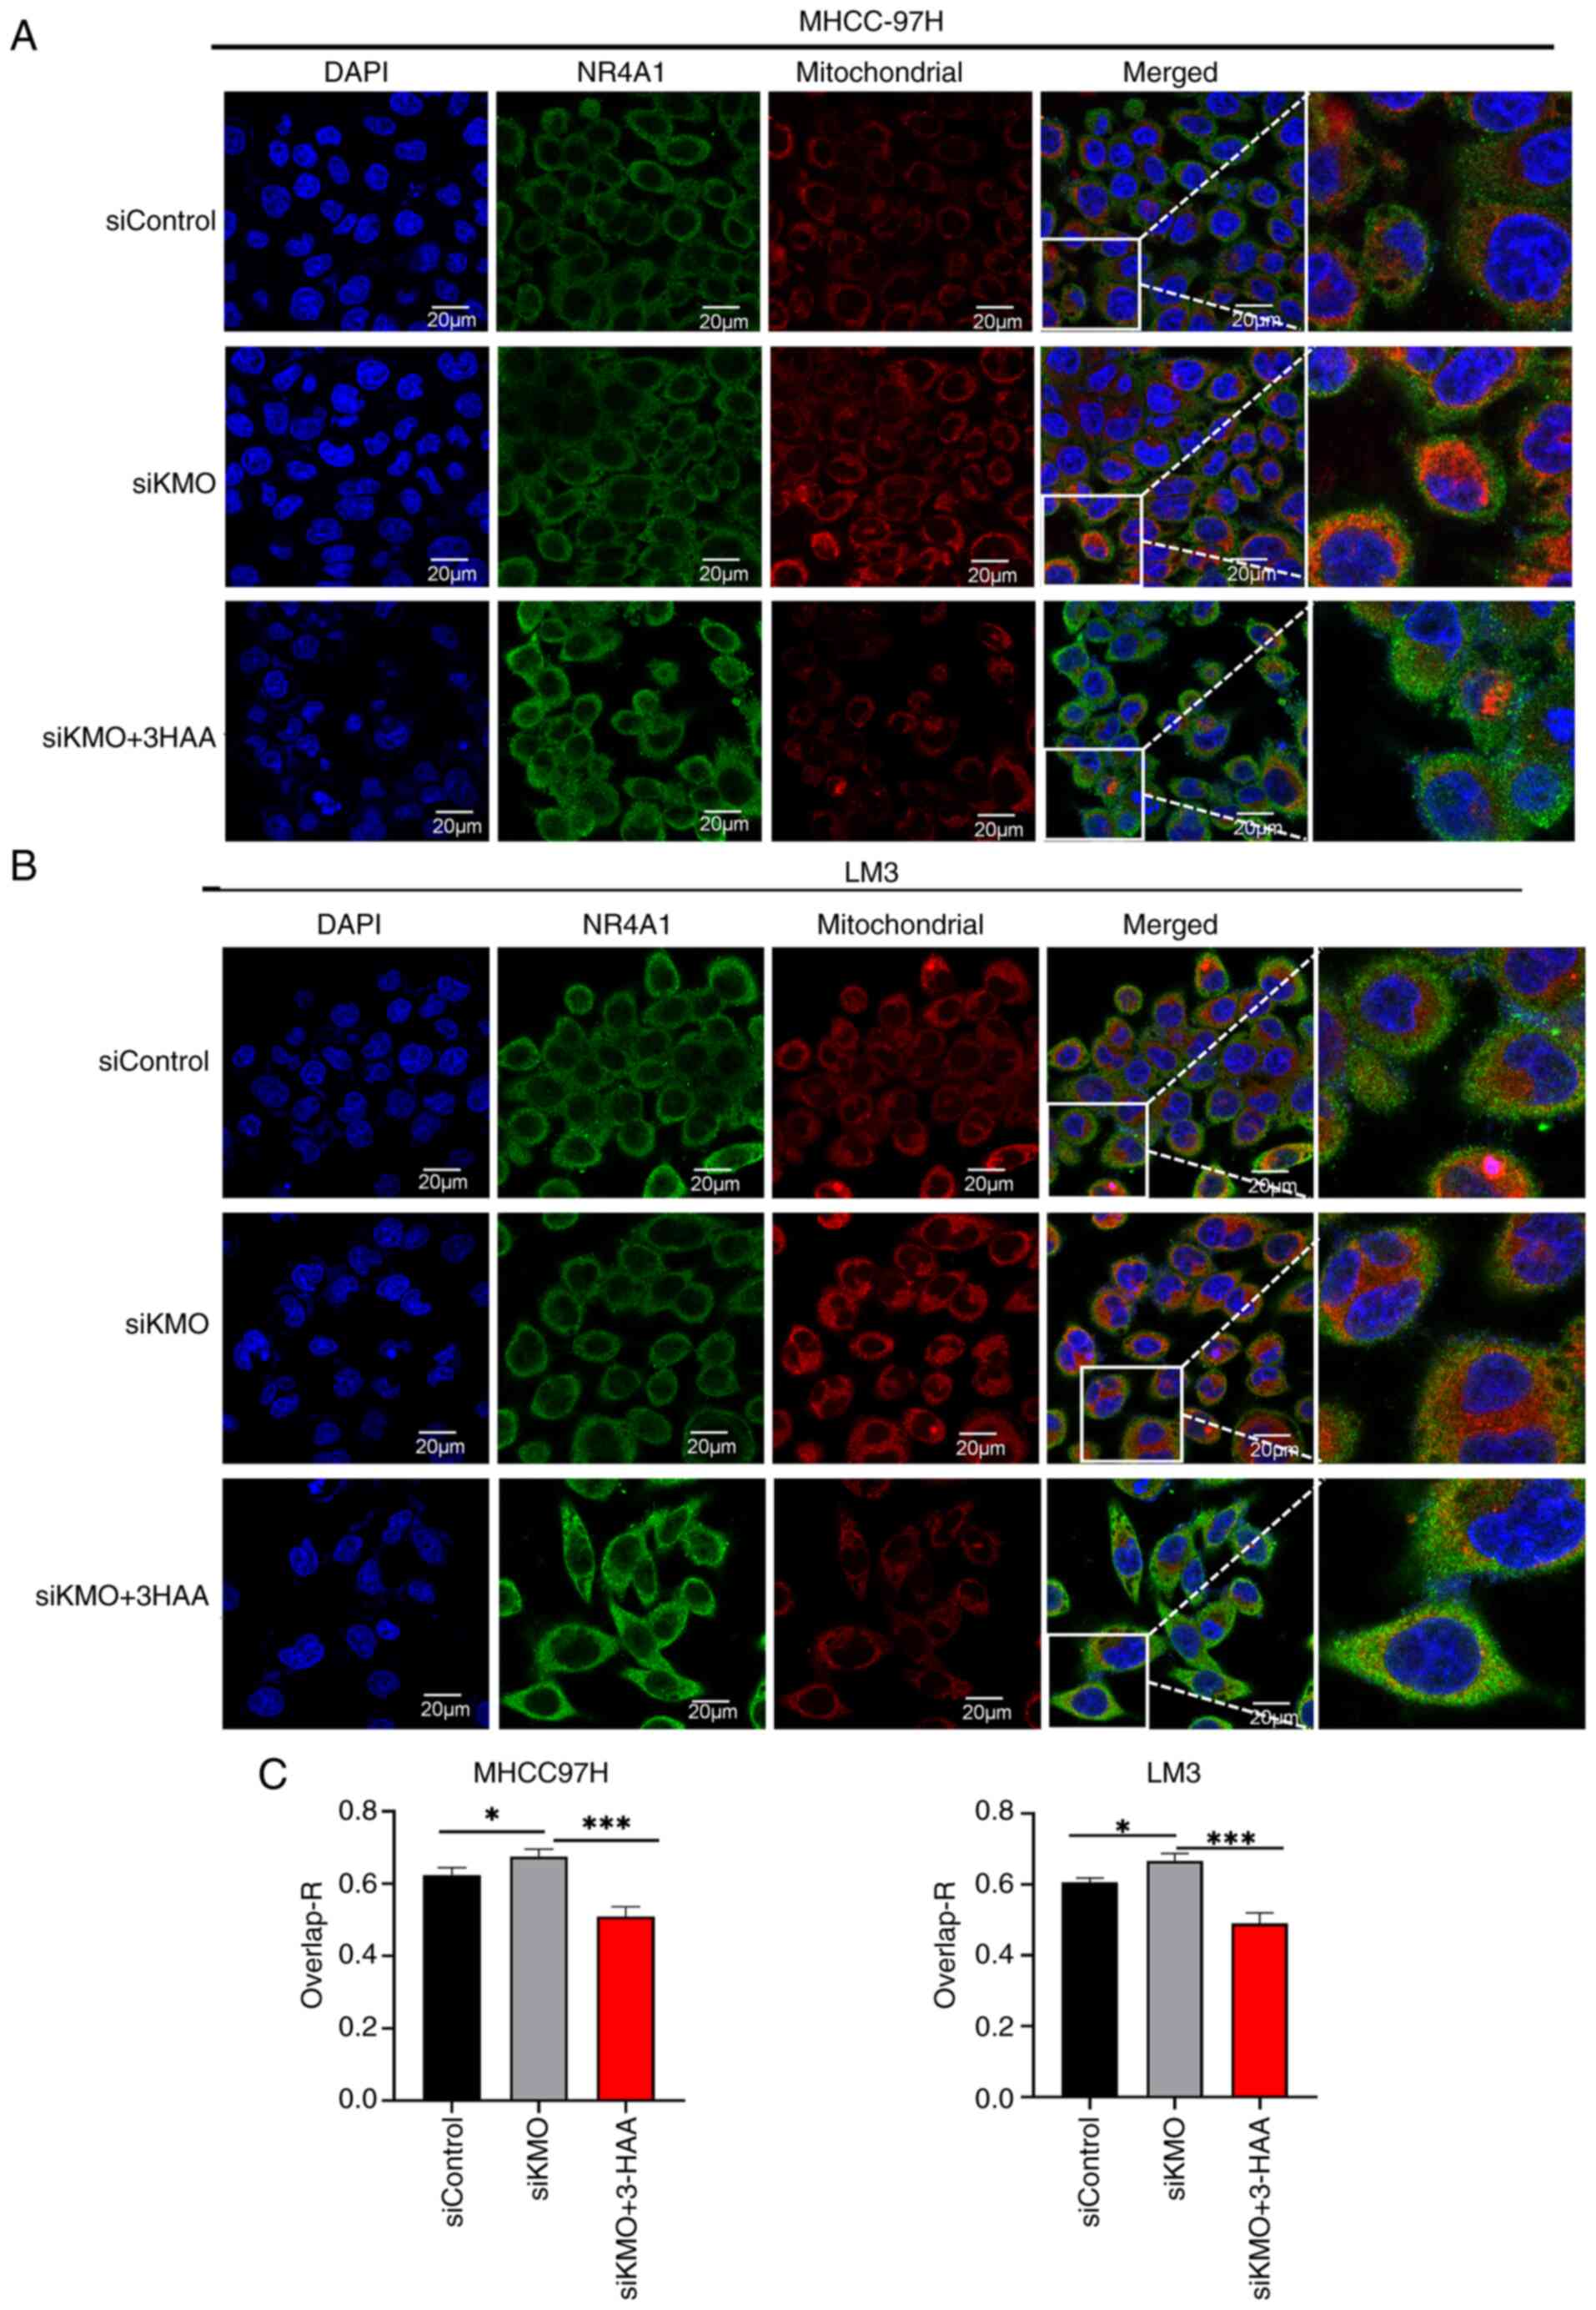
Since NR4A1 is a mitochondria-associated
transcription factor, the present study was interested in finding
out the subcellular localization of NR4A1. After immunofluorescence
staining, it was observed that KMO expression in HCC cells was
distributed in both nucleus and cytoplasm. Combined with
fluorescent staining of mitochondrial Mito-Tracker, NR4A1 showed
increased expression in mitochondria in KMO knockdown HCC cells,
whereas NR4A1 expression in mitochondria was reduced after
overexpression of KMO. 3-HAA reversed the mitochondrial
translocation of NR4A1 induced by KMO knockdown (Fig. 9).
These results illustrated that downregulation of KMO
in HCC cells can lead to reduced NR4A1 expression and promotes its
mitochondrial translocation, both of which are mediated by
3-HAA.
The decrease of NR4A1 induced by
downregulation of KMO promotes mitochondrial biogenesis and
malignant growth of HCC cells
In KMO overexpressed HCC cells, the expression of
NR4A1 was knocked down to investigate the effect of KMO-mediated
NR4A1 on HCC cell growth and mitochondrial mass and function. CCK8
and EdU results showed that silencing of NR4A1 enhanced cell
viability and proliferation in HCC cells overexpressing KMO
(Fig. 10A and B). NR4A1
knockdown increased mitochondrial mass in HCC cells overexpressing
KMO compared with siControl cells (Fig. 10C). Additionally, ATP production
also decreased by NR4A1 knockdown in KMO overexpressed HCC cells
(Fig. 10D). These results
indicated that NR4A1 inhibition promotes mitochondrial biogenesis
and the malignant growth of HCC cells.
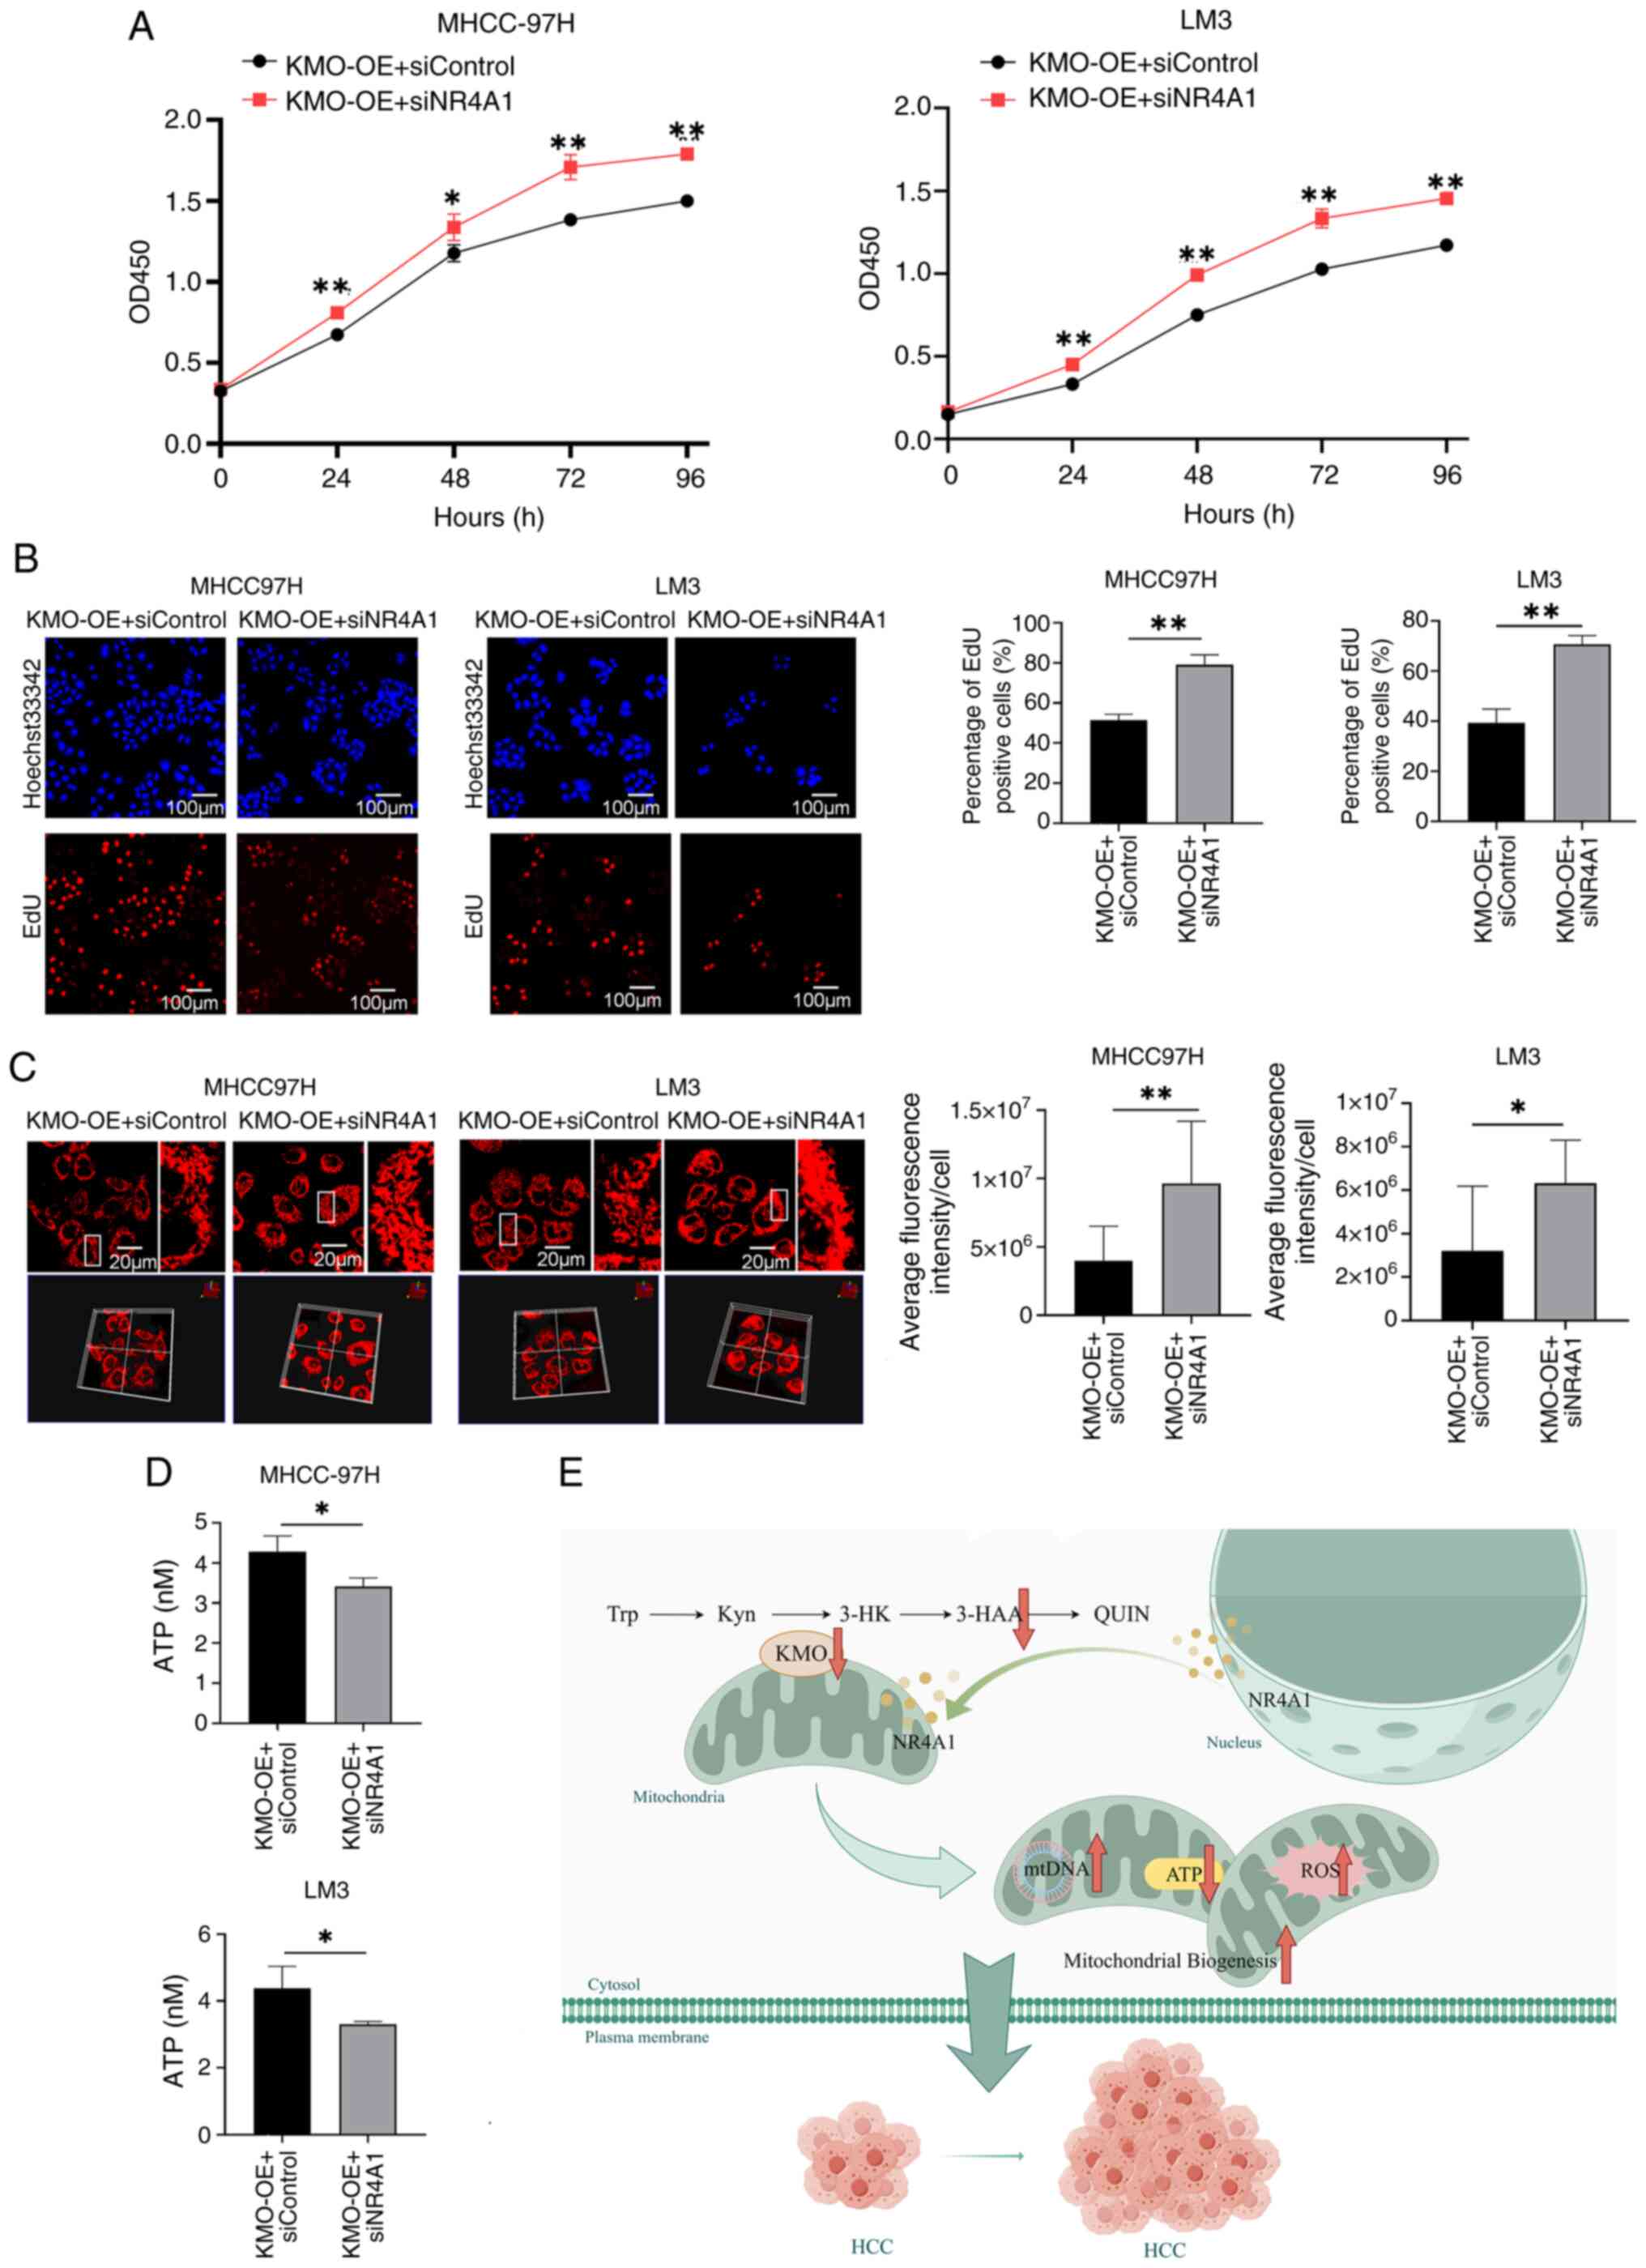 | Figure 10KMO affects cell growth,
mitochondrial quality and ATP production through NR4A1. (A) Effect
of NR4A1 downregulation on cell viability in KMO overexpression HCC
cells was observed by using CCK8 test on 0, 24, 48, 72 and 96 h.
The cell viability rates between KMO overexpression cells
transfected with siKMO and transfected with siControl were
compared. (B) Effect of NR4A1 downregulation on cell proliferation
in KMO overexpression HCC cells was observed by using EdU test. EdU
labeled newly proliferated cells (red) and Hoechst33342 labeled
cell nucleus (blue). Scale bar, 100 µm. Positive cells rate
(red/blue) were counted and compared between KMO overexpression
cells and KMO overexpression cells with NR4A1 knockdown. (C) Effect
of NR4A1 downregulation on mitochondrial mass in KMO overexpression
HCC cells was observed by using confocal microscopy after
MitoTracker staining. The parts in white box were magnified. Scale
bar, 20 µm. Mitochondrial mass was analyzed by using the
value of average fluorescence intensity per cell. (D) Effect of
NR4A1 downregulation on ATP production in KMO overexpression HCC
cells. (E) The mechanism of KMO downregulation promoting tumor
growth in HCC: KMO downregulation reduced 3-HAA levels, which
suppressed expression of the transcription factor NR4A1 and drove
its mitochondrial translocation, thereby disrupting mitochondrial
homeostasis and promoting the proliferation of HCC cells.
*P<0.05, **P<0.01. KMO, kynurenine
3-monooxygenase; NR4A1, nuclear receptor subfamily 4 group A member
1; HCC, hepatocellular carcinoma; 3-HAA, 3-hydroxyanthranilic acid;
ROS, reactive oxygen species; 3-HK, 3-hydroxykynurenine QUIN,
quinolinic acid; Try, tryptophan; Kyn, kynurenine. |
Discussion
Abnormalities in Try metabolism, as well as
mitochondrial structure and function, are involved in the
development of HCC. As a key enzyme in the Try metabolic pathway,
KMO co-localizes with mitochondria. However, to the best of the
authors' knowledge, the effects of KMO on mitochondrial mass and
function in HCC have not yet been reported. The present study
identified that KMO expression was downregulated in HCC patients
through multiple public datasets and further validated this finding
in tissue samples. Furthermore, KMO downregulation in HCC cells was
shown to promote tumor cell proliferation and migration. The
co-localization of KMO and mitochondria was determined in HCC cells
and the downregulation of KMO promoted mitochondrial biogenesis.
Mechanistically, low expression of KMO in HCC cells reduced 3-HAA
levels, which suppressed expression of the transcription factor
NR4A1 and drove its mitochondrial translocation, thereby disrupting
mitochondrial homeostasis and promoting the proliferation of HCC
cells (Fig. 10E).
Try metabolism through the Kyn pathway serves an
immunosuppressive role in liver cancer (27). However, the distinction between
the immunomodulatory effects of Try itself and the effects of
downstream products of Try metabolism remains unclear (28). KMO is involved in Try metabolism
through the Kyn pathway, which exists mainly in the liver and ~95%
of Try is oxidatively degraded via this pathway (29). In the current study, multiple
datasets and experiments validated that KMO expression was reduced
in HCC and was associated with a poor prognosis in patients with
HCC. In HCC cells with KMO knockdown and overexpression, it was
also verified that reduction of KMO promoted the malignant
progression of HCC tumor cells. These results are consistent with
the findings of Shi et al (20). A possible theory is that the
downregulation of KMO disrupts the Kyn pathway and induces the
accumulation of Kyn, which suppresses immune cell populations and
increases tumor growth (30).
Notably, it may also promote tumor progression by affecting the
generation of downstream products of the Kyn pathway. In addition,
the results of single-cell sequencing data analysis revealed that
KMO expression was downregulated in DC, epithelial and tumor cells
and MDSC from HCC tissue, suggesting that KMO expression in DC,
epithelial and tumor cells and MDSC has an antitumor effect and
requires further study.
KMO has previously been reported to be localized on
the outer mitochondrial membrane of pig liver (9). A previous study found that
inhibition of KMO can effectively inhibit cardiomyocyte apoptosis
and ferroptosis by regulating mitochondrial fission and fusion
(31). Chen et al
(32) demonstrated that KMO, as a
key gene for mitochondrial dysfunction, has important diagnostic
value for intracranial aneurysms. Downregulation of KMO expression
has also been found to enhance mitochondrial fusion and inhibit
mitophagy in ischemic stroke (33). These studies have revealed that
KMO can be involved in disease development by affecting
mitochondrial structure or function. The present study confirmed
the co-localization of KMO with mitochondria in HCC cells.
Furthermore, GO enrichment analyses of KMO co-expressed genes
showed that these genes were related to mitochondrial structural
components and in HCC cells, the expression of KMO affected the
mitochondrial mass, mitochondrial biogenesis and expression of
mitochondrial encoded genes. In particular, the opposability of
mitochondrial mass to mitochondrial encoded gene expression points
to a state of mitochondrial dysfunction.
Try is initially metabolized by IDO1, IDO2 and TDO
to produce Kyn. One of the three Kyn metabolic pathways includes
the catalysis of Kyn by KMO to form 3-HK, which is subsequently
converted to 3-HAA by KYNU. 3-HAA is further metabolized by
3-hydroxyl amino acid oxygenase to generate quinolinic acid (QUIN).
QUIN serves as a substrate for the production of nicotinamide
adenine dinucleotide, which is involved in a variety of important
physiological processes, such as intracellular energy metabolism,
DNA repair and signal transduction (34). Notably, KMO expression has the
potential to influence its downstream metabolites. Since KMO
expression was downregulated in HCC, the current study chose HCC
cells overexpressing KMO to detect Try metabolites. The results
showed that only 3-HAA was increased in HCC cells overexpressing
KMO compared with that in the control cells, whereas 3-HK, a direct
metabolite of KMO, was not detected. The reason for this phenomenon
may be that KYNU has a strong metabolizing ability for 3-HK, while
both silencing and overexpression of KMO did not affect KYNU
expression. It may be assumed that upregulated KMO mainly enhanced
3-HAA levels. It has previously been reported that the Kyn
derivative 3-HAA is lower in HCC cells and exogenous 3-HAA induces
the apoptosis of HCC cells by binding the transcription factor YY1
(24). In a mouse model of HCC,
3-HAA treatment has been reported to inhibit HCC growth by
regulating the function of macrophages (35). Gan et al (36,37) also demonstrated that 3-HAA may
sensitize HCC cells to sorafenib by reducing AKT phosphorylation,
promoting apoptosis and suppressing tumor cell stemness. In
conclusion, 3-HAA could inhibit HCC progression through multiple
mechanisms, including the induction of apoptosis and reduction of
stemness, indicating that it may serve as a promising therapeutic
target for HCC.
The present study also observed that 3-HAA could
reverse the malignant phenotype of HCC cells caused by KMO
downregulation. In addition, 3-HAA-treated cancer cells exhibited a
reversal of the changes in mitochondrial mass, mitochondrial
biogenesis, ATP and ROS production caused by KMO. The possible
mechanisms underlying how 3-HAA could ameliorate HCC were
elaborated from a new perspective in the present study. It has
previously been reported that M2 macrophage-secreted KYNU and 3-HAA
may upregulate the expression of superoxide dismutase 2 to decrease
mitochondrial ROS in endometrial cancer. Although this previous
study concluded that high KYNU and 3-HAA promote endometrial cancer
progression, it also provides valuable evidence for the association
between 3-HAA and mitochondria (38). Ruan et al (39) reported that bronchopulmonary
dysplasia (BPD) was associated with markedly reduced 3-HAA levels
and exhibited typical ferroptosis-associated changes, such as
mitochondrial pyknosis and loss of cristae, whereas 3-HAA treatment
could attenuate these mitochondrial abnormalities in type Ⅱ
alveolar epithelial cells, suggesting 3-HAA as a potential target
for treating BPD.
To further clarify the regulatory mechanism by which
KMO downregulation mediates the reduction of 3-HAA affecting
mitochondrial function, the present study explored the
mitochondria-related transcription factors that may be affected by
KMO expression. As a result, NR4A1 was revealed to be positively
correlated with KMO expression in HCC cells. NR4A1, also known as
Nur77, affects tumorigenesis and tumor progression via various
cellular processes, such as proliferation, endoplasmic reticulum
stress, apoptosis and autophagy (40,41). Based on the cancer type and stage,
NR4A1 can exhibit both pro-tumorigenic and tumor-suppressive
effects via transcription-dependent and transcription-independent
manners (41). In liver cancer,
the low expression of NR4A1 can promote HCC progression by
increasing glycolysis, inhibiting apoptosis or regulating β-catenin
expression (42-44). In the current study, downregulated
NR4A1 was associated with poor survival in patients with HCC and
NR4A1 was also shown to be positively related to the expression of
the majority of mtDNA encoded genes, such as MT-ATP6 and MT-ND1,
thus suggesting that low expression of NR4A1 in HCC also affects
mitochondrial function. It has been reported that NR4A1 promotes
apoptosis in HCC cells when its cytoplasmic expression is increased
(44). NR4A1 translocated to the
mitochondria can promote the transformation of the anti-apoptotic
protein Bcl-2 into a pro-apoptotic state, interfere with
mitochondrial division and fusion, inhibit mitochondrial autophagy
and lead to irreversible mitochondrial damage and cell apoptosis
(45). In a model of myocardial
ischemia-reperfusion injury, NR4A1 has been shown to be elevated
and may promote mitochondrial fission by regulating mitochondrial
fission 1 protein (46).
Furthermore, the synergistic effect of NR4A1 and YY1 on macrophages
can increase the abundance and activity of mitochondria (47). However, in Parkinson's disease
research, it has been reported that NR4A1, which shuttles from the
nucleus to the mitochondria, can inhibit apoptosis by stabilizing
the presenilin-associated mitochondrial like protein (PARL)-Bcl-2
complex, thereby overexpression of NR4A1 can restore PARL-mediated
anti-apoptotic signaling for therapeutic purposes (48). In the present study, the
subcellular localization of NR4A1 was assessed in siKMO HCC cells
to determine the effect of KMO on NR4A1 translocation.
Unexpectedly, compared with in the control cells, although the
expression of NR4A1 was reduced, co-localization with mitochondria
was increased in siKMO HCC cells. The reasons for this phenomenon
are likely to be complex: Total NR4A1 expression was reduced after
KMO interference; however, mitochondrial mass was increased, which
possibly enhanced shuttling of NR4A1 from the nucleus to the
mitochondria. When siKMO HCC cells were treated with 3-HAA, the
expression of NR4A1 was increased and co-localization with the
mitochondria was decreased, implying that KMO may regulate the
expression and translocation of NR4A1 induced by 3-HAA. NR4A1
exerts an inhibitory effect on cell proliferation in the nucleus
and its reduction and mitochondrial translocation will promote HCC
cell proliferation; however, whether NR4A1 promotes apoptosis or
inhibits apoptosis in the mitochondria requires an improved
experimental design for verification. It may play a role in
promoting apoptosis; however, due to the reduction in NR4A1,
although mitochondrial co-localization is enhanced, the overall
effect on HCC cell proliferation may be more notable than the
effect on apoptosis. In addition, the pro-apoptotic function of
mitochondrial NR4A1 may be abrogated due to its critically low
overall expression level. The subsequent cellular experiments in
the present study also demonstrated that in HCC cells
overexpressing KMO, downregulation of NR4A1 expression promoted
tumor cell proliferation, increased mitochondrial mass and
decreased ATP. These findings indicated the importance of KMO,
3-HAA and NR4A1 in liver carcinogenesis; however, further studies
are needed to elucidate the underlying mechanism using a broader
panel of HCC cell lines and rescue experiments.
By employing a multi-faceted approach, the rigor and
validity of the current conclusions were strengthened. The cellular
mechanistic studies complemented those of public large-scale human
HCC transcriptomics datasets (TCGA and GEO datasets), enhancing the
clinical relevance of the study. The present data showed that in
patients with HCC and in HCC cell models, the lack of KMO may lead
to the progression of HCC. Therefore, targeting KMO and related
molecules, as well as the associated signaling pathways, may be a
promising therapeutic strategy for HCC. The feasible strategies
include but are not limited to: i) Based on the bulk mRNA
sequencing data of the adult population, the drug sensitivity in
the KMO low and high expression groups could be predicted and
patients with HCC may choose more precision treatment drugs
according to KMO expression; ii) KMO downstream metabolites, such
as 3-HAA, as small molecule compounds, have not yet become approved
therapeutic drugs, but 3-HAA is a potential candidate drug that is
currently undergoing extensive research; iii) concurrent inhibition
of the upstream enzyme IDO1/TDO and enhancement of the downstream
enzyme KMO in Try metabolism could exert a synergistic effect,
leading to a more potent reversal of immunosuppression through the
reduction of Kyn buildup.
The present study focused on investigating the
influence of the key enzyme in Try metabolism, KMO, on disordered
mitochondria in the development of HCC. Despite yielding valuable
insights, several limitations remain. Firstly, the study was
conducted at the cellular level based on publicly available
datasets and lacked experimental validation at the animal level.
Second, the mechanism of NR4A1 translocation induced by KMO or
3-HAA requires further exploration. Third, further experiments need
to be designed and performed to investigate the differential
functions of NR4A1 in the nucleus and mitochondria of HCC cells and
animal models. Fourth, the method for detecting mitochondrial
morphology in this study was relatively limited, it is necessary to
employ a variety of further detection methods to determine the
changes of mitochondrial morphology and structure. Finally, it will
be necessary to assess the mechanism underlying the effects of KMO
downregulation on increased mitochondrial mass and dysfunction in
the future.
In conclusion, the present study indicated that low
KMO expression in HCC may affect mitochondrial mass and function by
reducing the level of the Try metabolite 3-HAA and downregulating
the expression of NR4A1 and promoting its mitochondrial
translocation, which in turn could promote the progression of HCC.
KMO agonists are expected to achieve two goals simultaneously in
alleviating HCC: Restoring the Try metabolic pathway and enhancing
NR4A1 expression. The present findings provide new insights into
the treatment of HCC, potentially targeting the mitochondria and
the Try-Kyn pathway.
Supplementary Data
Availability of data and materials
The GEO datasets are available for download from the
National Center for Biotechnology Information online Gene
Expression Omnibus (GEO) database (https://www.ncbi.nlm.nih.gov/geo/; GSE101728,
GSE45050, GSE84598 and GSE121248). TCGA-LIHC data was downloaded
from The Cancer Genome Atlas (TCGA; (https://portal.gdc.cancer.gov/; TCGA-LIHC) and
relative phenotype and survival data are from University of
California Santa Cruz (UCSC) [https://xenabrowser.net/datapages/, TCGA Liver Cancer
(LIHC)]. Cell annotation lists are available online at Cell Marker
2.0 (http://117.50.127.228/CellMarker/). R and other
custom scripts for analyzing the data may be requested from the
corresponding author.
Authors' contributions
ML, HW and JZ designed the experiments, acquired
and interpreted the data, and drafted the manuscript. XZ and YH
completed the data analysis and cell experiments. LN, LG and FL
collected the HCC tissue samples, completed the tissue experiments,
and interpreted the data. GZ, FJ and LL analyzed, checked the data,
and edited the manuscript. ML and JZ confirmed the authenticity of
all the raw data. All authors read and approved the final
manuscript.
Ethics approval and consent to
participate
The present study was approved by the ethics
committee of the First Hospital of Shanxi Medical University
(approval number: 2021SLL086). All patients understood and signed
the informed consent. All patients consent for publication.
Patient consent for publication
Not applicable.
Competing interests
The authors declare that they have no competing
interests.
Abbreviations:
|
HCC
|
hepatocellular carcinoma
|
|
KMO
|
kynurenine 3-monooxygenase
|
|
3-HAA
|
3-hydroxyanthranilic acid
|
|
NR4A1
|
nuclear receptor subfamily 4 group A
member 1
|
|
Try
|
tryptophan
|
|
Kyn
|
kynurenine
|
|
TDO
|
tryptophan-2,3-dioxygenase
|
|
mtDNA
|
mitochondrial DNA
|
|
GEO
|
gene Expression Omnibus
|
|
DEGs
|
differentially expressed genes
|
|
MRDEGs
|
mitochondrial related DEGs
|
|
TCGA
|
the Cancer Genome Atlas
|
|
LIHC
|
liver hepatocellular carcinoma.
WGCNA, weighted gene co-expression network analysis
|
|
GO
|
Gene Ontology
|
|
KEGG
|
Kyoto Encyclopedia of Genes and
Genomes
|
|
PPI
|
protein-protein interaction
|
Acknowledgments
Not applicable.
Funding
The present study was supported by National Natural Science
Foundation of China (grant no. 81902513), Applied Basic Research
Project of Shanxi Province (grant no. 202303021211114, grant no.
20210302123319, grant no. 20210302124376 and grant no.
202103021224228), Science Research Start-up fund for doctor of
Shanxi Medical University (grant nos. XD1808 and BS03201603) and
Shanxi Province Higher Education 'Billion Project' Science and
Technology Guidance Project (grant no. BYJL047).
References
|
1
|
Bray F, Laversanne M, Sung H, Ferlay J,
Siegel RL, Soerjomataram I and Jemal A: Global cancer statistics
2022: GLOBOCAN estimates of incidence and mortality worldwide for
36 cancers in 185 countries. CA Cancer J Clin. 74:229–263.
2024.PubMed/NCBI
|
|
2
|
Rumgay H, Ferlay J, de Martel C, Georges
D, Ibrahim AS, Zheng R, Wei W, Lemmens VEPP and Soerjomataram I:
Global, regional and national burden of primary liver cancer by
subtype. Eur J Cancer. 161:108–118. 2022. View Article : Google Scholar
|
|
3
|
de Martel C, Georges D, Bray F, Ferlay J
and Clifford GM: Global burden of cancer attributable to infections
in 2018: A worldwide incidence analysis. Lancet Glob Health.
8:e180–e90. 2020. View Article : Google Scholar
|
|
4
|
Marques HP, Gomes da Silva S, De Martin E,
Agopian VG and Martins PN: Emerging biomarkers in HCC patients:
Current status. Int J Surg. 82S:70–76. 2020. View Article : Google Scholar
|
|
5
|
Vogel A, Meyer T, Sapisochin G, Salem R
and Saborowski A: Hepatocellular carcinoma. Lancet. 400:1345–1362.
2022. View Article : Google Scholar : PubMed/NCBI
|
|
6
|
Luo Y, Ma J and Lu W: The significance of
mitochondrial dysfunction in cancer. Int J Mol Sci. 21:55982020.
View Article : Google Scholar : PubMed/NCBI
|
|
7
|
Liu BH, Xu CZ, Liu Y, Lu ZL, Fu TL, Li GR,
Deng Y, Luo GQ, Ding S, Li N and Geng Q: Mitochondrial quality
control in human health and disease. Mil Med Res.
11:322024.PubMed/NCBI
|
|
8
|
Swaih AM, Breda C, Sathyasaikumar KV,
Allcock N, Collier MEW, Mason RP, Feasby A, Herrera F, Outeiro TF,
Schwarcz R, et al: Kynurenine 3-monooxygenase interacts with
huntingtin at the outer mitochondrial membrane. Biomedicines.
10:22942022. View Article : Google Scholar : PubMed/NCBI
|
|
9
|
Uemura T and Hirai K: L-kynurenine
3-monooxygenase from mitochondrial outer membrane of pig liver:
Purification, some properties and monoclonal antibodies directed to
the enzyme. J Biochem. 123:253–262. 1998. View Article : Google Scholar : PubMed/NCBI
|
|
10
|
Maddison DC, Alfonso-Nunez M, Swaih AM,
Breda C, Campesan S, Allcock N, Straatman-Iwanowska A, Kyriacou CP
and Giorgini F: A novel role for kynurenine 3-monooxygenase in
mitochondrial dynamics. PLoS Genet. 16:e10091292020. View Article : Google Scholar : PubMed/NCBI
|
|
11
|
Chen W, Zhao H and Li Y: Mitochondrial
dynamics in health and disease: Mechanisms and potential targets.
Signal Transduct Target Ther. 8:3332023. View Article : Google Scholar : PubMed/NCBI
|
|
12
|
Huang TT, Tseng LM, Chen JL, Chu PY, Lee
CH, Huang CT, Wang WL, Lau KY, Tseng MF, Chang YY, et al:
Kynurenine 3-monooxygenase upregulates pluripotent genes through
β-catenin and promotes triple-negative breast cancer progression.
EBioMedicine. 54:1027172020. View Article : Google Scholar
|
|
13
|
Liu CY, Huang TT, Chen JL, Chu PY, Lee CH,
Lee HC, Lee YH, Chang YY, Yang SH, Jiang JK, et al: Significance of
kynurenine 3-monooxygenase expression in colorectal cancer. Front
Oncol. 11:6203612021. View Article : Google Scholar : PubMed/NCBI
|
|
14
|
Hornigold N, Dunn KR, Craven RA, Zougman
A, Trainor S, Shreeve R, Brown J, Sewell H, Shires M, Knowles M, et
al: Dysregulation at multiple points of the kynurenine pathway is a
ubiquitous feature of renal cancer: Implications for tumour immune
evasion. Br J Cancer. 123:137–147. 2020. View Article : Google Scholar : PubMed/NCBI
|
|
15
|
Liang H, Cheung LW, Li J, Ju Z, Yu S,
Stemke-Hale K, Dogruluk T, Lu Y, Liu X, Gu C, et al: Whole-exome
sequencing combined with functional genomics reveals novel
candidate driver cancer genes in endometrial cancer. Genome Res.
22:2120–2129. 2012. View Article : Google Scholar : PubMed/NCBI
|
|
16
|
Chen N, Zong Y, Yang C, Li L, Yi Y, Zhao
J, Zhao X, Xie X, Sun X, Li N and Jiang L: KMO-driven metabolic
reconfiguration and its impact on immune cell infiltration in
nasopharyngeal carcinoma: A new avenue for immunotherapy. Cancer
Immunol Immunother. 74:752025. View Article : Google Scholar : PubMed/NCBI
|
|
17
|
Park SY and Nam JS: Kynurenine pathway
enzyme KMO in cancer progression: A tip of the Iceberg.
EBioMedicine. 55:1027622020. View Article : Google Scholar : PubMed/NCBI
|
|
18
|
Yan J, Chen D, Ye Z, Zhu X, Li X, Jiao H,
Duan M, Zhang C, Cheng J, Xu L, et al: Molecular mechanisms and
therapeutic significance of tryptophan metabolism and signaling in
cancer. Mol Cancer. 23:2412024. View Article : Google Scholar : PubMed/NCBI
|
|
19
|
Jin H, Zhang Y, You H, Tao X, Wang C, Jin
G, Wang N, Ruan H, Gu D, Huo X, et al: Prognostic significance of
kynurenine 3-monooxygenase and effects on proliferation, migration
and invasion of human hepatocellular carcinoma. Sci Rep.
5:104662015. View Article : Google Scholar
|
|
20
|
Shi Z, Gan G, Gao X, Chen F and Mi J:
Kynurenine catabolic enzyme KMO regulates HCC growth. Clin Transl
Med. 12:e6972022. View Article : Google Scholar : PubMed/NCBI
|
|
21
|
Tang D, Chen M, Huang X, Zhang G, Zeng L,
Zhang G, Wu S and Wang Y: SRplot: A free online platform for data
visualization and graphing. PLoS One. 18:e02942362023. View Article : Google Scholar : PubMed/NCBI
|
|
22
|
Wu J, Ru NY, Zhang Y, Li Y, Wei D, Ren Z,
Huang XF, Chen ZN and Bian H: HAb18G/CD147 promotes
epithelial-mesenchymal transition through TGF-β signaling and is
transcriptionally regulated by Slug. Oncogene. 30:4410–4427. 2011.
View Article : Google Scholar : PubMed/NCBI
|
|
23
|
Livak KJ and Schmittgen TD: Analysis of
relative gene expression data using real-time quantitative PCR and
the 2(-Delta Delta C(T)) method. Methods. 25:402–408. 2001.
View Article : Google Scholar
|
|
24
|
Shi Z, Gan G, Xu X, Zhang J, Yuan Y, Bi B,
Gao X, Xu P, Zeng W, Li J, et al: Kynurenine derivative 3-HAA is an
agonist ligand for transcription factor YY1. J Hematol Oncol.
14:1532021. View Article : Google Scholar : PubMed/NCBI
|
|
25
|
Kong Q, Liang Q, Tan Y, Luo X, Ling Y, Li
X, Cai Y and Chen H: Induction of ferroptosis by SIRT1 knockdown
alleviates cytarabine resistance in acute myeloid leukemia by
activating the HMGB1/ACSL4 pathway. Int J Oncol. 66:22025.
View Article : Google Scholar
|
|
26
|
Zhang X, Wu H, Niu J, Hu Y, Zhang W, Chang
J, Li L, Zhu J, Zhang C and Liu M: A novel mitochondria-related
gene signature in esophageal carcinoma: Prognostic, immune and
therapeutic features. Funct Integr Genomics. 23:1092023. View Article : Google Scholar
|
|
27
|
Trezeguet V, Fatrouni H and Merched AJ:
Immuno-metabolic modulation of liver oncogenesis by the tryptophan
metabolism. Cells. 10:34692021. View Article : Google Scholar : PubMed/NCBI
|
|
28
|
Fiore A and Murray PJ: Tryptophan and
indole metabolism in immune regulation. Curr Opin Immunol. 70:7–14.
2021. View Article : Google Scholar : PubMed/NCBI
|
|
29
|
Cervenka I, Agudelo LZ and Ruas JL:
Kynurenines: Tryptophan's metabolites in exercise, inflammation and
mental health. Science. 357:eaaf97942017. View Article : Google Scholar
|
|
30
|
Krishnamurthy S, Gilot D, Ahn SB, Lam V,
Shin JS, Guillemin GJ and Heng B: Involvement of kynurenine pathway
in hepatocellular carcinoma. Cancers (Basel). 13:51802021.
View Article : Google Scholar : PubMed/NCBI
|
|
31
|
Lai Q, Wu L, Dong S, Zhu X, Fan Z, Kou J,
Liu F, Yu B and Li F: Inhibition of KMO ameliorates myocardial
ischemia injury via maintaining mitochondrial fusion and fission
balance. Int J Biol Sci. 19:3077–3098. 2023. View Article : Google Scholar : PubMed/NCBI
|
|
32
|
Chen B, Xie K, Zhang J, Yang L, Zhou H,
Zhang L and Peng R: Comprehensive analysis of mitochondrial
dysfunction and necroptosis in intracranial aneurysms from the
perspective of predictive, preventative and personalized medicine.
Apoptosis. 28:1452–1468. 2023. View Article : Google Scholar : PubMed/NCBI
|
|
33
|
Wang Y, Bai Y, Cai Y, Zhang Y, Shen L, Xi
W, Zhou Z, Xu L, Liu X, Han B and Yao H: Circular RNA SCMH1
suppresses KMO expression to inhibit mitophagy and promote
functional recovery following stroke. Theranostics. 14:7292–7308.
2024. View Article : Google Scholar : PubMed/NCBI
|
|
34
|
Liu ZQ, Ciudad MT and McGaha TL: New
insights into tryptophan metabolism in cancer. Trends Cancer.
11:629–641. 2025. View Article : Google Scholar : PubMed/NCBI
|
|
35
|
Xue C, Gu X, Zheng Q, Shi Q, Yuan X, Chu
Q, Jia J, Su Y, Bao Z, Lu J and Li L: Effects of 3-HAA on HCC by
regulating the heterogeneous macrophages-A scRNA-Seq analysis. Adv
Sci (Weinh). 10:e22070742023. View Article : Google Scholar : PubMed/NCBI
|
|
36
|
Gan G, Shi Z, Shangguan C, Zhang J, Yuan
Y, Chen L, Liu W, Li B, Meng S, Xiong W and Mi J: The kynurenine
derivative 3-HAA sensitizes hepatocellular carcinoma to sorafenib
by upregulating phosphatases. Theranostics. 11:6006–6018. 2021.
View Article : Google Scholar : PubMed/NCBI
|
|
37
|
Gan G, Shi Z, Liu D, Zhang S, Zhu H, Wang
Y and Mi J: 3-hydroxyanthranic acid increases the sensitivity of
hepatocellular carcinoma to sorafenib by decreasing tumor cell
stemness. Cell Death Discov. 7:1732021. View Article : Google Scholar : PubMed/NCBI
|
|
38
|
Pan X, Wang W, Wang Y, Gu J and Ma X: M2
macrophage-secreted KYNU promotes stemness remodeling and malignant
behavior in endometrial cancer via the SOD2-mtROS-ERO1alpha-UPR(ER)
axis. J Exp Clin Cancer Res. 44:1932025. View Article : Google Scholar
|
|
39
|
Ruan Q, Peng Y, Yi X, Yang J, Ai Q, Liu X,
He Y and Shi Y: The tryptophan metabolite 3-hydroxyanthranilic acid
alleviates hyperoxia-induced bronchopulmonary dysplasia via
inhibiting ferroptosis. Redox Biol. 82:1035792025. View Article : Google Scholar : PubMed/NCBI
|
|
40
|
Lee SO, Li X, Khan S and Safe S: Targeting
NR4A1 (TR3) in cancer cells and tumors. Expert Opin Ther Targets.
15:195–206. 2011. View Article : Google Scholar : PubMed/NCBI
|
|
41
|
Wang Y, Li N, Guan W and Wang D:
Controversy and multiple roles of the solitary nucleus receptor
Nur77 in disease and physiology. FASEB J. 39:e704682025. View Article : Google Scholar : PubMed/NCBI
|
|
42
|
Chen QT, Zhang ZY, Huang QL, Chen HZ, Hong
WB, Lin T, Zhao WX, Wang XM, Ju CY, Wu LZ, et al: HK1 from hepatic
stellate cell-derived extracellular vesicles promotes progression
of hepatocellular carcinoma. Nat Metab. 4:1306–1321. 2022.
View Article : Google Scholar : PubMed/NCBI
|
|
43
|
Bian XL, Chen HZ, Yang PB, Li YP, Zhang
FN, Zhang JY, Wang WJ, Zhao WX, Zhang S, Chen QT, et al: Nur77
suppresses hepatocellular carcinoma via switching glucose
metabolism toward gluconeogenesis through attenuating
phosphoenolpyruvate carboxykinase sumoylation. Nat Commun.
8:144202017. View Article : Google Scholar : PubMed/NCBI
|
|
44
|
Yang H, Nie Y, Li Y and Wan YJ: ERK1/2
deactivation enhances cytoplasmic Nur77 expression level and
improves the apoptotic effect of fenretinide in human liver cancer
cells. Biochem Pharmacol. 81:910–916. 2011. View Article : Google Scholar : PubMed/NCBI
|
|
45
|
Fu R, Ling D, Zhang Q, Jiang A and Pang H:
Harnessing Nur77's mitochondrial apoptotic pathway: A promising
therapeutic strategy for targeted disease intervention. Biomed
Pharmacother. 187:1180912025. View Article : Google Scholar : PubMed/NCBI
|
|
46
|
Ye H, Lin J, Zhang H, Wang J, Fu Y, Zeng
Z, Zheng J, Tao J and Qiu J: Nuclear receptor 4A1 regulates
mitochondrial homeostasis in cardiac post-ischemic injury by
controlling mitochondrial fission 1 protein-mediated fragmentation
and parkin-dependent mitophagy. Int J Biol Sci. 21:400–414. 2025.
View Article : Google Scholar : PubMed/NCBI
|
|
47
|
Koenis DS, Evers-van Gogh IJA, van Loenen
PB, Zwart W, Kalkhoven E and de Vries CJM: Nuclear receptor Nur77
and Yin-Yang 1 synergistically increase mitochondrial abundance and
activity in macrophages. FEBS Lett. 598:1715–1729. 2024. View Article : Google Scholar : PubMed/NCBI
|
|
48
|
Yin S, Zhai Y, Song R, Wu J, Zhang Y, Yu
M, Ma H, Shen M, Lai X, Jin W, et al: PARL stabilizes mitochondrial
Bcl-2 via Nur77-mediated scaffolding as a therapeutic strategy for
Parkinson's disease. Cell Death Dis. 16:7002025. View Article : Google Scholar : PubMed/NCBI
|