Introduction
Oral submucous fibrosis (OSF) is a subtle chronic
disease involving the oral cavity and sometimes the pharynx. It
predominantly arises in India and South East Asia exhibiting an
incremental prevalence over the past four decades from 0.03 to
6.42% (1). It has the potential to
transform into head and neck squamous cell carcinoma (HNSCC) with a
rate of 2-8% (2). Thus, early
diagnosis of this potentially malignant disorder would be very
effective for prognosis as well as treatment. The
pathophysiological consequences of the disease begin with a
juxta-epithelial inflammatory response leading to the formation of
vesicles and fibro-elastically altered lamina propria, and finally
resulting in epithelial atrophy causing oral mucosa stiffness,
trismus and eating inability. This is evident from the
juxta-epithelial inflammatory reaction followed by immediate
fibrotic contraction (3). The
emerging stiffness in oral mucosa and other deep tissues gradually
confines mouth opening and tongue protrusion, causing eating,
swallowing and speaking predicaments. However, epithelial atrophy
is a more pronounced feature of the leading stage of the disease.
Molecular pathogenesis of OSF include epithelial-mesenchymal
transition (EMT), extracellular matrix (ECM) remodeling and
fibroblast changes, escalated expression of growth factors and
inflammatory cytokines (3). Areca
nut alkaloid arecoline is defined as the causative factor of OSF
(4). Traditionally, OSF medications
included therapies that are empirical and symptomatic in nature.
Mostly, combined drug treatment is performed but based on the
clinical staging, physical therapy and/or surgery may be added to
drug therapy (5).
Several attempts have been made to unravel the
molecular mechanisms behind the disease. But, to uncover the
complete mechanism, a greater understanding of differential gene
expression between normal and diseased tissues is required. Khan
et al reported the role of two biomarkers, BMP7, and TGF-β
in the pathogenesis of OSF along with their validation (6). Yang et al (7), found upregulation of type I plasminogen
activator inhibitor in OSF specimens which they validated by RT-PCR
and western blot validation. Moreover, gene expression profiling
experiments are restricted by individual analysis approaches using
a small number of samples and hence are not very reliable (8). Hence, meta-analysis may be the ultimate
solution to all these problems. It is a robust analytical and
statistical tool that improvises the statistical significance of
result by merging the results of several studies across the same
platform. Meta-analysis of OSF datasets covers limitations of
individual expression profiling since its statistical power detects
consistent changes across the multiple datasets. Another, the
collection of genes working in a coordinated fashion are
responsible for the progression of any disorder rather than a
single gene. Identification of the highly co-expressed genes and
elucidation of their biological significance is the most alluring
topic in the field of network biology. Network biology is an area
where we represent any complex system in terms of graph (network).
The network consists of nodes and edges (the connection between
nodes). In this case, the nodes are the genes and their connection
depend on the correlation between them. Nowadays, several attempts
have been made to elucidate the biological problem using this
concept of network theory. For example, the Gene Co-expression
Networks (GCN) assist to identify dense communities or functional
gene modules (9). The modules and
their key genes may be involved in vital pathways and thereby act
as a suitable biomarker for early diagnosis (10). Mahapatra et al (11), adopted a dense sub graph-based
methodology to find the putative genes from microarray data. Their
proposed setup discovers highly co-expressed gene modules and
further amalgamates it with protein-protein interaction (PPI) to
find strongly connected modules. Lin et al (12), also identified FN1 and CCNA2 as
important genes via network-based module analysis in oral squamous
cell carcinoma (OSCC) from microarray datasets. Shah and Braun
(13), introduced a tool named as
GeneSurrounder that discovers genes by combining gene expression
data and pathway network information. Although Pant et al
(14), reported role of important
genes in the manifestation of OSF by treating the hGF cells with
areca nut (5H), TGF-β (T), and areca nut with TGF-β (5H+T) followed
by pathway analysis and qPCR respectively. Our study emphasized on
screening of unique signature genes associated with OSF progression
via rigorous statistical analysis and network-based module approach
followed by functional enrichment analysis. In this study, we
assumed that the pathogenesis of OSF is occurred by the
perturbation of intercellular and intracellular connections of
molecules. Overall the molecular mechanism is very complex in
nature. To solve this problem, we adopted the well-established
network-based approach in the field of biological science, weighted
gene co-expression network analysis (WGCNA) to identify groups of
highly co-expressed (modules) genes associated to OSF. The
differentially expressed genes (DEGs) were obtained from the
meta-analysis of gene expression data. A total of 4 significant
modules were discovered which was followed by the pathway and
functional enrichment analysis for each module. The first module
was enriched in immune response and Phagosome pathway (hsa04145),
while the second module was enriched in muscle structural
development and muscle contraction (R-SHA-397014) pathway. These
results showed high relevancy with the progression events of
OSF.
Further, we analyzed that the highly co-expressed
module leads to the identification of a potential biomarker for OSF
that will help to understand the mechanism of OSF. This analysis
comprised intersection from four gene subsets namely Set-A, B, C
and D of each module. Set-A was based on the PPI centrality
measures of corresponding module genes. Set-B was based on
significantly enriched Gene Ontology (GO) terms, Set-C was based on
highly correlated eigengene (biologically significant gene within
the module) and Set-D was based on highly significant functional
enrichment of whole DEGs. There were 47 unique signature genes
filtered from all four modules using this newly developed filtering
criterion.
Finally, we suggested that KLF6 and SPOCK1 were
found to be associated with significantly enriched GO terms and
pathways such as immune response and muscle contraction, making
them the most promising signature genes. Belonging to the largest
two modules, both the genes had a considerably high combined effect
size (ES) score and helped to drive EMT: A major event activated
during OSF progression. Moreover, no clinical data was available
for the patients' samples related to the role of SPOCK1 and KLF6 in
OSF on GEO. Thereby, no further expression analysis was possible
with patients' samples. Although several research articles have
carried out survival analysis for different biomarkers in other
diseases, but no literature is available on such kind of analysis
for OSF.
Materials and methods
Extraction of eligible OSF gene
expression datasets
The gene expression data of OSF was retrieved from
Gene Expression Omnibus (GEO) (15),
an open genomic repository of National Center for Biotechnology
Information (NCBI). The suitable keywords and their mixtures were
used as follows: ‘Oral submucous fibrosis microarray’ for searching
OSF datasets in GEO.
Inclusion criteria
Gene expression datasets related to OSF and normal
tissue samples were taken for the study. The expression datasets
obtained from standard microarray platforms were used for the study
(16).
Exclusion criteria
Datasets with cell line study and without the
inclusion of normal samples were excluded.
Datasets (Series matrix files) with accession
numbers GSE20170 and GSE64216 were retrieved based on platforms
GPL6480 Agilent and GPL10558 Illumina, respectively. The dataset
with GSE64216 had 8 samples (2 normal and 6 OSF cases) and GSE20170
had 10 OSF tissues against 8 pooled normal tissues.
Individual study analysis
HGNC (HUGO Gene Nomenclature Committee) gene
symbol(s) (17) were allotted to
each probe in the series matrix expression file based on the
respective platform type. This was performed using several key
tools and databases such as Synergizer (18), gprofiler (19), GEO2R, AbIDconvert (20), bioDBnet:db2db (21), DAVID (22), omniBiomarker (23), NCBI Entrez Browser (24) and Ensembl 92 Genome Browser (25). Duplicates for a given gene symbol
were removed by averaging the expression values from various probes
corresponding to the same gene (16). Computation of P-values in Illumina
dataset was done utilizing the two-sample t-test function
mattest (MATLAB R2018a) between normal and OSF expression
level for each gene. For Agilent dataset, one-sample t-test
function ttest (MATLAB R2018a) was used for P-value
computation across all the samples because this dataset had pooled
expression levels of OSF vs. normal tissues respectively.
Meta-analysis of OSF datasets
Common genes between both datasets were found with
intersect function (MATLAB R2018a) followed by the combined
P-value computation based on Fisher's χ2-based method
(26). Expression data corresponding
to common genes was used for computing z-score, z-difference,
z-ratio, combined ES score and fold change (FC). To screen
significant genes, a two-step screening process was used. In
step-I, a gene is differentially expressed if FC >1.5 and
P-value <0.05(27). In step-II,
z-ratio of ±1.96 is regarded as a significant threshold to screen
final DEGs as they are in the non-rejection region at significance
level α=0.05(28). For filtering
upregulated and downregulated genes from DEGs, z-score >0.5 and
FDR <0.05 and z-score <-0.5 and FDR <0.05 was used as the
preferred threshold, respectively (29).
Weighted gene co-expression network
construction and module detection
Correlation among expression level of genes along
with all the diseased sample tissues was used to know their
functionality. The network construction is conceptually straight
forward and thus it is easy to know the nodes and their
connections. In our case, nodes of the network are genes and two
nodes are connected to each other if they are co-expressed across
all the tissue samples. Based on the correlation coefficient or
other hard threshold values, it is difficult to infer whether two
genes are correlated or not. Hence, to accomplish this, there has
to be a soft threshold value driving the absolute value of the
correlation coefficient and following the network scale-free
property (30). In this context,
WGCNA developed by Steve Horvath is of relevance. This is a
complete package suite in R being utilized for constructing
a weighted network and discovering modules of highly correlated
genes (31). Designing a weighted
co-expression gene network depends strongly on the value of the
soft threshold power, β to which co-expression similarity is raised
to compute adjacency. Function pickSoftThreshold (R 3.5.0)
assists in selecting a proper β value. For choosing the best value
of β, R2 is the criterion to affirm the fitness of
co-expression network with scale-free property (generally,
R2>0.80). We considered the best value of β when the
relation between R2 and β reached at saturation
(32). To minimize the impact of
noise and errors, we transform the adjacency into topological
overlap Matrix (TOM). Computation of the corresponding
dissimilarity is performed utilizing hierarchical clustering,
thereby producing dendrogram of genes. Identification of individual
branches (cutting the branches off the dendrogram) is the main
ideology behind module identification. dynamicTreeCut (R
3.5.0) function distinguishes modules with very similar expression
profiles and as their genes are co-expressed, it is reasonable to
merge such modules. TOM plot enables to visualize a weighted gene
network where every row and column correspond to a single gene
representing adjacencies.
Pathway and functional enrichment
analysis
To gain insights into the biological role of module
genes, GO term enrichment and pathway analysis was done. Functional
enrichment provides a common descriptive framework, functional
annotation, and classification to analyze the gene datasets
(33). The GO term enrichment
analysis was performed using DAVID 6.8 (Database for Annotation,
Visualization, and Integrated Discovery) web-based annotation tool
(34,35) and ToppFun web-based application
(36). We classified the module
genes into different functional categories of biological process
(BP) and molecular function (MF) with a significance threshold of
P-value <0.05 based on the Bonferroni correction method. Top 20%
of enriched GO terms (BP and MF) were filtered to select
significantly enriched GO terms. The pathway enrichment analysis
for each module was performed using WebGestalt 2017 (WEB-based Gene
Set Analysis Toolkit) web tool (37)
and ToppFun. Both of them integrated information from different
sources like PANTHER 11 (Protein ANalysis THrough Evolutionary
Relationships) (38), KEGG (Kyoto
Encyclopedia of Genes and Genomes) (39), BioCarta (40) and Reactome (41), respectively. Top 20% of enriched
pathways were filtered to select significantly enriched pathways at
a significance threshold of P-value <0.01 based on the
Bonferroni correction method.
Signature gene identification
For the identification of signature genes, three
gene sub-sets (pre-filtering sets) from each module, namely Set-A,
Set-B, Set-C and a post-filtering set (Set-D) were defined as
follows. Then, we filtered only the genes which were common across
all the four sets. This was performed by Venny 2.1.0 (http://bioinfogp.cnb.csic.es/tools/venny/index.html).
Engineering of pre-filtering SET-A
(based on centrality measures)
PPI network for genes of the corresponding module
was constructed from the STRING v10.5 database (42). The distribution of these genes was
checked in the top 15% ranked genes by each centrality measure
(Degree, Stress, Eccentricity, Radiality, Closeness and
Betweenness). These centrality rankings were computed using
software Cytoscape 3.6.1(43).
Unique pooled genes consist of unique genes from all the listed
centralities combined at 15% cutoff and were conserved for
Set-A.
Engineering of pre-filtering SET-B
(based on significant GO enrichment analysis)
There are many GO terms with false positives and
thus a criterion is required to lessen the entire quantity of GO
terms to increment prediction efficiency. The significantly
enriched GO terms were attained with P-value <0.001 from DAVID
(level 5) database. Out of these, the terms that were associated
with fewer than 3 and greater than 50 genes (3 < = G< = 50, G
= quantity of genes) were removed to eliminate non-specific ones
(44). Genes associated with the
remaining significant GO terms were conserved for Set-B.
Engineering of pre-filtering SET-C
(based on eigengene correlation)
Singular value decomposition (SVD) assists in
factorization of a matrix and let the vertices to be symbolized as
vectors. It induces linear transformation of expression data from
genes x arrays space into compact ‘eigengenes’ x ‘eigenarrays’
space (45). Here, the data are
diagonalized, such that every eigengene is expressed solely in the
corresponding eigenarray, with relative ‘eigenexpression’ values
describing their comparative significance. Using SVD function
(MATLAB), the module expression data is decomposed into three
resultant matrices namely U, D and V. The first column of V is
known as the module eigengene or first principal component
(46) and is regarded as the most
representative or influenced gene of the whole module. Positive
correlation of this vector with the expression values across module
genes was carried out. Highly correlated genes (correlation
coefficient >=0.95) were conserved for Set-C.
Engineering of SET-D (post-filtering
set)
The present study can be divided into two parts,
where we studied the up and downregulated genes in the first part
(methodology described in section ‘Materials and methods’) and in
the second part, we studied module identification of the DEGs.
Set-D was constructed from first part of the study by applying
Set-B criterion on it, whereas, Set-A, B, C have been constructed
from second part of the study.
The reason for formulation of Set D can be
elaborated in the following manner: suppose M and N are two sets of
genes where M is a subset of N. Another assumption is that J and K
set of genes were screened after applying criterion of Set-B on M
and N respectively. Then, J may not necessarily be the subset of K.
Hence, Set-D was important for finding the functionally significant
genes in the set of up and downregulated DEGs which were identified
in first part of the study.
Results
Individual analysis
In the present study, we gathered a total of two
gene expression datasets in accordance with the exclusion and
inclusion criteria specified. Then, we performed mapping of probe
IDs to HGNC gene symbol(s) for both datasets followed by removal of
duplicate gene symbols. From this, we got a total of 27800 and
30864 HGNC gene symbols in Illumina and Agilent expression datasets
respectively. Computation of P-values from expression values of
both datasets was performed using the appropriate statistical
t-test. These P-values were used for further DEGs screening.
Meta-analysis of OSF datasets
A total of 17,792 common genes across both the
datasets were derived and combined P-value of these genes was
computed using fisher's χ2-based method. Finally, 1,176
DEGs were screened after applying the two-step screening process.
In step-I, 1,219 genes were obtained out of which 43 genes were
removed based on step-II screening threshold to yield the final
DEGs. Filtering of 238 upregulated and 902 downregulated genes
using appropriate z-score threshold was performed.
Co-expression network construction and
module detection
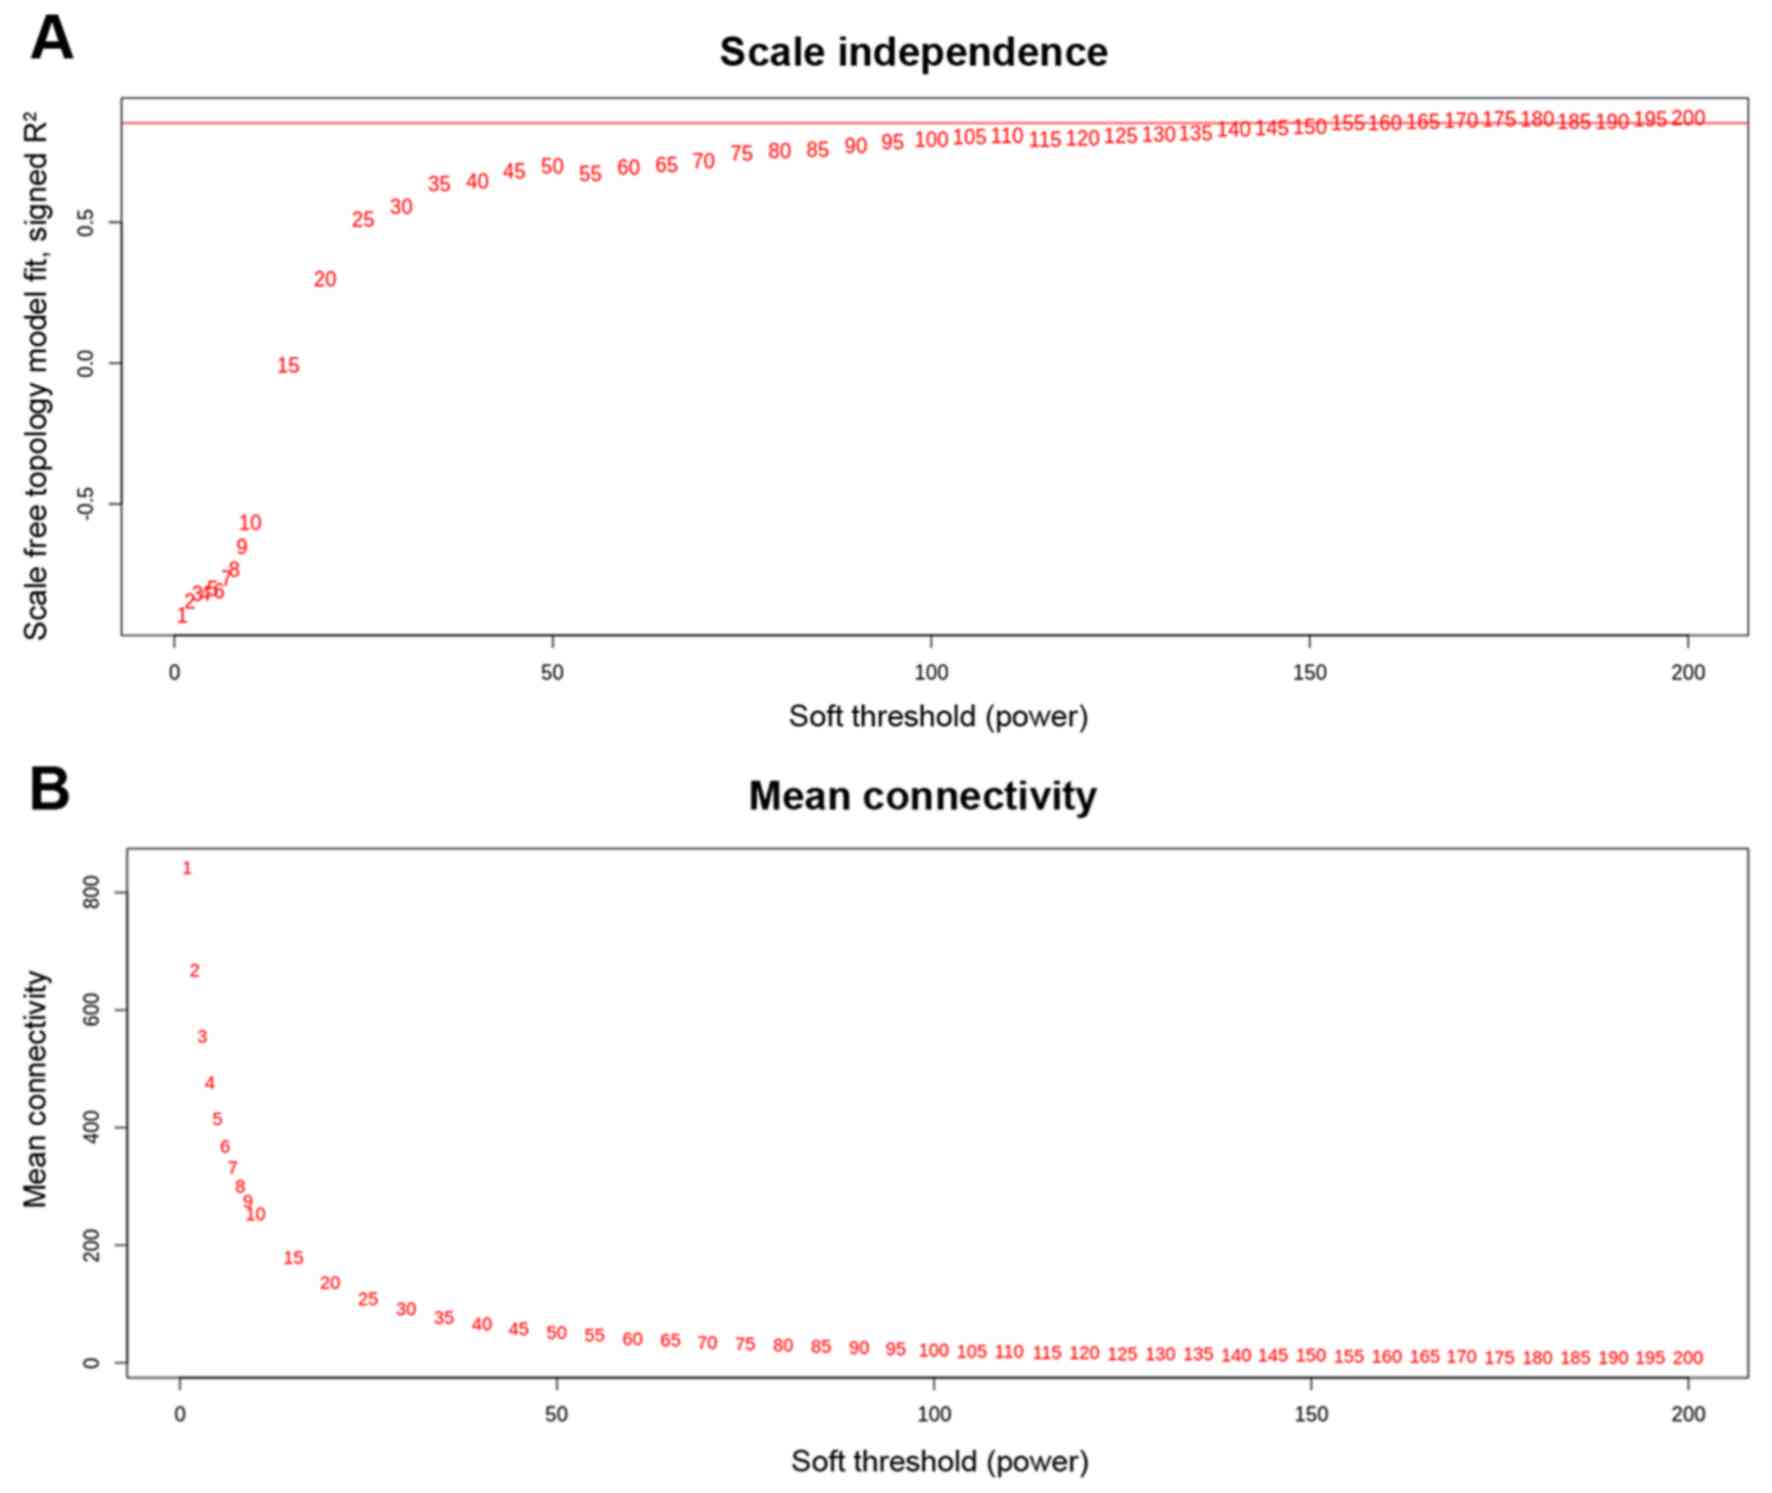
After using WGCNA as specified in the materials and
methods section for calculating the soft threshold (β), we found an
interesting scenario as shown in Fig.
1. We can see in the left and right panel of the Fig. 1 that the curve trades off at β=155
with R2=0. 85300, hence we utilized the power (s,β=155)
to construct adjacency matrix of the weighted network. Then we
computed TOM which is a biologically meaningful measure of node
similarity, and the genes were clustered hierarchically utilizing
1-TOM as the distance measure. The modules were identified by
picking a height cut-off of 0.90 (as guided by the TOM plot) for
the resulting dendrogram (Fig. 2A
and B). Highly analogous modules
were characterized by clustering and merging together (Fig. 2C). Finally, four significant modules
were identified and classified according to the specific
color-coding scheme, each of which had co-ordinately expressed
genes (Table I). TOM plot of the
weighted network is shown in Fig. 2D
for all 1,176 genes and it depicts that modules are highly robust
with respect to the network construction method utilized. Out of
1,176 genes, module-1 had the highest number of genes, i.e., 478,
module-2 had almost half of module-1, similarly, module-3 and
module-4 had 160 and 91 genes, respectively (a summary can be seen
in Table I). Remaining 176 genes
were not able to significantly correlate with any of these modules.
The list of genes with belongingness to different modules is shown
in Table SI.
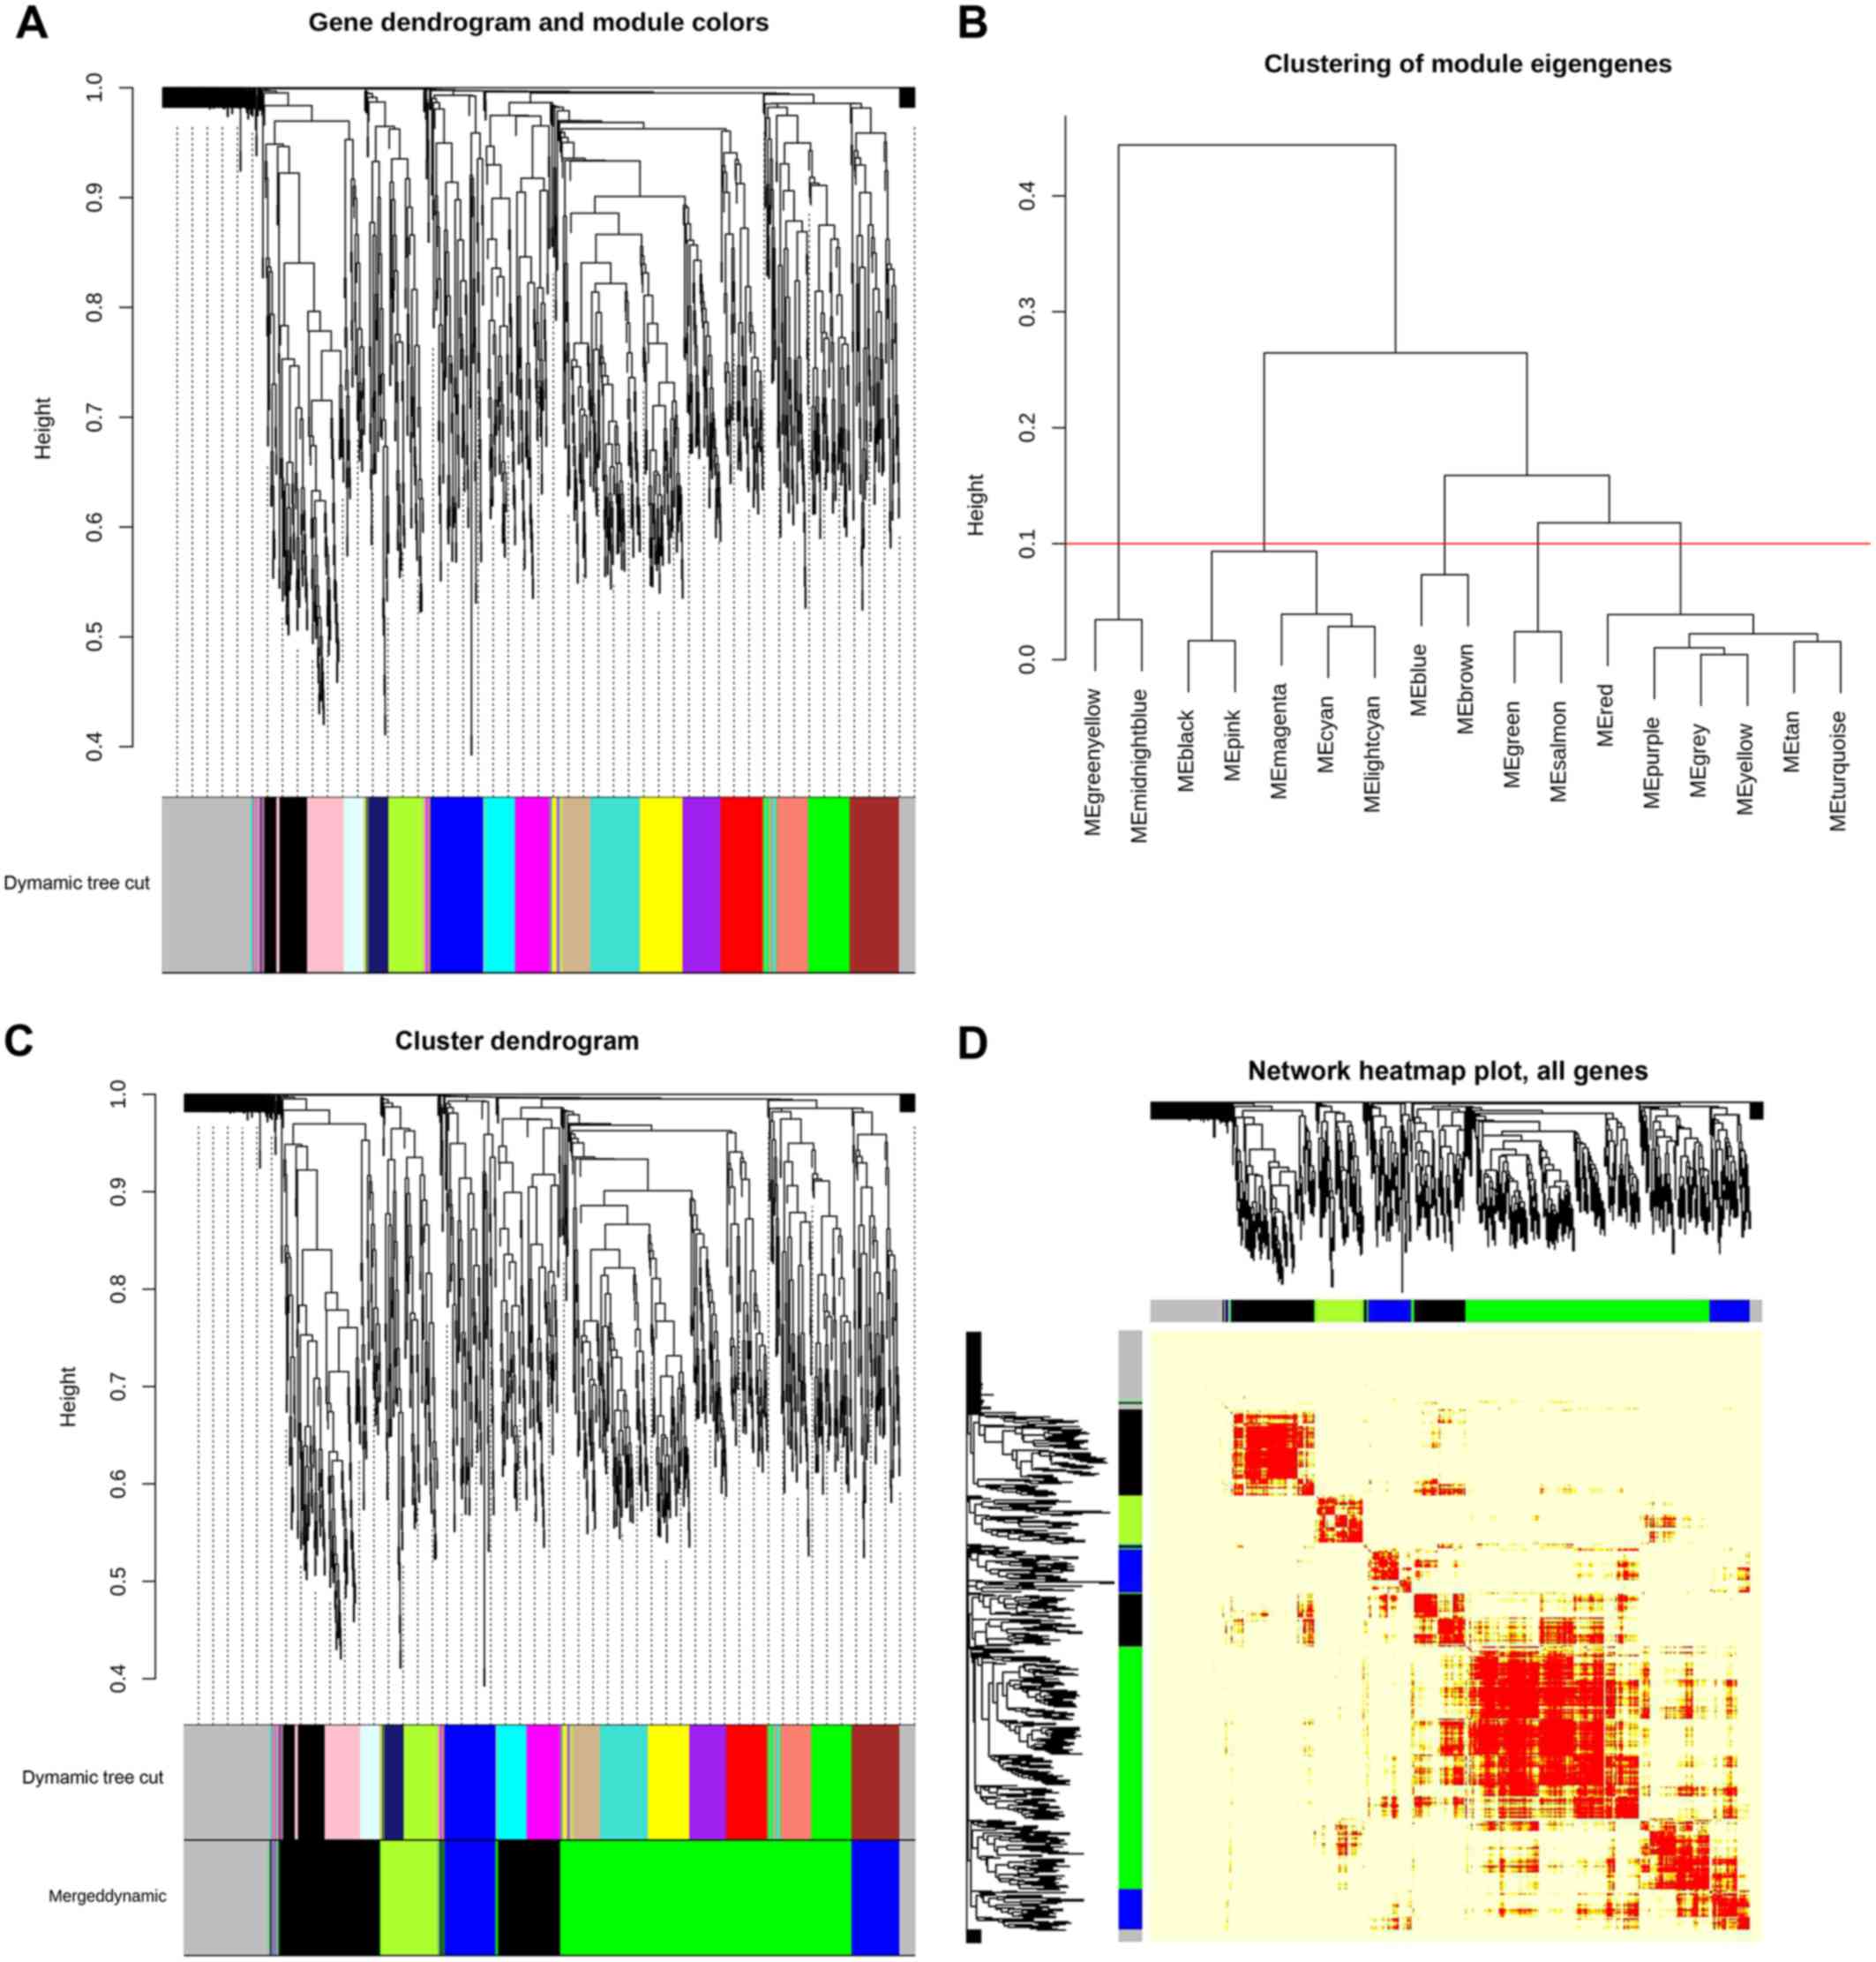 | Figure 2.WGCNA co-expression network and
module detection analysis. (A) represents clustering dendrogram of
genes with dissimilarity based on topological overlap. A total of
16 distinct modules are presented with different assigned colors in
the horizontal bar below the dendrogram, with grey representing
unassigned genes in any module. (B) Hierarchical clustering of 16
module eigengenes. The distance (1-TOM) is denoted by the y-axis
and different MEs are denoted by the x-axis (labled as color with
ME prefixed in each color module). The horizontal red line
(1-TOM=0.10) depicts the benchmark for defining meta-modules. The
green, blue, black and green-yellow modules illustrate
meta-modules, while grey colored eigengenes were not assigned to
any meta-module. (C) Original and merged co-expression modules with
assigned original module colors and merged module colors. Genes
were clustered based on a dissimilarity measure (1-TOM). The
branches correspond to modules of highly correlated or
interconnected groups of genes. Colors in the horizontal bar depict
the modules before and after merging. Cluster dendrograms of genes
with dissimilarity based on topological overlap is presented above
the modules. A total of 16 original modules were merged to obtain 4
highly significant meta-modules denoted by the colors green, black,
blue and green-yellow. Grey colored modules represent unassigned
genes. (D) Heatmap plot of the weighted gene co-expression network.
The plot indicates the TOM among all genes analyzed. Genes in
columns and their corresponding rows are hierarchically clustered
by cluster dendrograms, which are presented along the top and left
side of the plot. Color-coded module membership is presented with
colored bars (green, black, blue, green-yellow and grey) below and
to the right of dendrograms. Green, black, blue and green-yellow
colors signify the 4 significant meta-modules and grey represents
the insignificant module. Progressively light and darker red colors
in the matrix signify lower and higher overlap among genes. High
co-expression interconnectedness are indicated by progressively
more saturated yellow to red colors. TOM, topological overlap
matrix; ME, module eigengene. |
 | Table ICharacteristics of identified modules
using WGCNA. |
Table I
Characteristics of identified modules
using WGCNA.
| Module no. | Nodes (Genes) | Color coding by
WGCNA |
|---|
| 01 | 478 | GREEN |
| 02 | 271 | BLACK |
| 03 | 160 | BLUE |
| 04 | 91 | GREENYELLOW |
| 05 | INSIGNIFICANT | GREY |
Pathway and functional enrichment
analysis
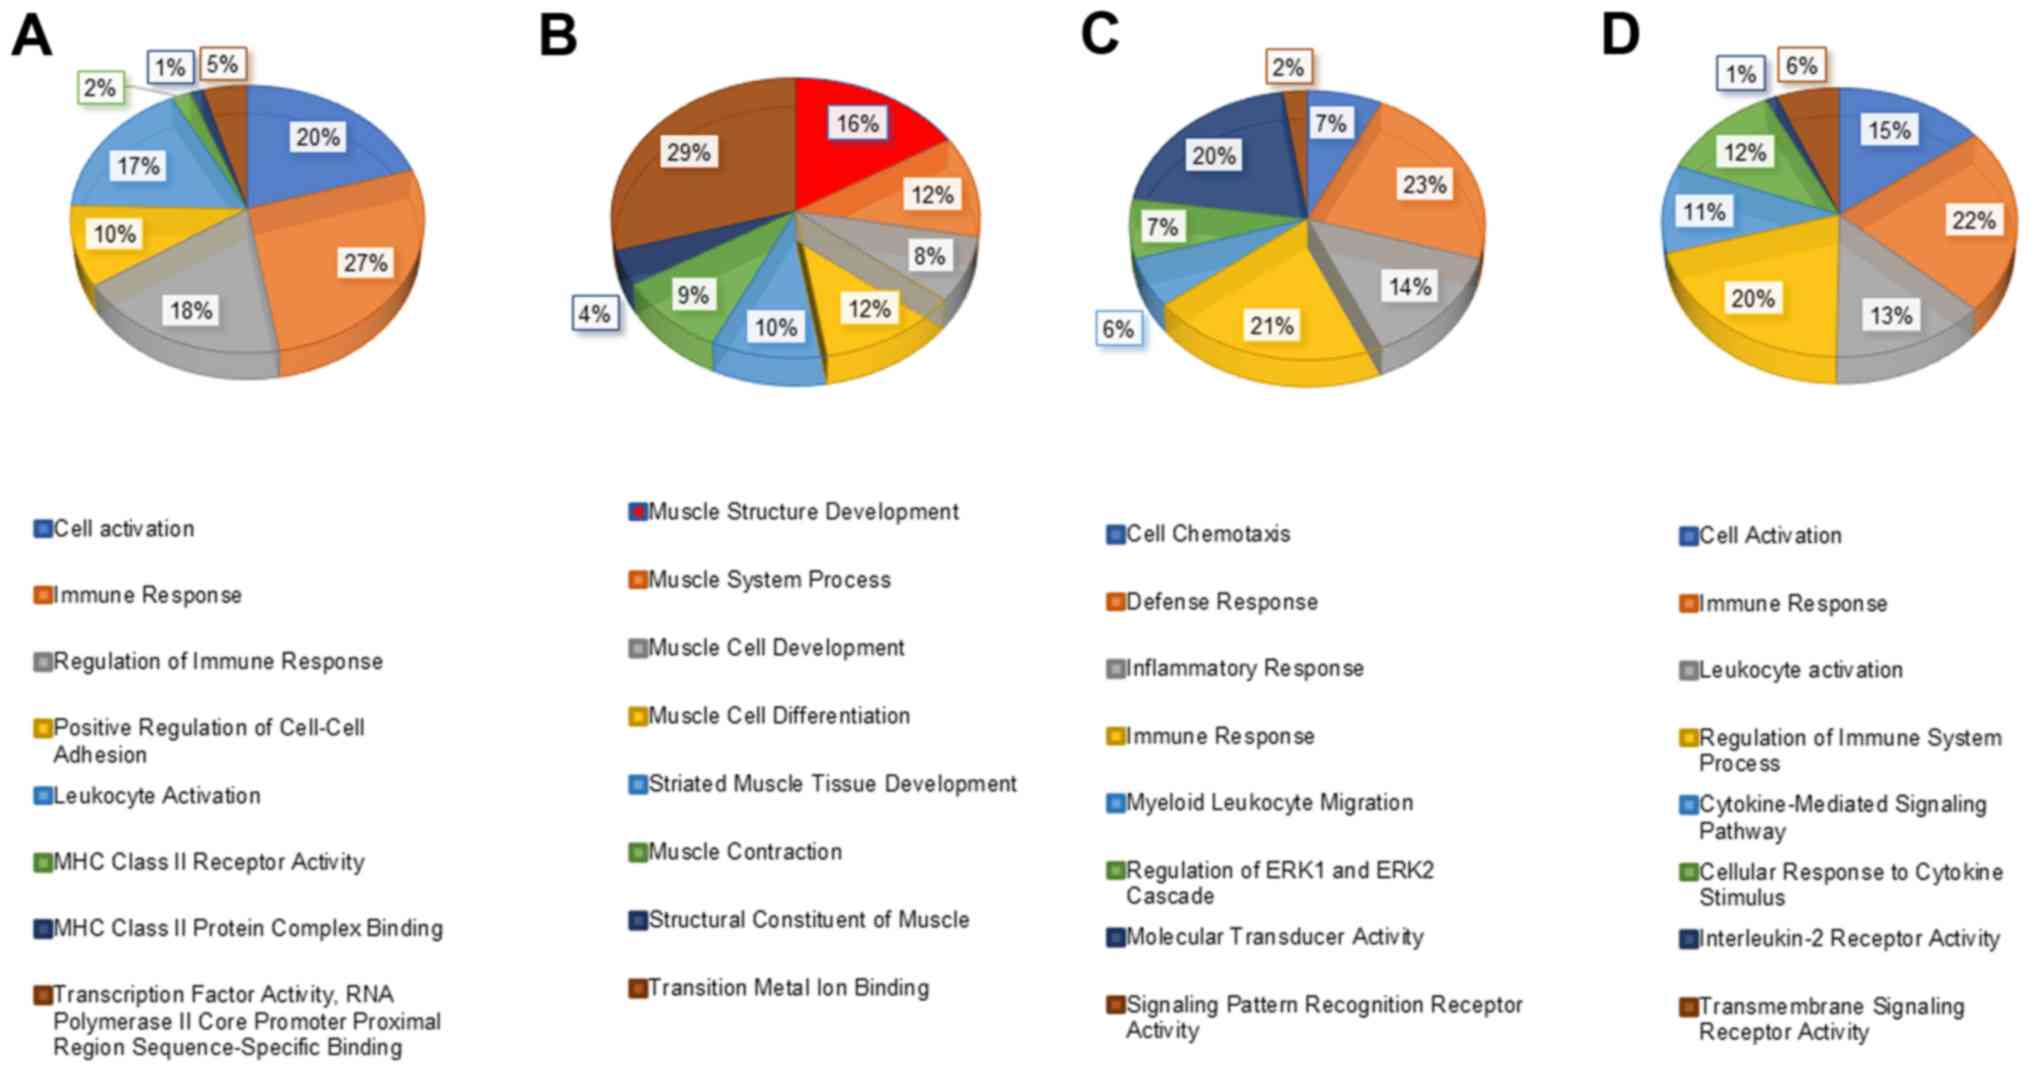
Pathway and GO term enrichment analysis was
performed to characterize the module function. The GO term analysis
(BP & MF) of module-1 genes can be seen in Fig. 3A, which was depicting a large range
of biological functions and highly enriched terms including Immune
Response (GO:0006955; adjacent P-value=3.788E-10) and MHC class II
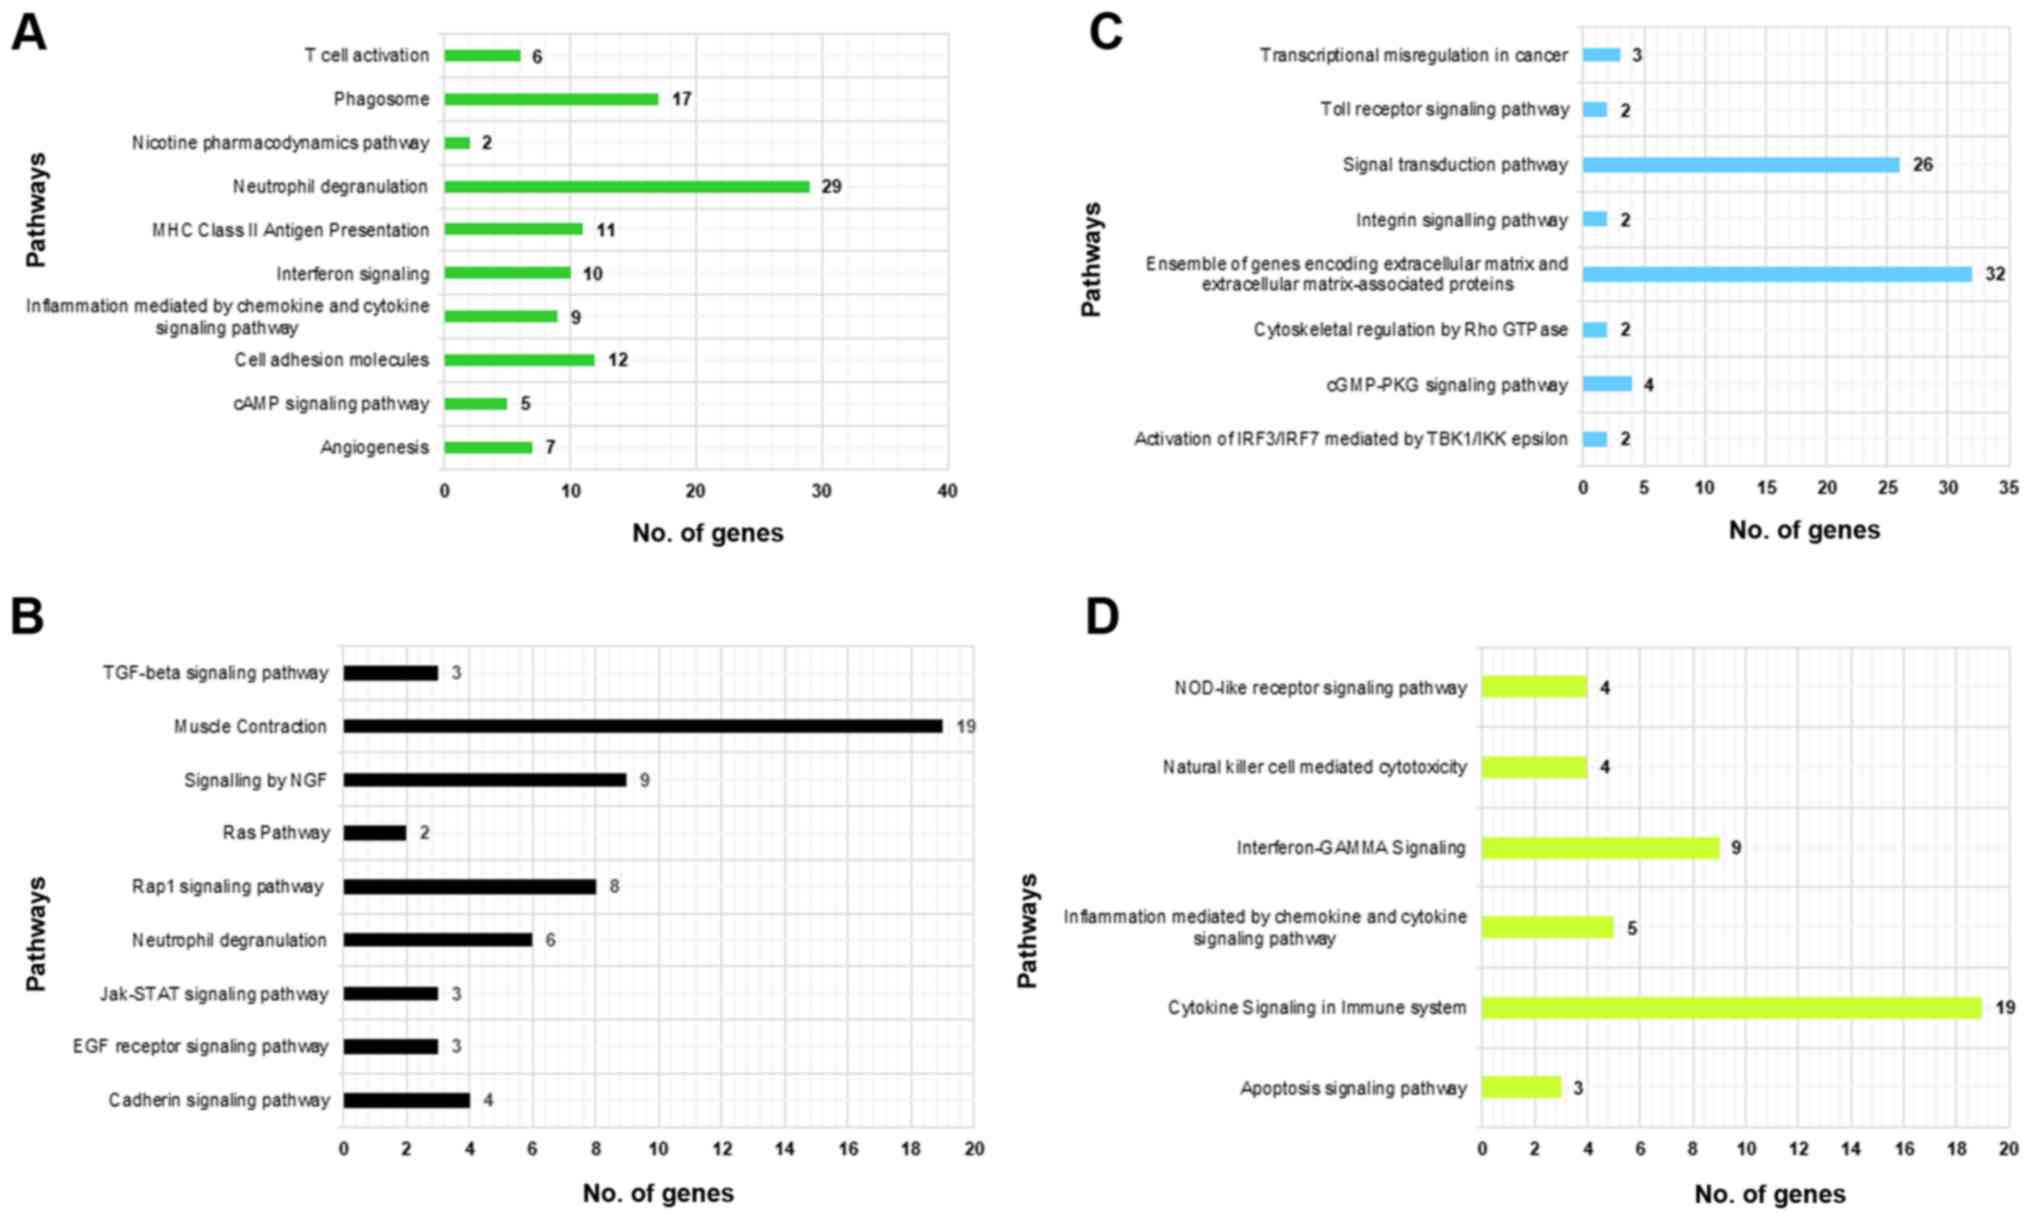
receptor activity (GO:0032395; adjacent P-value=4.00E-03). The most
significantly enriched pathways of module-1 were Phagosome
(hsa04145) and MHC class II antigen presentation (R-HSA-2132295;
Fig. 4A). Highly significantly
enriched terms of module-2 genes were muscle structure development
(GO:0061061; adjacent P-value=3.483E-12) and structural constituent
of muscle (GO:0008307; adjacent P-value=9.212E-08), can be seen in
Fig. 3B. Highly significant enriched
pathways of module-2 genes were muscle contraction (R-HSA-397014)
and neutrophil degranulation (R-HSA-6798695) with a maximum number
of genes being involved in the former pathway (Fig. 4B). Module-3 comprised of highly
significant terms like defense response (GO:0006952; adjacent
P-value=1.248E-05) and dolecular transducer activity (GO:0060089;
adjacent P-value=4.674E-04). Highly significant enriched pathways
of module-3 were ensemble of genes encoding ECM and extracellular
matrix-associated proteins (M5889) and activation of IRF3/IRF7
mediated by TBK1/IKK epsilon (R-HSA-936964) (Figs. 3C and 4C). Genes of module-4 were involved in
immune response (GO:0006955; adjacent P-value=9.770E-18) and
interleukin-2 receptor activity (GO:0004911; adjacent
P-value=4.300E-02). Highly significant pathways of module-4 were
cytokine signaling in the immune system (R-HSA-1280215) and
interferon-GAMMA signaling (R-HSA-877300; Figs. 3D and 4D).
Signature gene identification and
analysis
Pre-filtering Set-A
Significance of a node is governed by each
centrality in a different manner for the network under
consideration. In the present study PPI network for genes of the
corresponding module was constructed from the STRING database and
top 15% genes were ranked by each centrality. Unique pooled genes
from all centralities were reserved for Set-A. The top 15% unique
genes filtered from module-1, module-2, module-3, and module-4 were
63, 22, 15 and 5, respectively.
Pre-filtering Set-B
DAVID (level 5) was used for the identification of
significantly enriched (P-value <0.001) GO terms for each
module. If a term is associated with ≤3 and ≥50 genes, then it was
removed and the genes associated with rest of the terms were
reserved for Set-B. Using this criterion, we found 240, 159, 122,
and 64 genes in module-1, module-2, module-3, and module-4,
respectively.
Pre-filtering Set-C
SVD also known as principal component analysis (PCA)
in statistics is a highly robust technique for matrix factorization
and dimensionality reduction. The matrix decomposition using SVD
leads to U, D and V matrices and the columns of U and V are left
and right-singular vectors, respectively. Here, the first column of
V is referred to as the representative eigengene of the module and
its positive correlation with expression values leads to highly
correlated genes for Set-C. The number of highly correlated genes
were 310, 158, 91 and 80 in module-1, module-2, module-3, and
module-4, respectively.
Post-filtering Set-D
The total number of significant and specific GO
terms associated genes filtered from up and downregulated DEGs were
647.
Intersection of pre-filtering sets and
post-filtering set
The summary of filtered genes from each set and
their intersection can be seen in Fig. 5A-D for module-1, module-2,
module-3, and module-4, respectively. Genes common between the
pre-filtering sets (A, B, C) and post-filtering set (D) were
regarded as signature genes. We found a total of 47 genes where 21,
12, 10 and 4 genes were from module-1, module-2, module-3, and
module-4, respectively (Table SII).
Out of these, we listed the top 10 upregulated and 10 downregulated
genes each based on the combined ES score which can be seen in
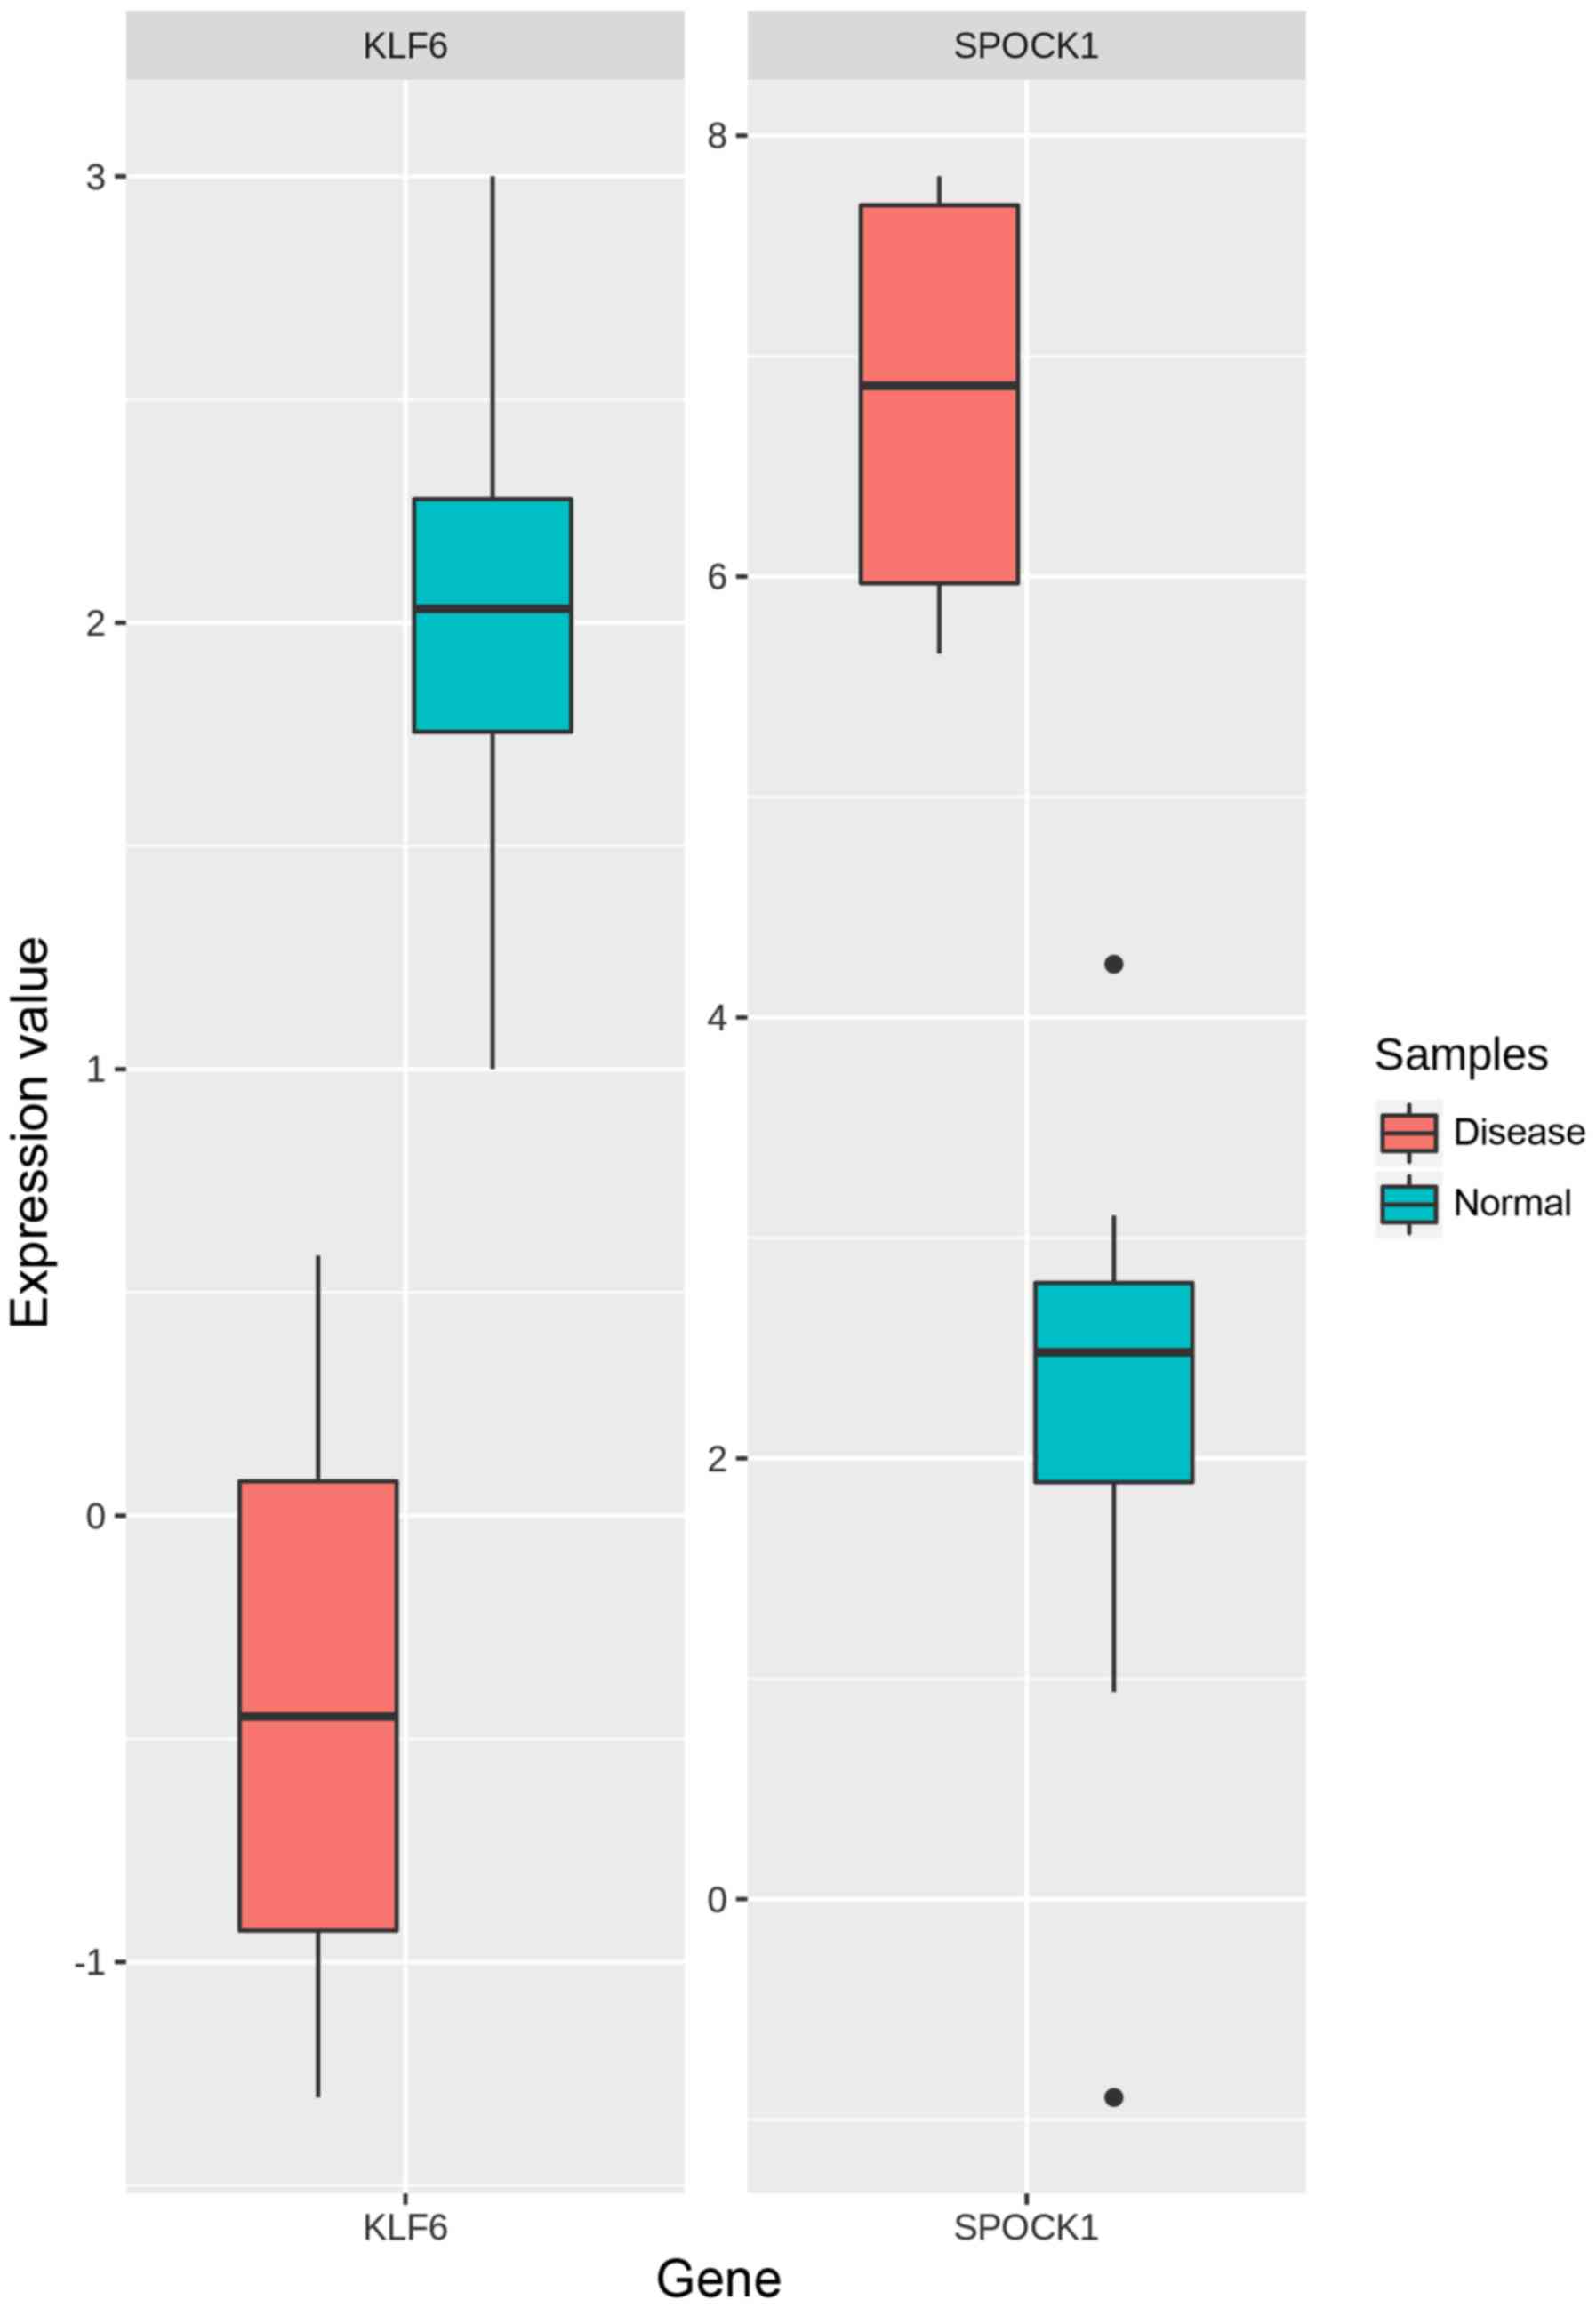
Table II. As SPOCK1 (upregulated)
and KLF6 (downregulated) were involved in significantly enriched
pathways and GO terms, hence they were regarded as the most
promising signature genes. Also, they belonged to the largest two
modules (module-1 and module-2). The box-and-whisker plot for
comparison of KLF6 and SPOCK1 gene expressions in OSF and normal
cases respectively is illustrated in Fig. 6.
| Table IITop 10 upregulated and downregulated
signature genes. |
Table II
Top 10 upregulated and downregulated
signature genes.
| Upregulated
genes | Combined ES
score | Chromosome
(Band) | Downregulated
genes | Combined ES
score | Chromosome
(Band) |
|---|
| CD14 | 1.9460 | 5 (5q31.3) | KLF6 | -0.7532 | 10 (10p15.2) |
| GYG1 | 1.4059 | 3 (3q24) | PODXL | -0.1044 | 7 (7q32.3) |
| ALOX5AP | 0.8693 | 13 (13q12.3) | GNG7 | -0.0608 | 19 (19p13.3) |
| PLAT | 0.3894 | 8 (8p11.21) | TUSC3 | -0.0448 | 8 (8p22) |
| TPP1 | 0.2160 | 11 (11p15.4) | BAG4 | -0.0217 | 8 (8p11.23) |
| OASL | 0.0979 | 12 (12q24.31) | GCNT2 | -0.0167 | 6
(6p24.3-p24.2) |
| SPOCK1 | 0.0901 | 5 (5q31.2) | SCP2 | -0.0043 | 1 (1p32.3) |
| IVD | 0.0382 | 15 (15q15.1) | PODXL2 | 0.0052 | 3 (3q21.3) |
| TINAGL1 | 0.0064 | 1 (1p35.2) | NRXN1 | 0.0064 | 2 (2p16.3) |
| ACAA2 | -0.2064 | 18 (18q21.1) | TNFRSF8 | 0.0070 | 1 (1p36.22) |
Discussion
The present study presents an integrated
meta-analysis of OSF gene expression datasets with the objective of
finding reliable signature genes. We observed a total of 1,176 DEGs
using meta-analysis of 2 OSF datasets and by implying a specific
threshold for filtering. Further, a module-based technique was
adopted to delineate the DEGs into modules. The gene expression
analysis can be done better with the aid of co-expression networks
as it lets for analysis of expression data from a system's
perspective (47). Weighted gene
co-expression network expresses the relation amongst modules as it
preserves the nature of co-expression information. Module detection
techniques are a boon in the analysis of massive gene expression
studies. With the advent of non-overlapping clustering approach,
now there is an ease of rapidly presenting a global portrait of the
dataset, exposing the main expression and functional relevance
amongst the various samples within the dataset (48). And, WGCNA is especially right for
such an analysis, outperforming other clustering techniques on the
majority of datasets. It is an agglomerative hierarchical
clustering technique that enables assembling of functionally
related genes to implicitly detect modules. The most vital factor
on which WGCNA depends is the Pearson's correlation coefficient
that quantifies the extent of linear dependency between the two
expression profiles irrespective of absolute expression level
differences. The whole functional role of a module remains the same
unlike individual gene expression which fluctuates, thereby modules
are considered as stable units in systems biology. Modularity of
the biological system enables to gain an insight into its
components independently and to establish a mutual connection
between modules and genes. It also assists in interpreting the
progression of any disorder in a more elaborate manner (49). Module-based analysis from WGCNA
resulted in the identification of 4 modules (color-coded by green,
black, blue and greenyellow to distinguish them according to their
nodes). Pathway and functional enrichment analysis showed that
genes of module-1 and 2 were involved in the processes and pathways
that correlate with OSF. Hence, both these modules were regarded as
important ones. Module-1 was found to be linked with immune
response and MHC activities, making it a suitable candidate for OSF
pathogenesis. The major role of immune response is the
identification of the foreign antigen. This process will eventually
lead to hyperactivity of B cells and abnormal lymphocyte function.
The upsurge in the levels of IgA, IgM, and IgG is also noticed in
OSF patients (50). OSF has an
association with autoimmunity which may be caused by areca nut
elements. Genes located in the HLA region are significant
determinants of genetic susceptibility in OSF (51). Module-2 is mostly associated with
muscle structure development and muscle-related processes, which in
turn have a sync with OSF. Masseter muscle is the toughest and
largest one of the face. Because of continuous areca nut chewing
for prolonged intervals of time, the masseter muscle becomes a
victim of unnecessary stress. This results in escalated thicknesses
of the muscle causing a major transformation in masseter muscle
fiber size and composition (52).
Restricted mouth opening in OSF cases relies solely not only on
subepithelial fibrosis but also on the degree of muscle
destruction. There is a progressive decline observed in the muscle
fibers from the epithelial surface as the advancement of OSF occurs
(53). Also, features suggestive of
muscle atrophy and necrosis have been demonstrated in moderate and
advanced OSF cases (54). The light
microscopic study of OSF has revealed varying degrees of
alterations involving the muscle fibers as the disease progresses
(55).
The main crux of this whole work remains to be the
identification of potent signature genes and studying their
relevance in OSF progression. For this, we constructed 3 gene
sub-sets (pre-filtering sets) for each module and a post-filtering
set. Biological network comprises some of the crucial genes as they
are involved in regulating the crucial processes. These genes are
often found amongst the disease genes. As the importance of a
protein is not judged in a complex PPI network, therefore the
centrality measures assist in ranking the network components
according to their importance. We calculated six different
centrality measures to assess the importance of a protein in the
PPI network for each module. Prominently, we evaluated the genes
which are ranked (top 15%) higher in the PPI network and has major
importance to the disorder. Biological importance of genes can be
estimated via GO terms to which they were related as it gives
information for protein functions, processes, and localization. To
report genes linked with OSF, significantly enriched GO terms were
characterized, and further pruning of these identified terms
resulted in a set of more enriched terms for each module. To
summarize the expression profile of a module, the module eigengene
needs to be accessed. It is the first right-singular vector of the
standardized module expression data and most influential gene of
whole module. Categorizing the data according to correlations of
genes (and arrays) with eigengenes (and eigenarrays) provides a
summarized snapshot of the gene expression dynamics. SVD or PCA is
a robust and fast matrix factorization algorithm and offers a
beneficial mathematical framework for processing and modeling
genome-wide expression data, where both the operations and
mathematical variables may be allotted biological meaning (45). It can be united with unsupervised
clustering and dimensionality reduction to reveal community
structures of weighted or unweighted, bipartite or unipartite
graphs in a computationally effective manner (56). Intersection amongst all the four sets
revealed 21, 12, 10 and 4 genes from each module respectively. The
results lay a foundation that a blend of GO, network centralities
and eigengene play an important role in the detection of signature
genes. SPOCK1 and KLF6 were found to have a prominent role in the
EMT process-one of the major events of OSF and were regarded as
reliable biomarkers. Location of KLF6 and SPOCK1 genes are on human
chromosomes 10 and 5 respectively.
KLF6 (Kruppel-like factor 6) is a pervasive
transcription factor with several targets and activities and is
highly expressed in skin epithelial cells, lung, thymus, cornea,
testis, lymphocytes and cardiac myocytes. It belongs to a family of
conserved zinc-finger proteins that regulates a number of cellular
events such as cell proliferation, differentiation, apoptosis and
neoplastic transformation (57). It
primarily works by enhancing p21 expression by a pathway
independent of p53, and hence acts as a tumor-suppressor gene
(58). It is downregulated in
several human cancers and its reduced expression has been
correlated with cellular proliferation and poor prognosis in oral
cancer (59). One of the studies has
demonstrated its role in metastasis and EMT (60). Downregulation of KLF6 in our study
suggests its role in the EMT process of OSF. Expression of KLF6
decreases in chronic inflammation which is a common feature in OSF.
It binds to the promoter region of MMP-9 (matrix
metalloproteinase-9) and inhibits its expression in endothelial
cells (61). Expression and activity
levels of MMP-9 was significantly upregulated in primary
keratinocytes derived from healthy gingival epithelium treated with
arecoline (62). MMP-9 also shows
positive stromal expression in OSF cases (63). Thus, targeting KLF6 would be highly
effective in improving the prognosis of OSF.
On the other hand, SPOCK1, an extracellularly
secreted proteoglycan originally called ‘TESTICAN’, as it was first
isolated from human testis (64).
Altered regulation of SPOCK1 has been observed in multiple tissues
and organs, including lymphocytes, brain cartilage, vascular
endothelium and neuromuscular junctions (65-67).
It has been reported to be overexpressed in distinct cancer types.
In addition, SPOCK-1 induces EMT to facilitate cancer cell
migration. EMT plays a role in OSF and its malignant
transformation. During this transition, epithelial cells are
degraded, and they acquire mesenchymal properties, thereby causing
an increase in the expression of mesenchymal markers such as
N-cadherin, snail, and vimentin. Moreover, the glycan portion of
SPOCK1 has an interplay with matrix architecture, growth factors
and chemokines (68). These
properties are utilized by cancer cells to invade tissues and
achieve survival advantage over the organism. Based on our study,
we infer that SPOCK1 can be a crucial gene for early detection of
OSF.
We have identified two putative signature genes,
SPOCK1, and KLF6 which are aberrantly expressed in the case of OSF.
Dysregulation of these signature genes might probably lead to the
development of oral cancer. Thus, more detailed analysis of
mechanisms and pathways associated with these genes would provide
us a deep insight into the process of oncogenesis and would prove
to be an effective guide in designing novel therapeutic strategies
against oral cancer. In this context, the present study provides a
road map leading to a nearly ideal situation where putative results
may be transformed into a robust tool for routine prognosis.
Supplementary Material
List of significant module genes
identified from differentially expressed genes.
Unique signature genes (47) from all
modules with their corresponding ES score.
Acknowledgements
The authors would like to thank Jamia Millia Islamia
for providing infrastructure, journal access and internet facility.
Shweta Arora would like to thank Indian Council of Medical Research
for providing her Senior Research Fellowship.
Funding
The present study was supported by the Science and
Engineering Research Board (grant no. EEQ/2016/000509) and
partially supported by the Department of Biotechnology (grant no.
DBT/PR12828/AAQ/1/622/2015), Government of India.
Availability of data and materials
Data associated with this study is available at Gene
Expression Omnibus (GEO) under the accession numbers GSE20170 and
GSE64216.
Authors' contributions
PS and RD performed statistical analysis. AR and SAr
participated in the literature search. SAl, SP and MAS conceived
the present study and prepared and revised the manuscript. SAr,
SAl, AR, RD and PS designed the present study, critically revised
the discussion and wrote the manuscript. All authors read and
approved the final manuscript.
Ethics approval and consent to
participate
Not applicable.
Patient consent for publication
Not applicable.
Competing interests
The authors declare that they have no competing
interests.
References
|
1
|
Bari S, Metgud R, Vyas Z and Tak A: An
update on studies on etiological factors, disease progression, and
malignant transformation in oral submucous fibrosis. J Cancer Res
Ther. 13:399–405. 2017.PubMed/NCBI View Article : Google Scholar
|
|
2
|
Ray JG, Ranganathan K and Chattopadhyay A:
Malignant transformation of oral submucous fibrosis: Overview of
histopathological aspects. Oral Surg Oral Med Oral Pathol Oral
Radiol. 122:200–209. 2016.PubMed/NCBI View Article : Google Scholar
|
|
3
|
Ekanayaka RP and Tilakaratne WM: Oral
submucous fibrosis: Review on mechanisms of pathogenesis and
malignant transformation. J Carcinog Mutagen, 2013. Available from:
https://www.omicsonline.org/oral-submucous-fibrosis-a-clinico-histopathological-comparative-study-in-population-of-southern-rajasthan-2157-2518-S5-002.php?aid=19130.
|
|
4
|
Prabhu RV, Prabhu V, Chatra L, Shenai P,
Suvarna N and Dandekeri S: Areca nut and its role in oral submucous
fibrosis. J Clin Exp Dent. 6:e569–e575. 2014.PubMed/NCBI View Article : Google Scholar
|
|
5
|
Wollina U, Verma SB, Ali FM and Patil K:
Oral submucous fibrosis: An update. Clin Cosmet Investig Dermatol.
8:193–204. 2015.PubMed/NCBI View Article : Google Scholar
|
|
6
|
Khan I, Kumar N, Pant I, Narra S and
Kondaiah P: Activation of TGF-β pathway by areca nut constituents:
A possible cause of oral submucous fibrosis. PLoS One.
7(e51806)2012.PubMed/NCBI View Article : Google Scholar
|
|
7
|
Yang SF, Wang YH, Su NY, Yu HC, Wei CY, Yu
CH and Chang YC: Changes in prevalence of precancerous oral
submucous fibrosis from 1996 to 2013 in Taiwan: A nationwide
population-based retrospective study. J Formos Med Assoc.
117:147–152. 2018.PubMed/NCBI View Article : Google Scholar
|
|
8
|
Ramasamy A, Mondry A, Holmes CC and Altman
DG: Key issues in conducting a meta-analysis of gene expression
microarray datasets. PLoS Med. 5(e184)2008.PubMed/NCBI View Article : Google Scholar
|
|
9
|
Ruan J, Dean AK and Zhang W: A general
co-expression network-based approach to gene expression analysis:
Comparison and applications. BMC Syst Biol. 4(8)2010.PubMed/NCBI View Article : Google Scholar
|
|
10
|
Wang LX, Li Y and Chen GZ: Network-based
co-expression analysis for exploring the potential diagnostic
biomarkers of metastatic melanoma. PLoS One.
13(e0190447)2018.PubMed/NCBI View Article : Google Scholar
|
|
11
|
Mahapatra S, Mandal B and Swarnkar T:
Biological networks integration based on dense module
identification for gene prioritization from microarray data. Gene
Rep. 12:276–288. 2018. View Article : Google Scholar
|
|
12
|
Lin T, Zhang B and He H: Identification of
genes correlated with oral squamous cell carcinoma. J Cancer Res
Ther. 14 (Suppl):S675–S679. 2018.PubMed/NCBI View Article : Google Scholar
|
|
13
|
Shah SD and Braun R: GeneSurrounder:
Network-based identification of disease genes in expression data.
BMC Bioinformatics. 20(229)2019.PubMed/NCBI View Article : Google Scholar
|
|
14
|
Pant I, Kumar N, Khan I, Rao SG and
Kondaiah P: Role of areca nut induced TGF-β and
epithelial-mesenchymal interaction in the pathogenesis of oral
submucous fibrosis. PLoS One. 10(e0129252)2015.PubMed/NCBI View Article : Google Scholar
|
|
15
|
Clough E and Barrett T: The gene
expression omnibus database. Methods Mol Biol. 1418:93–110.
2016.PubMed/NCBI View Article : Google Scholar
|
|
16
|
Thangaraj SV, Shyamsundar V, Krishnamurthy
A, Ramani P, Ganesan K, Muthuswami M and Ramshankar V: Molecular
portrait of oral tongue squamous cell carcinoma shown by
integrative meta-analysis of expression profiles with validations.
PLoS One. 11(e0156582)2016.PubMed/NCBI View Article : Google Scholar
|
|
17
|
Gray KA, Seal RL, Tweedie S, Wright MW and
Bruford EA: A review of the new HGNC gene family resource. Hum
Genomics. 10(6)2016.PubMed/NCBI View Article : Google Scholar
|
|
18
|
Berriz GF and Roth FP: The Synergizer
service for translating gene, protein and other biological
identifiers. Bioinforma Oxf Engl. 24:2272–2273. 2008.PubMed/NCBI View Article : Google Scholar
|
|
19
|
Reimand J, Arak T, Adler P, Kolberg L,
Reisberg S, Peterson H and Vilo J: g:Profiler-a web server for
functional interpretation of gene lists (2016 update). Nucleic
Acids Res. 44:W83–W89. 2016.PubMed/NCBI View Article : Google Scholar
|
|
20
|
Mohammad F, Flight RM, Harrison BJ,
Petruska JC and Rouchka EC: AbsIDconvert: An absolute approach for
converting genetic identifiers at different granularities. BMC
Bioinformatics. 13(229)2012.PubMed/NCBI View Article : Google Scholar
|
|
21
|
Mudunuri U, Che A, Yi M and Stephens RM:
bioDBnet: The biological database network. Bioinformatics.
25:555–556. 2009.PubMed/NCBI View Article : Google Scholar
|
|
22
|
Huang da W, Sherman BT, Stephens R,
Baseler MW, Lane HC and Lempicki RA: DAVID gene ID conversion tool.
Bioinformation. 2:428–430. 2008.PubMed/NCBI View Article : Google Scholar
|
|
23
|
Phan JH, Young AN and Wang MD:
omniBiomarker: A web-based application for knowledge-driven
biomarker identification. IEEE Trans Biomed Eng. 60:3364–3367.
2013.PubMed/NCBI View Article : Google Scholar
|
|
24
|
Maglott D, Ostell J, Pruitt KD and
Tatusova T: Entrez gene: Gene-centered information at NCBI. Nucleic
Acids Res. 33 (Database Issue):D54–D58. 2005.PubMed/NCBI View Article : Google Scholar
|
|
25
|
Aken BL, Achuthan P, Akanni W, Amode MR,
Bernsdorff F, Bhai J, Billis K, Carvalho-Silva D, Cummins C,
Clapham P, et al: Ensembl 2017. Nucleic Acids Res. 45:D635–D642.
2017.PubMed/NCBI View Article : Google Scholar
|
|
26
|
van Assen MALM, van Aert RC and Wicherts
JM: Meta-analysis using effect size distributions of only
statistically significant studies. Psychol Methods. 20:293–309.
2015.PubMed/NCBI View Article : Google Scholar
|
|
27
|
Dalman MR, Deeter A, Nimishakavi G and
Duan ZH: Fold change and p-value cutoffs significantly alter
microarray interpretations. BMC Bioinformatics. 13 (Suppl
2)(S11)2012.PubMed/NCBI View Article : Google Scholar
|
|
28
|
Cheadle C, Vawter MP, Freed WJ and Becker
KG: Analysis of microarray data using Z score transformation. J Mol
Diagn. 5:73–81. 2003.PubMed/NCBI View Article : Google Scholar
|
|
29
|
Ho KH, Chen PH, Hsi E, Shih CM, Chang WC,
Cheng CH, Lin CW and Chen KC: Identification of IGF-1-enhanced
cytokine expressions targeted by miR-181d in glioblastomas via an
integrative miRNA/mRNA regulatory network analysis. Sci Rep.
7(732)2017.PubMed/NCBI View Article : Google Scholar
|
|
30
|
Jeong H, Tombor B, Albert R, Oltvai ZN and
Barabási AL: The large-scale organization of metabolic networks.
Nature. 407:651–654. 2000.PubMed/NCBI View Article : Google Scholar
|
|
31
|
Langfelder P and Horvath S: WGCNA: An R
package for weighted correlation network analysis. BMC
Bioinformatics. 9(559)2008.PubMed/NCBI View Article : Google Scholar
|
|
32
|
Zhang B and Horvath S: A general framework
for weighted gene co-expression network analysis. Stat Appl Genet
Mol Biol. 4(Article17)2005.PubMed/NCBI View Article : Google Scholar
|
|
33
|
Li X, Dong W, Qu X, Zhao H, Wang S, Hao Y,
Li Q, Zhu J, Ye M and Xiao W: Molecular dysexpression in gastric
cancer revealed by integrated analysis of transcriptome data. Oncol
Lett. 13:3177–3185. 2017.PubMed/NCBI View Article : Google Scholar
|
|
34
|
Huang DW, Sherman BT, Tan Q, Collins JR,
Alvord WG, Roayaei J, Stephens R, Baseler MW, Lane HC and Lempicki
RA: The DAVID Gene Functional Classification Tool: A novel
biological module-centric algorithm to functionally analyze large
gene lists. Genome Biol. 8(R183)2007.PubMed/NCBI View Article : Google Scholar
|
|
35
|
Huang da W, Sherman BT and Lempicki RA:
Systematic and integrative analysis of large gene lists using DAVID
bioinformatics resources. Nat Protoc. 4:44–57. 2009.PubMed/NCBI View Article : Google Scholar
|
|
36
|
Chen J, Bardes EE, Aronow BJ and Jegga AG:
ToppGene Suite for gene list enrichment analysis and candidate gene
prioritization. Nucleic Acids Res. 37 (Web Server Issue):W305–W311.
2009.PubMed/NCBI View Article : Google Scholar
|
|
37
|
Wang J, Vasaikar S, Shi Z, Greer M and
Zhang B: WebGestalt 2017: A more comprehensive, powerful, flexible
and interactive gene set enrichment analysis toolkit. Nucleic Acids
Res. 45:W130–W137. 2017.PubMed/NCBI View Article : Google Scholar
|
|
38
|
Mi H, Huang X, Muruganujan A, Tang H,
Mills C, Kang D and Thomas PD: PANTHER version 11: Expanded
annotation data from Gene Ontology and Reactome pathways, and data
analysis tool enhancements. Nucleic Acids Res. 45 (D1):D183–D189.
2017.PubMed/NCBI View Article : Google Scholar
|
|
39
|
Kanehisa M, Furumichi M, Tanabe M, Sato Y
and Morishima K: KEGG: New perspectives on genomes, pathways,
diseases and drugs. Nucleic Acids Res. 45:D353–D361.
2017.PubMed/NCBI View Article : Google Scholar
|
|
40
|
Nishimura D: BioCarta. Biotech Softw
Internet Rep. 2:117–120. 2001. View Article : Google Scholar
|
|
41
|
Fabregat A, Jupe S, Matthews L,
Sidiropoulos K, Gillespie M, Garapati P, Haw R, Jassal B, Korninger
F, May B, et al: The reactome pathway knowledgebase. Nucleic Acids
Res. 46:D649–D655. 2018.PubMed/NCBI View Article : Google Scholar
|
|
42
|
Szklarczyk D, Franceschini A, Wyder S,
Forslund K, Heller D, Huerta-Cepas J, Simonovic M, Roth A, Santos
A, Tsafou KP, et al: STRING v10: Protein-protein interaction
networks, integrated over the tree of life. Nucleic Acids Res. 43
(Database Issue):D447–D452. 2015.PubMed/NCBI View Article : Google Scholar
|
|
43
|
Shannon P, Markiel A, Ozier O, Baliga NS,
Wang JT, Ramage D, Amin N, Schwikowski B and Ideker T: Cytoscape: A
software environment for integrated models of biomolecular
interaction networks. Genome Res. 13:2498–2504. 2003.PubMed/NCBI View Article : Google Scholar
|
|
44
|
Kumar R, Samal SK, Routray S, Dash R and
Dixit A: Identification of oral cancer related candidate genes by
integrating protein-protein interactions, gene ontology, pathway
analysis and immunohistochemistry. Sci Rep. 7(2472)2017.PubMed/NCBI View Article : Google Scholar
|
|
45
|
Alter O, Brown PO and Botstein D: Singular
value decomposition for genome-wide expression data processing and
modeling. Proc Natl Acad Sci USA. 97:10101–10106. 2000.PubMed/NCBI View Article : Google Scholar
|
|
46
|
Langfelder P and Horvath S: Eigengene
networks for studying the relationships between co-expression
modules. BMC Syst Biol. 1(54)2007.PubMed/NCBI View Article : Google Scholar
|
|
47
|
Pontén F, Gry M, Fagerberg L, Lundberg E,
Asplund A, Berglund L, Oksvold P, Björling E, Hober S, Kampf C, et
al: A global view of protein expression in human cells, tissues,
and organs. Mol Syst Biol. 5(337)2009.PubMed/NCBI View Article : Google Scholar
|
|
48
|
D'haeseleer P: How does gene expression
clustering work? Nat Biotechnol. 23:1499–1501. 2005.PubMed/NCBI View Article : Google Scholar
|
|
49
|
Alsina L, Israelsson E, Altman MC, Dang
KK, Ghandil P, Israel L, von Bernuth H, Baldwin N, Qin H, Jin Z, et
al: A narrow repertoire of transcriptional modules responsive to
pyogenic bacteria is impaired in patients carrying loss-of-function
mutations in MYD88 or IRAK4. Nat Immunol. 15:1134–1142.
2014.PubMed/NCBI View Article : Google Scholar
|
|
50
|
Shah N, Kumar R and Shah MK: Immunological
studies in oral submucous fibrosis. Indian J Dent Res. 5:81–87.
1994.PubMed/NCBI
|
|
51
|
Canniff JP, Batchelor JR, Dodi IA and
Harvey W: HLA-typing in oral submucous fibrosis. Tissue Antigens.
26:138–142. 1985.PubMed/NCBI View Article : Google Scholar
|
|
52
|
Kiliaridis S, Mahboubi PH, Raadsheer MC
and Katsaros C: Ultrasonographic thickness of the masseter muscle
in growing individuals with unilateral crossbite. Angle Orthod.
77:607–611. 2007.PubMed/NCBI View Article : Google Scholar
|
|
53
|
Chawla H, Urs Ab, Augustine J and Kumar P:
Characterization of muscle alteration in oral submucous
fibrosis-seeking new evidence. Med Oral Patol Oral Cirugia Bucal.
20:e670–e677. 2015.PubMed/NCBI View Article : Google Scholar
|
|
54
|
Sumathi M, Balaji N and Malathi N: A
prospective transmission electron microscopic study of muscle
status in oral submucous fibrosis along with retrospective analysis
of 80 cases of oral submucous fibrosis. J Oral Maxillofac Pathol.
16:318–324. 2012.PubMed/NCBI View Article : Google Scholar
|
|
55
|
Rooban T, Saraswathi TR, Al Zainab FHI,
Devi U, Eligabeth J and Ranganathan K: A light microscopic study of
fibrosis involving muscle in oral submucous fibrosis. Indian J Dent
Res. 16:131–134. 2005.PubMed/NCBI View Article : Google Scholar
|
|
56
|
Sarkar S and Dong A: Community detection
in graphs using singular value decomposition. Phys Rev E Stat
Nonlin Soft Matter Phys. 83(046114)2011.PubMed/NCBI View Article : Google Scholar
|
|
57
|
Hsu LS, Huang RH, Lai HW, Hsu HT, Sung WW,
Hsieh MJ, Wu CY, Lin YM, Chen MK, Lo YS and Chen CJ: KLF6 inhibited
oral cancer migration and invasion via downregulation of
mesenchymal markers and inhibition of MMP-9 activities. Int J Med
Sci. 14:530–535. 2017.PubMed/NCBI View Article : Google Scholar
|
|
58
|
Botella LM, Sanz-Rodriguez F, Komi Y,
Fernandez-L A, Varela E, Garrido-Martin EM, Narla G, Friedman SL
and Kojima S: TGF-beta regulates the expression of transcription
factor KLF6 and its splice variants and promotes co-operative
transactivation of common target genes through a Smad3-Sp1-KLF6
interaction. Biochem J. 419:485–495. 2009.PubMed/NCBI View Article : Google Scholar
|
|
59
|
Li W, Liu M, Su Y, Zhou X, Liu Y and Zhang
X: The Janus-faced roles of Krüppel-like factor 4 in oral squamous
cell carcinoma cells. Oncotarget. 6:44480–44494. 2015.PubMed/NCBI View Article : Google Scholar
|
|
60
|
Li L and Li W: Epithelial-mesenchymal
transition in human cancer: Comprehensive reprogramming of
metabolism, epigenetics, and differentiation. Pharmacol Ther.
150:33–46. 2015.PubMed/NCBI View Article : Google Scholar
|
|
61
|
Das A, Fernandez-Zapico ME, Cao S, Yao J,
Fiorucci S, Hebbel RP, Urrutia R and Shah VH: Disruption of an
SP2/KLF6 repression complex by SHP is required for farnesoid X
receptor-induced endothelial cell migration. J Biol Chem.
281:39105–39113. 2006.PubMed/NCBI View Article : Google Scholar
|
|
62
|
Uehara O, Takimoto K, Morikawa T, Harada
F, Takai R, Adhikari BR, Itatsu R, Nakamura T, Yoshida K, Matsuoka
H, et al: Upregulated expression of MMP-9 in gingival epithelial
cells induced by prolonged stimulation with arecoline. Oncol Lett.
14:1186–1192. 2017.PubMed/NCBI View Article : Google Scholar
|
|
63
|
Rajendran R, Rajeesh MP, Shaikh S, Shanthi
and Pillai MR: Expression of matrix metalloproteinases
(MMP-1, MMP-2 and MMP-9) and their inhibitors (TIMP-1 and TIMP-2)
in oral submucous fibrosis. Indian J Dent Res. 17:161–166.
2006.PubMed/NCBI View Article : Google Scholar
|
|
64
|
Miao L, Wang Y, Xia H, Yao C, Cai H and
Song Y: SPOCK1 is a novel transforming growth factor-β target gene
that regulates lung cancer cell epithelial-mesenchymal transition.
Biochem Biophys Res Commun. 440:792–797. 2013.PubMed/NCBI View Article : Google Scholar
|
|
65
|
Hartmann U, Hülsmann H, Seul J, Röll S,
Midani H, Breloy I, Hechler D, Müller R and Paulsson M: Testican-3:
A brain-specific proteoglycan member of the BM-40/SPARC/osteonectin
family. J Neurochem. 125:399–409. 2013.PubMed/NCBI View Article : Google Scholar
|
|
66
|
Hausser HJ, Decking R and Brenner RE:
Testican-1, an inhibitor of pro-MMP-2 activation, is expressed in
cartilage. Osteoarthritis Cartilage. 12:870–877. 2004.PubMed/NCBI View Article : Google Scholar
|
|
67
|
Cifuentes-Diaz C, Alliel PM, Charbonnier
F, De La Porte S, Molgó J, Goudou D, Rieger F and Périn JP:
Regulated expression of the proteoglycan SPOCK in the neuromuscular
system. Mech Dev. 94:277–282. 2000.PubMed/NCBI View Article : Google Scholar
|
|
68
|
Shu YJ, Weng H, Ye YY, Hu YP, Bao RF, Cao
Y, Wang XA, Zhang F, Xiang SS, Li HF, et al: SPOCK1 as a potential
cancer prognostic marker promotes the proliferation and metastasis
of gallbladder cancer cells by activating the PI3K/AKT pathway. Mol
Cancer. 14(12)2015.PubMed/NCBI View Article : Google Scholar
|