Introduction
Ependymomas can develop at all ages. However, their
incidence is greatly affected by location (1), with 90% of tumors in pediatric cases
occurring intracranially, and, particularly, 70% occurring in the
posterior fossa (PF) (2).
Supratentorial (ST) tumors affect both pediatric and adult patients
(1); in adults, PF and spinal
ependymomas develop with almost the same frequency (3).
The classification of tumors of the central nervous
system (CNS), as per the World Health Organization (WHO)
guidelines, delineates four important prognostic factors: Patient
age, the extent of resection, location, and histopathological grade
(1). Pediatric cases tend to be
more severe because ependymomas commonly occur in the PF in
children, whereas those in adults are more frequently found in the
spinal cord (1). Of note, a
multi-institutional retrospective analysis of patients with
pediatric ependymomas revealed that anaplastic histopathological
features and incomplete tumor resection led to a poor outcome in
patients younger than 3 years of age (4).
Molecular genetic studies have also revealed
distinct features associated with ependymoma subgroups.
Intracranial and spinal ependymomas showed mutually exclusive gene
mutations (5). Moreover,
differential gene expression patterns among different CNS regions
were recently identified (6). In
addition, Taylor et al (6)
found distinct patterns of gene expression and chromosome
alterations among distinct ependymoma subsets that correlated well
with the anatomic location of the tumor, but not with the clinical
parameters or the tumor histological grade. Of note, ependymomas
recapitulate the gene expression profiles of regionally specified
radial glial cells, explaining the clinical heterogeneity among
histologically similar tumors (6).
This suggests that ependymoma treatments should target the
appropriate cell-signaling pathways based on the tumor
location.
Mack et al (7) studied epigenomic alterations in PF
ependymomas, often associated with somatic single-nucleotide
variants (SNVs); of note, these tumors are relatively rare in
comparison with other organ malignancies. They divided PF
ependymomas into two groups according to the patient age: PF group
A (PFA) and PF group B (PFB) with PFA predominantly found in
infants and associated with a poor prognosis even in the context of
highly aggressive therapies, and PFB occurring in older children
and adults, exhibiting a more favorable prognosis. PFA and PFB
represent two very distinct molecular subgroups based on the
unsupervised clustering of CpG-methylation sites, with certain
genes, including CRIP1, CYP26C1, and PKP1,
exhibiting increased CpG methylation in most PFA tumors.
Therefore, subgroups classified according to tumor
location and patient age are associated with distinct
transcriptomic, genetic, epigenetic, and clinical features; in
fact, these classifications could be more informative for
prognostic prediction than the WHO grading alone (1). Via the confirmation of the correct
grouping parameters and the selection of the corresponding genes in
each group, clinicians might be able to identify the major risk
groups for recurrence and identify patients most suitable for
adjuvant therapy. Indeed, Pajtler et al (8) assessed 500 cases of ependymal tumors,
including cases of subependymoma and myxopapillary ependymoma, that
were found across all CNS compartments, age groups, and
histological grades. Through DNA-methylation profiling, they
identified nine molecular subgroups, with the PFA and V-rel
reticuloendotheliosis viral oncogene homolog A (RELA)-positive
ependymoma groups exhibiting a very poor prognosis, indicating that
risk stratification by molecular subgrouping is superior to
histologic grading.
Here, we analyzed the genomic and epigenomic
alterations in Korean patients with intracranial ependymomas using
three different methods of molecular analysis and Illumina 450K
methylation arrays. We attempted to identify differences and
similarities in ependymoma characteristics according to each
method. Our findings may support the development of an accurate
classification system based on molecular subgroups to facilitate
the prognosis and promote the use of personalized medicine
approaches.
Materials and methods
Study subjects and experimental
design
Fresh-frozen samples were collected from 13 patients
who underwent ependymoma resection surgery at the Seoul National
University Hospital (Seoul, South Korea): Nine adults and four
children younger than 7 years of age. The female-to-male ratio was
8:5. Tumors in nine patients were located in the PF, whereas the
four other patients had ST ependymomas; no cases of spinal
ependymomas were identified in the cohort. Through a pathological
review, six tumors were diagnosed as grade II and seven were
diagnosed as grade III anaplastic ependymoma in accordance with the
WHO guidelines for the classification of CNS tumors (1). The following identification criteria
were further used to classify the tumors: Increased cellularity,
frequent mitosis, abundant necrosis, and microvascular
proliferation. High mitotic activity was defined when at least five
mitotic figures were detected based on the results of a European
clinical trial (9). Ki-67
immunohistochemical staining was also performed on all samples to
assess the proliferation index of the tumor using an image analysis
system (ScanScope XT; Aperio).
Ependymomas in two adults and three children were
recurrent, with one resulting in death. The four surviving patients
harbored grade-III tumors, all of which were located in the PF.
Of the 13 samples, some specimens did not pass DNA
or RNA quality tests and showed insufficient DNA or RNA
concentrations. Of note, experiments were only conducted with
specimens that passed quality checks: 12 were used for methylation
profiling, five were used for WES, seven were applied for targeted
sequencing using an ion-proton CCP, and five were subjected to RNA
sequencing.
DNA methylation DNA extraction and
preparation
Genomic DNA (≥500 ng) was isolated from all tissues.
Bisulfite conversion of genomic DNA was achieved using the EZ DNA
Methylation-Gold Kit (Zymo Research Corporation). Briefly,
bisulfite treatment changes unmethylated cytosine nucleotides to
thymidines, whereas methylated cytosines remain unchanged. This
difference allows for the detection of C/T nucleotide polymorphisms
at each CpG site. Genomic DNA was sent to Macrogen for
hybridization on Illumina 450K methylation arrays (Illumina, Inc.).
The Illumina Infinium human methylation 450 BeadChip kit (Illumina,
Inc.) was used to evaluate the coverage of CpG sites throughout the
genetic regions according to the manufacturer's instructions.
BeadChips were scanned with an Illumina iScan apparatus (Illumina,
Inc.).
Data processing and analysis
Following image analysis, data processing was
performed using the Illumina GenomeStudio software version 2011.1
(Methylation Module v1.9.0; Illumina, Inc.) and the R package,
version 3.0.2 (http://www.r-progect.org). Data preprocessing and
background correction were performed using the R library and
dye-bias equalization. The detected CpGs were filtered (per sample)
according to the P-value. On average, between 485,139.3 and
485,262.6 CpGs were detected with a cut-off value of P<0.05.
Next, the beta mixture quantile in the R package was used to
correct any probe-design bias. To perform data transformation, the
β-value, M-value, and δ-mean were calculated. β-value represents
the ratio of methylated probe intensity to the sum of methylated
and unmethylated probe intensities. M-value is calculated as the
log2-ratio of the intensities of the methylated probes
vs. those of the unmethylated probes (10). δ-mean represents the difference
between the average β-value of the experimental results and that of
the controls. The odds ratio was calculated via the transformation
of the δ-mean into the M-value and the measurement of the ratio
between the unmethylated intensity and methylated intensity for the
test sample against that of a control. Fold expression changes were
calculated as the ratio of methylation rates between test and
control specimens.
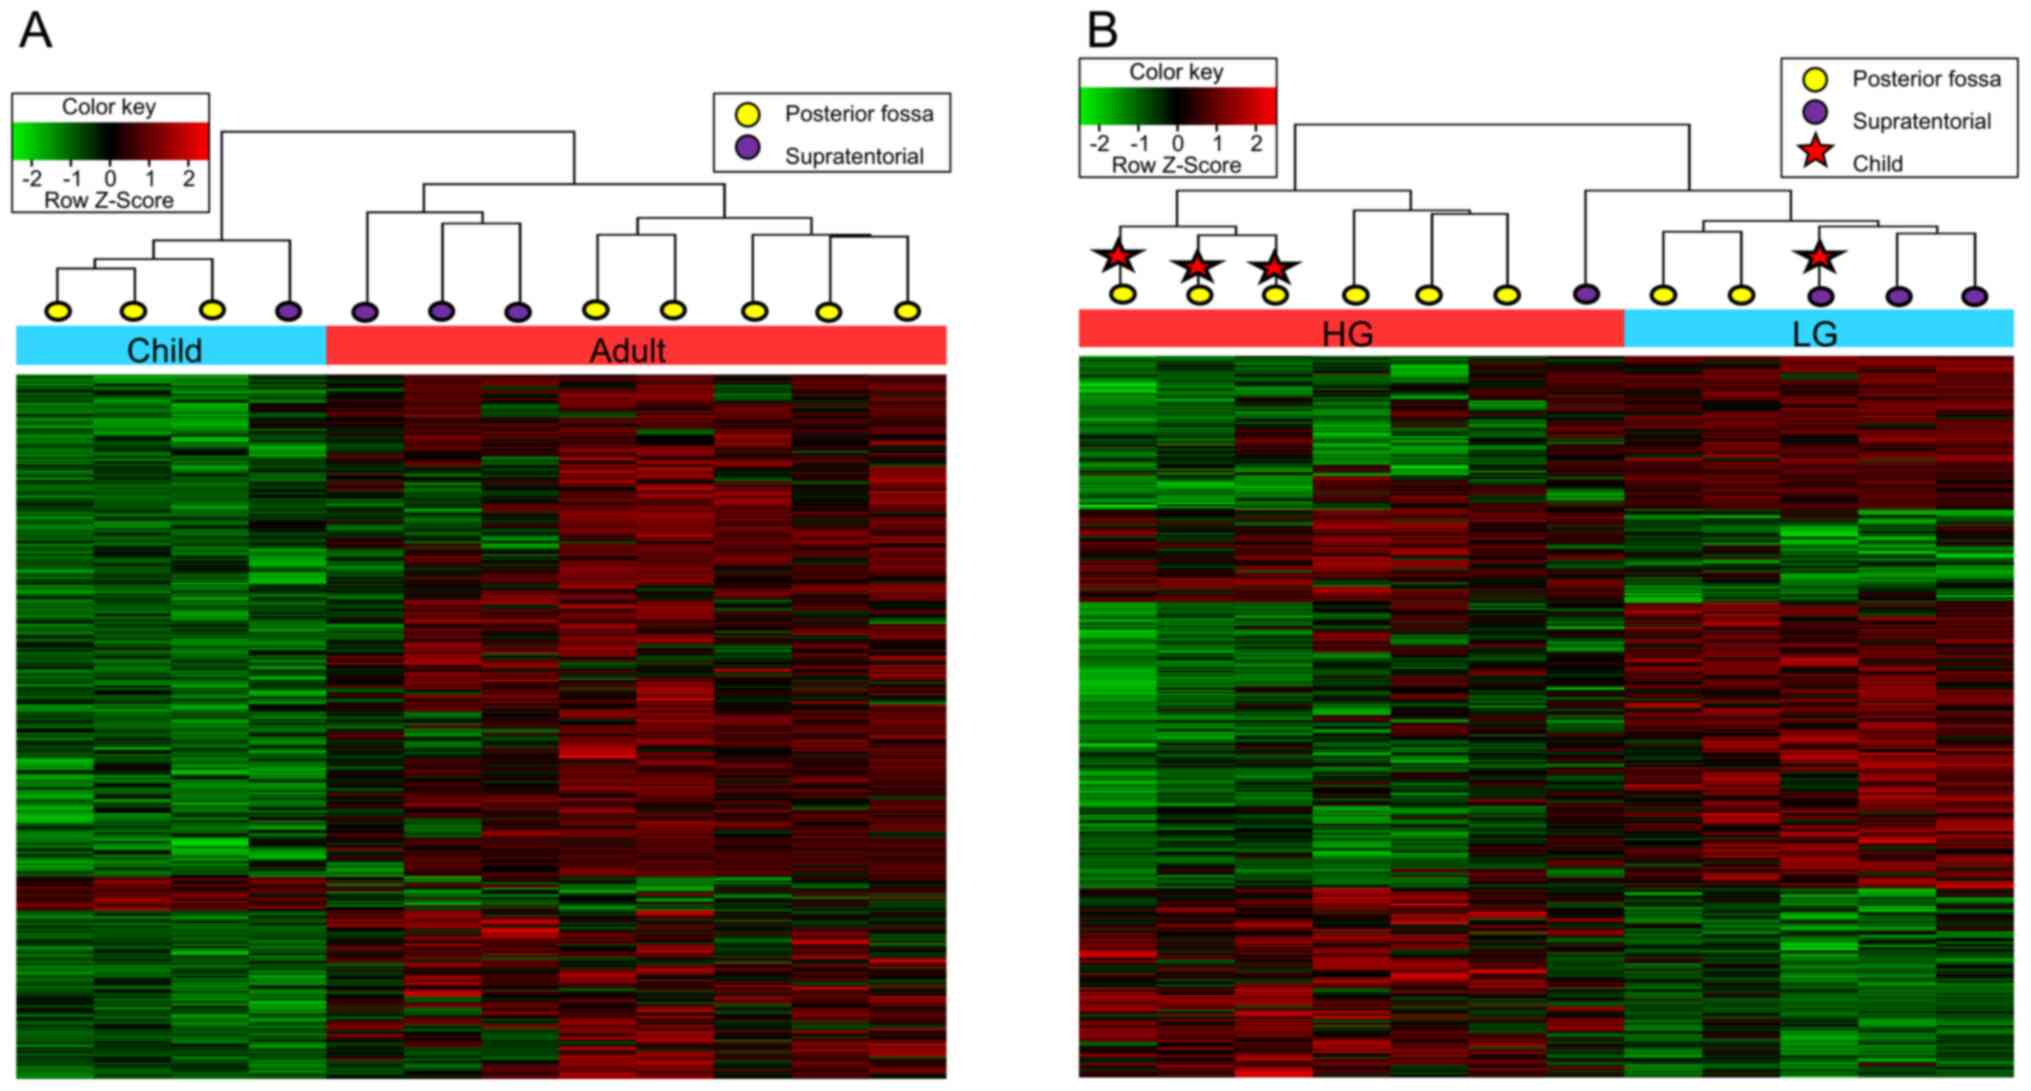
Hierarchical clustering analyses
Using the M-values from significant data, 16,312
CpGs in different age groups and 5,034 CpGs in different grade
groups were obtained with cut-off values of P<0.05 and a δ-mean
>0.2. Among them, 500 CpGs were randomly selected. A heatmap of
hierarchical clustering was plotted based on the distance
similarity for samples and CpGs according to the Euclidean distance
and complete linkage.
Assessment of differential methylation
patterns
To determine the difference in DNA methylation
profiles among samples, especially according to patient and
clinical attributes such as age and tumor location, two basic
approaches were adopted. First, the methylation status of CpG sites
in the regulatory regions of target genes was classified: Hyper- or
hypomethylated regions were defined depending on their methylation
levels-β-values of >0.7 and <0.3 were adopted as the cut-offs
for hypermethylation and hypomethylation, respectively. For the
second approach, we determined the differences in the absolute DNA
methylation status between samples, regardless of their
classification as hypermethylated or hypomethylated. For instance,
if the β-value from a pediatric patient's sample was 0 and that of
an adult patient's sample was 0.6, the first approach would not
detect this difference as statistically significant, despite the
difference of 0.6 in the β-value. In some cases, the differences
obtained using the second method were greater than those using the
first approach. Therefore, to capture the absolute differences in
DNA methylation, the β-values between samples for the same CpG
sites were subtracted from both the age and tumor location groups.
In this approach, a β-value cut-off of 0.4 was set to identify
significant differences between groups.
Gene enrichment and functional
annotation analyses
Through these two analysis approaches, we
successfully extracted target genes with a significant difference
in DNA methylation in their regulatory regions (especially within
the promoter and gene body regions). To examine gene ontology (GO),
gene set analysis was performed using ToppGene (https://toppgene.cchmc.org/), a gene list enrichment
analysis and candidate gene prioritization system based on
functional annotations and protein interaction networks (11).
WES DNA sequencing
DNA from five resected fresh-frozen ependymoma
samples was extracted using the EZ DNA methylation gold kit (Zymo
Research Corporation). DNA extracted from blood samples of the same
patients was used as germline control. To enrich the coding
regions, the SureSelect target-enrichment system capture process
(Agilent Technologies, Inc.) was used. Sequence reads were
generated using the Illumina HiSeq 2500 platform (12).
Data analysis
Raw sequence reads were mapped against the hg19
reference genome using a Burrows-Wheeler aligner (13). After creating a BAM file, PCR
duplicates were removed using Picard (https://broadinstitute.github.io/picard/index.html).
Insertion and deletion (indel) realignment and base quality score
recalibration were performed using the Genome Analysis Tool Kit
(14,15). The VarScan2 software was used to
detect somatic SNVs and small indels (16). ANNOVAR was used to annotate
variants. To identify confident and rare somatic variants in the
coding regions and splice sites, the following filtering criteria
were applied: i) tumor total allele count ≥10, tumor altered allele
count ≥3, and normal altered allele count=0; ii) rare variants were
based on a minor allele frequency (MAF) <0.5% in the Exome
Aggregation Consortium Version 0.3 (ExAC03; http://exac.broadinstitute.org) (17).
Comprehensive cancer panel
To identify the mutation status in 409
cancer-related genes, targeted sequencing of seven tumor samples
was performed using the Ion AmpliSeq Comprehensive Cancer Panel
(CCP; Life Technologies; Thermo Fisher Scientific, Inc.). Mutations
on the list showing non-synonymous SNVs and indels in coding
regions with an altered allele frequency ≥0.1, and rare variants
based on a MAF <0.5% in the Exome Aggregation Consortium Version
0.3 were used for further analysis.
RNA sequencing
Using the Illumina TruSeq RNA sample preparation kit
(Illumina, Inc.), mRNA was converted into a template library for
subsequent cluster generation. Purified mRNA was fragmented, and
reversely transcribed into cDNA. DNA polymerase I and RNase H were
then used to construct second-strand cDNA. cDNA fragments had an
additional adenines added to their 3'-end and the adapters were
then ligated. Products were then enriched by PCR and HiSeq 2000
(Illumina, Inc.) was used for bridged-amplification reactions and
imaging. Images of single-base extensions at a specific cluster
were generated.
Sequence quality checks were performed using Fast
(v0.10.0; www.bioinformatics.babraham.ac.uk/projects/fastqc/).
The alignment was performed via TopHat (v1.3.3; https://ccb.jhu.edu/software/tophat/index.shtml), a
fast splice-junction mapper for RNA-seq reads, with hg19(18). Cufflinks (v2.0.2; http://cole-trapnell-lab.github.io/cufflinks/) was
used for transcript assembly and to test for the differential
expression and regulation of RNA-seq samples (19). Gene expression was measured in terms
of fragments per kilobase of transcript per million mapped
reads.
To detect SNVs and make annotations, SAMtools was
used; alignments were manipulated in the SAM format (http://samtools.sourceforge.net/cns0.shtml). ANNOVAR
(http://www.openbioinformatics.org/annovar/) and DeFuse
(v0.4.3; http://sourceforge.net) were used to
annotate functional genetic variants and to discover fusion genes,
respectively.
Differentially expressed genes were detected via the
comparison of the mean of the original value for each group against
the mean of the Z-score for each group. Genes exhibiting the
largest differences in expression were analyzed and validated via a
literature search for their relevance to ependymoma, and included
in the human disease database (MalaCards; http://malacards.org/card/ependymoma?limit;[MaladiesGenes]=128#related_genes).
The Student's t-test was used to identify expression
differences.
Results
Histopathological features
Of the thirteen samples, six were classified as
grade II ependymoma (low-grade; LG) and seven were classified as
grade III anaplastic ependymoma (high-grade; HG). Increased
cellularity was observed in five grade II ependymomas and in all
grade III ependymomas. The mitotic count ranged from 0 to 4 (mean,
2.5) in grade II, and from 11 to 26 (mean, 19.0) in grade III
ependymoma samples. Microvascular proliferation was observed in
only one grade III ependymoma. Abundant necrosis was observed in
four cases of grade III ependymoma and focal necrosis was observed
in three cases of grade II ependymoma. The Ki-67 staining index
ranged from <1 to 11.64% (mean, 5.0%) in grade II ependymomas,
and from 4.48 to 32.97% (mean, 16.2%) in grade III ependymomas. The
clinicopathological information of the patients, the experimental
design and the summarized genomic characteristics are shown in
Tables I and SI.
 | Table ISummary of the clinicopathologic and
genomic characteristics of the patients included in the present
study. |
Table I
Summary of the clinicopathologic and
genomic characteristics of the patients included in the present
study.
| Variable | P1 | P2 | P3 | P4 | P5 | P6 | P7 | P8 | P9 | P10 | P11 | P12 | P13 |
|---|
| Age (years) | 32 | 48 | 53 | 48 | 25 | 41 | 29 | 48 | 6 | 2 | 3 | 3 | 38 |
| Sex | F | M | F | F | F | M | F | M | F | M | M | F | F |
| Tumor location | ST | ST | PF | PF | PF | PF | PF | ST | ST | PF | PF | PF | PF |
| Recurrence | N | N | N | N | N | N | Y | Y | N | Y | Y | Y | N |
| Death | N | N | N | N | N | N | N | N | N | N | Y | N | N |
| Histologic
grade | GII | GII | GII | GII | GIII | GIII | GIII | GIII | GII | GIII | GIII | GIII | GII |
| No. of SNVs by
WES | NA | NA | 9 | NA | 9 | 12 | NA | NA | 3 | NA | NA | 9 | NA |
| No. of fusion genes
by RNA sequencing | NA | NA | 2 | NA | 3 | 0 | 3 | NA | 1 | NA | NA | NA | NA |
| CCP | A | A | NA | A | NA | NA | NA | A | NA | A | A | NA | A |
| Methylation | A | A | A | A | A | A | A | A | A | A | A | A | NA |
DNA methylation Hierarchical
clustering
Significant differences in the methylation rates
associated with patient age, tumor grade, and location were
assessed via hierarchical clustering. Hierarchical clustering
according to age respected the significance criterion (P<0.05)
with an absolute δ-mean value of >0.2 using 500 randomly
selected CpGs (Fig. 1A). In each
clustered age-group, unsupervised clustering by anatomic location
(ST and PF) was prominently observed. On the other hand, other
factors, including grade and prognosis (recurrence), were not
categorized in the same groups.
Hierarchical clustering by grade also showed
clustering by location in each grade group (Fig. 1B). The HG group was separated into
the ST group, including one patient, and the PF group, including
six patients. Children and adults were clustered as separate groups
for HG tumors in the PF. Overall, the methylation patterns showed
meaningful differences with respect to both tumor location and
patient age.
Methylation profile based on age and
location
We next counted the number of genes exhibiting
significant differences in methylation based on patient age and
tumor location. Many genes were identified to have a β-value
difference of >0.4 between adults and children (Table SII); of note, 66 genes were
included in the adult-hypomethylated group and 425 genes were
included in the adult-hypermethylated group. Three of these genes
(PDE4C, HOXA9, and TBX5) in the
adult-hypermethylated and child-hypomethylated groups showed the
most substantial age-related differences, in line with data
previously reported by Koch and Wagner (20) in an epigenetic study. These genes
showed higher methylation in adults vs. children. Thus, using the
absolute β-value is preferred over using the difference in the
methylation rate to determine target genes in each age or location
group due to the potential interference of age-related methylation.
Of note, we used β-values of 0.7 and 0.3 as the hypermethylation
and hypomethylation cut-off values, respectively, because we could
not obtain significant data using the cutoff points of 0.8 or 0.2
proposed by Rogers et al (2).
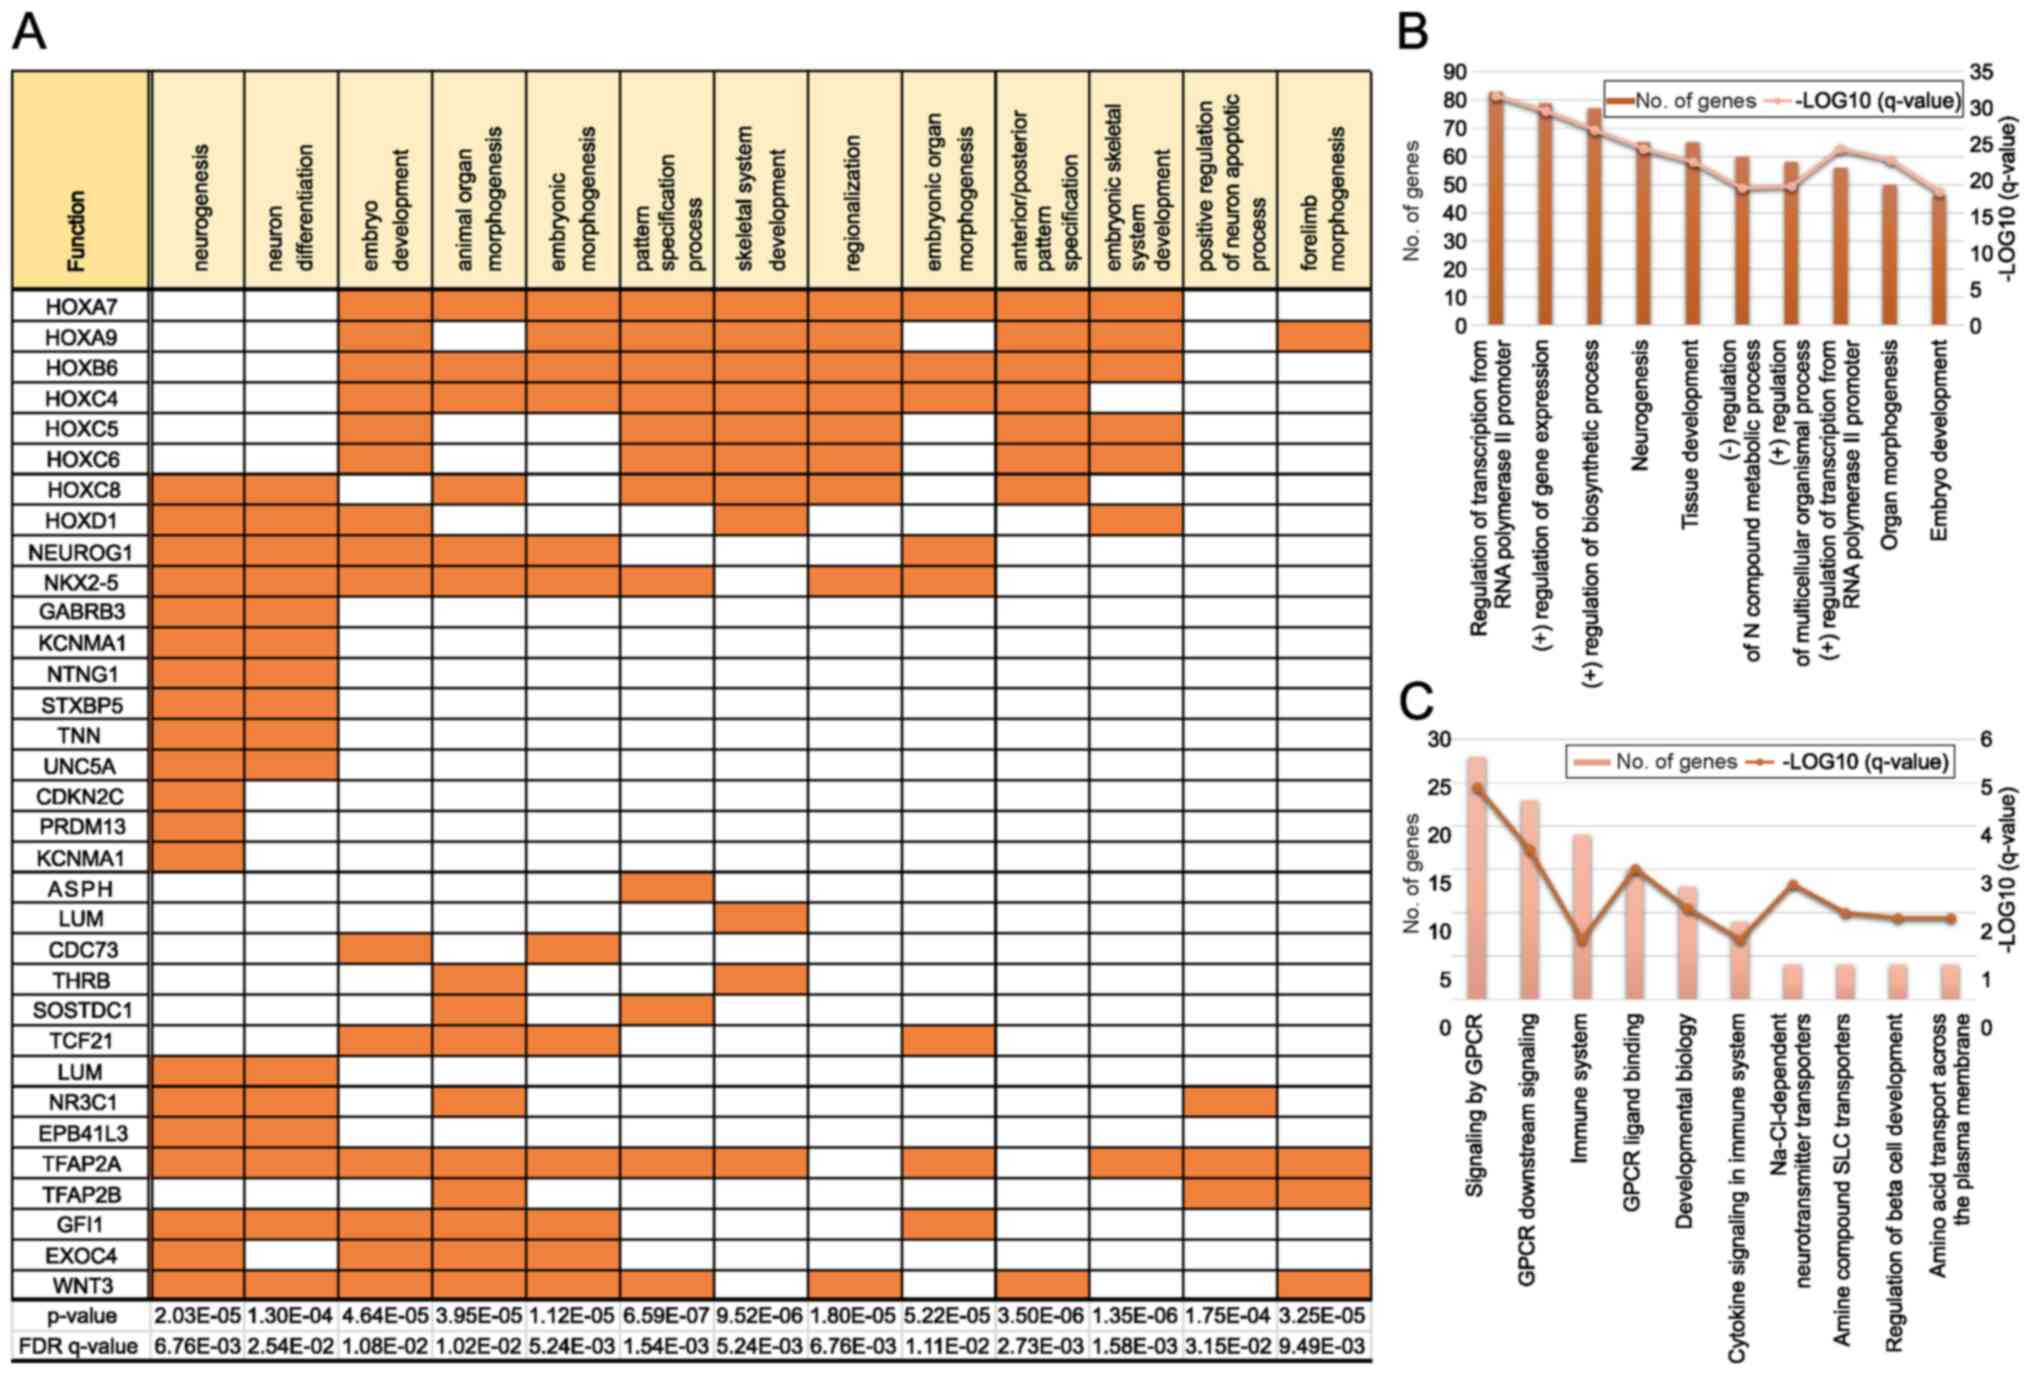
GO analysis revealed that a high proportion of genes
displaying hypermethylation in adults was included in GO sets; 20
of the 1,638 genes associated with neurogenesis were identified in
our samples, as well as 16 of the 1,405 genes associated with
neuron differentiation (Fig. 2A).
Many genes belonging to the HOX family were observed in several
pathways. We also found many genes associated with the development
of multicellular organisms (neurogenesis and embryo development) in
the biological process category of GO enrichment analysis (Fig. 2B). Moreover, the analysis of
Reactome pathways revealed that genes related to G protein-coupled
receptors and amine compound solute carrier transporters were
enriched (Fig. 2C). Importantly,
these pathways are crucial targets for drug development.
Moreover, many genes showed β-values >0.4 between
the PF and ST groups (Table SIII).
Sixty-one genes were included in the PF-hypomethylated group and
fourteen genes were included in the PF-hypermethylated group.
However, no significant genes were detected in the
PF-hypermethylated group, as per the GO analysis.
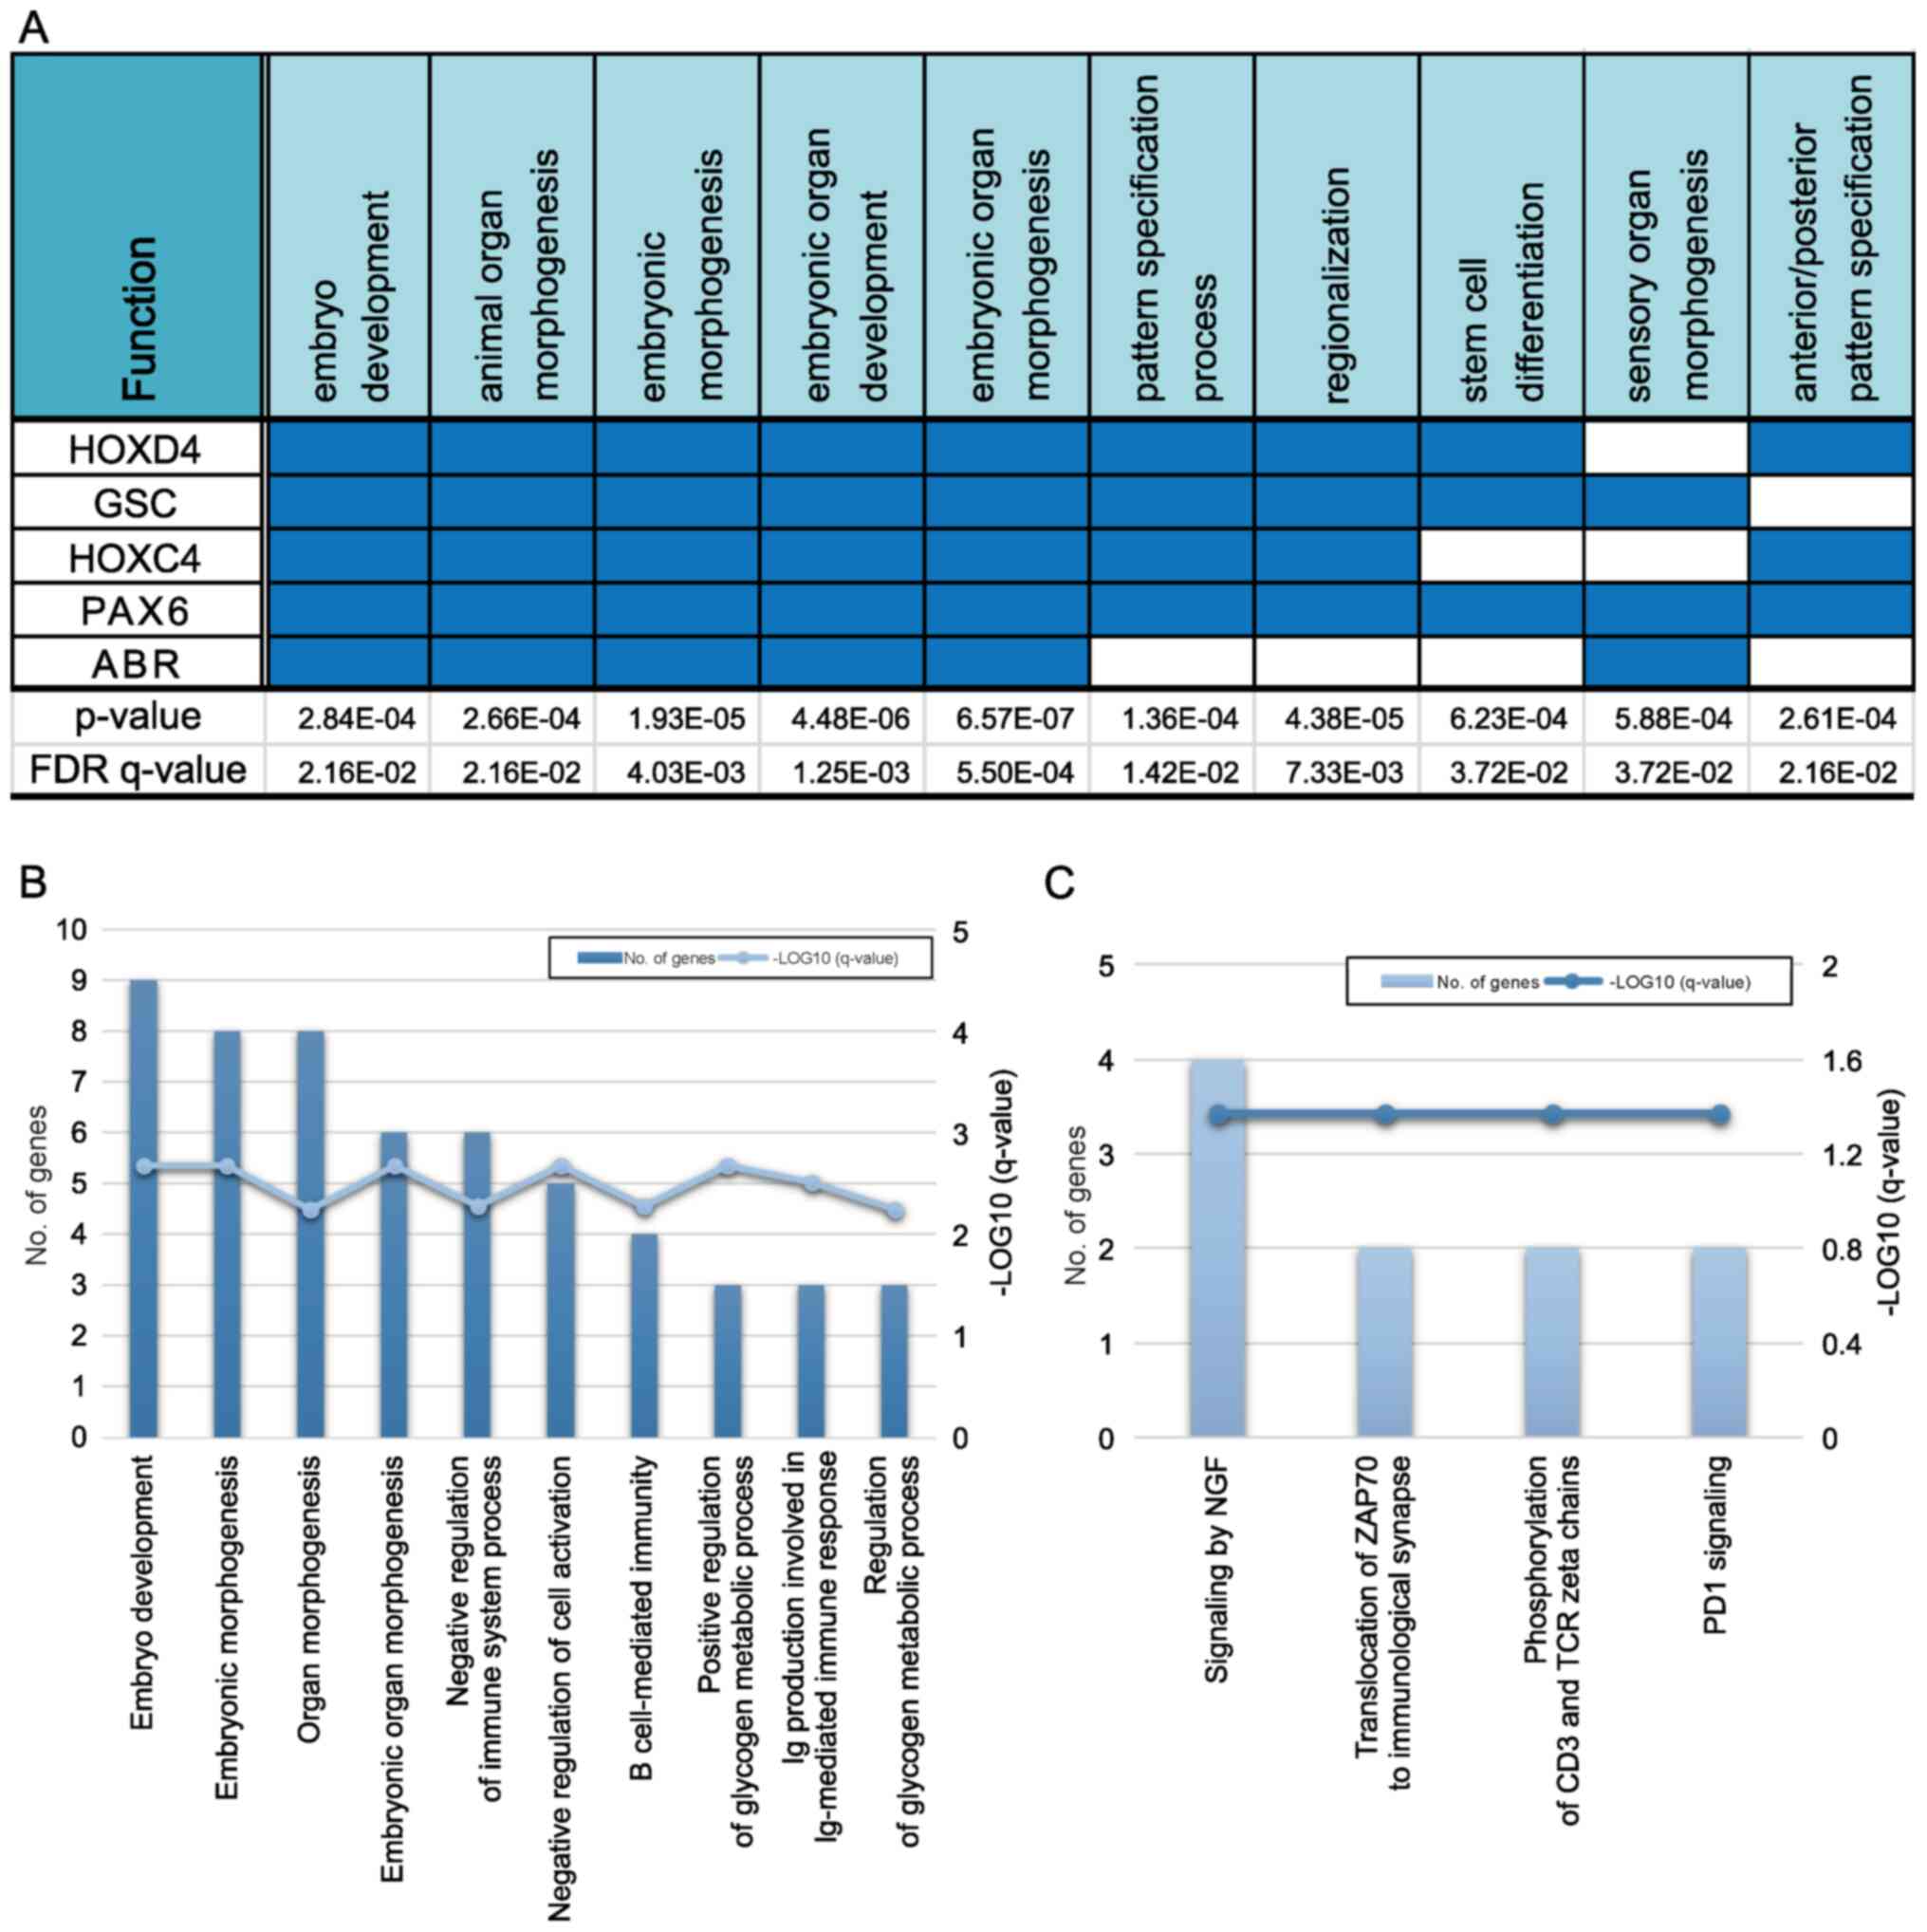
GO pathway analysis revealed that five genes
(HOXD4, GSC, HOXC4, PAX6, and
ABR) overlapped in a single biological process category
(Fig. 3A). Among them,
HOXD4, HOXC4, and PAX6, identified in the
PF-hypomethylated/ST-hypermethylated group, were associated with
hindbrain development during early embryogenesis. Moreover, many
genes associated with the development of multicellular organisms
(embryo development and embryonic morphogenesis) and the
development of embryonic organs (organ morphogenesis and embryonic
organ morphogenesis) were identified in the biological processes'
categorization of the GO enrichment analysis (Fig. 3B). Finally, nerve growth factor
signaling-associated genes were enriched, as per the Reactome
pathway analysis (Fig. 3C).
WES
We performed WES for five paired tumor-normal tissue
samples, including two LG tumors and three HG tumors. Three
patients were adults and two were children. Tumors of four of these
patients were located in the PF and the tumor of one patient was
located in the ST.
Fifty-eight non-synonymous SNVs (nsSNVs) were
identified in the five paired samples, ranging from 7-14 nsSNVs per
sample. The median number of nsSNVs per Megabase was 0.26 in adults
and 0.20 in children. After filtering for rare mutations, each
sample showed 3-12 nsSNVs. Interestingly, the mean number of rare
nsSNVs in children was smaller than that in adults, although the
difference was not statistically significant (Table SIV).
In four samples with both WES and RNA sequencing
data available, the SNVs were checked to determine whether they
were transcribed or edited in the context of RNA sequencing. SNVs
identified in seven genes (HARS2, SPSB3,
BAZ2B, TRIO, SNX13, PLXNA4, and
PARP12) in WES were indeed transcribed, as per the RNA
sequencing results (Table SV). In
contrast, no case of editing was identified.
In the copy number variation (CNV) analysis, patient
3 (53-year-old female; LG and PF) showed insertions in chromosomes
1, 4, 5, 7, 8, 9, 12, 14, 15, 18, and 19. Patient 5 (25-year-old
female; HG and PF) showed gains in chromosomes 12, 19 and 20, and
losses in chromosomes 3, 6, 13, 16, 17, 21 and 22. Patient 6
(41-year-old male; HG and PF) showed an increased copy number in
chromosome 1q and losses in chromosomes 3, 5, 17, 21 and 22.
Patient 9 (6-year-old female; LG and ST) showed copy loss in
chromosome 11, and patient 12 (3-year-old female; HG and PF) showed
copy gain in chromosome 19. In summary, three of four PF cases
showed a copy gain in chromosome 19, which is a rare finding.
Moreover, children showed fewer CNVs than adults, as expected.
Interestingly, trisomy 19 ependymomas, classified as ST WHO
grade-III tumors in children (21),
are usually associated with a clear cell morphology, which was not
evident in our cases.
Comprehensive cancer panel
To identify the mutation status of cancer-related
genes, we used the Ion AmpliSeq CCP. Among the 409 oncogenes
included in the panel, 249 SNVs and indels in 156 genes were
identified. A few mutations were observed in all seven patients.
The FGFR3, KIT, and TAF1L genes harbored
nonsynonymous SNVs, whereas the KMT2C gene harbored a
deletion-insertion mutation; however, none of the mutations were
pathognomic. Of note, we excluded two indels that occurred in a
repeat area, which is a common error of the Ion AmpliSeq
platform.
Mutations in the CASC5 gene were identified
in both WES and CCP analyses; however, their positions were
different. Despite filtering common variants according to the
population MAF database, probable germline variants were difficult
to filter out without the corresponding information on paired
normal samples.
RNA sequencing
The RNA sequencing results for five patients
revealed the presence of multiple fusion genes (Table II), including a YAP1 fusion
in patient 9 (child; ST and LG), common in cases of pediatric ST
ependymomas. The other fusion genes identified in three patients
were novel fusion genes.
| Table IIFusion genes identified using RNA
sequencing. |
Table II
Fusion genes identified using RNA
sequencing.
| Patient ID | Gene name 1 | Gene name 2 | Split read
count | Span read
count | Gene 1
chromosome | Gene 2
chromosome | Genomic break
position 1 | Genomic break
position 2 |
|---|
| P3 | PDE4DIP | AL592284.1 | 10 | 6 | 1 | 1 | 144952201 | 144508284 |
| | PTMS | PCBD2 | 5 | 8 | 12 | 5 | 6879325 | 134260382 |
| P5 | HNRNPA2B1 | RGPD2 | 6 | 5 | 7 | 2 | 26236085 | 88124575 |
| | ZFP36L1 | RGPD2 | 4 | 5 | 14 | 2 | 69257549 | 88124733 |
| | EEF1G | PCBD2 | 6 | 5 | 11 | 5 | 62339358 | 134260418 |
| P7 | RAB6C | OR4Q3 | 7 | 5 | 2 | 14 | 130737953 | 20134468 |
| | GFAP | PCBD2 | 15 | 15 | 17 | 5 | 42991130 | 134260432 |
| | IRAK2 | NDFIP1 | 1 | 5 | 3 | 5 | 10282302 | 141532120 |
| P9 | YAP1 | MAMLD1 | 13 | 6 | 11 | X | 102076805 | 149638017 |
We compared the results with respect to severity
(LG, n=2 vs. HG, n=3), age/location (adults or PF area, n=4 vs.
children or ST, n=1), and sex (female, n=4 vs. male, n=1).
Differentially expressed genes were detected via the comparison of
the mean of the original value for each group against the mean of
the corresponding Z-score. Genes exhibiting the largest differences
in expression were analyzed; validation was further achieved via a
literature search: Their relevance to ependymoma was studied and
they were included in the MalaCards human disease database.
The differences in the original values associated
with the RNA-seq results indicated that upregulated genes were
preferentially ranked. In fact, genes such as GFAP and
S100B exhibited high levels of expression in the context of
ependymoma. Therefore, they could not be used to confirm the
presence of group differences. Because differences in Z-scores
reveal relative differences in expression, originally small values
have no significance. Therefore, the possibility of finding
group-specific genes is only high when using intersecting
genes.
The differences in the expression levels were the
greatest between females and males in all group comparisons based
on correlations. Our analysis showed that 595 genes were
differentially expressed between the LG and HG groups (P<0.05).
Of these genes, four (EZR, PDPN, SHC3, and
PRG2) were directly related to ependymoma according to the
MalaCards analysis.
Discussion
Our data support the recent WHO guidelines
describing ependymoma prognosis parameters using a ‘cell of origin’
concept, suggesting that distinct groups of stem cells are specific
to anatomical sites, and that the different origins of the stem
cells can explain the predominant locations of ependymomas detected
in different age groups (6). Our
methylation analysis and RNA sequencing results suggested that
there may be differences in gene expression profiles between
different age groups as well as anatomical locations. In addition,
the hierarchical clustering of 500 randomly selected CpG associated
with differentially expressed genes (P<0.05 and ∆mean)
demonstrated prominent differences between the ST and PF groups in
both children and adults. Although ependymoma histology cannot
reveal the clinical differences corresponding to patients with ST
or PF tumors, the genetic profiles implied the presence of distinct
phenotypes related to tumor location.
Drugs that target CpG methylation or histone
demethylase inhibitors are considered potential therapeutic agents
for the treatment of pediatric PFA ependymomas (22). Based on our results, targeting
certain genes of the HOX family in adults (HOXA7,
HOXA9, HOXB6, HOXC4, HOXC5,
HOXC6, and HOXC8), or in ST tumors (HOXC4,
HOXD4), may indeed be a useful treatment strategy. Of note,
the HOX gene family plays a key role in development,
providing the anterior and posterior axial coordinates for
vertebrate embryos (23); e.g., the
expression of HOXA1-2 was associated with the hindbrain,
whereas that of HOXA9-13 was predominantly seen in the
extremities (24).
A few HOX family genes have been implicated
in spinal cord ependymomas; for instance, HOXA9 (6), and HOXB5 (25) were highly expressed in spinal
tumors. In fact, some HOX family members, especially
HOXA9, are selectively expressed in spinal ependymomas
(26). However, in our study,
HOXA9 was hypermethylated in intracranial ependymomas, in
adults. Koch and Wagner (20)
reported that HOXA9 was an age-related gene in different
tissues such as the dermis or cervical smear cells. Further studies
may be necessary to discover the function of HOXA9 in
intracranial ependymomas associated with aging.
In our epigenetics analysis using a methylation
array, large differences in the methylation levels of many genes
were detected between age groups. In adults, several more genes
were associated with hypermethylation than with hypomethylation;
these were largely related to neurogenesis and neuron
differentiation (as per the GO analysis), representing a meaningful
association with respect to tumor properties. Genes associated with
hypomethylation in the PF group mainly included those in the
HOX family, which Taylor et al (6) suggested as a representative gene
family that maintains the cancer stem cell phenotype in spinal
ependymomas.
Molecular alterations are common in ependymoma.
Therefore, accurate molecular subgrouping is necessary to predict
patient outcomes and determine the best therapeutic approach. In
the revised fourth edition of the WHO guidelines for CNS diseases,
nine molecular groups were suggested based on a single study
conducted by Pajtler et al (8). This analysis focused on the use of
DNA-methylation profiling to determine ependymoma subgroups and
identified two ST subgroups characterized by the fusion genes
RELA and YAP1 (8).
Their results also indicated molecular subgroups showing distinct
copy number profiles, consistent with our findings concerning CNVs,
as per WES analysis.
We compared our WES data with those reported by
Korshunov et al (27), who
proposed three distinct molecular stages for intracranial
ependymoma, based on patterns of cytogenetic alterations in 122
primary ependymoma samples from adults and children. Group 1
ependymomas were characterized by numerous aberrations affecting
whole chromosomes or chromosome arms, including gains in
chromosomes 9, 15q, and/or 18, and/or a loss in chromosome 6
without a 1q gain, and/or CDKN2A deletion. These alterations
were observed in 34% of all patients and were associated with a
100% 5-year overall survival rate. Of note, patients 3 and 5 in our
study exhibited characteristics that would place them into this
group, and these patients were disease-free for 2 years and 1 year,
respectively. Group 2 ependymomas, were characterized by a largely
balanced genomic profile, and were observed in 42% of patients,
with 5-year overall survival rates of 78% (27). In our study, patient 9 and patient
12 could be classified into this group. Patient 9, who was
diagnosed with ST/LG ependymoma showed no recurrence for 49 months.
However, patient 12, a child with PF/HG ependymoma, showed
recurrence for five times, despite repeated gamma knife
radiosurgery and radiotherapy. Finally, group 3 ependymomas showed
copy number gains in chromosome 1q and/or homozygous CDKN2A
deletion; 25% of patients were classified in this group, exhibiting
5-year survival rates of 32%, constituting the worst overall
prognosis. Patient 6 in our study was included in this group and
experienced no recurrence or death over a 16-month follow-up
period. Overall, these results indicate that the CNV data alone
cannot be used for an accurate molecular classification, due to the
potential poor reproducibility.
Compared to the methylation microarray analysis,
several molecular analysis tools have failed to find sufficient
evidence to support genetic features associated with a particular
disease or subtype. Before filtering the WES data, the absolute
number of somatic mutations per Megabase was larger in adults,
possibly resulting from the presence of age-related mutations. On
the other hand, after filtering, few nsSNVs were detected via WES,
especially in children, compared to those reported in other
malignancies, in line with a previous analysis of PF ependymoma in
children (7). In addition, a few
mutations were identified in the CCP analysis, and no mutations
were common between the WES and CCP datasets.
We detected a few fusion genes via RNA sequencing,
including a YAP1 fusion in a pediatric patient who had a
tumor in the ST area and showed a good prognosis. This result is in
line with the Pajtler's molecular classification (8). The other novel fusion genes identified
in this study are not listed in the COSMIC database, possibly
indicating that they are not functional. Another well-known fusion
gene in addition to YAP1 is RELA, which has been
identified in about 70% of ST ependymoma cases in children
(28). The C11orf95-RELA
fusion is the most common structural variant found in ependymomas
(8). In our RNA fusion study, only
one available sample was from the ST; remarkably a YAP1
fusion was detected in that sample. However, we did not find any
RELA fusion in the five ST samples, possibly due to the
small sample size.
Among the genes displaying a significant difference
between the adult/PF and children/ST groups with respect to both
the original genetic value and Z-scores in RNA sequencing, only
TIMP3 was listed in the human disease database MalaCards.
TIMP3, which plays a role in the development of the CNS and
in the proteolysis pathway, was identified as one of the candidate
methylated genes re-expressed in short-term cell cultures of
ependymoma samples from pediatric patients following treatment with
the demethylating agent 5-aza-2'-deoxycytidine (29). This suggests that the methylation of
TIMP3 plays a major role in ependymoma. However,
TIMP3 was not differentially methylated in our analysis with
respect to patient age and tumor location subgroups.
Our experimental design had some limitations, mainly
related to the small number of tumor samples (CNS tumors are
relatively rare). As per the power analysis with respect to the
methylation study, the actual power was 0.821 and the standard
sample number calculated was 15. Consequently, the number of
samples in our article is slightly insufficient to warrant
significance. Moreover, the ST group only included one child and
all patients in the PF group were adults. Because posterior
ependymomas are more common among children, our patient cohort
might not represent the major features present in ependymoma
groups. In addition, there was no germline control used for RNA
sequencing and CCP because of the shortage of samples. However,
this limitation was overcome to a certain degree by comparing the
results obtained using three independent molecular analysis
methods.
In summary, we analyzed ependymomas from patients,
focusing on different tumor grades and locations, as well as on
patient age, using next-generation sequencing methods, including
methylation array, WES, CCP, and RNA-seq analyses. Although the
number of specimens was limited, different combinations of the
various conditions allowed sufficient diversity within the cohort
to obtain reliable data. This constitutes the first report of
next-generation sequencing analysis of ependymomas in Korean
patients. Importantly, our findings highlight the need for the
application of more accurate diagnostic parameters, other than
tumor grade. Furthermore, our study provides major insights into
the genetic and epigenetic profiles of intracranial ependymomas,
with the potential to impact the development of approaches to
improve their prognostic accuracy.
Supplementary Material
Clinicopathological patient
characteristics and overview of the experimental design.
Genes exhibiting different β-values
>0.4 in adults vs. children.
Genes exhibiting different β-values
>0.4 in tumors of the posterior fossa vs. supratentorial
regions.
List of rare somatic non-synonymous
single nucleotide variants identified via whole-exome
sequencing.
List of transcribed genes that were
identified via whole-exome and RNA sequencing.
Acknowledgements
The authors would like to thank Dr Lee Heon Yi
(Division of Computer Science, Sookmyung Women's University, Seoul,
Republic of Korea) for the help in reanalyzing the data.
Funding
The present study was supported by the Korea Health Technology
R&D Project, through the Korea Health Industry Development
Institute (KHIDI), funded by the Ministry of Health & Welfare,
Republic of Korea (grant no. HI14C1277).
Availability of data and materials
The datasets used and/or analyzed during the current
study are available from the corresponding author on reasonable
request.
Authors' contributions
HJC and HYP have verified the authenticity of all
raw data. HJC wrote manuscript drafts and revised the final version
of the manuscript. HJC acquired the pathologic and clinical data,
and provided data interpretation of the whole-exome sequencing,
comprehensive cancer panel, RNA sequencing and DNA methylation. HYP
analyzed the data of the whole-exome sequencing, comprehensive
cancer panel and RNA sequencing, and KK and HC analyzed the DNA
methylation data. SHPaek, SKK, CKP and SHC acquired patients'
clinical data, tumor specimens and radiologic data, and provided
data interpretation. SHPark conceived the concept, and designed and
supervised the study. All authors read and approved the final
manuscript.
Ethics approval and consent to
participate
The Institutional Review Board of Seoul National
University, College of Medicine and Hospital approved the current
retrospective study (using patients' paraffin blocks; approval no.
H-1412-137-636). The requirement for written informed consent from
patients was waived as the patients donated their cancer tissues to
the tissue bank of Seoul National University Hospital (Seoul,
Republic of Korea). The current research complied with the
recommendations of the Declaration of Helsinki.
Patient consent for publication
Not applicable.
Competing interests
The authors declare that they have no competing
interests.
References
|
1
|
Louis DN, Ohgaki H, Wiestler OD and
Cavenee WK: WHO Classification of Tumours of the Central Nervous
System. Revised 4th Edition. International Agency for Research on
Cancer. Lyon, pp106-114, 2016.
|
|
2
|
Rogers HA, Kilday J-P, Mayne C, Ward J,
Adamowicz-Brice M, Schwalbe EC, Clifford SE, Coyle B and Grundy RG:
Supratentorial and spinal pediatric ependymomas display a
hypermethylated phenotype which includes the loss of tumor
suppressor genes involved in the control of cell growth and death.
Acta Neuropathol. 123:711–725. 2012.PubMed/NCBI View Article : Google Scholar
|
|
3
|
Kudo H, Oi S, Tamaki N, Nishida Y and
Matsumoto S: Ependymoma diagnosed in the first year of life in
Japan in collaboration with the International Society for Pediatric
Neurosurgery. Childs Nerv Syst. 6:375–378. 1990.PubMed/NCBI View Article : Google Scholar
|
|
4
|
Horn B, Heideman R, Geyer R, Pollack I,
Packer R, Goldwein J, Tomita T, Schomberg P, Ater J, Luchtman-Jones
L, et al: A multi-institutional retrospective study of intracranial
ependymoma in children: Identification of risk factors. J Pediatr
Hematol Oncol. 21:203–211. 1999.PubMed/NCBI View Article : Google Scholar
|
|
5
|
Rubio MP, Correa KM, Ramesh V, MacCollin
MM, Jac oby LB, von Deimling A, Gusella JF and Louis DN: Analysis
of the neurofibromatosis 2 gene in human ependymomas and
astrocytomas. Cancer Res. 54:45–47. 1994.PubMed/NCBI
|
|
6
|
Taylor MD, Poppleton H, Fuller C, Su X,
Liu Y, Jensen P, Magdaleno S, Dalton J, Calabrese C, Board J, et
al: Radial glia cells are candidate stem cells of ependymoma.
Cancer Cell. 8:323–335. 2005.PubMed/NCBI View Article : Google Scholar
|
|
7
|
Mack SC, Witt H, Piro RM, Gu L, Zuyderduyn
S, Stütz AM, Wang X, Gallo M, Garzia L, Zayne K, et al: Epigenomic
alterations define lethal CIMP-positive ependymomas of infancy.
Nature. 506:445–450. 2014.PubMed/NCBI View Article : Google Scholar
|
|
8
|
Pajtler KW, Witt H, Sill M, Jones DTW,
Hovestadt V, Kratochwil F, Wani K, Tatevossian R, Punchihewa C,
Johann P, et al: Molecular classification of ependymal tumors
across All CNS compartments, histopathological grades, and age
groups. Cancer Cell. 27:728–743. 2015.PubMed/NCBI View Article : Google Scholar
|
|
9
|
Ellison DW, Kocak M, Figarella-Branger D,
Felice G, Catherine G, Pietsch T, Frappaz D, Massimino M, Grill J,
Boyett JM and Grundy RG: Histopathological grading of pediatric
ependymoma: Reproducibility and clinical relevance in European
trial cohorts. J Negat Results Biomed. 10(7)2011.PubMed/NCBI View Article : Google Scholar
|
|
10
|
Du P, Zhang X, Huang CC, Jafari N, Kibbe
WA, Hou L and Lin SM: Comparison of Beta-value and M-value methods
for quantifying methylation levels by microarray analysis. BMC
Bioinformatics. 11(587)2010.PubMed/NCBI View Article : Google Scholar
|
|
11
|
Chen J, Bardes EE, Aronow BJ and Jegga AG:
ToppGene Suite for gene list enrichment analysis and candidate gene
prioritization. Nucleic Acids Res. 37:W305–W311. 2009.PubMed/NCBI View Article : Google Scholar
|
|
12
|
Agilent Technologies: SureSelect-How it
Works. http://www.genomics.agilent.com/article.jsp?pageId=3083.
Accessed Nov 10, 2020.
|
|
13
|
Li H and Durbin R: Fast and accurate short
read alignment with Burrows-Wheeler transform. Bioinformatics.
25:1754–1760. 2009.PubMed/NCBI View Article : Google Scholar
|
|
14
|
DePristo MA, Banks B, Poplin R, Garimella
KV, Maguire JR, Hartl C, Philippakis AA, del Angel G, Rivas MA,
Hanna M, et al: A framework for variation discovery and genotyping
using next-generation DNA sequencing data. Nat Genet. 43:491–498.
2011.PubMed/NCBI View
Article : Google Scholar
|
|
15
|
Van der Auwera GA, Carneiro MO, Hartl C,
Poplin R, Del Angel G, Levy-Moonshine A, Jordan T, Shakir K, Roazen
D, Thibault T, et al: From FastQ data to high confidence variant
calls: The Genome Analysis Toolkit best practices pipeline. Curr
Protoc Bioinformatics. 43:11.10.1–11.10.33. 2013.PubMed/NCBI View Article : Google Scholar
|
|
16
|
Koboldt DC, Zhang Q, Larson DE, Shen D,
McLellan MD, Lin L, Miller CA, Mardis ER, Ding L and Wilson RK:
VarScan 2: Somatic mutation and copy number alteration discovery in
cancer by exome sequencing. Genome Res. 22:568–576. 2012.PubMed/NCBI View Article : Google Scholar
|
|
17
|
Wang K, Li M and Hakonarson H: ANNOVAR:
Functional annotation of genetic variants from high-throughput
sequencing data. Nucleic Acids Res. 38(e164)2010.PubMed/NCBI View Article : Google Scholar
|
|
18
|
Trapnell C, Pachter L and Salzberg SL:
TopHat: Discovering splice junctions with RNA-Seq. Bioinformatics.
25:1105–1111. 2009.PubMed/NCBI View Article : Google Scholar
|
|
19
|
Trapnell C, Williams BA, Pertea G,
Mortazavi A, Kwan G, van Baren MJ, Salzberg SL, Wold BJ and Pachter
L: Transcript assembly and quantification by RNA-Seq reveals
unannotated transcripts and isoform switching during cell
differentiation. Nat Biotechnol. 28:511–515. 2010.PubMed/NCBI View Article : Google Scholar
|
|
20
|
Koch CM and Wagner W:
Epigenetic-aging-signature to determine age in different tissues.
Aging (Albany NY). 3:1018–1027. 2011.PubMed/NCBI View Article : Google Scholar
|
|
21
|
Rousseau E, Palm T, Scaravilli F, Ruchoux
M-M, Figarella-Branger D, Salmon I, Ellison D, Lacroix C, Chapon F,
Mikol J, et al: Trisomy 19 ependymoma, a newly recognized
genetico-histological association, including clear cell ependymoma.
Mol Cancer. 6(47)2007.PubMed/NCBI View Article : Google Scholar
|
|
22
|
Wu J, Armstrong TS and Gilbert MR: Biology
and management of ependymomas. Neuro Oncol. 18:902–913.
2016.PubMed/NCBI View Article : Google Scholar
|
|
23
|
Montavon T and Duboule D: Chromatin
organization and global regulation of Hox gene clusters. Philos
Trans R Soc Lond B Biol Sci. 368(20120367)2013.PubMed/NCBI View Article : Google Scholar
|
|
24
|
Kurscheid S, Pierre Bady P, Sciuscio D,
Samarzija I, Shay T, Vassallo I, Criekinge WV, Daniel RT, van den
Bent MJ, Marosi C, et al: Chromosome 7 gain and DNA
hypermethylation at the HOXA10 locus are associated with expression
of a stem cell related HOX-signature in glioblastoma. Genome Biol.
16(16)2015.PubMed/NCBI View Article : Google Scholar
|
|
25
|
Korshunov A, Neben K, Wrobel G, Tews B,
Benner A, Hahn M, Golanov A and Lichter P: Gene expression patterns
in ependymomas correlate with tumor location, grade, and patient
age. Am J Pathol. 163:1721–1727. 2003.PubMed/NCBI View Article : Google Scholar
|
|
26
|
Gu S, Gu W, Shou J, Xiong J, Liu X, Sun B,
Yang D and Xie R: The molecular feature of HOX gene family in the
intramedullary spinal tumors. Spine (Phila Pa 1976). 42:291–297.
2017.PubMed/NCBI View Article : Google Scholar
|
|
27
|
Korshunov A, Witt H, Hielscher T, Benner
A, Remke M, Ryzhova M, Milde T, Bender S, Wittmann A, Schöttler A,
et al: Molecular staging of intracranial ependymoma in children and
adults. J Clin Oncol. 28:3182–3190. 2010.PubMed/NCBI View Article : Google Scholar
|
|
28
|
Parker M, Mohankumar KM, Punchihewa C,
Weinlich R, Dalton JD, Li Y, Lee R, Tatevossian RG, Phoenix TN,
Thiruvenkatam R, et al: C11orf95-RELA fusions drive oncogenic
NF-kappaB signalling in ependymoma. Nature. 506:451–455.
2014.PubMed/NCBI View Article : Google Scholar
|
|
29
|
Karakoula K, Jacques TS, Phipps KP,
Harkness W, Thompson D, Harding BN, Darling JL and Warr TJ:
Epigenetic genome-wide analysis identifies BEX1 as a candidate
tumour suppressor gene in paediatric intracranial ependymoma.
Cancer Lett. 346:34–44. 2014.PubMed/NCBI View Article : Google Scholar
|