Introduction
Since the development of immune checkpoint blockade
cancer therapy, many clinical trials of immune checkpoint therapy
combined with conventional targeted therapy against solid cancers
have been performed, and this treatment has achieved great success
in the cancer treatment field as a novel immunotherapy (1-3).
With advances in clinical cancer immunotherapeutic regimens,
closely associated tumor-related parameters have been intensively
investigated. These parameters are thought to be linked to the
efficacy of immune checkpoint blockade therapy and the prognosis of
cancer patients (4-7).
However, in the tumor microenvironment, there are many factors,
such as genetic, immunological (cellular or humoral), and metabolic
factors, that have been demonstrated to be involved in the
immunosuppressive mechanism. For example, as cellular factors,
regulatory effector T cells, myeloid-derived suppressor cells
(MDSCs), tumor-associated macrophages (TAMs) and cancer-associated
fibroblasts (CAFs) have been reported to exhibit protumor
immunosuppressive actions (8-10).
Moreover, immune-type classifications that can
contribute to the prediction of immune checkpoint blockade efficacy
and the prognosis of cancer patients have been performed by several
researchers using three main types of immunological features: PD-L1
expression level, tumor-infiltrating lymphocyte (TIL) status and
tumor mutational burden (TMB) (11-16).
PD-L1 is a major immune checkpoint molecule that is expressed on
tumor cells or associated macrophages and is supposed to inhibit
activated T cell function via PD-1/PD-L1 binding (17,18).
Meanwhile, some researchers have demonstrated that the simple
combination of PD-L1+ and TIL+
(CD8+) may predict a good response to immune checkpoint
blockade (11,12). Others have reported that TMB is a
genuine biomarker for the prediction of immune checkpoint blockade
efficacy (14).
Previously, our group performed an immunological
classification based on PD-L1 and CD8B gene expression levels and
demonstrated that the PD-L1+ and CD8B+ groups were associated with
the upregulation of cytotoxic T lymphocyte (CTL) killing-associated
genes, T cell activation genes, antigen-presentation genes and
dendritic cell (DC) maturation genes, and promoted T helper 1 (Th1)
antitumor responses (19). However,
there are few immune-type classification studies that directly
evaluated cancer patient prognosis.
In the present study, we verified that the
PD-L1+CD8B+ group (type A) was associated
with a better prognosis [5-year overall survival time (OST)] than
the other types. In addition, we identified prognostic factors
responsible for the survival benefit of patients in type A based on
293 immune response-associated gene expression datasets.
Materials and methods
Patient characteristics and study
design
The Shizuoka Cancer Center launched Project HOPE in
2014 using multiomics analyses including whole exome sequencing
(WES) and gene expression profiling (GEP). Ethical approval for the
HOPE study was obtained from the Institutional Review Board of
Shizuoka Cancer Center (authorization no. 25-33). In total, 1,763
patients with tumors were enrolled until March 2016 and the
survival time was observed up to July 2019.
Clinical specimens
Tumor tissue samples weighing more than 0.1 g and
with a tumor content greater than 50% were dissected along with
surrounding normal tissue samples by pathologists.
GEP and WES analysis
DNA and RNA isolation and the GEP and WES analyses
were performed as described previously (20). RNA samples with an RNA integrity
number ≥6.0 were used for microarray analysis. Labeled samples were
hybridized to the SurePrint G3 Human Gene Expression 8x60 K v2
Microarray (Agilent Technologies). Microarray analysis was
performed in accordance with the MIAME guidelines. For DNA data
analysis, somatic mutations were identified by comparing data from
tumor and corresponding blood samples. Mutations in 138 known
driver genes were defined as those identified as pathogenic in the
ClinVar database. Vogelstein et al (21) demonstrated that 138 genes, when
altered by intragenic mutations, can promote or drive
tumorigenesis. A most of tumors including colorectal cancers
contain two to eight of these ʻdriver gene’ mutations and the
remaining mutations are passengers that do not contribute to
tumorigenesis directly. Thus, these 138 driver mutations are
accepted as relevant genes to the tumorigenesis (21). Single nucleotide variants (SNVs) of
the total exonic mutations for each sequenced tumor included
nonsynonymous, synonymous, and indel/frameshift mutations.
Renewal of the immune
response-associated gene panel
The immune response-associated gene panel was
described previously (22). In the
present study, the gene panel was renewed by adding 119
immunological genes (293-gene panel) as shown in Table I. The panel consisted of 114
antigen-presenting cell (APC), T cell and natural killer cell
receptor (NKR) genes; 48 cytokine signal and metabolic genes; 48
tumor necrosis factor (TNF) and TNF receptor superfamily genes; 23
regulatory T cell-associated genes; and 60 IFN-g pathway genes.
 | Table IImmune response-associated genes
list. |
Table I
Immune response-associated genes
list.
| Groups | Genes | No. of genes |
|---|
| APC, T cell and NKR
genes | CD80, CD86, CD274
(PD-L1), PDCD1LG2 (PD-L2), ICOSLG, CD276, VTCN-1, C10orf54, B7H6,
HHLA2, LGALS9, SIRPB1, TREM1, CLEC5A, SIGLEC14, CD68, CD204(MSR1),
HLA-DPA, HLA-DQA, HLA-DRA, HLA-DRB1, HLA-DQA2, CD19, CD20, CD38,
CD138, CD28, CTLA4, CD279 (PD-1), ICOS, BTLA, SLAMF1, HAVCR1,
HAVCR2, TIMD4, TREML2, LAG3, CD247 (CD3zeta), CD4, CD8A, CD8B,
CD25, FOXP3, CCR4, CD56 (NCAM1), CD3D, CD3G, CD3E, HLA-A, HLA-B,
HLA-C, HLA-E, MICA, MICB, ULBP1, ULBP2, ULBP3, RAET1E, NKp44L,
CLEC2D, CLEC12B, CDH1, CDH2, CDH3, CDH4, CD83, CD11b, CD11c, CD209,
TIGIT, CD155, CD200, CD200R, GZMB, PRF1, CD44, CD45, CD62L, CCR7,
CXCR3, CXCR4, CD69, BCL2, CD122, CD127, CD16, CD314 (NKG2D), CD335
(NCR1), TLR1, TLR2, TLR3, TLR4, TLR5, TLR6, TLR7, TLR8, TLR9,
TLR10, DDX58, IFIH1, DHX58, NOD1, NOD2, CLEC4E, CLEC6A, CLEC7A,
STING, TOX, TCF7, B2MG, TAP1, TAP2, NT5E (CD73), ADRA2A | 114 |
| Cytokine signal and
metabolic genes | TGFB1, TGFB2,
TGFB3, TGFBR1, TGFBR2, VEGFA, IFNA1, IFNA2, IFNB1, IL2, IL4, IL6,
IFNG, IL10, IL12A, IL17A, IL23A, IDO1, ARG1, NOS2, PTGS2, AHR,
TDO2, JAK2, STAT1, STAT3, STAT4, STAT5, STAT6, SOCS1, VCAM1, CCL2,
CCL3, CCL4, CCL5, CCL19, CCL21, CCL22, CXCL5, CXCL8, CXCL9, CXCL10,
CXCL12, CXCR2, CSF1, CSF2, CSF3, CSF1R | 48 |
| TNFSF and
TNFRSF | TNFSF1 (LTA),
TNFSF2 (TNF), TNFSF3 (LTB), TNFSF4, TNFSF5 (CD40LG), TNFSF6
(FASLG), EDA, TNFSF7 (CD70), TNFSF8, TNFSF9, TNFSF10, TNFSF11,
TNFSF12, TNFSF13, TNFSF13B, TNFSF14, TNFSF15, TNFSF18, TNFRSF1A,
TNFRSF1B, EDAR, TNFRSF3 (LTBR), TNFRSF4, TNFRSF5 (CD40), TNFRSF6
(FAS), TNFRSF6B, TNFRSF7(CD27), TNFRSF8(CD30), TNFRSF9, TNFRSF10A,
TNFRSF10B, TNFRSF10C, TNFRSF10D, TNFRSF11A, TNFRSF11B, TNFRSF12A,
TNFRSF13B, TNFRSF13C, TNFRSF14, TNFRSF16(NGFR), TNFRSF17, TNFRSF18,
TNFRSF19, TNFRSF19L(RELT), TNFRSF21, TNFRSF25, TNFRSF27
(EDA2R) | 48 |
| Regulatory T
cell-associated genes | SEMA3G, LGALS3,
ENTPD1 (CD39), CCR6, CCL20, IL12RB2, CCR10, ANXA2, IL17RB, ADAM12,
TMEM45A, LRRC32, LOXL1, GREB1, HRH4, CCR5, BMPR1B, SFRP1, LAMA2,
ITGB1, CPE, MKI67, CDCA3 | 23 |
| IFN-γ pathway
genes | IFIT1B, IFNA21,
IFNW1, IFNA14, IFNA4, IFNA5, IFNA6, IFNA8, IFNE, IFIT1, IFNK,
CNTFR, IFIT2, IFIT3, IL10RA, IL11RA, IL20RA, CREB3, IL12B, IL31RA,
IL7R, IFI30, IFNGR1, IFRD1, IFRD2, IL22RA2, IL5RA, IRF1, IRF8,
IRGM, JAK1, MX1, OAS1, PIK3CA, PRKCD, PYH1N1, PIAS4, EBI3, IFI27,
IFNAR1, IFNAR2, IFNGR2, IL10RB, IL21R, IL28A, IL28RA, IL29, IL4R,
IL6R, IRF2BP1, IRF3, IRF4, IRF5, LEPR, MPL, SP110, STAT2, TBX21,
TYK2, SOCS3 | 60 |
| Total | | 293 |
Statistical analysis
Based on the expression levels of the PD-L1 and CD8B
genes, we classified all 1,763 tumors enrolled in the HOPE project
into 4 immune types: type A, PD-L1+CD8B+;
type B, PD-L1+CD8-; type C,
PD-L1-CD8B-; and type D,
PD-L1-CD8B+ as described previously. A
comparative analysis of the survival times between group A and the
other groups was performed using the Kaplan-Meier method and Cox
proportional hazards regression model. The upregulated genes
derived from the 293-immune response-associated gene panel between
tumor microenvironment (TME) immune type A and other types were
identified using the volcano plot method with Benjamini-Hochberg
correction. Upregulated immune response-associated genes with
>2-fold expression differences (P<0.05) were identified. The
heatmap expression data of upregulated genes in the immune type A
group were investigated using GeneSpring GX software version 13.1.1
(Agilent Technologies). The association of upregulated gene
expression levels with the OST was examined using the Kaplan-Meier
method. A comparative analysis of the survival times between
patients with low expression (less than the median) and patients
with high expression (more than the median) of the identified genes
in group type A (referred as to group A) was performed by the
log-rank test using EZR software and Microsoft Excel. Regarding
probable prognosis-associated genes identified in group A, the
significance of these genes was analyzed using a multivariate Cox
proportional hazards regression model with EZR software (23). Values of P<0.05 denoted
statistically significant differences.
Results
Association of the overall survival
time with immune types
The 1,763 pairs of tumors and adjacent normal
tissues derived from different cancer types were classified into 4
immune types based on the expression levels of the PD-L1 and CD8B
genes. The patient numbers with different cancer types were
described previously (17). The
proportions of TME immune types A, B, C and D were 39.3, 26.5, 19.1
and 15.1%, respectively. Survival time analysis at 5 years revealed
that group A had a better prognosis than the other groups [5 year
survival rate (%); A (80.5) vs. B (73.9), C (73.4) and D (72.6),
P=0.0005] (Fig. 1).
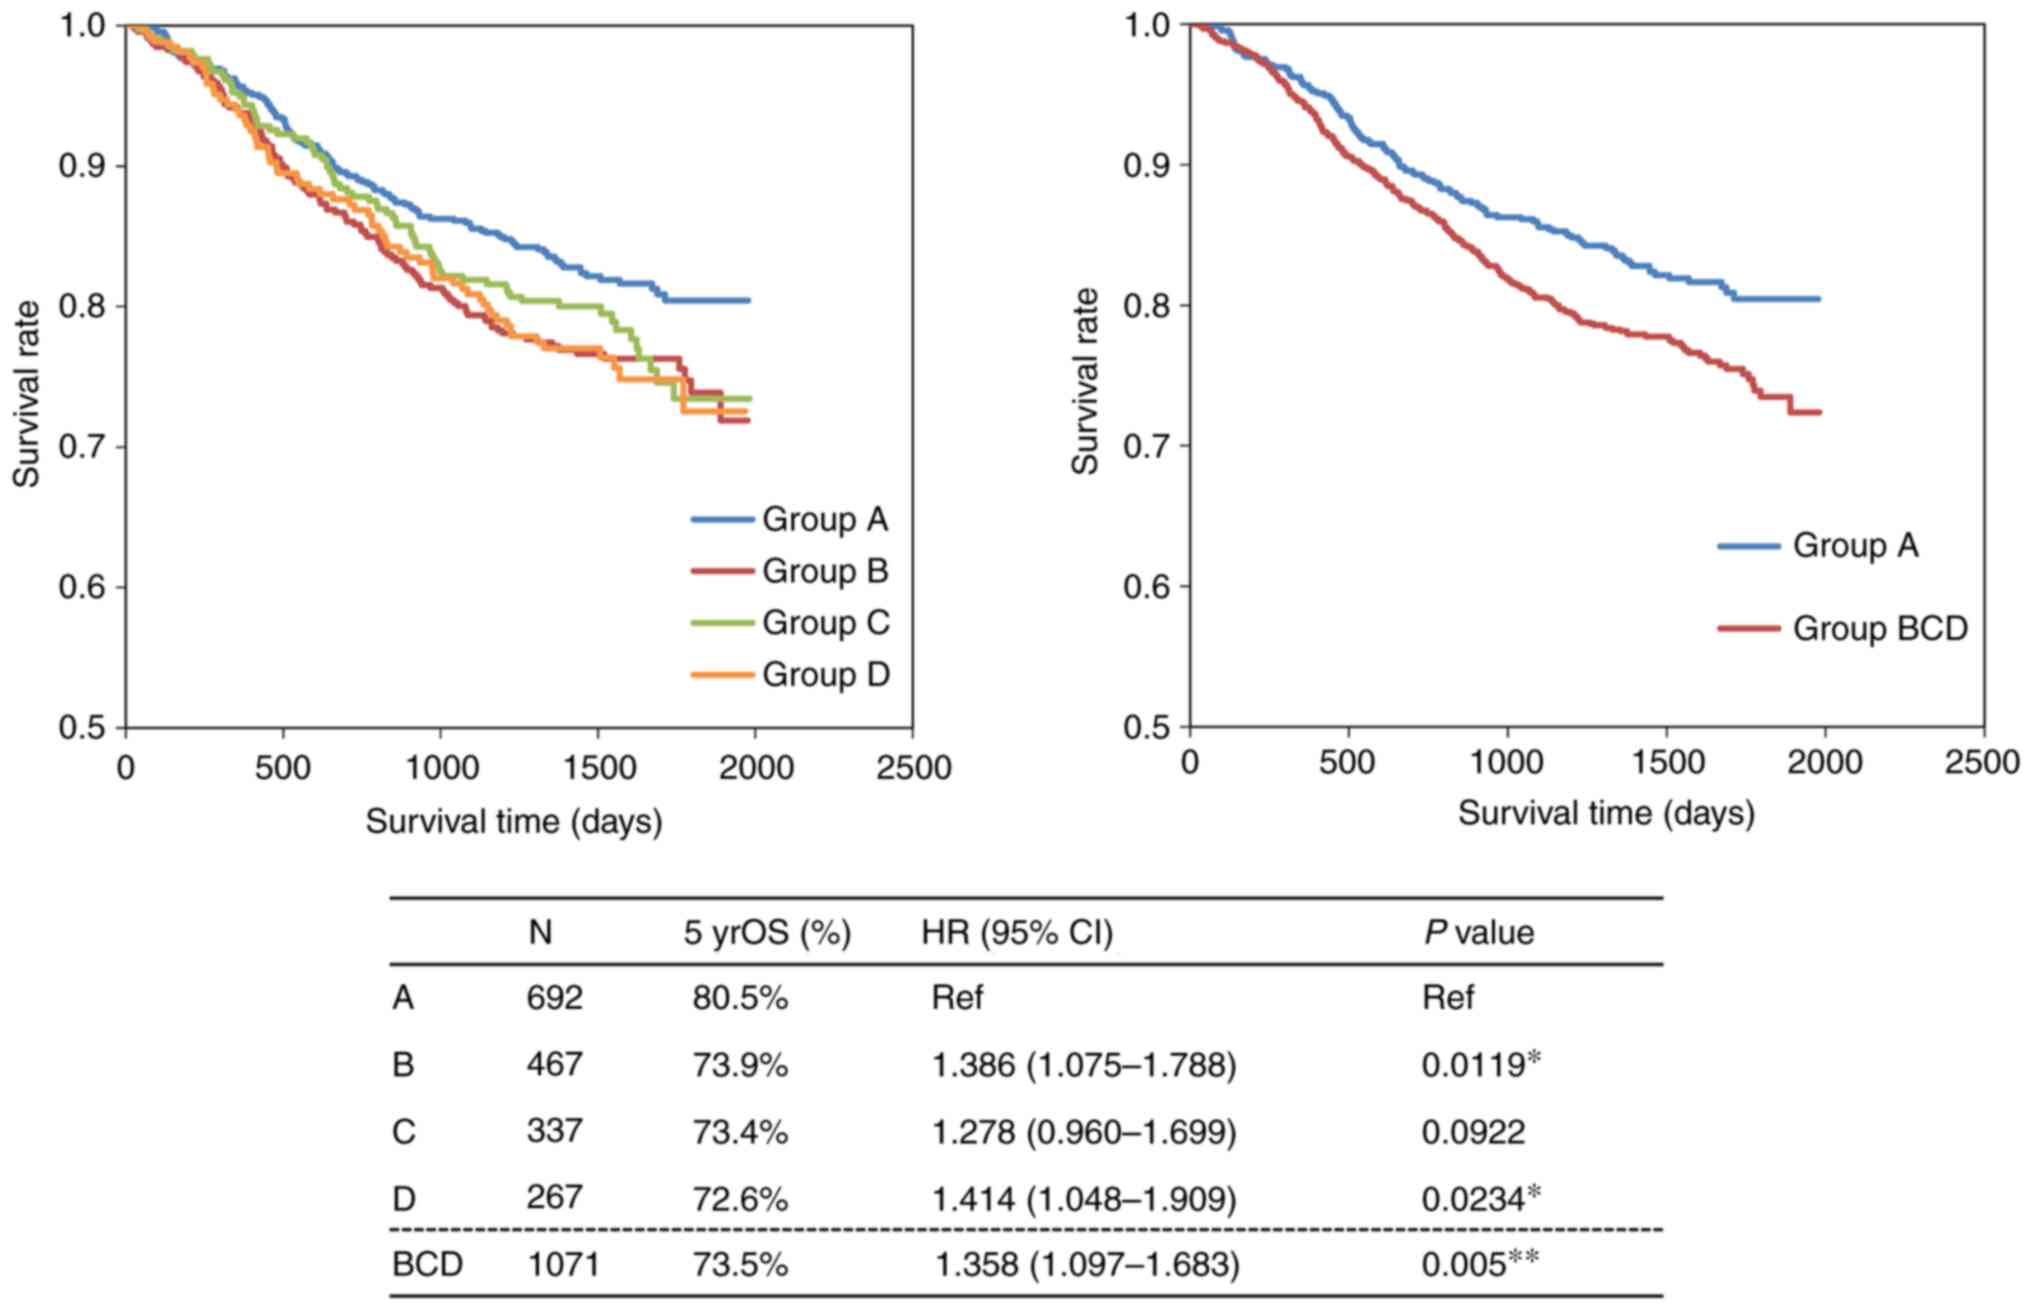 | Figure 1Evaluation of the OS time in 1,763
patients with cancer registered in the HOPE project. Survival time
analysis at 5 years revealed that group A had a better prognosis
than the other groups. A comparative analysis of the survival times
between group A and the other groups was performed using the
Kaplan-Meier method and Cox proportional hazards regression model.
The OS analysis indicated a significant survival benefit at 5 years
for group A. *P<0.05 and **P<0.01.
Number of cases in group A (n=692), group B (n=467), group C
(n=337) and group D (n=267). The number of cases with different
types of cancer was as follows: 107 breast, 601 colorectal, 27
skin, 25 esophageal, 248 stomach, 49 uterine and ovarian, 69 bile
duct and pancreatic, 152 head and neck, 98 liver, 4 brain, 14 bone,
348 lung and 21 kidney cancer. OS, overall survival; HR, hazard
ratio; HOPE, High-tech Omics-based Patient Evaluation. |
Association of genetic mutations and
immunological surface markers with overall survival
The characteristics of genetic mutations, including
Vogelstein driver mutations and SNVs, and gene amplification were
described previously (19). The
association of the genetic mutation status of driver gene
mutations, such as TP53, KRAS, EGFR, PIK3CA and BRAF mutations, or
gene amplification with the OST was investigated using the log-rank
test. There was no significant association of genetic parameters
with the OST (Table II).
| Table IIAssociation of immunological and
genetic features with overall survival. |
Table II
Association of immunological and
genetic features with overall survival.
| Group | Cohort (case
no./5yrOS) | P-value |
|---|
| Genetic
mutations | | |
|
Vogelstein | MT (1084/77.3%) vs.
WT (679/74.6%) | 0.184 |
|
TP53 | MT (729/74.5%) vs.
WT (1034/77.4%) | 0.206 |
|
KRAS | MT (299/77.7%) vs.
WT (1464/75.9%) | 0.431 |
|
EGFR | MT (107/73.7%) vs.
WT (1656/76.3%) | 0.215 |
|
PIK3CA | MT (169/80.5%) vs.
WT (1594/75.9%) | 0.625 |
|
BRAF | MT (64/77.1%) vs.
WT (1699/76.2%) | 0.912 |
|
TMB
number | >20 (83/81.7%)
vs. <20 (1679/76.0%) | 0.512 |
| Gene
amplificationa | | |
|
All 64
genesb | Yes (575/75.9%) vs.
No (833/75.9%) | 0.858 |
|
EGFR | Yes (61/75.4%) vs.
No (1347/75.9%) | 0.746 |
|
HER2 | Yes (33/71.3%) vs.
No (1375/76.0%) | 0.530 |
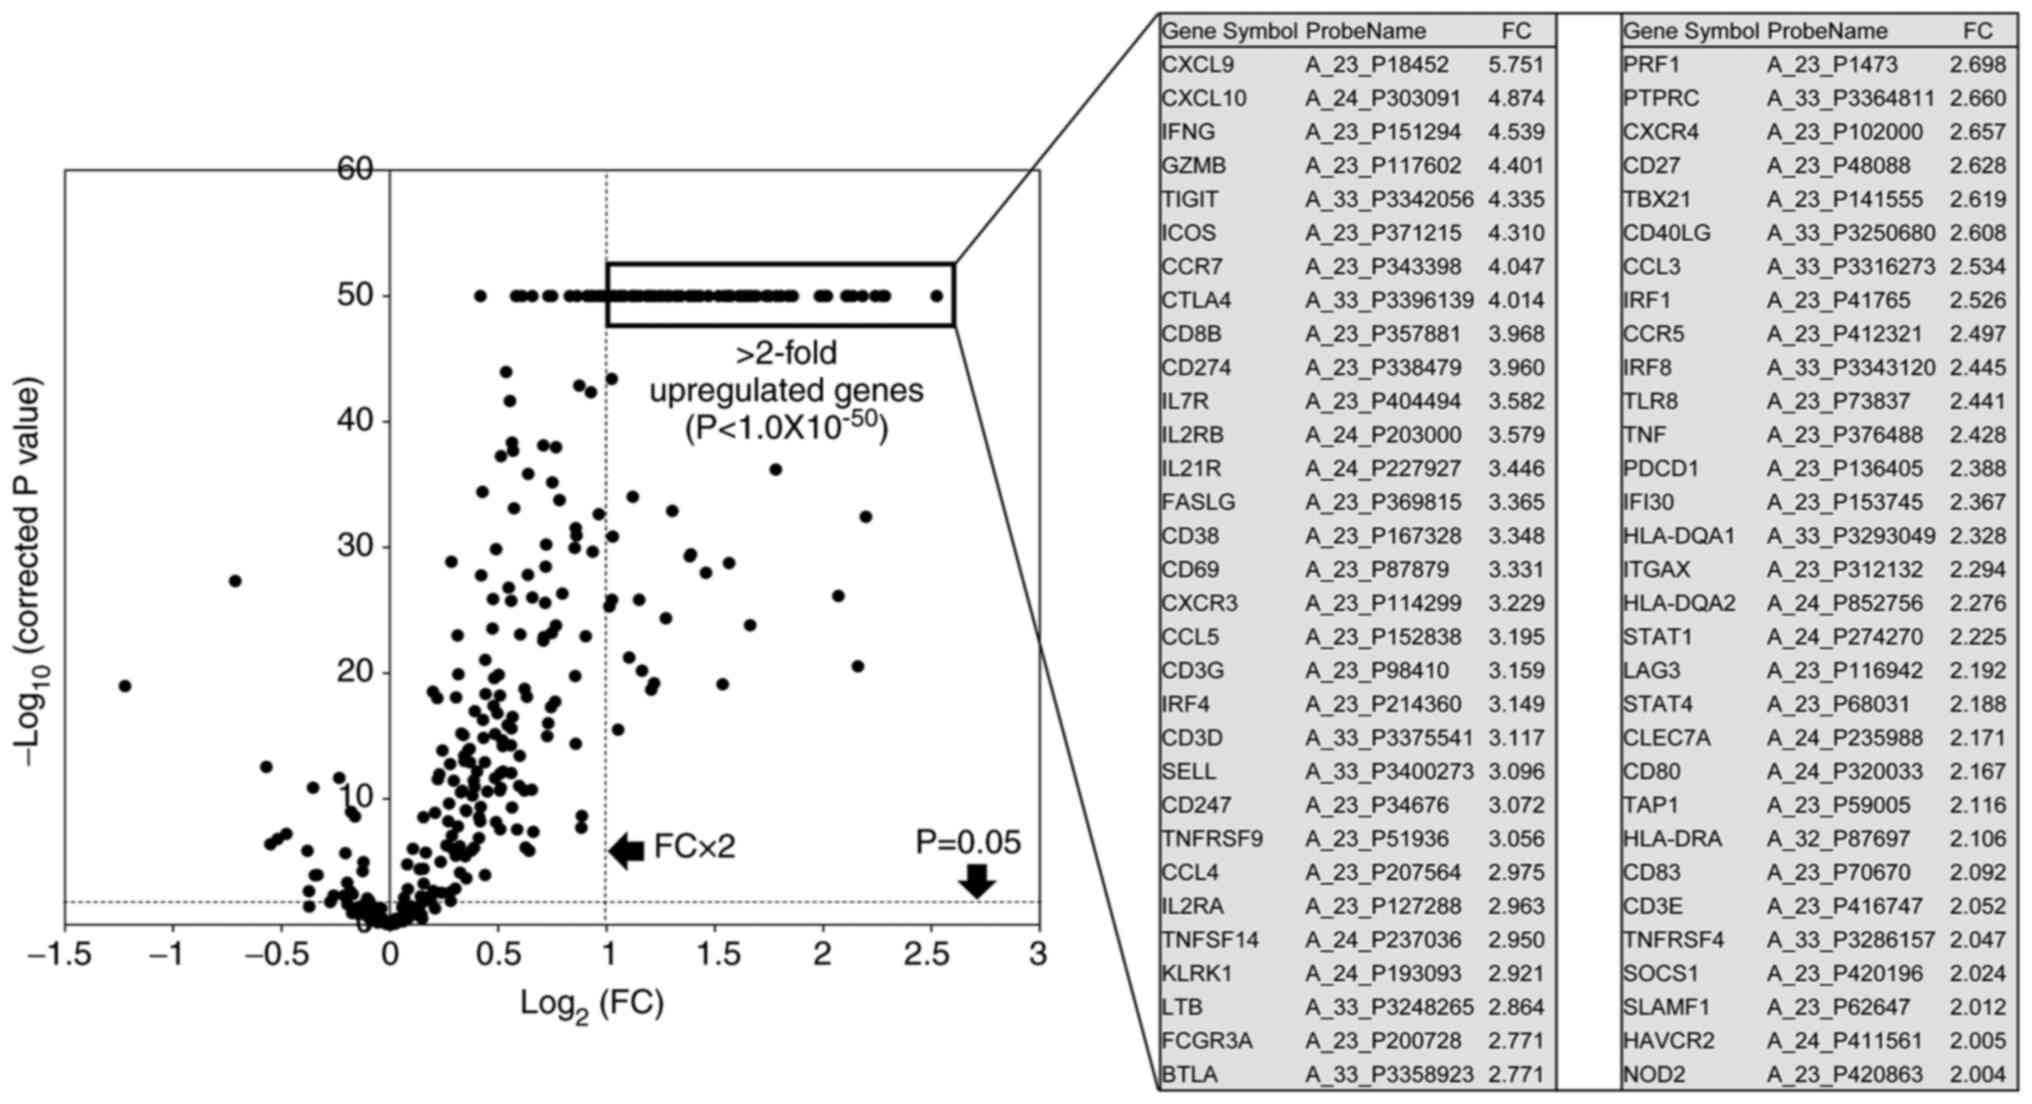
The identification of upregulated
immune response-associated genes in immune type A compared with the
other types
Based on the expression profile of the 293-immune
response-associated gene panel, 62 upregulated immune
response-associated genes (more than 2-fold and P-value 1.0E-50)
were identified using volcano plots (Fig. 2).
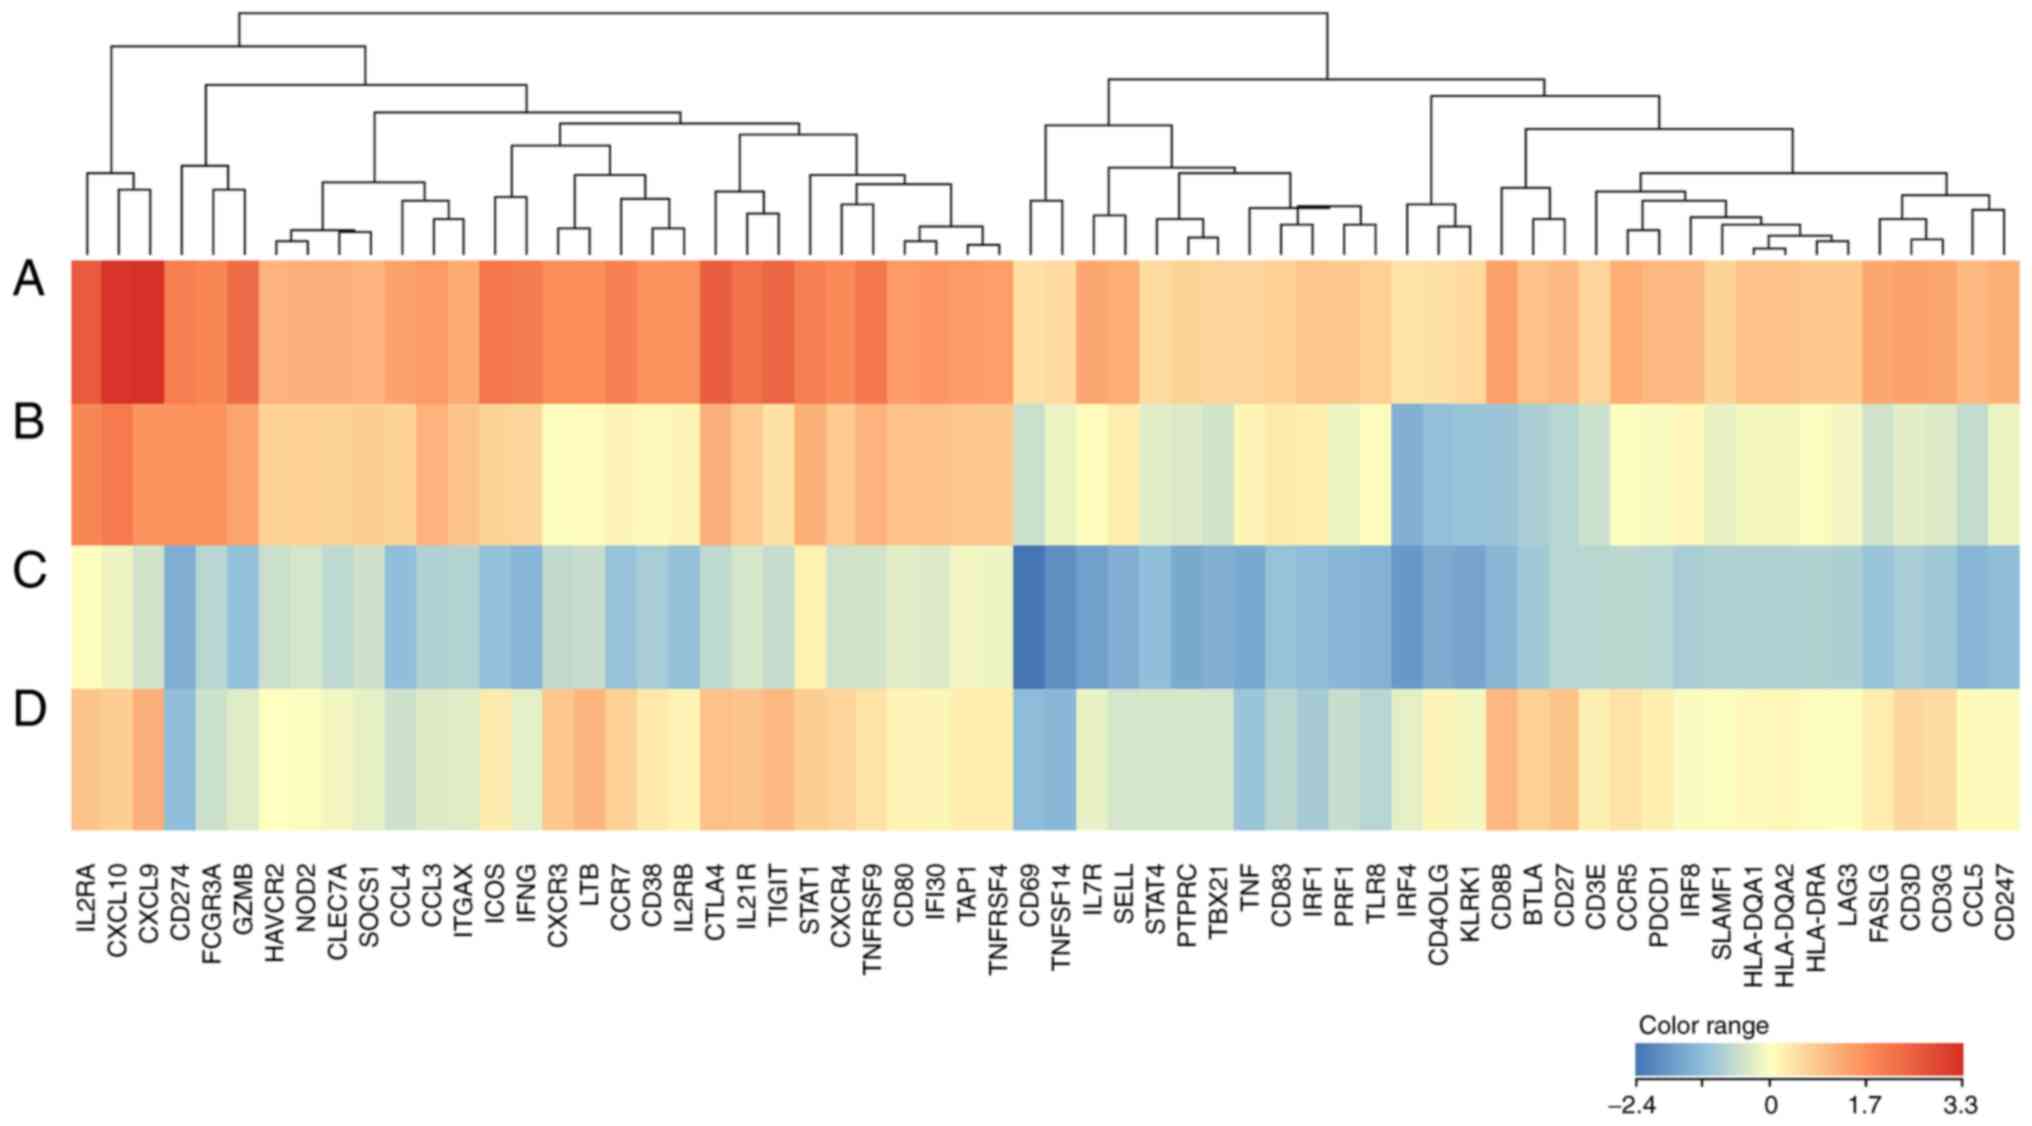
Comparison of upregulated genes among
immune types or between the poor prognosis and good prognosis
cohorts
The heatmap expression data of 62 upregulated genes
in group A were compared with those of the other groups.
Interestingly, in group A, T cell effector activation genes (CXCL9,
CXCL10, and TNFRSF9) and CTL killing genes (GZMB, CD16) showed high
expression, while immune checkpoint genes such as CTLA4 and TIGIT
also showed high expression levels. In contrast, in group C, T cell
effector activation genes (ICOS, CD69, and CD40LG) and Th1 cytokine
genes (IFNG and TNF) exhibited low expression (Fig. 3). Additionally, the upregulated T
cell activation genes identified in group A showed a tendency of
higher expression levels in the better survival cohort than in the
poorer survival cohort, as shown in Fig. 4.
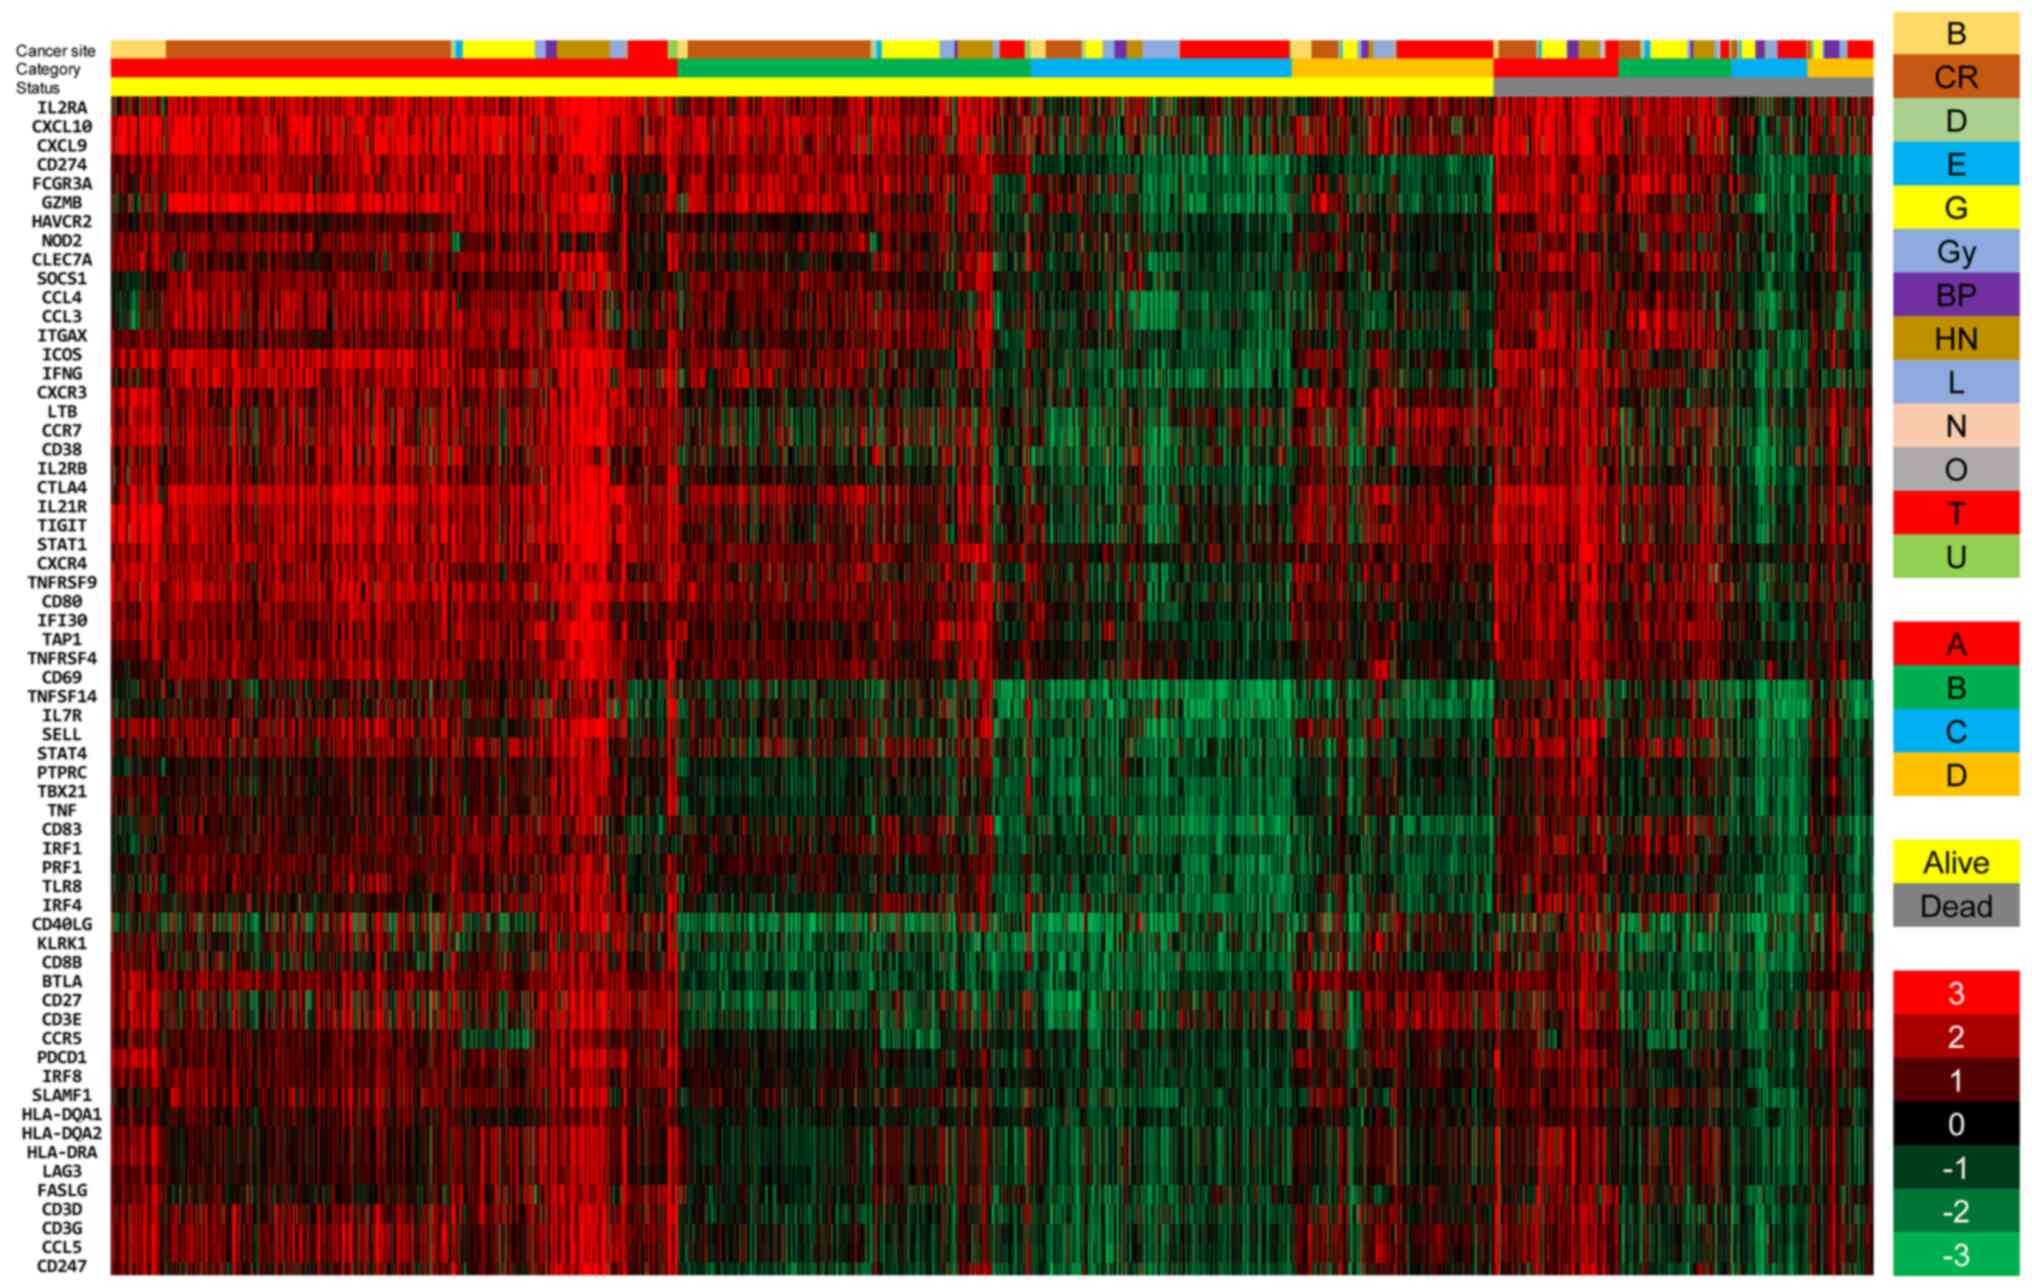 | Figure 4Comparison of the expression levels
of 62 upregulated genes between alive and deceased patients with
cancer. The two cohorts of patients were divided into 4 immune
groups, and classified into 13 histological types. The data are
presented in matrix format, where each row represents an individual
case, and each column represents a gene. Each cell in the matrix
represents the expression level of a gene in an individual case.
The red and green colors reflect the gene expression levels, as
indicated in the color scale (log2-transformed scale) in
the bottom right corner. B, breast; CR, colorectal; D, skin; E,
esophageal; G, stomach; Gy, uterine and ovarian; BP, bile duct and
pancreatic; HN, head and neck; L, liver; N, brain; O, bone; T,
lung; and U, kidney. |
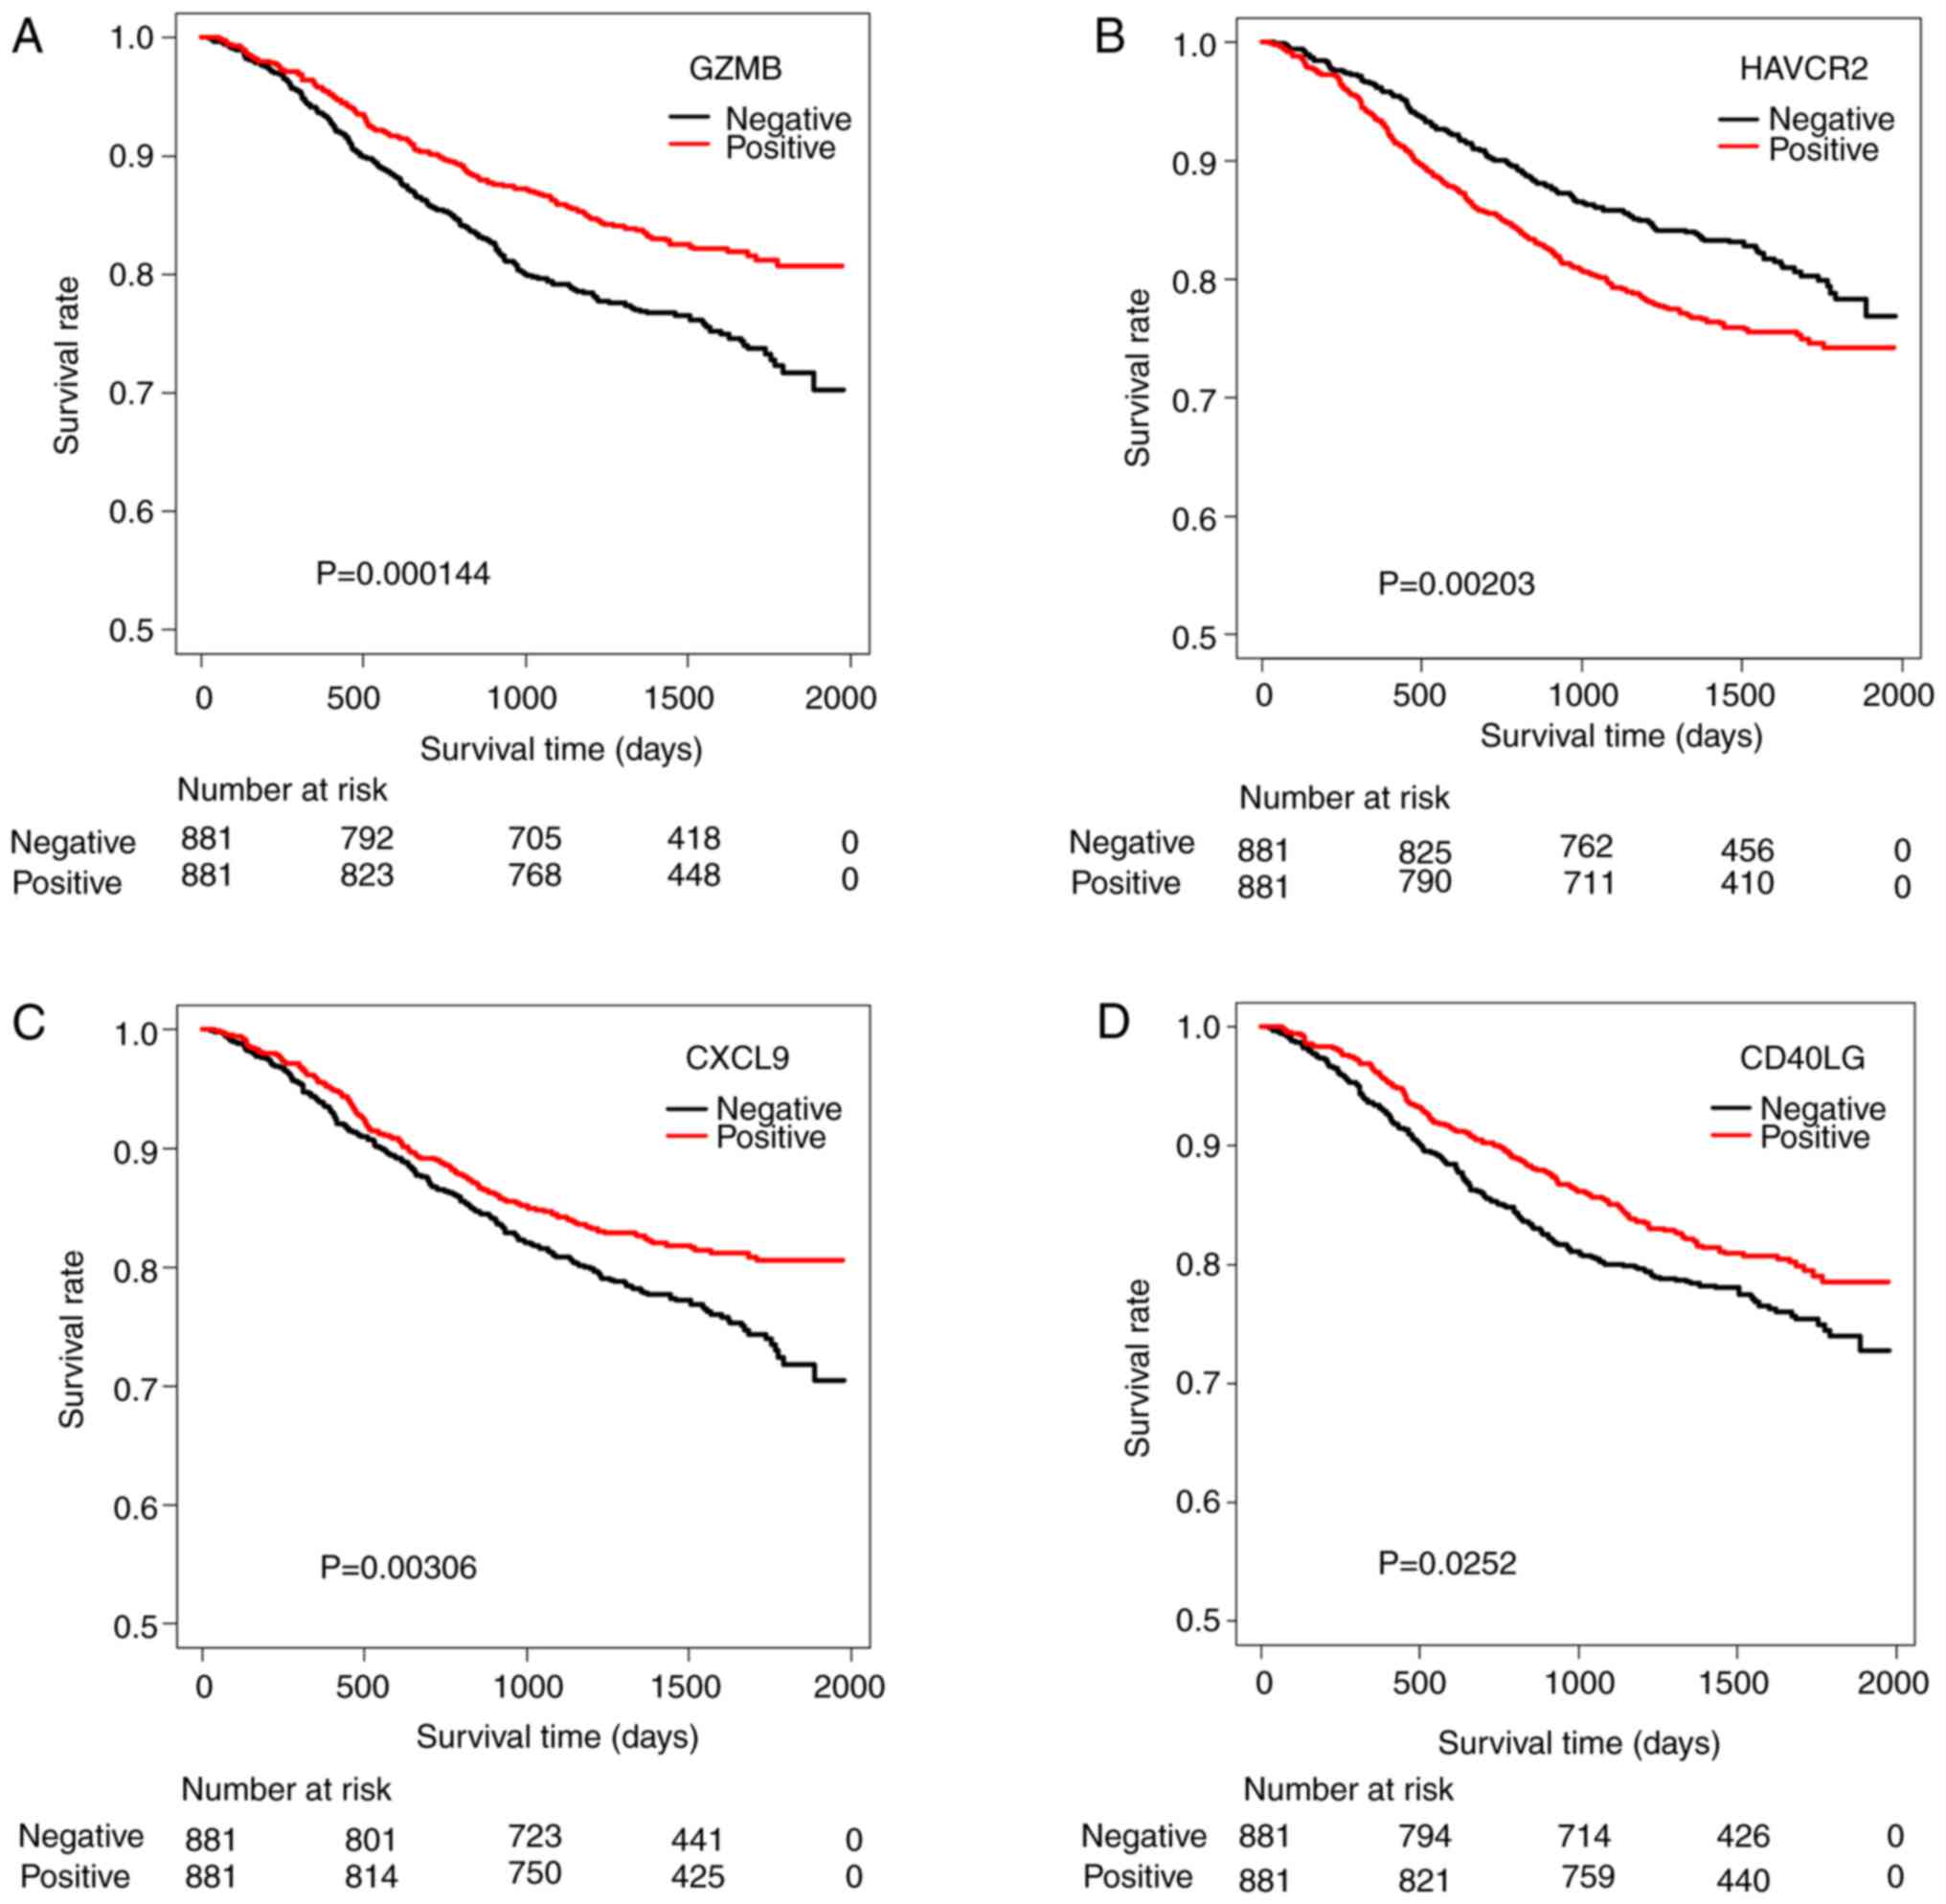
Association of the upregulated gene
expression level with the overall survival time
The association of 62 upregulated genes in group A
with the OST was analyzed by the log-rank test using EZR software.
Ultimately, 18 genes were found to be significantly associated with
prognosis (Table III). Memory T
cell markers such as PD-1, CD27 and ICOS, as well as activated
effector T cell genes (GZMB, CXCL10 and CD40LG) and mature DC
marker genes (CD80 and SLAMF1), were selected as prognostic
factors. Interestingly, immune checkpoint marker genes, such as
HAVCR2 and TIGIT, were also verified as prognostic markers;
however, the HAVCR2 gene was demonstrated to be a poor prognostic
marker, although it was upregulated in group A.
| Table IIIProbable prognostic genes identified
from 62 upregulated genes. |
Table III
Probable prognostic genes identified
from 62 upregulated genes.
| Probe name | Fold-change | Gene symbol | 5yrOS
(%)a Positive. vs.
Negative | Log-rank
P-value |
|---|
| A_23_P117602 | 4.401 | GZMB | 80.7 vs. 71.7 |
1.44x10⁻⁴ |
| A_24_P411561 | 2.005 | HAVCR2 | 74.1 vs. 78.3 |
2.03x10⁻³ |
| A_23_P371215 | 4.31 | ICOS | 80.5 vs. 71.9 |
2.14x10⁻³ |
| A_23_P18452 | 5.751 | CXCL9 | 80.5 vs. 71.8 |
3.06x10⁻³ |
| A_23_P420196 | 2.024 | SOCS1 | 79.6 vs. 72.8 |
3.44x10⁻³ |
| A_23_P136405 | 2.388 | PDCD1 | 80.3 vs. 72.1 |
3.6x10⁻³ |
| A_24_P303091 | 4.874 | CXCL10 | 80.5 vs. 71.9 |
4.76x10⁻³ |
| A_23_P98410 | 3.159 | CD3G | 79.8 vs. 72.7 |
1.47x10⁻² |
| A_23_P420863 | 2.004 | NOD2 | 79.1 vs. 73.3 |
1.82x10⁻² |
| A_33_P3250680 | 2.608 | CD40LG | 78.6 vs. 74.0 |
2.52x10⁻² |
| A_33_P3375541 | 3.117 | CD3D | 79.7 vs. 72.7 |
2.6x10⁻² |
| A_23_P62647 | 2.012 | SLAMF1 | 79.7 vs. 72.6 |
2.6x10⁻² |
| A_24_P320033 | 2.167 | CD80 | 79.2 vs. 73.2 |
2.96x10⁻² |
| A_23_P48088 | 2.628 | CD27 | 79.9 vs. 72.7 |
3.31x10⁻² |
| A_23_P416747 | 2.052 | CD3E | 78.9 vs. 73.6 |
3.64x10⁻² |
| A_33_P3342056 | 4.335 | TIGIT | 79.3 vs. 73.2 |
4.16x10⁻² |
| A_23_P338479 | 3.96 | CD274 | 78.6 vs. 73.8 |
4.33x10⁻² |
| A_23_P41765 | 2.526 | IRF1 | 79.2 vs. 73.0 |
4.53x10⁻² |
Identification of probable prognostic
genes using multivariate Cox hazards regression analysis
To evaluate the prognostic value of the genes, 18
probable prognostic genes identified using the Kaplan-Meier method
from 62 upregulated genes in group A were analyzed by the Cox
proportional hazards regression model. In particular, the
multivariate analysis demonstrated that four upregulated genes,
namely, GZMB, HAVCR2, CXCL9 and CD40LG, maintained their
significance (P<0.05), as shown in Table IV. The survival curves of these
four significant genes were drawn with the Kaplan-Meier method, and
the OST was compared between the group that was higher-than-the
median-level and the group that was lower-than-the median-level, as
shown in Fig. 5. The upregulation
of GZMB, CXCL9 and CD40LG gene expression might be linked to better
prognosis in group A patients.
| Table IVCox proportional hazards regression
analysis of overall survival in upregulated genes. |
Table IV
Cox proportional hazards regression
analysis of overall survival in upregulated genes.
| Variable | Hazard ratio (95%
CI) | P-value |
|---|
| GZMB | 0.628
(0.496-0.795) |
1.11x10⁻⁴ |
| HAVCR2 | 1.848
(1.479-2.309) |
6.63x10⁻⁸ |
| CXCL9 | 0.778
(0.613-0.988) | 0.0393 |
| CD40LG | 0.792
(0.642-0.977) | 0.0292 |
Discussion
With advances in genome analysis technologies such
as NGS- and single-cell RNA sequencing, probable immunological
factors belonging to the TME and associated with prognosis have
been more intensively, specifically and accurately investigated
(24-26).
Beyond the already-known TME factors that might be responsible for
the efficacy of cancer immunotherapy, such as positive PD-L1
expression, a high mutational burden and an advanced TIL status,
more specific and dynamic biomarkers associated with the immune
response have been reported (27-29).
Recently, Kumagai et al demonstrated using cytometry by time
of flight (CyTOF) analysis based on single-cell RNA-seq that a
balance between PD-1+CD8+ T cells and
PD-1+CD4+FoxP3+ Treg cells is a
critical determinant of the response to anti-PD-1/PD-L1 blockade
therapy (29).
Previously, we reported an efficient immunological
classification based on PD-L1 and CD8B gene expression levels and
demonstrated that immune type A (PD-L1+CD8B+)
was associated with the Th1 T cell and NK cell activation pathways,
dendritic cell maturation and cancer-apoptosis activation signals
and showed the highest score in immune-activation signaling
pathways by means of Ingenuity Pathways Analysis (IPA) software
(19). Similar studies have been
conducted that showed antitumor immunological features in
PD-L1+CD8+ cohort (11,12).
However, there have been few studies that have
performed a long-term follow-up of overall survival in cancer
patients belonging to the immune type classifications described
above. Ock et al classified similarly solid tumors into
specific immune types based on PD-L1 and CD8 gene expression data
derived from The Cancer Genome Atlas (TCGA) database and compared
the survival time between immune types; however, the temporary
difference in 3-year survival time in type A finally disappeared in
the 5-year comparison (12).
In the current study, we followed 1,763 patients
with tumors up to 70 months after registration in the project HOPE
study. Survival time analysis at 5 years revealed that group A had
a better prognosis than the other groups, as shown in Fig. 1. There are some concerns regarding
the temporary results of the present survival analysis: i)
Miscellaneous cancer patients across various histology groups were
included, and ii) there were various clinical courses, including
different types of therapies and response statuses. However,
despite different clinical courses in individual patients, the
immunological status at cancer diagnosis can be determined
temporarily in terms of the OST, and could be a reference parameter
for therapeutic design because some immunological mechanisms are
involved in tumor regression after or even during chemo- and
radiation therapy (30-33).
In the present study, the impressive findings were
that memory T cell markers (central ~ effector memory), such as
PD-1, CD27 and ICOS, were selected as prognostic factors. In
addition to effector-activated CTLs and NK cells, memory
marker+ T cells should be considered crucial factors
because i) PD-1+ T cells can achieve a good balance
between good and poor responses by immune checkpoint blockade
(27), and ii) effector memory T
cells that proliferate by the stimulation of antigen-presenting
cells, can be differentiated into activated effector CTLs (34). Another important observation was
that T cell exhaustion marker genes such as HAVCR22 (TIM3) and
TIGIT were included as prognostic markers. However, HAVCR2 was
found to be a negative prognostic marker, suggesting that it did
not contribute to the good prognosis of patients in immune group A.
Very recently, Simon et al demonstrated that a high
frequency of the PD-1+TIGIT+
(double-positive) CD8+ T cell subset in peripheral blood
can be a good predictive marker for a good response to anti-PD-1
therapy (35). Therefore, these
cells should be prolonged by anti-PD-1/PD-L1 blockade to maintain
the antitumor effect, which could contribute to the good prognosis
in cancer patients belonging to immune type A.
Additionally, based on prognostic factor profiling
in immune group A, the upregulation of the CD80, CD274 and
SLAMF1(36) genes might suggest the
presence of mature dendritic cells in the TME. Interestingly,
Schetters et al demonstrated that anti-PD-1 immune
checkpoint blockade induced mature monocyte-derived dendritic cells
in the TME (37), which means that
the presence of mature dendritic cells in the tumor site could be a
key factor in the prediction of ICB efficacy.
Considering that immunological conditions are varied
and complicated in the TME, the status of patients with cancer is
volatile and undetermined before the start of treatment. Most
likely, immune type group A (PD-L1+CD8+)
could be a good candidate to elicit neoantigen-specific T cell
reactions and result in an improved prognosis in cancer patients.
Efficient combination therapy with chemo- and radiation therapy
should be explored for these types of cancer cohorts in the
future.
Acknowledgements
Not applicable.
Funding
No funding was received.
Availability of data and materials
The datasets generated and/or analyzed during the
current study are available in the National Bioscience Database
Center repository (accession no. hum0127; https://humandbs.biosciencedbc.jp/en/).
Authors' contributions
RK and YA participated equally in the design of the
study and drafting of the manuscript, and were responsible for
completing the study. AS, YO, MTe, KUe, TO, SN, YH, NH, YK, YT,
HKat, MNi, KT, HKas, MNa and YI were responsible for the clinical
work, including the collection of clinical samples. TN, YS, KUr,
KO, AI, HM, CM, AK, KW and TA participated in the design of the
experiments and performed the genetic analysis. TS contributed to
the pathological diagnosis. AN and KM contributed to data analysis
and interpretation and confirmed the authenticity of all the raw
data. MTa, HKe and KY designed the current study, revised the
manuscript critically for important intellectual content and gave
final approval of the version to be published by taking
responsibility for the content. All authors read and approved the
final manuscript.
Ethics approval and consent to
participate
The Shizuoka Cancer Center launched Project HOPE
based on multiomics analyses, including WES and GEP. Ethics
approval for the HOPE study was obtained from the institutional
review board at the Shizuoka Cancer Center (authorization no.
25-33). Written informed consent was obtained from all patients
enrolled in the study.
Patient consent for publication
Written informed consent was obtained from all
patients for the publication of any associated data and
accompanying images.
Competing interests
The authors declare that they have no competing
interests.
References
|
1
|
Weber JS, O'Day S, Urba W, Powderly J,
Nichol G, Yellin M, Snively J and Hersh E: Phase I/II study of
ipilimumab for patients with metastatic melanoma. J Clin Oncol.
26:5950–5956. 2008.PubMed/NCBI View Article : Google Scholar
|
|
2
|
Topalian SL, Hodi FS, Brahmer JR,
Gettinger SN, Smith DC, McDermott DF, Powderly JD, Carvajal RD,
Sosman JA, Atkins MB, et al: Safety, activity, and immune
correlates of anti-PD-1 antibody in cancer. N Engl J Med.
366:2443–2454. 2012.PubMed/NCBI View Article : Google Scholar
|
|
3
|
Brahmer JR, Tykodi SS, Chow LQ, Hwu WJ,
Topalian SL, Hwu P, Drake CG, Camacho LH, Kauh J, Odunski K, et al:
Safety and activity of anti-PD-L1 antibody in patients with
advanced cancer. N Engl J Med. 366:2455–2465. 2012.PubMed/NCBI View Article : Google Scholar
|
|
4
|
Ascierto RA, Capone M, Urba WJ, Bifuco CB,
Botti G, Lugli A, Marincola FM, Ciliberto G, Galon J and Fox BA:
The additional facet of immunoscore: Immunoprofiling as a possible
predictive tool for cancer treatment. J Transl Med.
11(54)2013.PubMed/NCBI View Article : Google Scholar
|
|
5
|
Gnjatic S, Bronte V, Brunet LR, Butler MO,
Disis ML, Galon J, Hakansson LG, Hanks BA, Karanikas V, Khleif SN,
et al: Identifying baseline immune-related biomarkers to predict
clinical outcome of immunotherapy. J Immunother Cancer.
5(44)2017.PubMed/NCBI View Article : Google Scholar
|
|
6
|
Johnson DB, Frampton GM, Rioth MJ, Yusko
E, Xu Y, Guo X, Ennis RC, Fabrizio D, Chalmers ZR, Greenbowe J, et
al: Targeted next generation sequencing identifies markers of
response to PD-1 blockade. Cancer Immunol Res. 4:959–967.
2016.PubMed/NCBI View Article : Google Scholar
|
|
7
|
Dudley JC, Lin MT, Le DT and Eshleman JR:
Microsatellite instability as a biomarker for PD-1 blockade. Clin
Cancer Res. 22:813–820. 2016.PubMed/NCBI View Article : Google Scholar
|
|
8
|
Yarchoan M, Johnson BA III, Lutz ER,
Laheru DA and Jaffee EM: Targeting neoantigen to augment antitumor
immunity. Nat Rev Cancer. 17:209–222. 2017.PubMed/NCBI View Article : Google Scholar
|
|
9
|
Lin Y, Xu J and Lan H: Tumor-associated
macrophages in tumor metastasis: Biological roles and clinical
therapeutic applications. J Hematol Oncol. 12(76)2019.PubMed/NCBI View Article : Google Scholar
|
|
10
|
Fleming B, Hu X, Weber R, Nagibin V, Groth
C, Artevogt P, Utical J and Umansky V: Targeting myeloid-derived
suppressor cells to bypass tumor-induced immunosuppression. Front
Immunol. 9(398)2018.PubMed/NCBI View Article : Google Scholar
|
|
11
|
Rooney MS, Shukla SA, Wu CJ, Getz G and
Hacohen N: Molecular and genetic properties of tumors associated
with local immune cytolytic activity. Cell. 160:48–61.
2015.PubMed/NCBI View Article : Google Scholar
|
|
12
|
Ock CY, Keam B, Kim S, Lee JS, Kim M, Kim
TM, Jeon YK, Kim DW, Chung DH and Heo DS: Pan-cancer immunogenic
perspective on the tumor microenvironment based on PD-L1 and CD8
T-cell infiltration. Clin Cancer Res. 22:2261–2270. 2016.PubMed/NCBI View Article : Google Scholar
|
|
13
|
Teng MW, Ngiow SF, Ribas A and Smyth MJ:
Classifying cancers based on T-cell infiltration and PD-L1. Cancer
Res. 75:2139–2145. 2015.PubMed/NCBI View Article : Google Scholar
|
|
14
|
Yarchoan M, Hopkins A and Jaffee EM: Tumor
mutational burden and response rate to PD-1 inhibition. N Engl J
Med. 377:2500–2501. 2017.PubMed/NCBI View Article : Google Scholar
|
|
15
|
Bruni D, Angell HK and Galon J: The immune
contexture and immunoscore in cancer prognosis and therapeutic
efficacy. Nat Rev Cancer. 20:662–680. 2020.PubMed/NCBI View Article : Google Scholar
|
|
16
|
Snyder A, Makarov V, Merghoub T, Yuan J,
Zaretsky JM, Desrichard A, Walsh LA, Postow MA, Wong P, Ho TS, et
al: Genetic basis for clinical response to CTLA-4 blockade in
melanoma. N Engl J Med. 371:2189–2199. 2014.PubMed/NCBI View Article : Google Scholar
|
|
17
|
Iwai Y, Ishida M, Tanaka Y, Okazaki T,
Honjo T and Minato N: Involvement of PD-L1 on tumor cells in the
escape from host immune system and tumor immunotherapy by PD-L1
blockade. Proc Natl Acad Sci USA. 99:12293–12297. 2002.PubMed/NCBI View Article : Google Scholar
|
|
18
|
Petty AJ, Dai R, Lapalombella R, Baiocchi
RA, Benson DM, Li Z, Huang X and Yang Y: Hedgehog-induced PD-L1 on
tumor-associated macrophages is critical for suppression of
tumor-infiltrating CD8+ T cell function. JCI Insight.
6(e146707)2021.PubMed/NCBI View Article : Google Scholar
|
|
19
|
Kondou R, Iizuka A, Nonomura C, Miyata H,
Ashizawa T, Nagashima T, Ohshima K, Urakami K, Kusuhara M,
Yamaguchi K and Akiyama Y: Classification of tumor microenvironment
immune types based on immune response-associated gene expression.
Int J Oncol. 54:219–228. 2019.PubMed/NCBI View Article : Google Scholar
|
|
20
|
Ohshima K, Hatakeyama K, Nagashima T,
Watanabe Y, Kanto K, Doi Y, Ide T, Shimoda Y, Tanabe T, Ohnami S,
et al: Integrated analysis of gene expression and copy number
identified potential cancer driver genes with
amplification-dependent overexpression in 1,454 solid tumors. Sci
Rep. 7(641)2017.PubMed/NCBI View Article : Google Scholar
|
|
21
|
Vogelstein B, Papadopoulos N, Velculescu
VE, Zhou S, Doaz LA Jr and Kinzler KW: Cancer genome landscapes.
Science. 339:1546–1558. 2013.PubMed/NCBI View Article : Google Scholar
|
|
22
|
Akiyama Y, Kondou R, Iizuka A, Ohshima K,
Urakami K, Nagashima T, Shimoda Y, Tanabe T, Ohnami S, Ohnami S, et
al: Immune response-associated gene analysis of 1,000 cancer
patients using whole-exome sequencing and gene expression
profiling-Project HOPE. Biomed Res. 37:233–242. 2016.PubMed/NCBI View Article : Google Scholar
|
|
23
|
Kanda Y: Investigation of the freely
available easy-to-use software ‘EGR’ for medical statistics. Bone
Marrow Transplant. 48:452–458. 2013.PubMed/NCBI View Article : Google Scholar
|
|
24
|
Gubin MM, Esaulova E, Ward JP, Malkova ON,
Runci D, Wong P, Noguchi T, Arthur CD, Meng W, Alspach E, et al:
High-dimensional analysis delineates myeloid and lymphoid
compartment remodeling during successful immune-checkpoint cancer
therapy. Cell. 175:1014–1030. 2018.PubMed/NCBI View Article : Google Scholar
|
|
25
|
Guo X, Zhang Y, Zheng L, Zheng C, Song J,
Zhang Q, Kang B, Liu Z, Jin L, Xing R, et al: Global
characterization of T cells in non-small-cell lung cancer by
single-cell sequencing. Nat Med. 24:978–985. 2018.PubMed/NCBI View Article : Google Scholar
|
|
26
|
Sathe A, Grimes SM, Lau BT, Chen J, Suarez
C, Huang RJ, Poultsides G and Ji HP: Single-cell genomic
characterization reveals the cellular reprogramming of the gastric
tumor microenvironment. Clin Cancer Res. 26:2640–2653.
2020.PubMed/NCBI View Article : Google Scholar
|
|
27
|
Hossain MA, Liu G, Dai B, Si Y, Yang Q,
Wazir J, Birnbaumer L and Yang Y: Reinvigorating exhausted CD8+
cytotoxic T lymphocytes in the tumor microenvironment and current
strategies in cancer immunotherapy. Med Res Rev. 41:156–201.
2021.PubMed/NCBI View Article : Google Scholar
|
|
28
|
Xiao Z, Locasale JW and Dai Z: Metabolism
in the tumor microenvironment: Insights from single-cell analysis.
Oncoimmunology. 9(1726556)2020.PubMed/NCBI View Article : Google Scholar
|
|
29
|
Kumagai S, Togashi Y, Kamada T, Sugiyama
E, Nishinakamura H, Takeuchi Y, Vitaly K, Itahashi K, Maeda Y,
Matsui S, et al: The PD-1 expression balance between effector and
regulatory T cells predicts the clinical efficacy of PD-1 blockade
therapies. Nat Immunol. 21:1346–1358. 2020.PubMed/NCBI View Article : Google Scholar
|
|
30
|
Opzoomer JW, Sosnowska D, Anstee J, Spicer
JF and Arnold JN: Cytotoxic chemotherapy as an immune stimulus: A
molecular perspective on turning up the immunological heat on
cancer. Front Immunol. 10(1654)2019.PubMed/NCBI View Article : Google Scholar
|
|
31
|
Yu WD, Sun G, Li J, Xu J and Wang X:
Mechanisms and therapeutic potentials of cancer immunotherapy in
combination with radiotherapy and/or chemotherapy. Cancer Lett.
452:66–70. 2019.PubMed/NCBI View Article : Google Scholar
|
|
32
|
Turgeon GA, Weickhardt A, Azad AA, Solomon
B and Siva S: Radiotherapy and immunotherapy: A synergistic effect
in cancer care. Med J Aust. 210:47–53. 2019.PubMed/NCBI View Article : Google Scholar
|
|
33
|
Rodriguez-Ruiz ME, Vanpouille-Box C,
Melero I, Formenti SC and Demaria S: Immunological mechanisms
responsible for radiation-induced abscopal effect. Trends Immunol.
39:644–655. 2018.PubMed/NCBI View Article : Google Scholar
|
|
34
|
Mitsuya K, Akiyama Y, Iizuka A, Miyata H,
Deguchi S, Hayashi N, Maeda C, Kondou R, Kanematsu A, Watanabe K,
et al: Alpha-type-1 polarized dendritic cell-based vaccination in
newly diagnosed high-grade glioma: A phase II clinical trial.
Anticancer Res. 40:6473–6484. 2020.PubMed/NCBI View Article : Google Scholar
|
|
35
|
Simon S, Voillet V, Vignard V, Wu Z,
Dabrowski C, Jouand N, Beauvais T, Khammari A, Braudeau C, Josien
R, et al: PD-1 and TIGIT coexpression identifies a circulating CD8
T cell subset predictive of response to anti-PD-1 therapy. J
Immunother Cancer. 8(e001631)2020.PubMed/NCBI View Article : Google Scholar
|
|
36
|
Bleharski JR, Niazi KR, Sieling PA, Cheng
G and Modlin RL: Signaling lymphocytic activation molecule is
expressed on CD40 ligand-activated dendritic cells and
directly augments production of inflammatory cytokines. J Immunol.
167:3174–3181. 2001.PubMed/NCBI View Article : Google Scholar
|
|
37
|
Schetters ST, Rodriguez E, Kruijssen LJ,
Crommentuijn MHW, Boon L, Van den Bossche J, Den Haan JMM and Van
Kooyk Y: Monocyte-derived APCs are central to the response of PD1
checkpoint blockade and provide a therapeutic target for
combination therapy. J Immunother Cancer. 8(e000588)2020.PubMed/NCBI View Article : Google Scholar
|