Introduction
Recently, liquid biopsies have garnered attention
for their applications in personalised medicine. A liquid biopsy,
as opposed to a tissue biopsy, requires that the analytical sample
is derived from the bodily fluid of a patient by a minimally
invasive method. This includes but is not limited to
peripheral-vein blood, saliva, urine and cerebrospinal fluid. When
considering blood as a bio-source there are potential components
that can be considered such as circulating tumour cells (CTCs),
platelets or plasma as a source of circulating tumour (ct) nucleic
acids (1). The choice of component
used in a liquid biopsy assay will depend on the disease being
queried, the potential for gathering tumour derived information and
downstream applications.
Circulating tumour cells shed into systemic
circulation by the primary tumour or metastases (2). Tumour cells enter the circulation via
intravasation and typically an epithelial-mesenchymal transition as
part of the metastatic cascade. However, CTCs may also be found in
clusters in the circulation (3).
CTCs and/or circulating tumour cell clusters can be isolated from
blood in systemic circulation at which point their DNA, RNA,
protein expression or functionality can be studied (4). If efficiently isolated, CTCs are rich
sources for multi-omic analyses that may not only aid in assessment
of disease or disease progression but also in understanding aspects
of tumour processes.
The majority (>90%) of solid lesions found in the
kidney are renal cell carcinomas (5) and patients with the disease may
benefit from the advancement of liquid biopsy based molecular
detection (6). More than 60% of
RCC patients are asymptomatic, and often radiologic diagnoses are
made incidentally (5,7). 20% of these cases are metastatic at
diagnosis (8,9). For local disease, surgical resection
is performed, however, 30% of these patients will experience
recurrence within 5 years after surgery (9,10).
Despite these circumstances, currently there are no cost-effective
or practical approaches to detecting early metastases or monitoring
recurrence (11).
The three most common RCC subtypes are clear cell
RCC (ccRCC), papillary RCC (p1RCC & p2RCC) and chromophobe RCC
(chRCC) accounting for 75-80%, 15% and 5% of cases, respectively
(12,13). These tumour entities arise along
the nephron with ccRCC and pRCC originating from cells of the
proximal tubules and chRCC from the collecting duct. As a
consequence, they are transcriptionally distinct, with ccRCCs and
pRCCs retaining much of the HNF-driven transcriptional program
found in the proximal tubules and chRCC retaining the FOXI1-driven
programme defining collecting duct cells (12). Additionally, almost all ccRCC
tumours lack a functional VHL protein, rendering them
pseudo-hypoxic due to the accumulation of hypoxia inducible factor
(HIF) proteins (14). These
transcriptional differences between the subtypes set the stage for
liquid biopsy approaches that could allow for subtype specific
monitoring of RCC tumours.
With regards to blood based liquid biopsies, it has
been observed that RCC is a poor shedder of circulating tumour DNA
(ctDNA) and hence may be better suited for CTC analyses (15). Importantly, RCC cells are not
suitable for the commonly used and FDA approved EpCAM based
isolation strategies due to their poor expression of this surface
marker, despite being of epithelial origin (16,17).
Antigen-dependent enrichment methods, such as the use of the
surface marker CA9 in ccRCC, has been previously employed to
successfully detect CTCs (18,19).
However, this type of enrichment is limited to one subtype or
population of RCC CTCs. In order to broadly enrich CTCs from a
wider range of RCC subtypes, an antigen-independent approach is
desirable such as cell size-based enrichment of CTCs (16,20).
We have addressed this need by employing the ClearCell FX platform
which uses a size-based, microfluidic enrichment approach. This
platform enriches fully intact and viable CTCs directly from whole
blood by exploiting the biophysical disparities between CTCs and
other cells found in the blood through the Dean Flow Fractionation
principle (21). Cells travelling
through a spiral microfluidic channel experience counter rotating
flow vortices (collectively called a Dean vortex), which channel
larger cells towards the inner wall of the channel and smaller
cells towards the outer wall. In addition to this, there are cell
diameter dependent wall-induced and shear-induced lift forces which
further focus the cells along opposing inner wall of the channel.
Direct enrichment in buffer is beneficial, compared to the
Parsortix system for example, where cells are enriched inside a
cassette and washing out these cells may pose a risk of cell loss
(22). Enriched, intact CTCs on a
limited background of leucocytes within this buffer can then be
processed downstream for applications such as gene expression
querying. We have evaluated the performance of this platform in
relation to enriching RCC cells and then explored and optimized
methods for specifically detecting these cells through the use of
subtype specific biomarkers.
Materials and methods
Primary patient tissue, primary cells,
cell culture and healthy blood controls
A total of 16 primary RCC patient tumour samples
(Table I) and 5 primary RCC cell
were kindly provided by Dr Helén Nilsson, Department of
Translational Medicine, Lund University for validation of selected
biomarkers. Patient tumour samples were retrieved from the material
collection established after Lund University ethical committee
approval (approval no. LU680-08), where informed written consent
was obtained before archival. Human renal tissue dissociation and
culturing was performed as described in Appendix S1 and previously described in
Hansson et al (23). Tumour
tissues obtained consisted of ccRCC, p1RCC, p2RCC and chRCC tissues
and cells that were predetermined by a trained pathologist. ccRCC
cell lines SNU-349 (Korean Cell Line Bank) and 786-O (ATCC) were
cultured in RPMI-1640 (Corning, Manassas, USA) and DMEM (Corning,
Manassas, USA) respectively, both medium supplemented with 10%
foetal bovine serum (Gibco, MA, USA). All cell lines were incubated
in a humidified chamber in 5% CO2 at 37˚C, were STR
authenticated, had a passage number of not more than 20 and were
mycoplasma free. Healthy blood for controls were obtained from the
Blood donation centre in Lund with informed written consent from
patients and ethical permission obtained by the regional health
care provider (Region Skåne, Lund, Sweden; approval no.
2018:19).
 | Table IPatient tumour characteristics for
biomarker panel validation. |
Table I
Patient tumour characteristics for
biomarker panel validation.
| Patient ID | RCC subtype | Furhman grade | Stage |
|---|
| R294T | ccRCC | F2 | pT1a |
| R320T | ccRCC | F1 | pT1b |
| R375T | ccRCC | F3(I) | pT3a |
| R363T | ccRCC | F3(I) | pT3a |
| R256T | chRCC | F3 | pT3a |
| R308T | chRCC | - | pT1a |
| R377T | chRCC | - | pT1a |
| R275T | chRCC | F3(I) | F3 (I) |
| R221T | p1RCC | F3 | pT2b |
| R163T | p1RCC | F2 | pT1b |
| R376T | p1RCC | F2(I) | pT1b |
| R188T | p1RCC | F1 | pT3a |
| R290T | p2RCC | F4 | pT3b |
| R303T | p2RCC | F2(I) | pT1b |
| R321T | p2RCC | F2(I) | pT1b |
| R199T | p2RCC | F4 | pT3a |
Identification of RCC subtype specific
marker genes
CA9 and SLC6A3 were selected as ccRCC
subtype specific markers based on a literature search and
previously published data from Hansson et al (23). The subtype specific expression of
these markers was confirmed in the TCGA data set as described
below. The same approach was also used to identify subtype specific
markers for the other two subtypes, pRCC and chRCC. Level 3
RNA-sequencing data processed using the ‘UNC V2 RNA-Seq’ workflow
was downloaded from The Cancer Genome Atlas (TCGA) data portal
(https://portal.gdc.cancer.gov/), as
described in Lindgren et al (12). Statistical analyses were performed
using the R software (http://www.r-project.org). Differential gene
expression between clear cell, papillary and chromophobe RCC (KIRC,
KIRP and KICH, respectively) tumours was determined using the Limma
Bioconductor package (24). For
the analysis of taxonomy groups, samples from all 3 TCGA kidney
cancer projects [chromophobe RCC (KICH), clear cell (KIRC),
papillary kidney carcinoma (KIRP)] were merged into one single
dataset (25). Molecular RCC
taxonomy groups as well as clinical and histopathologic parameters
were used as presented in the article by Chen et al
(26). The selection criteria for
sub-type specific expression were minimal expression in human blood
(based on the blood datasets found in the Human Protein Atlas,
available from https://www.proteinatlas.org) and distinct RCC
sub-type specific expression. For the two types of papillary RCC
defined by Chen et al (26)
(p.e1 and p.e2) optimal markers for the more common p.e1 subtype
(but also displaying elevated expression in p.e2 tumours) were
selected (Table SI). These
selection criteria resulted in a panel of 7 genes (Table II).
| Table IIBiomarkers selected to distinguish
RCC subtypes. |
Table II
Biomarkers selected to distinguish
RCC subtypes.
| RCC subtype | Selected
markers |
|---|
| Clear Cell RCC | SLC6A3,
CA9 |
| Papillary RCC | SOSTDC1,
SLC34A2, LRRN4 |
| Chromophobe
RCC | SLC26A7,
ATP6V0A4 |
Verification of subtype specific gene
expression
cDNA synthesis for cell lines and primary tumours
was performed using the High-Capacity RNA-to-cDNA kit. Quantitative
PCR (qPCR) was performed on a QuantStudio 7 Flex Real-Time PCR
system using TaqMan Gene Expression Master Mix and TaqMan Probes
(Table III) (all from Applied
Biosystems, Vilnius, Lithuania). Relative gene expression from qPCR
data was calculated using the double delta Cq method and normalised
to β-actin levels (27).
| Table IIITaqMan probes used for subtype
specific markers. |
Table III
TaqMan probes used for subtype
specific markers.
| Gene name | TaqMan probe |
|---|
| CA9 | Hs00154208_m1 |
| SLC6A3 | Hs00997374_m1 |
| SOSTDC1 | Hs00383602_m1 |
| SLC34A2 | Hs00197519_m1 |
| LRRN4 | Hs00379905_m1 |
| SLC26A7 | Hs01104163_m1 |
|
ATP6V0A4 | Hs00220986_m1 |
Cell size measurements
Cell diameter of RCC cell lines and primary cell
lines were measured on a Nucleocounter NC-3000 (ChemoMetec,
Allerod, Denmark) using NC-Slide A8 with the Cell Viability and
Cell Count Assay, according to manufacturer's instructions.
Establishment of ClearCell FX system
performance for RCC cells
Whole blood (7.5 ml) was processed for each run on
the ClearCell FX system (Biolidics, Singapore). Firstly, red blood
cells (RBCs) were lysed by a 10-minute incubation with a RBC lysis
buffer (G-Bioscience, St. Louis, MO, USA) and discarded via
centrifugation and removal of supernatant. The resulting cell
pellet containing nucleated cells was resuspended in 4 ml of
ClearCell FX re-suspension buffer prior to being loaded onto the
ClearCell FX system and running ‘Protocol 1’. Renal cancer cell
line SNU-349 and primary RCC cells were used to establish the
recovery efficiency of the ClearCell FX tumour cell isolation
system for RCC cells. Cells were labelled by incubating in serum
free media (Corning, Manassas, USA) with a final concentration of
25 µM CellTracker Green CMFDA (Invitrogen, Carlsbad, USA) dye for
45 min. Cells were then washed with DPBS and diluted to varying
numbers before being counted and spiked into 7.5 ml of healthy
donor blood. The spiked blood sample was then processed and run
through the ClearCell FX system according to manufacturer's
instructions. The isolated output cells were then pelleted,
resuspended in a lower volume and aliquoted into a 96-well plate.
Labelled and isolated cells were counted using an inverted
immunofluorescence microscope to calculate the recovery
efficiency.
RNA extraction,
global-preamplification and cDNA clean-up
RNA extraction for ClearCell FX output samples were
performed according to manufacturer's instructions using the Norgen
Biotek Single Cell RNA Purification kit (Norgen Biotek Corp.,
Thorold, Canada) and RNA was eluted in 14 µl of PCR clean water.
Global pre-amplification of RNA and cDNA clean-up was performed on
RNA extracts from ClearCell FX system outputs using the SMART-Seq
v4 Ultra Low Input RNA kit (Takara Bio Inc., Shiga, Japan)
according to manufacturer instructions. Pre-amplified cDNA was
purified using AMPure XP magnetic bead solution (Beckman Coulter,
USA) and eluted in 20 µl TE buffer. RNA concentration, RNA
integrity number and pre-amplified cDNA concentration from
ClearCell FX system outputs was assessed on the Agilent 2100
Bioanalyzer (Agilent Technologies, Santa Clara, USA). Primary
patient tumour tissue (<30 mg) was processed by disruption in a
TissueLyser using Trizol (Qiagen, Hilden, Germany). Homogenization
was achieved by flushing the disrupted sample through a QIAshredder
column. Subsequent RNA extraction was performed using the Qiagen
RNeasy Mini (Qiagen, Hilden, Germany) kit according to
manufacturer's instructions. RNA concentration and quality from
cultured cells and primary tumour material was assessed on a
Nanodrop 2000 (Thermo Fisher Scientific, Waltham, USA).
Real-time monitoring of global
pre-amplification
Global pre-amplification was monitored in real time
to obtain the optimal cycle number by adding 0.1X SYBR Green (Sigma
Aldrich, Darmstadt, Germany) and allowing the reaction to run for
40 cycles (28).
Statistical analyses
Mann-Whitney U, mean and SEM calculations were
performed on GraphPad Prism software (Graph Pad Software, San
Diego, USA). Kruskal-Wallis with Dunn's comparison calculations
were performed on R-software (Vienna, Austria) and GraphPad
Prism.
Results
Tumour cell isolation strategy
In this study we set out to develop a method for
efficient isolation of CTCs from RCC patient blood. Previous
studies have indicated that label-free, size-based enrichment is
particularly well suited for RCC, which led us to employ the
size-based ClearCell FX system for our study (16,29).
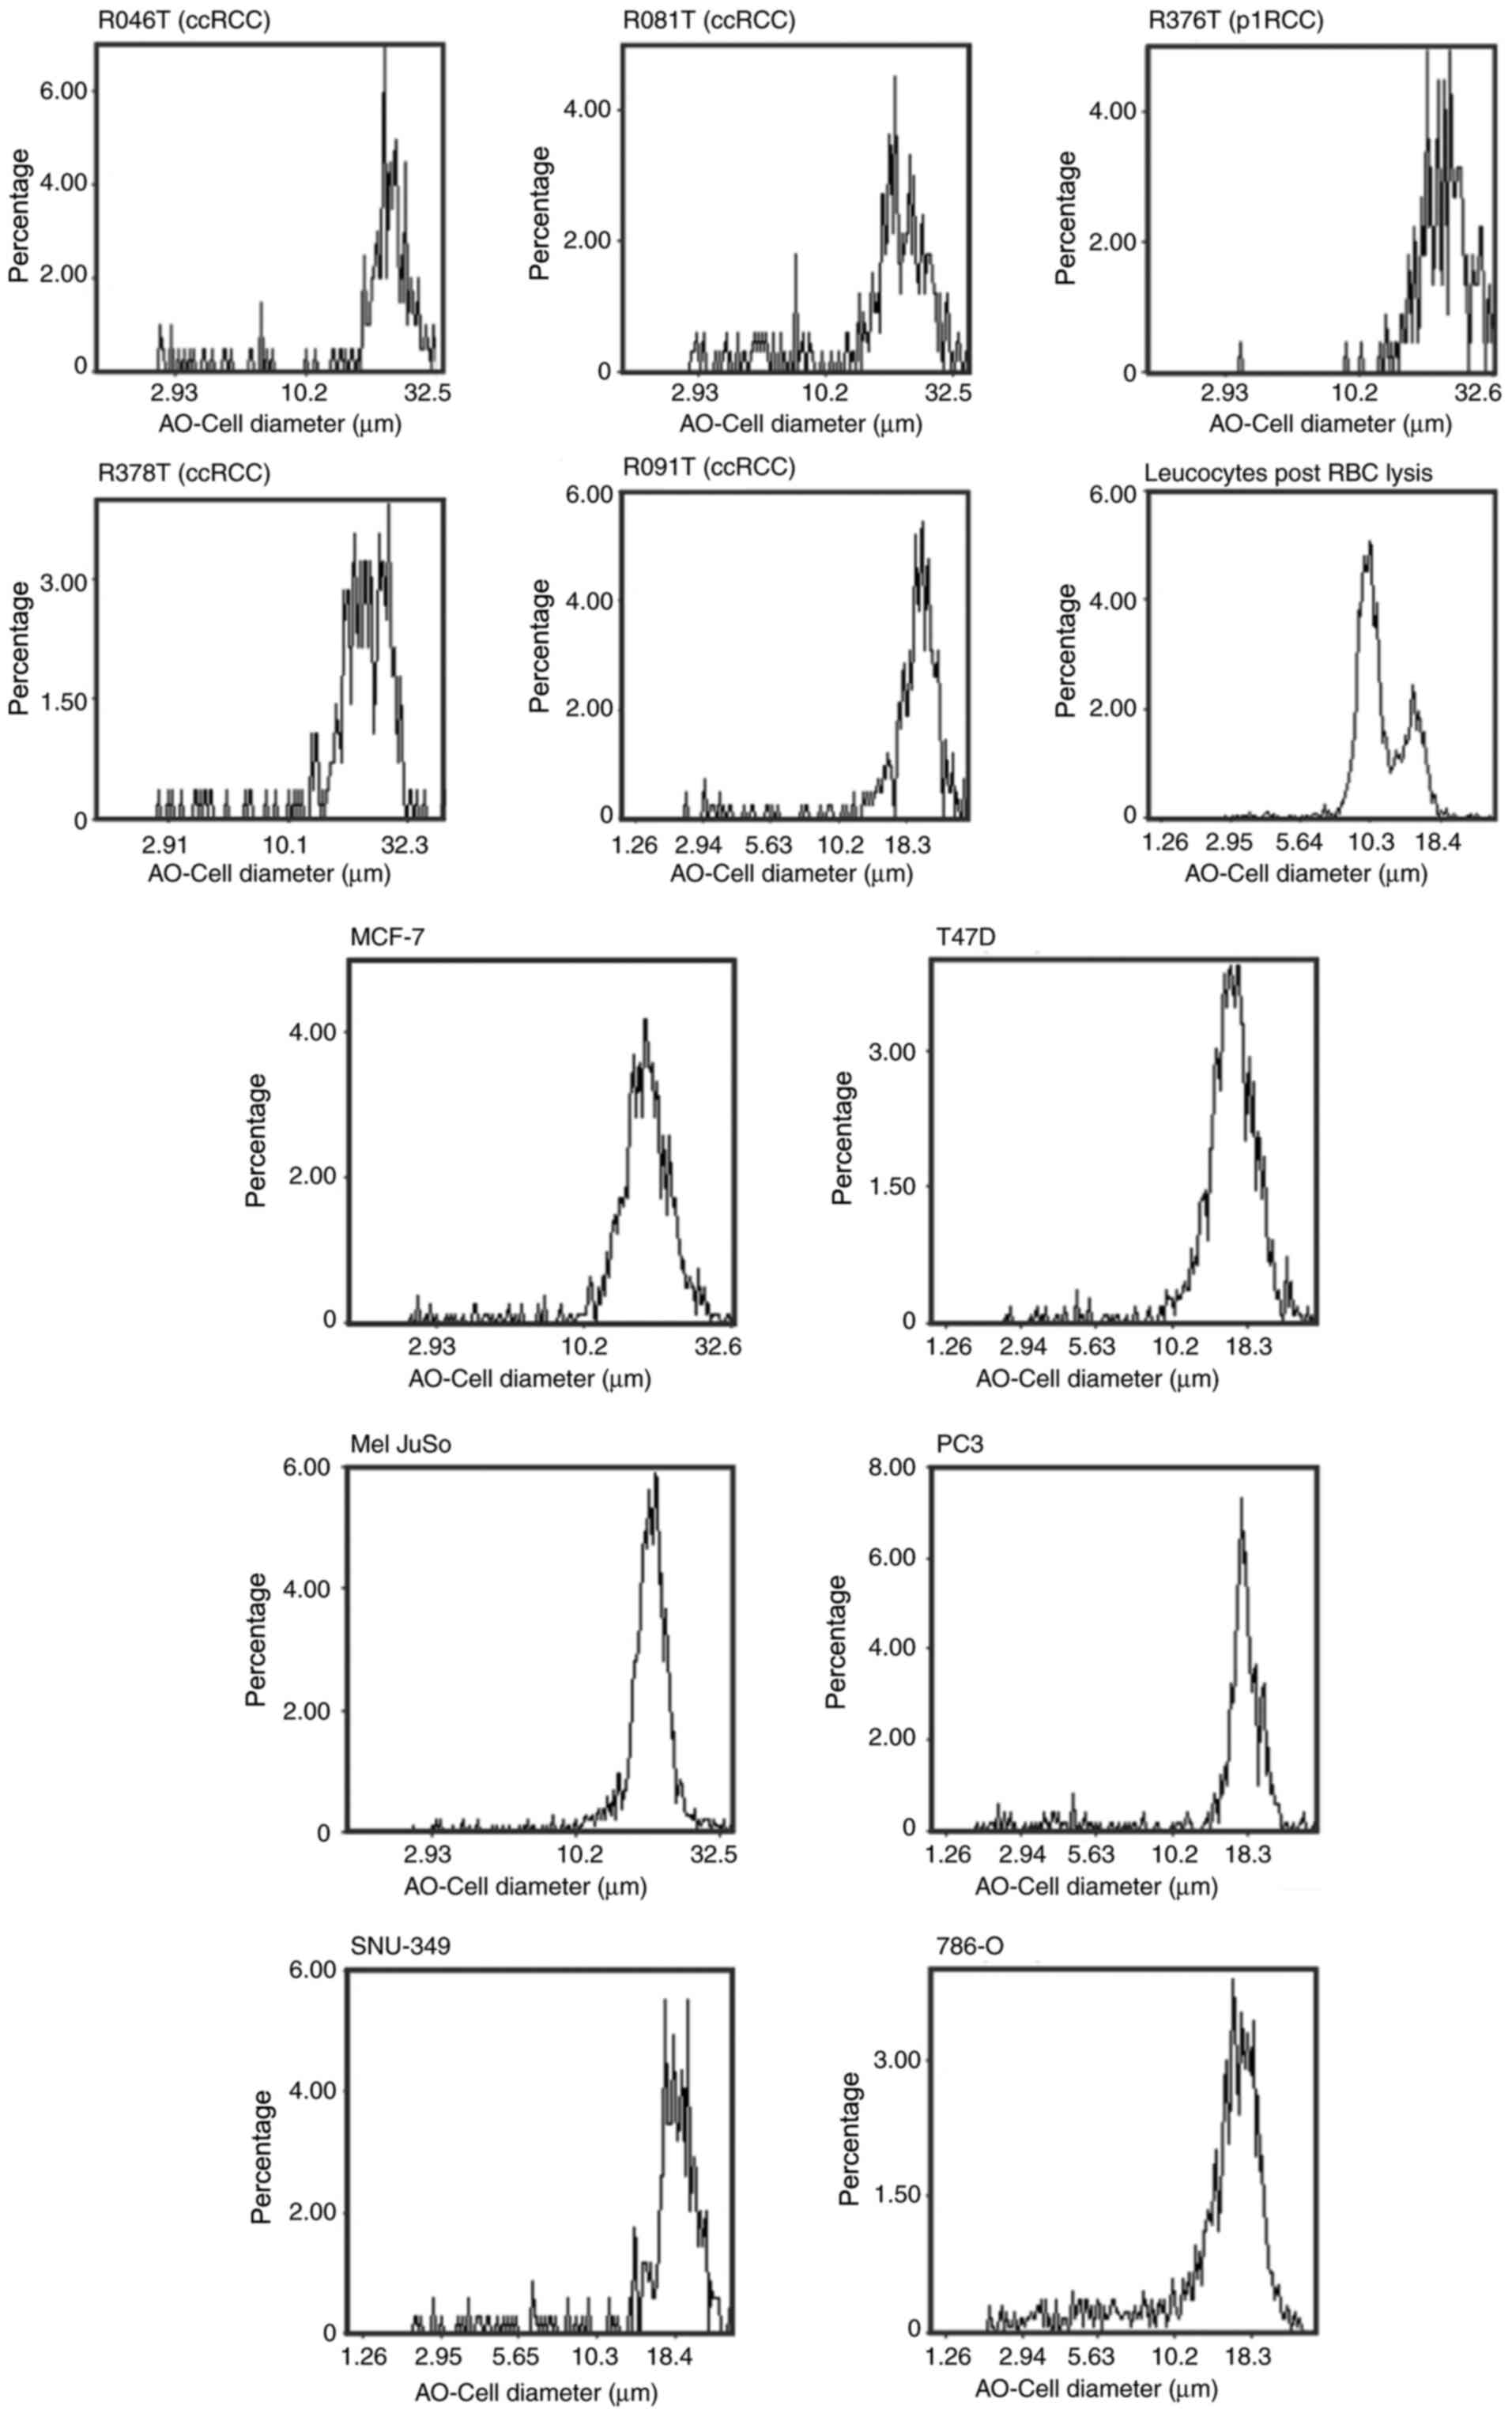
In order to confirm that RCC tumour cells were large
enough to be successfully enriched in a size-dependent system, we
measured the cell diameters of two ccRCC cell lines along with 5
primary cell lines (ccRCC and p1RCC). This data showed that
cultured RCC tumour cells SNU-349 and 786-O are approximately 18 µm
in diameter whilst cultured primary tumour cells are larger and
measure between 20-30 µm (Fig. 1).
These values are greater than the lower ClearCell FX isolation size
threshold of 14 µm suggesting that our choice of enrichment method
is likely suitable for isolation of CTCs from RCC patients. A small
fraction of leucocytes from whole blood are larger than 14 µm,
these are also presumably enriched and isolated together with the
tumour cells. Furthermore, we measured the cell diameter of four
non-RCC tumour cell lines (MCF-7, T47D, Mel JuSo, PC3) to confirm
that tumour cells in general, and RCC cells in particular, are
larger than most leucocytes.
ClearCell FX system performance on RCC
cells
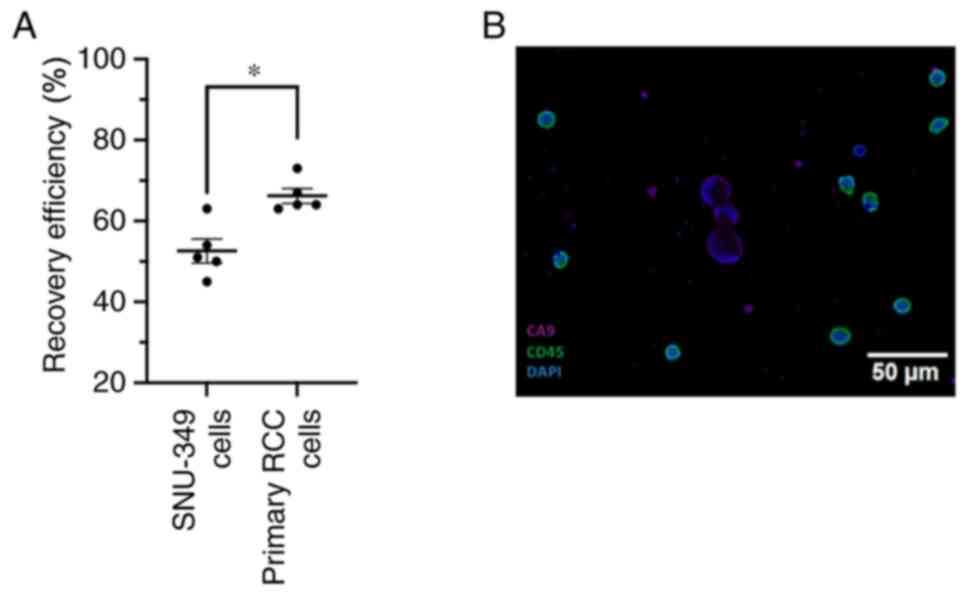
To establish the recovery efficiency of the
ClearCell FX system with RCC cells, we performed cell spike-in
experiments. For these experiments we employed the ccRCC cell line
SNU-349 and primary RCC cell lines. The cells were labelled with a
fluorescent tracker and the number of fluorescent cells were
counted (range of cells spiked-in 10-232) before mixing them with
7.5 ml of healthy donor blood. After lysis of the reticulocytes,
the blood sample was subjected to size-based isolation using the
ClearCell FX system. The output, containing a background of
approximately 10,000 leukocytes and the enriched labelled SNU-349
cells were thereafter analysed using a fluorescent microscope.
These experiments show that on average, the system is able to
recover 50% of SNU-349 cells and 66% of primary RCC cells that are
spiked into whole blood (Fig. 2A).
Spiked-in and recovered cell numbers are reported in Table SII. We also performed
immunofluorescence staining on ClearCell FX enriched samples
originating from whole blood spiked with SNU-349 cells. To
distinguish RCC cells from leucocytes we stained cells for CD45
(leukocytes) and CA9 (a well-established marker for ccRCC cells).
We were able to clearly distinguish CA9 positive, CD45 negative
SNU-349 cells on a background of only CD45 positive leucocytes
(Fig. 2B)
Assessment of RNA quality,
pre-amplification and assay reproducibility
Next, we wanted to establish and validate a method
to detect RCC-specific RNA transcripts from the ClearCell FX
enriched CTC fraction. First, RNA was extracted and subjected to
quality and quantity assessment (Fig.
S1). Once the quality was deemed acceptable (RIN >5), we
performed global pre-amplification of reverse transcribed cDNA to
yield sufficient sample material and to increase the relatively low
transcript copy numbers from the enriched SNU-349 cells present on
a background of leukocytes in the sample. Prior to global
pre-amplification of cDNA from the CTC enriched samples, the
pre-amplification process was monitored with quantitative PCR using
SNU-349 cDNA, in order to determine the optimal number of cycles
required (Fig. S1B). A successful
pre-amplification reaction should yield an increase in fragments in
the 400-10,000 base-pair range, which was observed in our samples
via fragment analysis. (Fig.
S1C).
Digital PCR detection of ccRCC cells
after size-based enrichment
In order to identify ccRCC specific marker genes
suitable for assessing the presence of ccRCC cells in our spiked-in
samples, we analysed data from the publicly available TCGA (The
Cancer Genome Atlas) database and the subsequent sub-type
classification by Chen et al (26), as defined when pooling the three
RCC datasets. Using Limma analyses, we extracted a gene list with
the most differentially expressed genes, when comparing ccRCC to
pRCC and chRCC (Table SI).
CA9 and SLC6A3 were amongst the most differentially
expressed genes in ccRCC and were selected for further exploration
(Fig. 3A). CA9 is a
well-documented hypoxia-driven gene and SLC6A3 displays a
highly ccRCC specific expression pattern, as described by us and
others (23,30). We tested the reproducibility of the
digital PCR assays of these marker genes on pre-amplified cDNA
(Fig. 3B). Increasing the input
cDNA yielded higher copies/µl in a linear fashion. Next, we
assessed the limit of detection of our assays within the context of
enriched tumour cell samples. We performed a titration of tumour
cells (SNU-349) spiked into 7.5 ml of whole blood resulting in
samples with defined numbers of tumour cells after enrichment. We
reliably detected transcripts of CA9 at the one cell level
with more transcripts being detected with higher cell numbers.
Similarly, SLC6A3 transcripts could also be detected from
enriched samples containing ≥1 to 121 cells (Fig. 3C). However, transcripts were less
reliably detected at the one cell level with SLC6A3.
Enriched samples from healthy blood controls (4 samples per marker)
were also tested, consistently giving readouts of less than 1
copy/µl.
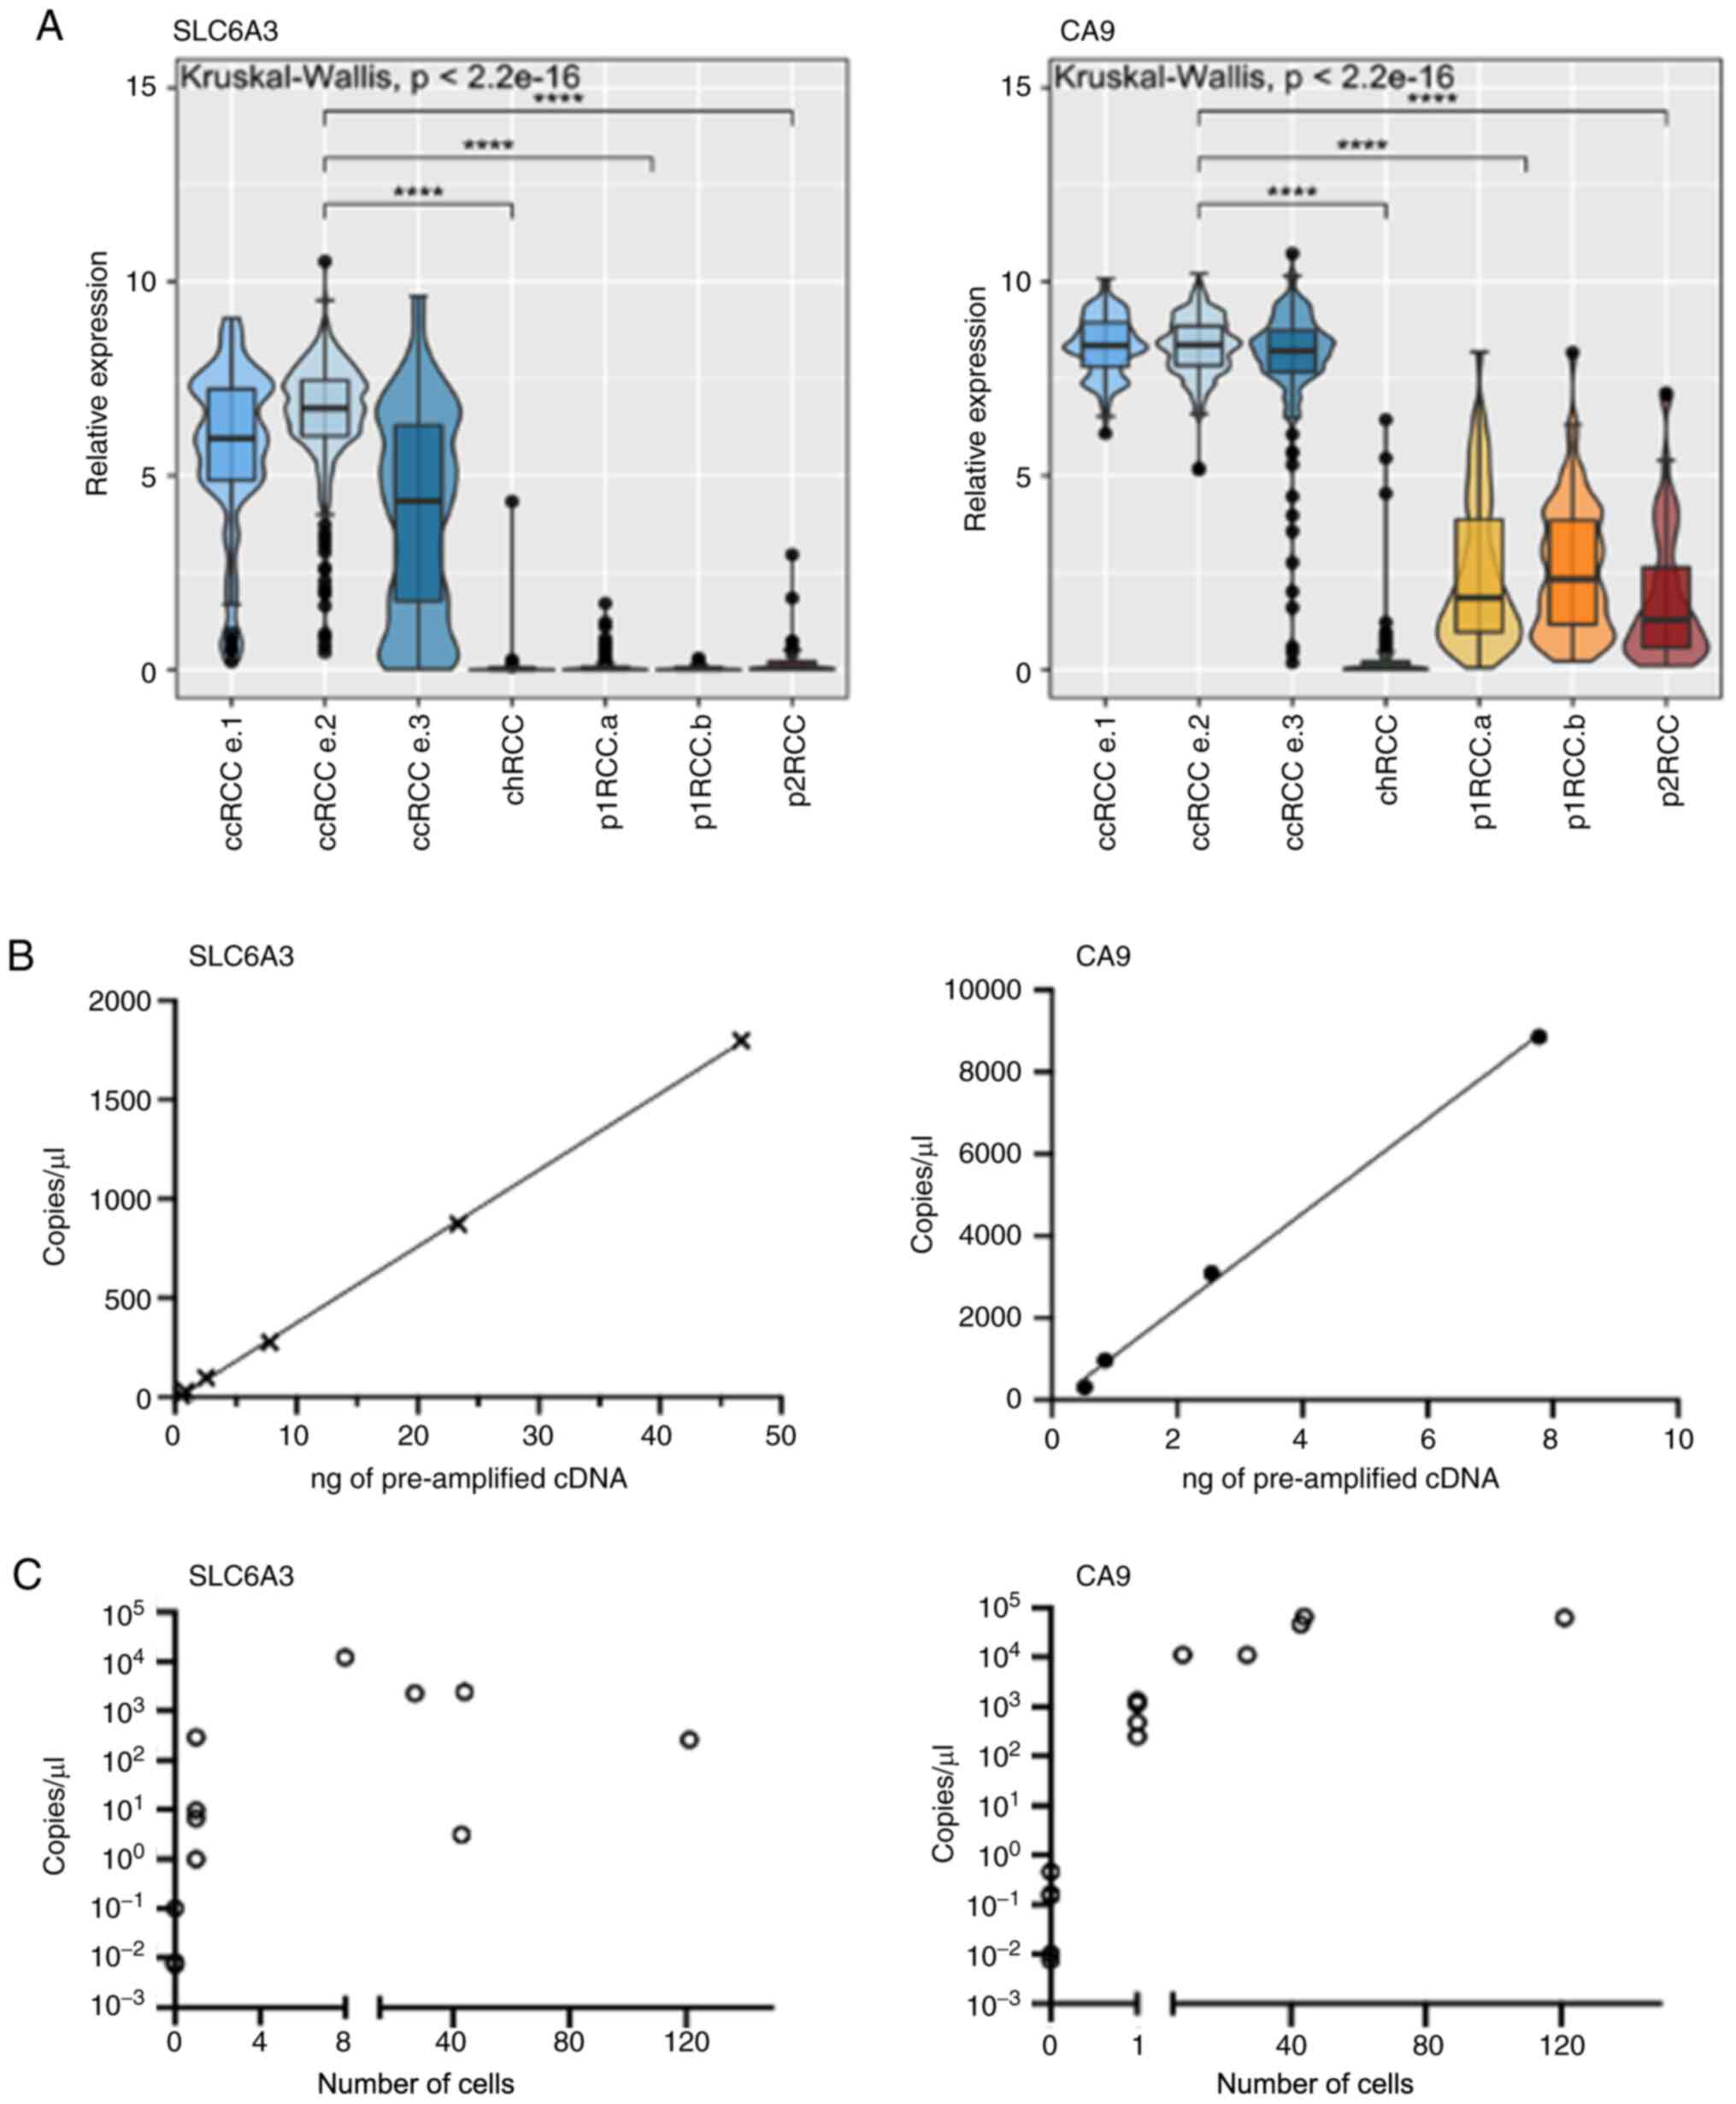 | Figure 3Specificity, reproducibility and
detection of ccRCC cells with SLC6A3 and CA9. (A)
Specificity of SLC6A3 and CA9 expression in RCC
tumours within TCGA database. (n=103 ccRCC.e1, 255 ccRCC e.2, 137
ccRCC e.3, 77 chRCC, 134 p1RCCa, 71 p1RCCb, 52 p2RCC).
****P<0.0001. (B) Digital PCR assay efficiency of
SLC6A3 and CA9 over increasing pre-amplified cDNA
inputs with line of best fit. (C) Digital PCR based copies/µl
measurement of SNU-349 spiked blood samples after ClearCell FX
enrichment and downstream processing. Copies/µl also shown for 4
enriched blood samples without spiked-in SNU-349 cells. ccRCC,
clear cell renal cell carcinoma; chRCC, chromophobe RCC; p1RCC,
papillary type 1 RCC; p2RCC, papillary type 2 RCC; cDNA,
complementary DNA. |
RCC subtype-specific biomarker
panel
With the aim of broadening the applicability of our
method to include pRCC and chRCC, we identified genes that are
differentially and specifically expressed within these subtypes
(Table SI). When selecting
markers for p1RCC and p2RCC, markers were chosen so they indicated
a papillary subtype and not based on a papillary type 1 or 2
subtype. The selection criteria for a marker included minimal or
absent expression in human blood, based on analyses of blood
datasets within the Human Protein Atlas (31,32)
and high RCC subtype specific expression based on Limma analyses of
TCGA expression data, which is based on the Chen et al
(26) classification of RCC
tumours. These selection criteria resulted in a panel of 5 genes in
addition to the ccRCC markers CA9 and SLC6A3
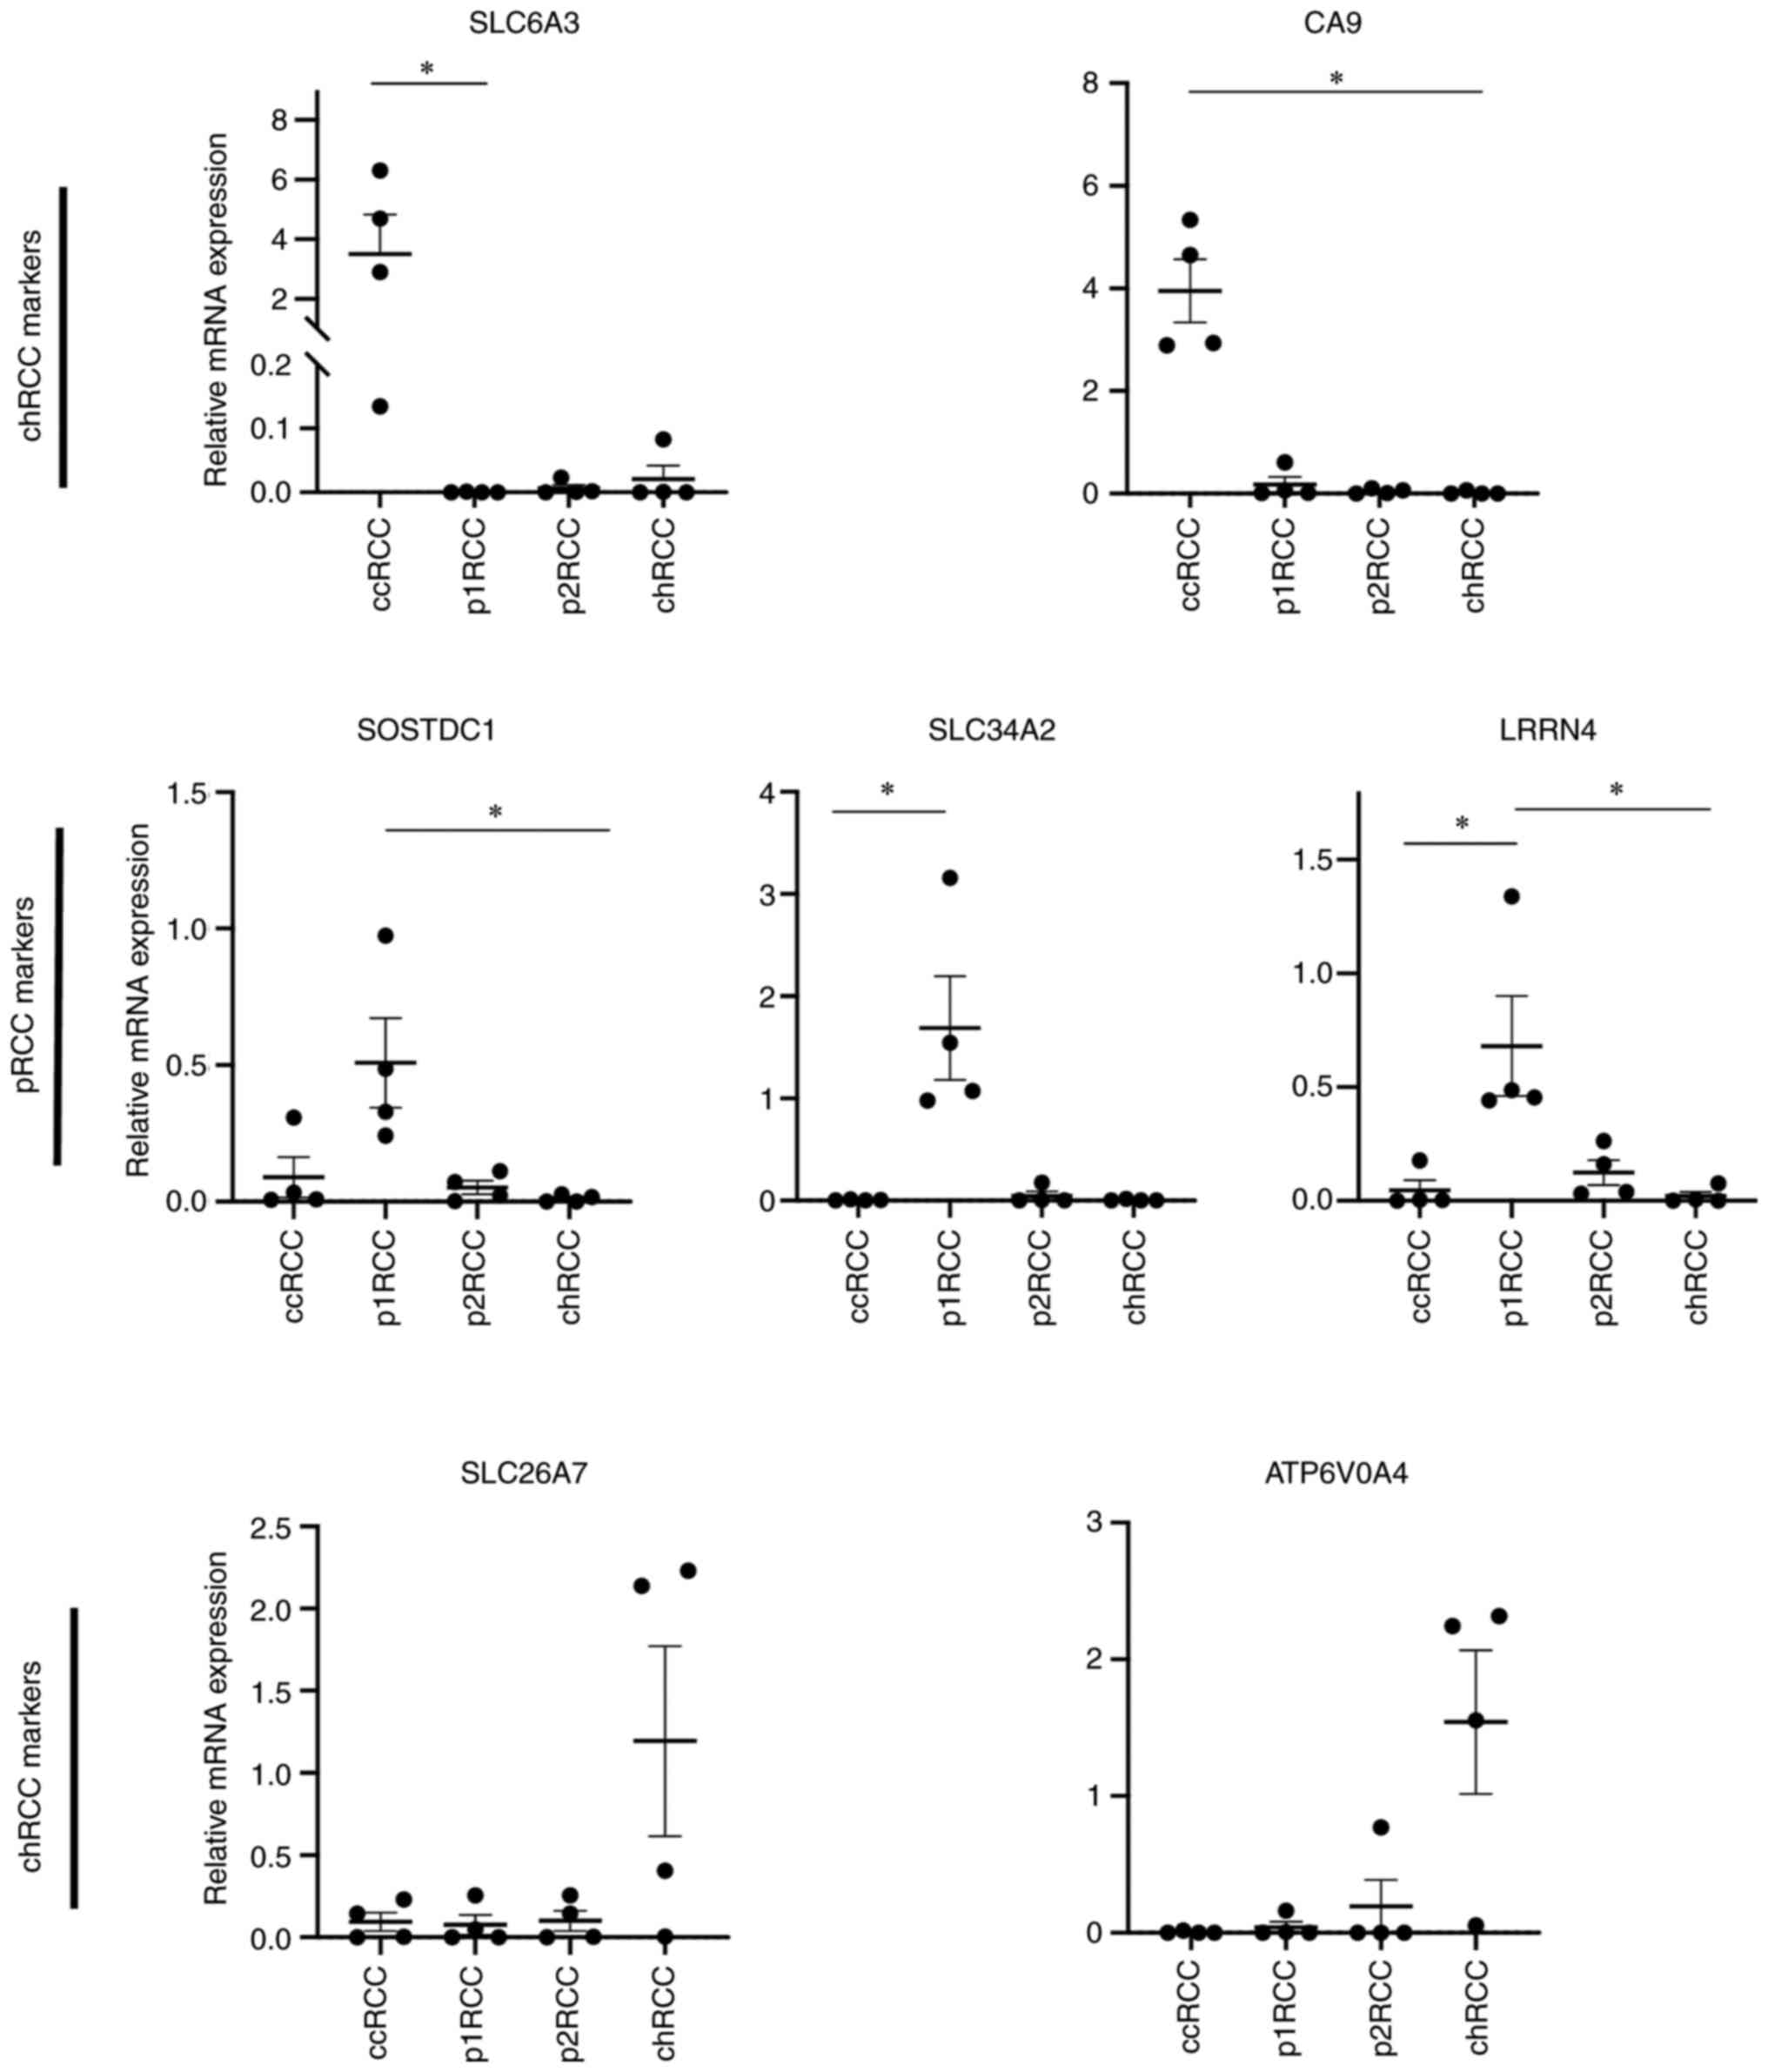
(Fig. 4).
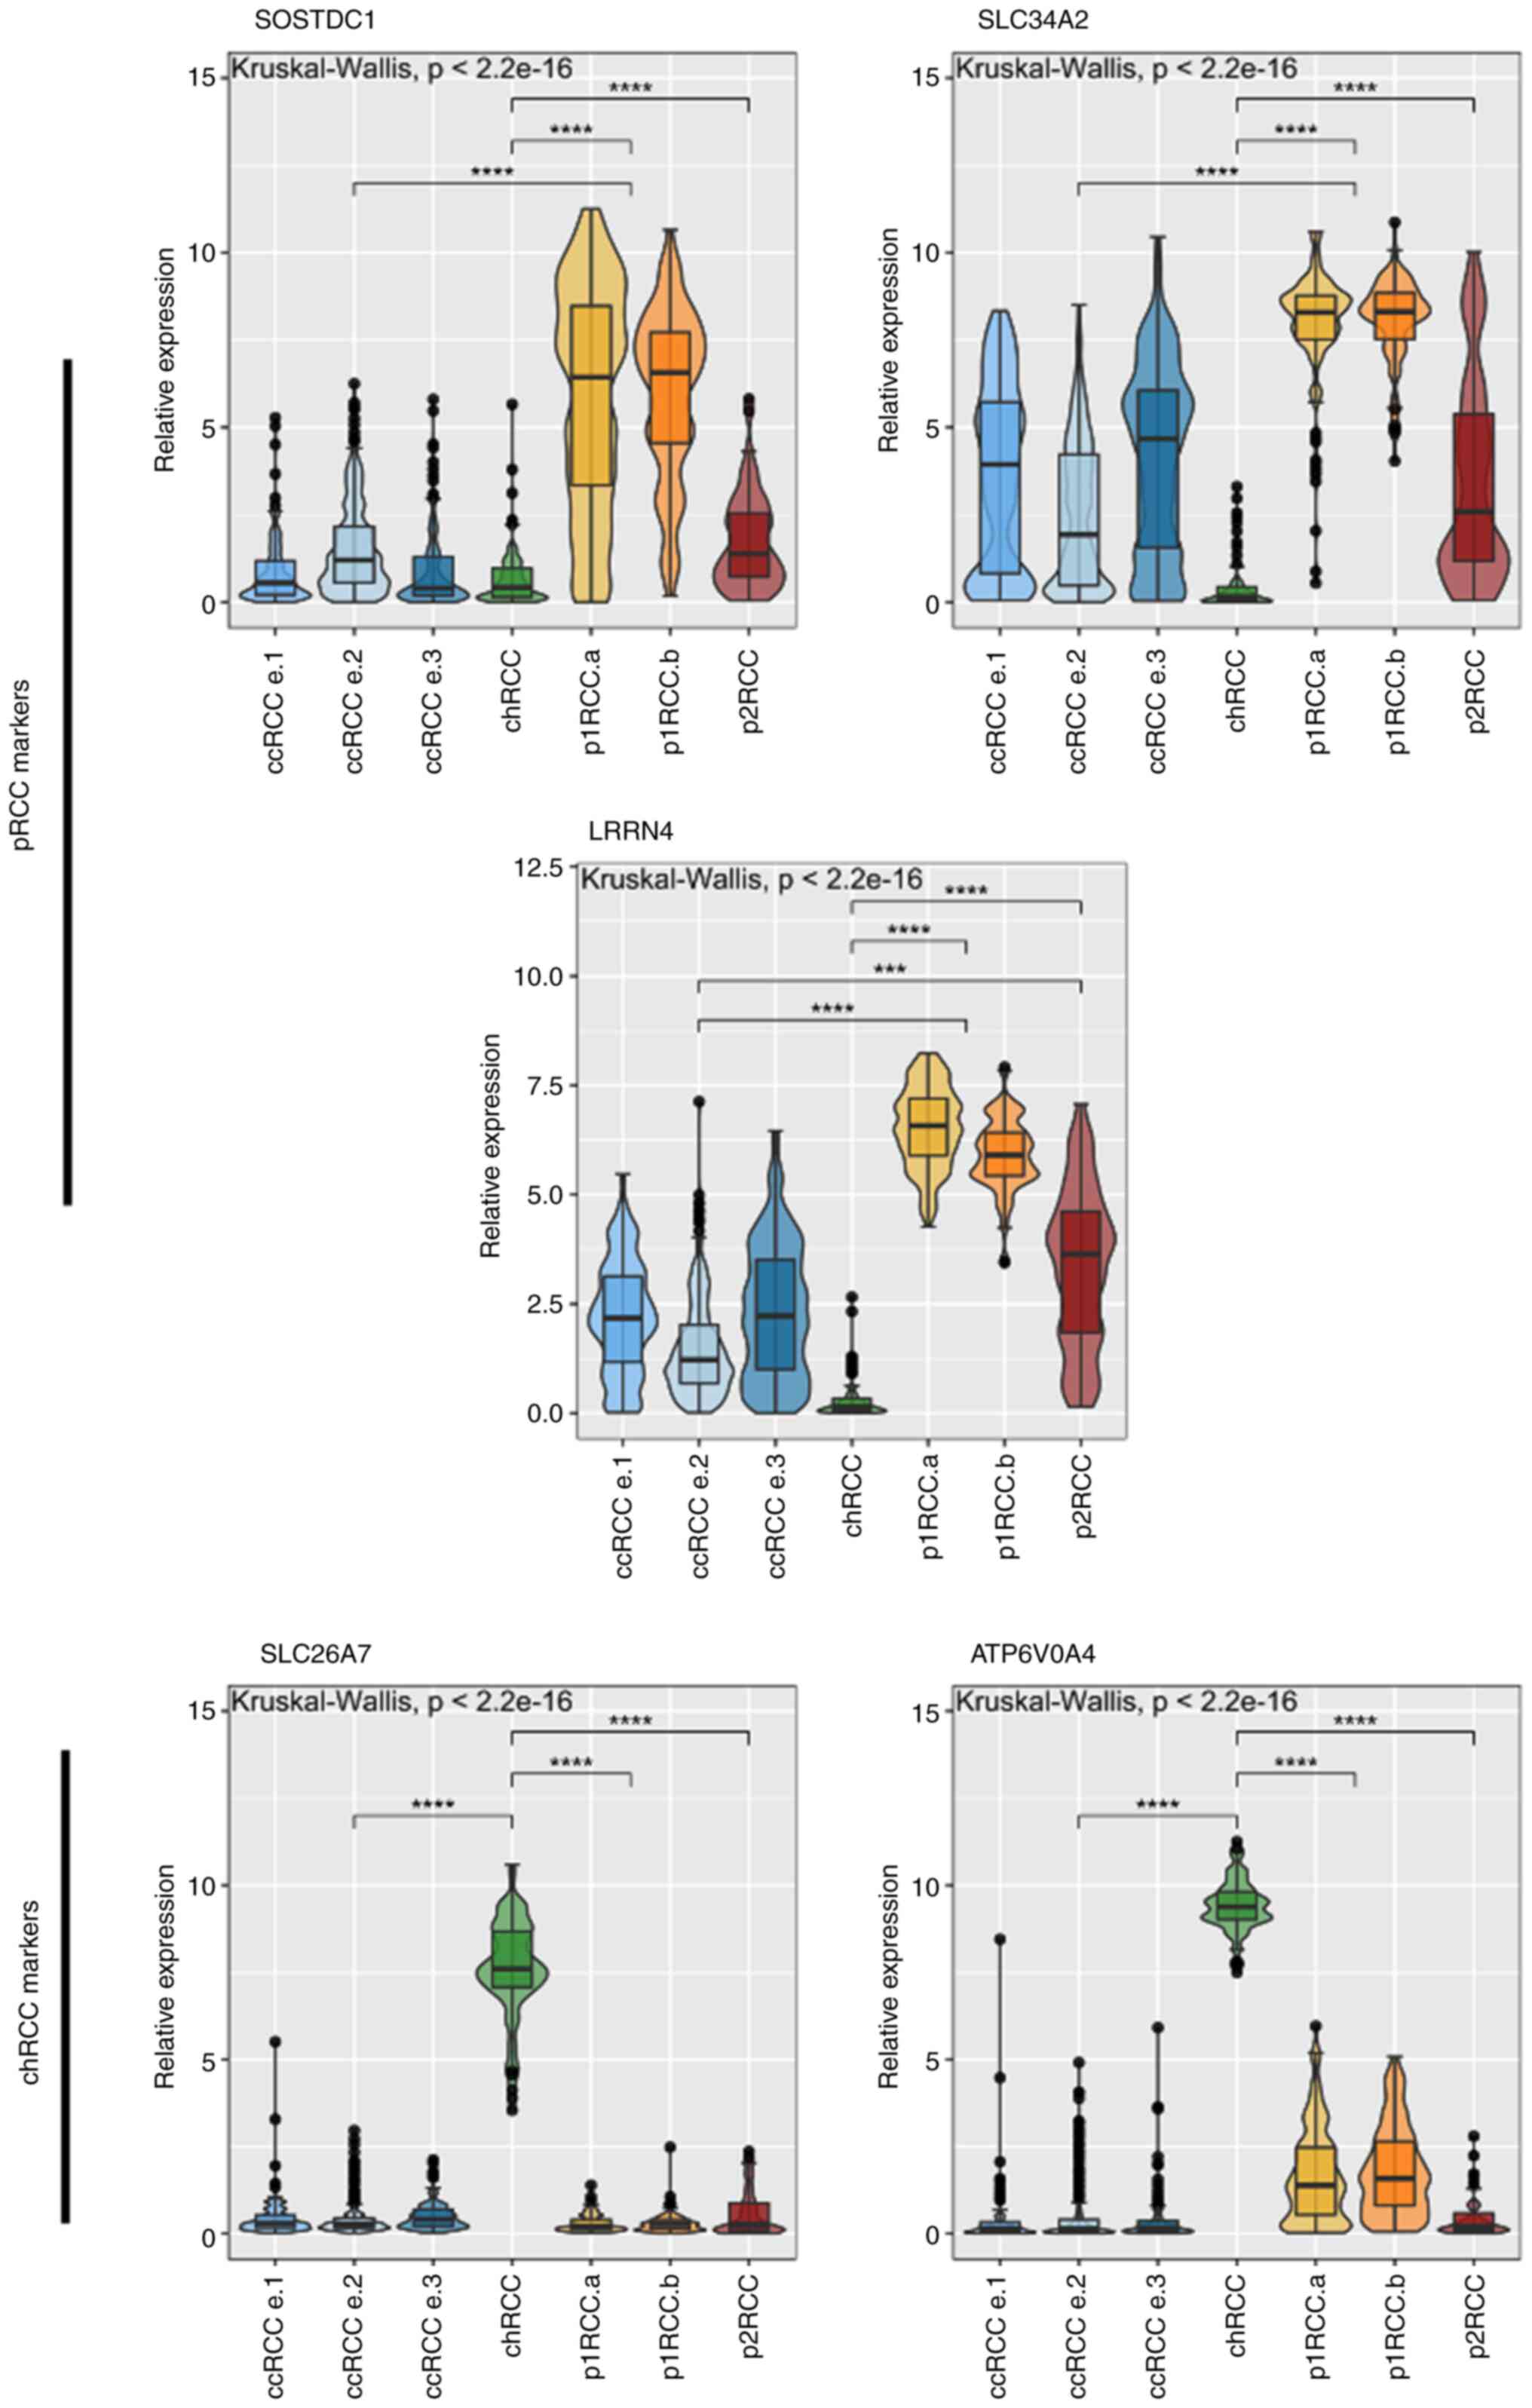 | Figure 4Relative expression of non-ccRCC
markers derived from Limma analysis of TCGA expression data.
Relevant subtypes are shown according to Chen et al
(26) taxonomy. ccRCC cohorts and
p1RCC cohorts grouped for Dunn's comparison test (n=103 ccRCC.e1,
255 ccRCC e.2, 136 ccRCC e.3, 77 chRCC, 134 p1RCCa, 71 p1RCCb, 52
p2RCC). ***P<0.001, ****P<0.0001.
ccRCC, clear cell renal cell carcinoma; chRCC, chromophobe RCC;
p1RCC, papillary type 1 RCC; p2RCC, papillary type 2 RCC. |
To validate the sub-type specific expression of the
selected markers we analysed RNA extracted from primary tumour
samples (Fig. 5). Only RCC
subtypes that were confirmed to be one of the three primary
subtypes were included in this patient cohort (Table II). Our expression data was
in-line with the pattern seen in the TCGA data set. The two markers
for the ccRCC subtype (SLC6A3, CA9) clearly distinguished
this subtype from the rest in the tumour samples tested. Using a
joint set of markers to distinguish the papillary RCC subtype also
allowed for clear separation of this subtype from the other two.
Finally, the markers for the chRCC subtype distinguished these
tumours extremely well, showing elevated RNA expression in a
subtype specific manner. We additionally tested all markers on 6
healthy-volunteer blood samples and found them to be negative for
our RCC specific markers (Fig.
S2).
Discussion
Despite the recent surge in liquid biopsy
development and clinical implementation in other cancer types, RCC
seems to have largely missed this wave. Potential explanations
range from the poor compatibility of RCC cells with EpCAM based
isolation methods to the use of cell-free DNA, where RCC tumours
have shown to be poor shedders of ctDNA (15,16).
Additionally, CTC based liquid biopsy approaches have their
inherent pre-analytical challenges (33). The first of these is the sparsity
of CTCs in the blood of patients, hence the enrichment procedure
requires high recovery efficiency. Secondly, the isolation
procedure is often a trade-off between efficiency and specificity;
high CTC numbers are desirable but are difficult to obtain with
minimal contamination of leucocytes. Finally, sample material is
often limited, and methods are required to generate sufficient
analytical material for multiple downstream analyses, such as in
the case of querying the expression of multiple disease specific
transcripts.
Here we develop a method that overcomes the hurdles
associated with a CTC based liquid biopsy approach in RCC. The use
of the ClearCell FX system successfully isolated spiked-in RCC
tumour cells from whole blood with a recovery rate of 66% for
primary cells, which is higher than previously reported recovery
rates with other isolation systems such as CellSearch®,
RosetteSep® or Parsortix® (16,29,34).
These observations are in line with the characteristics of RCC
tumour cells as our data and others' show that tumour cells
including RCC cells are typically larger than 15 µm, suiting them
for isolation with a size-based approach that enriches cells larger
than 14 µm (17,35).
After enrichment, our data show that we are able to
successfully detect ccRCC tumour cells present in the enriched
sample via dPCR and immunofluorescence. With one of the ccRCC
markers, CA9, we were able to consistently and reliably
detect down to one ccRCC tumour cell via dPCR in the ClearCell FX
enriched sample. The other ccRCC marker SLC6A3 was
marginally less consistent at low cell numbers. This is likely due
to the differences in transcript numbers of these two genes present
in ccRCC cells, where the absolute transcript levels in ccRCCs are
higher for CA9 than for SLC6A3, both in cultured
ccRCC cells and within the ccRCC cohort of the TCGA. We still
reliably detected SLC6A3 transcripts in enriched samples
that contained 8 or more ccRCC cells, demonstrating the relevance
of the described workflow in relation to the reported number of
CTCs isolated from ccRCC patients using a size-based approach, that
may range from 1 to >100 cells per 10 ml whole blood (17,36).
Importantly, the pre-amplification step introduced in our workflow
generates an excessive amount of cDNA for multiple analyses.
Finally, we curated a 7-marker gene panel to
distinguish the three major RCC subtypes. This is facilitated by
the fact that RCC subtypes arise from differing cells of origin and
have further defining features based on their subtype specific
oncogenetic alterations (37). For
example, ccRCC and papillary RCC arise from the proximal segment of
the nephron whereas chRCCs arise from the collecting duct. These
anatomical distances translate into transcriptomic and functional
differences since cells perform distinct functions along segments
of the nephron (12,38). As a consequence, chRCC specific
markers are unchallenging to define and show a pronounced subtype
specific pattern. In stark contrast, ccRCCs and pRCCs arise from
the same proximal segment of the nephron, making them far more
difficult to molecularly define. However, the virtually universal
loss of VHL and the resulting pseudo-hypoxic drive can be leveraged
to distinguish ccRCCs from pRCCs, while pRCC specific markers are
less precise. This is evident in our primary tumour tissue analysis
where overlapping expression of pRCC specific markers with ccRCC
markers is observed. Due to this, identification of further pRCC
specific markers is warranted. The lack of available cell lines as
well as the rarity of these RCC subtypes posed a challenge in
validating these markers within this workflow. Ultimately, these
markers will require enriched CTCs from pRCC or chRCC patient blood
for validation.
Although a few primary ccRCC tumours show raised
expression for non-ccRCC specific markers, we predict it would be
straightforward to assign them as ccRCC due to the relatively high
expression of their respective markers CA9 and
SLC6A3. Vice-versa, the expression of the combination of the
papillary markers can be leveraged against the low expression of
non-papillary markers to designate a papillary subtype. Thus,
overlapping expression of subtype specific markers is unlikely to
affect the overall sub-type designation of a CTC isolate for these
reasons. Regardless, it is warranted and required to explore the
use of these markers on CTCs from RCC patient blood.
There were certain limitations to the present study.
Firstly, size-based CTC isolation platforms can miss smaller CTCs,
as CTC sizes in patients may vary more than observed in this study
with cultured and primary cells. Furthermore, the scarce
availability of CTCs in patient blood can add to the recovery
sufficiency of CTCs.
In conclusion, we established a clear workflow for
the isolation and detection of RCC tumour cells from whole blood
with obvious implications for use with CTCs in RCC patients.
Further work is required to experimentally validate our novel
7-marker gene panel on a larger cohort of patient tumours and to
demonstrate its ability in classifying tumour subtype. This should
be complemented with a larger cohort of healthy controls as well as
RCC patients with other confounding conditions, such as
inflammatory or kidney diseases.
Supplementary Material
Dissociation of human renal
tissue. The cortical tissue farthest from the tumor was
selected and put in ice-cold Dulbecco's modified Eagle's medium
(Invitrogen, Carlsbad, CA) supplemented with 10% fetal calf serum
and 1% penicillin/streptomycin. Samples were rinsed, minced, and
subjected to overnight collagenase treatment at 37˚C in
a processing medium consisting of Ham's F-12/Dulbecco's modified
Eagle's medium [1:1 (v/v); Invitrogen], supplemented with 5% fetal
calf serum, 1% penicillin/streptomycin, collagenase IV at a final
concentration of 300 U/ml (Invitrogen), and deoxyribonuclease I
type II at a final concentration of 200 U/ml (Sigma-Aldrich, St.
Louis, MO). After trituration by slow repeated pipetting through a
10-ml pipette, the resulting tissue suspension was serially passed
through tissue strainers with mesh sizes of 100 and 70 μm,
respectively, thereby excluding glomeruli from the preparation. The
suspension was treated with 1X trypsin-EDTA for 5 minutes and then
was passed through a 20-μm strainer, which resulted in single
cells.
Optimisation of downstream processing
of ClearCell FX output. (A) Representative image of Total Eukaryote
RNA Pico Chip electropherogram and RIN values for RNA extracted
from ClearCell FX output containing 27 and 8 SNU-349 cells amongst
background of leucocytes. (B) qPCR monitoring of pre-amplification
cycles using SYBR green for 500pg and 50pg total RNA input from
SNU-349 cells. Vertical red line represents selected number of
cycles for pre-amplification of future pre-amplification reactions.
(C) cDNA fragment analysis of pre-amplified cDNA compared to
non-pre-amplified cDNA from SNU-349 cells. nt, nucleotides; rRNA,
ribosomal RNA.
Expression of all subtype specific
markers in 6 healthy blood samples enriched for CTCs.
Limma analyses for differentially
expressed transcripts.
Spiked-in and recovered cell
numbers.
Acknowledgements
Not applicable.
Funding
Funding: This research was funded by The European Union (grant
no. EU-H2020-MSCA-COFUND-2016-754299), The Swedish Cancer
Foundation (grant no. CAN2018/1153), Cancera Stiftelesen and Region
Skåne ALF funding (grant no. 2018-176).
Availability of data and materials
For limma analyses, level 3 RNA-seq data of
chromophobe renal cell carcinoma (KICH), clear cell kidney
carcinoma (KIRC), papillary kidney carcinoma (KIRP) were downloaded
from The Cancer Genome Atlas (TCGA) data portal (https://portal.gdc.cancer.gov) as described in
(12). The other datasets used
and/or analysed during the current study are available from the
corresponding author on reasonable request.
Authors' contributions
HA, JH and RDA conceived and designed the study. HA,
JH, DL and RDA developed and designed the methods. DL implemented
computational software for TCGA analysis. RDA verified the
reproducibility of the results. HA, RDA and SS synthesised and
analysed data. RDA, AT and CM performed experiments and collected
data. BS and PE performed surgery, provided clinical advice and
contributed to study design. HN and MJ provided primary patient
tissue and established primary cell lines. HA and RDA wrote and
prepared the original draft; all authors reviewed and edited the
manuscript. HA, DL, SS and RDA prepared figures. HA provided
supervision, project administration and funding acquisition. HA and
RDA confirm the authenticity of all the raw data. All authors have
read and approved the final manuscript.
Ethics approval and consent to
participate
The study was conducted according to the guidelines
of the Declaration of Helsinki, and approved by the Regional
Healthcare provider (Region Skåne) and Lund University ethical
committee (approval nos. LU680-08 and 2018:19). Informed written
consent was obtained from all subjects involved in the study.
Patient consent for publication
Written informed consent was obtained from patients
for publication of results.
Competing interests
The authors declare that they have no competing
interests.
References
|
1
|
Mattox AK, Bettegowda C, Zhou S,
Papadopoulos N, Kinzler KW and Vogelstein B: Applications of liquid
biopsies for cancer. Sci Transl Med. 11(eaay1984)2019.PubMed/NCBI View Article : Google Scholar
|
|
2
|
Mader S and Pantel K: Liquid biopsy:
Current status and future perspectives. Oncol Res Treat.
40:404–408. 2017.PubMed/NCBI View Article : Google Scholar
|
|
3
|
Vanharanta S and Massague J: Origins of
metastatic traits. Cancer Cell. 24:410–421. 2013.PubMed/NCBI View Article : Google Scholar
|
|
4
|
Rossi E and Zamarchi R: Single-cell
analysis of circulating tumor cells: How far have we come in
the-omics era? Front Genet. 10(958)2019.PubMed/NCBI View Article : Google Scholar
|
|
5
|
Ljungberg B, Albiges L, Abu-Ghanem Y,
Bensalah K, Dabestani S, Fernández-Pello S, Giles RH, Hofmann F,
Hora M, Kuczyk MA, et al: European association of urology
guidelines on renal cell carcinoma: The 2019 update. Eur Urol.
75:799–810. 2019.PubMed/NCBI View Article : Google Scholar
|
|
6
|
Hernandez-Yanez M, Heymach JV and Zurita
AJ: Circulating biomarkers in advanced renal cell carcinoma:
Clinical applications. Curr Oncol Rep. 14:221–229. 2012.PubMed/NCBI View Article : Google Scholar
|
|
7
|
Curti BD: Renal cell carcinoma. JAMA.
292:97–100. 2004.PubMed/NCBI View Article : Google Scholar
|
|
8
|
Belldegrun AS, Klatte T, Shuch B,
LaRochelle JC, Miller DC, Said JW, Riggs SB, Zomorodian N,
Kabbinavar FF, Dekernion JB and Pantuck AJ: Cancer-specific
survival outcomes among patients treated during the cytokine era of
kidney cancer (1989-2005): A benchmark for emerging targeted cancer
therapies. Cancer. 113:2457–2463. 2008.PubMed/NCBI View Article : Google Scholar
|
|
9
|
Dabestani S, Thorstenson A, Lindblad P,
Harmenberg U, Ljungberg B and Lundstam S: Renal cell carcinoma
recurrences and metastases in primary non-metastatic patients: A
population-based study. World J Urol. 34:1081–1086. 2016.PubMed/NCBI View Article : Google Scholar
|
|
10
|
Klatte T, Rossi SH and Stewart GD:
Prognostic factors and prognostic models for renal cell carcinoma:
A literature review. World J Urol. 36:1943–1952. 2018.PubMed/NCBI View Article : Google Scholar
|
|
11
|
Finley DS, Pantuck AJ and Belldegrun AS:
Tumor biology and prognostic factors in renal cell carcinoma.
Oncologist. 16 (Suppl 2):S4–S13. 2011.PubMed/NCBI View Article : Google Scholar
|
|
12
|
Lindgren D, Eriksson P, Krawczyk K,
Nilsson H, Hansson J, Veerla S, Sjölund J, Höglund M, Johansson ME
and Axelson H: Cell-type-specific gene programs of the normal human
nephron define kidney cancer subtypes. Cell Rep. 20:1476–1489.
2017.PubMed/NCBI View Article : Google Scholar
|
|
13
|
Cohen HT and McGovern FJ: Renal-cell
carcinoma. N Engl J Med. 353:2477–2490. 2005.PubMed/NCBI View Article : Google Scholar
|
|
14
|
Rathmell WK and Chen S: VHL inactivation
in renal cell carcinoma: Implications for diagnosis, prognosis and
treatment. Expert Rev Anticancer Ther. 8:63–73. 2008.PubMed/NCBI View Article : Google Scholar
|
|
15
|
Bettegowda C, Sausen M, Leary RJ, Kinde I,
Wang Y, Agrawal N, Bartlett BR, Wang H, Luber B, Alani RM, et al:
Detection of circulating tumor DNA in early- and late-stage human
malignancies. Sci Transl Med. 6(224ra24)2014.PubMed/NCBI View Article : Google Scholar
|
|
16
|
Maertens Y, Humberg V, Erlmeier F,
Steffens S, Steinestel J, Bögemann M, Schrader AJ and Bernemann C:
Comparison of isolation platforms for detection of circulating
renal cell carcinoma cells. Oncotarget. 8:87710–87717.
2017.PubMed/NCBI View Article : Google Scholar
|
|
17
|
Klezl P, Pospisilova E, Kolostova K,
Sonsky J, Maly O, Grill R, Pawlak I and Bobek V: Detection of
circulating tumor cells in renal cell carcinoma: Disease Stage
Correlation and Molecular Characterization. J Clin Med.
9(1372)2020.PubMed/NCBI View Article : Google Scholar
|
|
18
|
Liu S, Tian Z, Zhang L, Hou S, Hu S, Wu J,
Jing Y, Sun H, Yu F, Zhao L, et al: Combined cell surface carbonic
anhydrase 9 and CD147 antigens enable high-efficiency capture of
circulating tumor cells in clear cell renal cell carcinoma
patients. Oncotarget. 7:59877–59891. 2016.PubMed/NCBI View Article : Google Scholar
|
|
19
|
Chudasama D, Katopodis P, Stone N, Haskell
J, Sheridan H, Gardner B, Urnovitz H, Schuetz E, Beck J, Hall M, et
al: Liquid biopsies in lung cancer: Four emerging technologies and
potential clinical applications. Cancers (Basel).
11(331)2019.PubMed/NCBI View Article : Google Scholar
|
|
20
|
Rizzo MI, Ralli M, Nicolazzo C, Gradilone
A, Carletti R, Di Gioia C, De Vincentiis M and Greco A: Detection
of circulating tumor cells in patients with laryngeal cancer using
ScreenCell: Comparative pre- and post-operative analysis and
association with prognosis. Oncol Lett. 19:4183–4188.
2020.PubMed/NCBI View Article : Google Scholar
|
|
21
|
Lee Y, Guan G and Bhagat AA: ClearCell(R)
FX, a label-free microfluidics technology for enrichment of viable
circulating tumor cells. Cytometry A. 93:1251–1254. 2018.PubMed/NCBI View Article : Google Scholar
|
|
22
|
Xu L, Mao X, Imrali A, Syed F, Mutsvangwa
K, Berney D, Cathcart P, Hines J, Shamash J and Lu YJ: Optimization
and evaluation of a novel size based circulating tumor cell
isolation system. PLoS One. 10(e0138032)2015.PubMed/NCBI View Article : Google Scholar
|
|
23
|
Hansson J, Lindgren D, Nilsson H,
Johansson E, Johansson M, Gustavsson L and Axelson H:
Overexpression of functional SLC6A3 in clear cell renal cell
carcinoma. Clin Cancer Res. 23:2105–2115. 2017.PubMed/NCBI View Article : Google Scholar
|
|
24
|
Ritchie ME, Phipson B, Wu D, Hu Y, Law CW,
Shi W and Smyth GK: Limma powers differential expression analyses
for RNA-sequencing and microarray studies. Nucleic Acids Res.
43(e47)2015.PubMed/NCBI View Article : Google Scholar
|
|
25
|
Nacer DF, Liljedahl H, Karlsson A,
Lindgren D and Staaf J: Pan-cancer application of a
lung-adenocarcinoma-derived gene-expression-based prognostic
predictor. Brief Bioinform. 22(bbab154)2021.PubMed/NCBI View Article : Google Scholar
|
|
26
|
Chen F, Zhang Y, Senbabaoglu Y, Ciriello
G, Yang L, Reznik E, Shuch B, Micevic G, De Velasco G, Shinbrot E,
et al: Multilevel Genomics-Based taxonomy of renal cell carcinoma.
Cell Rep. 14:2476–2489. 2016.PubMed/NCBI View Article : Google Scholar
|
|
27
|
Livak KJ and Schmittgen TD: Analysis of
relative gene expression data using real-time quantitative PCR and
the 2(-Delta Delta C(T)) Method. Methods. 25:402–408.
2001.PubMed/NCBI View Article : Google Scholar
|
|
28
|
Kroneis T, Jonasson E, Andersson D,
Dolatabadi S and Stahlberg A: Global preamplification simplifies
targeted mRNA quantification. Sci Rep. 7(45219)2017.PubMed/NCBI View Article : Google Scholar
|
|
29
|
Cappelletti V, Verzoni E, Ratta R, Vismara
M, Silvestri M, Montone R, Miodini P, Reduzzi C, Claps M, Sepe P,
et al: Analysis of single circulating tumor cells in renal cell
carcinoma reveals phenotypic heterogeneity and genomic alterations
related to progression. Int J Mol Sci. 21(1475)2020.PubMed/NCBI View Article : Google Scholar
|
|
30
|
Pastorekova S and Gillies RJ: The role of
carbonic anhydrase IX in cancer development: Links to hypoxia,
acidosis, and beyond. Cancer Metastasis Rev. 38:65–77.
2019.PubMed/NCBI View Article : Google Scholar
|
|
31
|
Thul PJ, Akesson L, Wiking M, Mahdessian
D, Geladaki A, Ait Blal H, Alm T, Asplund A, Björk L, Breckels LM,
et al: A subcellular map of the human proteome. Science.
356(eaal3321)2017.PubMed/NCBI View Article : Google Scholar
|
|
32
|
Chen J, Cheung F, Shi R, Zhou H and Lu W:
CHI Consortium. PBMC fixation and processing for Chromium
single-cell RNA sequencing. J Transl Med. 16(198)2018.PubMed/NCBI View Article : Google Scholar
|
|
33
|
Neumann MHD, Bender S, Krahn T and
Schlange T: ctDNA and CTCs in Liquid Biopsy-current status and
where we need to progress. Comput Struct Biotechnol J. 16:190–195.
2018.PubMed/NCBI View Article : Google Scholar
|
|
34
|
Gradilone A, Iacovelli R, Cortesi E,
Raimondi C, Gianni W, Nicolazzo C, Petracca A, Palazzo A, Longo F,
Frati L and Gazzaniga P: Circulating tumor cells and ‘suspicious
objects’ evaluated through CellSearch® in metastatic renal cell
carcinoma. Anticancer Res. 31:4219–4221. 2011.PubMed/NCBI
|
|
35
|
Vona G, Sabile A, Louha M, Sitruk V,
Romana S, Schütze K, Capron F, Franco D, Pazzagli M, Vekemans M, et
al: Isolation by size of epithelial tumor cells: A new method for
the immunomorphological and molecular characterization of
circulatingtumor cells. Am J Pathol. 156:57–63. 2000.PubMed/NCBI View Article : Google Scholar
|
|
36
|
El-Heliebi A, Kroneis T, Zohrer E,
Haybaeck J, Fischereder K, Kampel-Kettner K, Zigeuner R, Pock H,
Riedl R, Stauber R, et al: Are morphological criteria sufficient
for the identification of circulating tumor cells in renal cancer?
J Transl Med. 11(214)2013.PubMed/NCBI View Article : Google Scholar
|
|
37
|
Lindgren D, Sjolund J and Axelson H:
Tracing renal cell carcinomas back to the nephron. Trends Cancer.
4:472–484. 2018.PubMed/NCBI View Article : Google Scholar
|
|
38
|
Knepper M and Burg M: Organization of
nephron function. Am J Physiol. 244:F579–F589. 1983.PubMed/NCBI View Article : Google Scholar
|
|
39
|
Moch H, Cubilla AL, Humphrey PA, Reuter VE
and Ulbright TM: The 2016 WHO classification of tumours of the
urinary system and male genital Organs-Part A: Renal, Penile, and
Testicular Tumours. Eur Urol. 70:93–105. 2016.PubMed/NCBI View Article : Google Scholar
|