Introduction
Hepatocellular carcinoma (HCC) is the most prevalent
subtype of liver cancer and mostly develops from hepatocytes. From
2006 to 2009, the age-standardized mortality rate of HCC in the
United States showed an annual percentage change of 4.1%, followed
by a slower yet sustained increase of 1.8% from 2009 to 2022,
demonstrating a consistent upward trend in annual mortality, which
is projected to continue rising through 2040. Furthermore,
alcohol-related liver disease (ALD) is anticipated to become the
leading cause of HCC mortality by 2026(1). A recent 2024 study from India
indicates that the incidence, prevalence and mortality rates of HCC
are higher in males. Specifically, the lowest crude incidence rate
and age-standardized incidence rate are 1.6 and 1.9 for males,
whereas they were 1.1 and 1.3 for females, respectively. However,
the annual rate of change is more significant in females, with a
rate of 0.72 (95% CI, 0.23-1.31), compared with 0.50 (95% CI,
0.11-0.99) in males. The incidence of HCC associated with hepatitis
B virus (HBV) is also decreasing, whilst the incidence of HCC
linked to alcohol consumption and metabolic dysfunction-associated
steatotic liver disease is increasing. A comparative analysis of
risk factors contributing to disability-adjusted life years and
HCC-related mortality indicates that alcohol consumption is the
most significant factor, followed by drug abuse and smoking,
highlighting the growing impact of these lifestyle-related factors
on HCC trends (2). HCC malignancy
is marked by its high mortality rates. An analysis of data from the
World Health Organization (WHO) mortality database, covering 112
countries across five continents, revealed a significant increase
in global liver disease-related mortality rates. The
age-standardized mortality rate rose from 103.4 per 1,000,000
individuals (95% CI, 88.16–118.74) in 1990 to 173.0 per 1,000,000
individuals (95% CI, 155.15–190.95) in 2021. Projections suggest
that, despite population aging and growth being key driving
factors, liver disease-related mortality rates are expected to
decline by 2050(3). The
pathogenesis of HCC is multifactorial, with prominent reported
contributors including chronic hepatitis B or C virus infections, a
spectrum of liver diseases, including alcoholic liver disease,
non-alcoholic fatty liver disease and cirrhosis, exposure to
aflatoxins and specific genetic predispositions (4-6).
Current therapeutic options encompass surgical resections, liver
transplantation, ablation techniques, chemoembolization and
targeted systemic therapies (such as Sorafenib and Lenvatinib)
(7-9).
However, a retrospective study conducted in Spain in 2024 reported
that 58% patients with HCC experienced recurrence after liver
resection, with 35% of these recurrences classified as aggressive
recurrences (10). Due to the
aggressive nature of HCC and its tendency for recurrence, the
overall prognosis for patients remains poor. Additionally, a
previous study analyzing HCC data over the past 10 years found that
the 1-year overall survival rate of fibrolamellar HCC was higher
compared with conventional HCC, but no significant differences were
observed at 3 and 5 years (11).
Therefore, understanding the molecular and genetic underpinnings of
HCC remains of high importance to identify potential biomarkers and
therapeutic targets. Traditional biomarkers and pathways have been
extensively studied. α-fetoprotein is a commonly used biomarker for
liver cancer diagnosis, whereas key signaling pathways, such as
Wnt/β-catenin and PI3K/AKT, are involved in the proliferation,
survival and metastasis of liver cancer cells (12,13).
Therefore, to improve the clinical outcomes for patients with HCC,
it is imperative to discover novel diagnostic markers, creative
treatment approaches and enhanced prognostic tools.
Crystallin αB (CRYAB) is a small heat shock protein
that primarily functions as a molecular chaperone to protect cells
from stress-induced damage (14,15).
Such function has garnered attention in the cancer research field
to explore its roles in tumorigenesis. Huang et al (16) previously revealed that CRYAB has a
role in facilitating macrophage M2 polarization through the
AKT1/mTOR signaling pathway to mediate an anti-inflammatory role in
liver ischemia-reperfusion injury. In a previous review, Zhang
et al (17) reported that
CRYAB can inhibit apoptosis by interacting with pro-apoptotic
proteins and regulating various signaling pathways, including
PI3K/AKT, Raf/MEK/ERK and ERK1/2/FOS-related antigen-1/Slug
signaling pathways. CRYAB also induces epithelial-mesenchymal
transition (EMT) through the ERK1/2/Fra-1/Slug signaling pathway,
promoting HCC progression and associating with poor prognosis
(17).
Nuclear factor IA (NFIA) is a transcription factor
that has been reported to be involved in a diverse range of
cellular processes, including development, differentiation and
response to environmental signals, such as extracellular matrix
changes and specific signaling molecules within the tumor
microenvironment (18). Its
aberrant expression and function have been associated with various
types of cancers (19). In
particular, the role of NFIA in glioblastoma is multifaceted, since
it can not only directly promote the proliferation and survival of
tumor cells, but it also suppress their apoptosis by interacting
with NF κB p65 to form a positive feedback loop (20). In esophageal squamous cell
carcinoma (ESCC), NFIA may promote tumor progression downstream of
microRNA (miR)-29a regulation. In this axis, NFIA downregulation
reduces the activity of the Notch signaling pathway, particularly
by lowering the expression of hairy and enhancer of split-1, which
in turn enhances the proliferation and migration of ESCC cells
(21). In uroepithelial bladder
cancers, NFIA expression has been found to be decreased with
increasing tumor stage and grade, especially in muscle-invasive
cancers, which may indicate its inhibitory role in tumor
aggressiveness (22).
However, to the best of our knowledge, the specific
association of NFIA and CRYAB with HCC has not been comprehensively
explored in the literature. Investigating these proteins may reveal
novel molecular pathways. In addition, understanding the expression
patterns and function of NFIA and CRYAB may lead to the discovery
of novel biomarkers for early detection and prognostic prediction,
in addition to novel therapeutic targets. Researching these
molecules may provide deeper mechanistic insights into the
molecular biology of HCC, aiding in the improvement of diagnosis,
prognosis and treatment.
As HCC is a major health concern, there is
escalating interest in unveiling its intricate molecular
underpinnings. Therefore, in the present study, the roles and
regulatory mechanisms of NFIA and CRYAB in HCC were assessed by
investigating their gene expression profile, prognostic
implications and intracellular functionality. This type of
exploration aimed to enhance the understanding of its potential
impact on HCC progression and treatment pathways.
Materials and methods
Data sources and differential
expression analysis
The analysis in the present study was conducted
using the following two main datasets: Gene Expression Omnibus
(GEO; https://ww.ncbinlm.nih.gov/geo/)
database for GSE113996 (23,24)
dataset and The Cancer Genome Atlas (TCGA; https://tcga-data.nci.nih.gov/tcga) dataset for liver
hepatocellular carcinoma (LIHC) (25). They offer extensive, well-annotated
datasets that facilitate the robust bioinformatics analysis of
HCC.
TCGA dataset consisted of 371 LIHC samples and 50
control samples, whilst the GSE113996 dataset included 20 cancer
samples (liver cancer tissues) and 20 control samples (adjacent
non-tumor tissues). Gene expression profiles were normalized and
analyzed for differentially expressed gene (DEG) expression in
TCGA-LIHC and GSE113996 datasets using the ‘limma’ package
(26) in R software (version
3.4.1; https://www.r-project.org). To identify
the differentially expressed genes (DEGs), Log2
transformation was applied to fold change (FC) values, whereas
log10 transformation to P values was used for
visualization purposes in the volcano plot. The criteria used were
FC <0.77 considered to be downregulated DEGs whereas FC >1.3
was considered to be upregulated. Significance was determined using
P<0.05.
Enrichment analysis of overlapping
genes
To identify the overlapping genes among DEGs in TCGA
and GSE113996 datasets, the ‘VennDiagram’ package (27) from the R software was used. This
package can effectively identify overlapping DEGs across multiple
datasets, thereby providing a clear visual representation of these
overlaps. Subsequently, for the analysis of these overlapping
genes, Biological Process (BP) and Kyoto Encyclopedia of Genes and
Genomes (KEGG) pathway enrichment analyses were conducted using the
‘clusterProfiler’ R package (version 3.14.0; Bioconductor:
https://bioconductor.org/packages/release/bioc/html/clusterProfiler.html)
(28). Adjusted P<0.05 was
established as the significance criterion for enriched terms.
Protein-protein interaction (PPI) and
survival analysis of overlapping genes
To investigate the functional relationships among
the overlapping genes, a PPI analysis was conducted using the
Search Tool for the Retrieval of Interacting Genes (STRING; version
11.0; https://string-db.org/) database,
leveraging its comprehensive repository of known and predicted
protein interactions to elucidate the functional associations among
these genes. The resulting PPI network was then visualized using
the Cytoscape software (version 3.9.0; http://www.cytoscape.org) (29,30).
Subsequently, Kaplan-Meier (KM) survival analysis was conducted on
the overlapping genes to analyze the impact of high or reduced
expression of genes on the overall survival (OS) probability of
patients with LIHC. For each gene, high and low expression levels
were defined based on the median expression value within the
dataset, with samples above the median classified as ‘high
expression’ and those below as ‘low expression’. The log-rank test
was used to evaluate the statistical significance of the survival
curves (31).
Identification of signature prognostic
genes in the risk model
To identify key genes associated with LIHC
prognosis, Least Absolute Shrinkage and Selection Operator (LASSO)
regression analysis was performed using the ‘glmnet’ package in R
software (version 4.1.2; https://cran.r-project.org/package=glmnet), which
employed a 10-fold cross-validation to ascertain the optimal λ
value (32). In this study, the
‘optimal λ value’ was defined as the value that minimized the mean
squared error (MSE) across the folds during cross-validation,
balancing bias and variance to enhance model stability and prevent
overfitting. This approach ensured the selection of the
coefficients that can most accurately predict patient outcomes in
the TCGA-LIHC dataset. TCGA-LIHC samples were divided into
high-risk groups and low-risk groups based on the expression of the
selected genes in LIHC, with risk scores calculated using the
‘survival’ package (33) in R
(version 2.41.3; https://cran.r-project.org/package=survival). The
survival time and risk score of each sample were then compared, in
addition to the expression patterns of the characteristic genes. KM
survival analysis was conducted utilizing the log-rank test to
identify survival differences between the high-risk and low-risk
groups. Additionally, to determine the robustness and accuracy of
the predictive model, a receiver operating characteristic (ROC)
analysis was performed using the ‘survivalROC’ package in R
(Version 1.0.3; https://CRAN.R-project.org/package=survivalROC)
(34). The predictive power of the
model was quantified by calculating the area under the ROC curve
(AUC). AUC values close to 1 would indicate optimal predictive
ability. P<0.05 were set as the threshold for statistical
significance in all analyses.
Cell culture
Human liver cancer cell lines (MHCC97H, Hep3B, Huh7
and HepG2) were selected for the present study, which were procured
from BeNa Culture Collection; Beijing Beina Chunglian Institute of
Biotechnology. The huma liver immortalized cell line THLE-2, which
was utilized as the control in the present study, were sourced from
the Institute of Virology, Chinese Academy of Medical Sciences
(Beijing, China) (35).
All of the cell lines were grown in DMEM (Gibco;
Thermo Fisher Scientific, Inc.), which was supplemented with 1%
penicillin-streptomycin and 10% FBS (Gibco; Thermo Fisher
Scientific, Inc.). The cells were cultivated in a humidified
atmosphere with 5% CO2 at 37˚C under carefully monitored
circumstances.
Transfection
For the manipulation of gene expression in MHCC97H
and Huh7 cell lines, specific transfection assays were performed.
Expression of the CRYAB gene was knocked down using small
interfering RNA (si)-CRYAB (Shanghai GenePharma Co., Ltd.), with a
non-targeting siRNA (si-NC; Shanghai GenePharma Co., Ltd.) serving
as the negative control. Simultaneously, the NFIA gene was knocked
down using si-NFIA and overexpressed using an overexpression vector
[pcDNA3.1 (+), Invitrogen; Thermo Fisher Scientific, Inc.]. An
empty pcDNA3.1(+) vector was used as the control for overexpression
studies. All transfections were conducted using Lipofectamine 3000
(Invitrogen; Thermo Fisher Scientific, Inc.) (36) according to the manufacturer's
protocols. For each transfection reaction, 50 nM siRNA or 2 µg of
plasmid DNA was used per well in a 6-well plate. The transfection
mixture was incubated at 37˚C for 24 h. After transfection, cells
were allowed to recover in complete medium for an additional 24 h
at 37˚C before subsequent experimentation. Sequence of siRNA
targeting NFIA (si-NFIA): 5'-GCCGUGAAGGAUGAAUUGCUA-3'. Sequence of
siRNA targeting CRYAB (si-CRYAB): 5'-GCAGGCCCAAAUUAUCAAGCTT-3'.
Sequence of non-targeting control siRNA (si-NC):
5'-GCUUCGCCGCCGCCGUAGUUA-3'.
Reverse transcription-quantitative PCR
(RT-qPCR)
The expression of CRYAB in liver cancer cells
(MHCC97H, Hep3B, Huh7 and HepG2) and liver immortalized cells
(THLE-2) was assessed using RT-qPCR. Following the manufacturer's
protocol, total RNA was extracted from cells using TRIzol reagent
(Invitrogen; Thermo Fisher Scientific, Inc.). Reverse transcription
was conducted using the PrimeScript™ RT Reagent Kit (Takara Bio,
Inc.), with the following temperature protocol: 37˚C for 15 min for
reverse transcription, followed by 85˚C for 5 sec for enzyme
inactivation. For qPCR, the specific primer sequences used were as
follows: CRYAB forward (F), 5'-AACGGCCTGGGTGGATAGAAG-3' and reverse
(R), 5'-CAGTACTCACTGAGCTGCTCTT-3'. For GAPDH, which served as the
internal control, the primer sequences F,
5'-GCACCGTCAAGGCTGAGAAC-3' and R, 5'-TGGTGAAGACGCCAGTGGA-3'. Using
the SYBR™ Green Universal Master Mix (cat. no. 4309155; Applied
Biosystems; Thermo Fisher Scientific, Inc.) and the ABI 7500
Real-Time PCR System (Applied Biosystems; Thermo Fisher Scientific,
Inc.), RT-qPCR was performed. The thermocycling protocol for qPCR
was as follows: Initial denaturation at 95˚C for 10 min, followed
by 40 cycles of 95˚C for 15 sec and 60˚C for 1 min. CRYAB
expression was normalized to GAPDH as the internal standard, which
was then quantified using the 2-ΔΔCq approach (37).
Western blotting (WB)
Following the manufacturer's protocols, proteins
were extracted from liver cancer cells (MHCC97H, Hep3B, Huh7 and
HepG2) and huma liver immortalized cells (THLE-2) using RIPA buffer
(Beyotime Institute of Biotechnology). The protein concentration
was quantified using the BCA protein assay kit (Thermo Fisher
Scientific, Inc.). Proteins (20-30 µg) were separated by SDS-PAGE
on a 10-12% gel and transferred onto PVDF membranes
(MilliporeSigma). PVDF membranes were then blocked with 5% non-fat
dry milk in TBS-0.1% Tween-20 (TBS-T) for 1 h at room temperature.
Membranes were incubated overnight at 4˚C with the primary
antibodies: CRYAB at a dilution of 1:1,000 (cat. no. ab76467;
Abcam); NFIA at a dilution of 1:1,000 (cat. no. ab228897; Abcam) or
GAPDH (cat. no. 2118L; Cell Signaling Technology, Inc.) at a
dilution of 1:1,000. After washing three times with TBS-T,
membranes were incubated with HRP-conjugated secondary antibodies
at a dilution of 1:2,000 (cat. no. ab6721; Abcam) for 1 h at room
temperature. An enhanced chemiluminescence substrate (Pierce™ ECL
Western Blotting Substrate; Thermo Fisher Scientific, Inc.) was
used to observe protein bands. Band intensities were quantified
with ImageJ software (version 1.48v; National Institutes of Health)
for accurate comparison.
Cell viability assay
Following transfection, cell proliferation was
evaluated using the Cell Counting Kit-8 (CCK-8) from Dojindo
Molecular Technologies, Inc. Cells were seeded at a density of
2x10³ cells per well into 96-well plates and cultured at
37˚C for 1, 2, 3 and 4 days. At each time point, 10 µl CCK-8
reagent was added into each well and incubated for 2 h at 37˚C in a
humidified incubator with 5% CO2. The absorbance was
measured at 450 nm using a microplate reader (Kehua Technologies,
Inc.).
JASPAR database
The JASPAR database (https://jaspar.genereg.net/) (38) was utilized to identify potential
transcription factor binding sites within the CRYAB promoter
region. JASPAR, an open-access database, offers a comprehensive
collection of curated, non-redundant transcription factor binding
profiles sourced from various species (39). By inputting the specific DNA
sequence of the CRYAB promoter region (Gene ID: 1410; positions
344-353) into the JASPAR human-specific database and setting the
relative profile score threshold to 80%, potential transcription
factors that can bind to this region were predicted.
Luciferase activity assay
To assess the transcriptional activity at the
binding sites, a luciferase activity assay was conducted. Reporter
constructs based on the pGL3-Basic vector (Promega Corporation)
were used to examine this activity. Specifically, 293T cells,
either with or without overexpression/knockdown of NFIA (untreated
cells served as the control group), were co-transfected with
pGL3-CRYAB wild-type (WT) or pGL3-CRYAB mutant (MUT) plasmids. All
transfections were conducted using Lipofectamine 3000 (Invitrogen;
Thermo Fisher Scientific, Inc.). For each transfection, 1 µg
plasmid DNA was used per well. The transfection reaction was
incubated at 37˚C for 6 h. The luciferase activity in the cells was
measured 24 h after transfection using the Dual-Luciferase Reporter
Assay System (Promega Corporation). The assays were conducted in
accordance with the manufacturer's recommended protocol. Firefly
luciferase activity was normalized to Renilla luciferase
activity to minimize the effects of variations in experimental
conditions. To measure the luciferase activity a luminometer
(PerkinElmer, Inc.) was utilized.
TIMER database analysis
The TIMER database (Version 1.0 1; https://cistrome.shinyapps.io/timer/)
(40) was used to study the
expression profile of NFIA in various cancers. This database
provides a comprehensive platform, primarily providing
transcriptomic data from TCGA project, enabling the analysis of
gene expression across various cancer types. In the present study,
the TIMER database (Version 1.0.1; https://cistrome.shinyapps.io/timer/) was used to
analyze the expression of NFIA in different cancer types.
Specifically, the expression data of the NFIA gene were queried and
set the default search criteria and thresholds. The TIMER platform
demonstrated the expression levels of NFIA in various cancers by
providing transcriptome data from TCGA project. The differential
expression of NFIA in LIHC and its corresponding normal tissues
were specifically focused upon to investigate its potential role in
liver cancer.
Transwell assay
Transwell chambers (Corning, Inc.) with inserts with
a pore size of 8.0 µm were used for the invasion and migration
assays. For the migration assay, MHCC97H and Huh7 cells were
transfected with siRNAs targeting CRYAB, NFIA, both CRYAB and NFIA
or a negative control (si-NC) and then seeded into the upper
chamber without any coating at an absolute cell density of
1x10⁵ cells per chamber, suspended in serum-free DMEM.
The lower chamber was supplemented with culture medium containing
10% FBS to serve as a chemoattractant. For the invasion assay, the
upper chamber was pre-treated with Matrigel (cat. no. 354234;
Corning, Inc.) at a concentration of 1 mg/ml and the coating was
performed at 37˚C for 30 min. to replicate the cellular barriers
encountered during invasion. After an incubation period of 24 h at
37˚C, cells that did not undergo migration or invasion were
delicately eliminated using a cotton swab. Cells that had
successfully migrated or invaded to the lower surface of the
membrane were then fixed using 4% paraformaldehyde for 20 min at
room temperature. Subsequently, these cells were subjected to DAPI
staining at a final concentration of 1 µg/ml for visualizing the
nuclei, with staining performed at room temperature for 10 min. The
number of migrated or invaded cells was then counted in five
randomly selected fields of view per chamber under a fluorescence
microscope, facilitating the comparison between different treatment
groups.
Statistical analysis
The statistical analysis was conducted using R
software, version 3.6.0, released in 2019, in conjunction with the
‘limma’ package of the same version for the normalization and
analysis of gene expression profiles. The ‘VennDiagram’ package
(version 1.6.13) and the ‘clusterProfiler’ package (version 3.14.0)
were used for enrichment analysis.
For in vitro experimental data, GraphPad
Prism (version 7.0; Dotmatics), was utilized to perform the
necessary statistical tests and generate graphical representations.
Data from the experiments were presented as mean ± SD and subjected
to an unpaired t-test for two-group comparisons or a one-way ANOVA
for comparisons among multiple independent groups. Tukey's test was
used as a post hoc analysis for ANOVA results. P<0.05 was
considered to indicate a statistically significant difference. Each
experiment was repeated at least three times to ensure accuracy and
reproducibility.
Results
Identification and enrichment analysis
of 42 overlapping genes
From the GSE113996 and TCGA-LIHC datasets, DEGs were
identified. Specifically, TCGA dataset revealed 9,078 upregulated
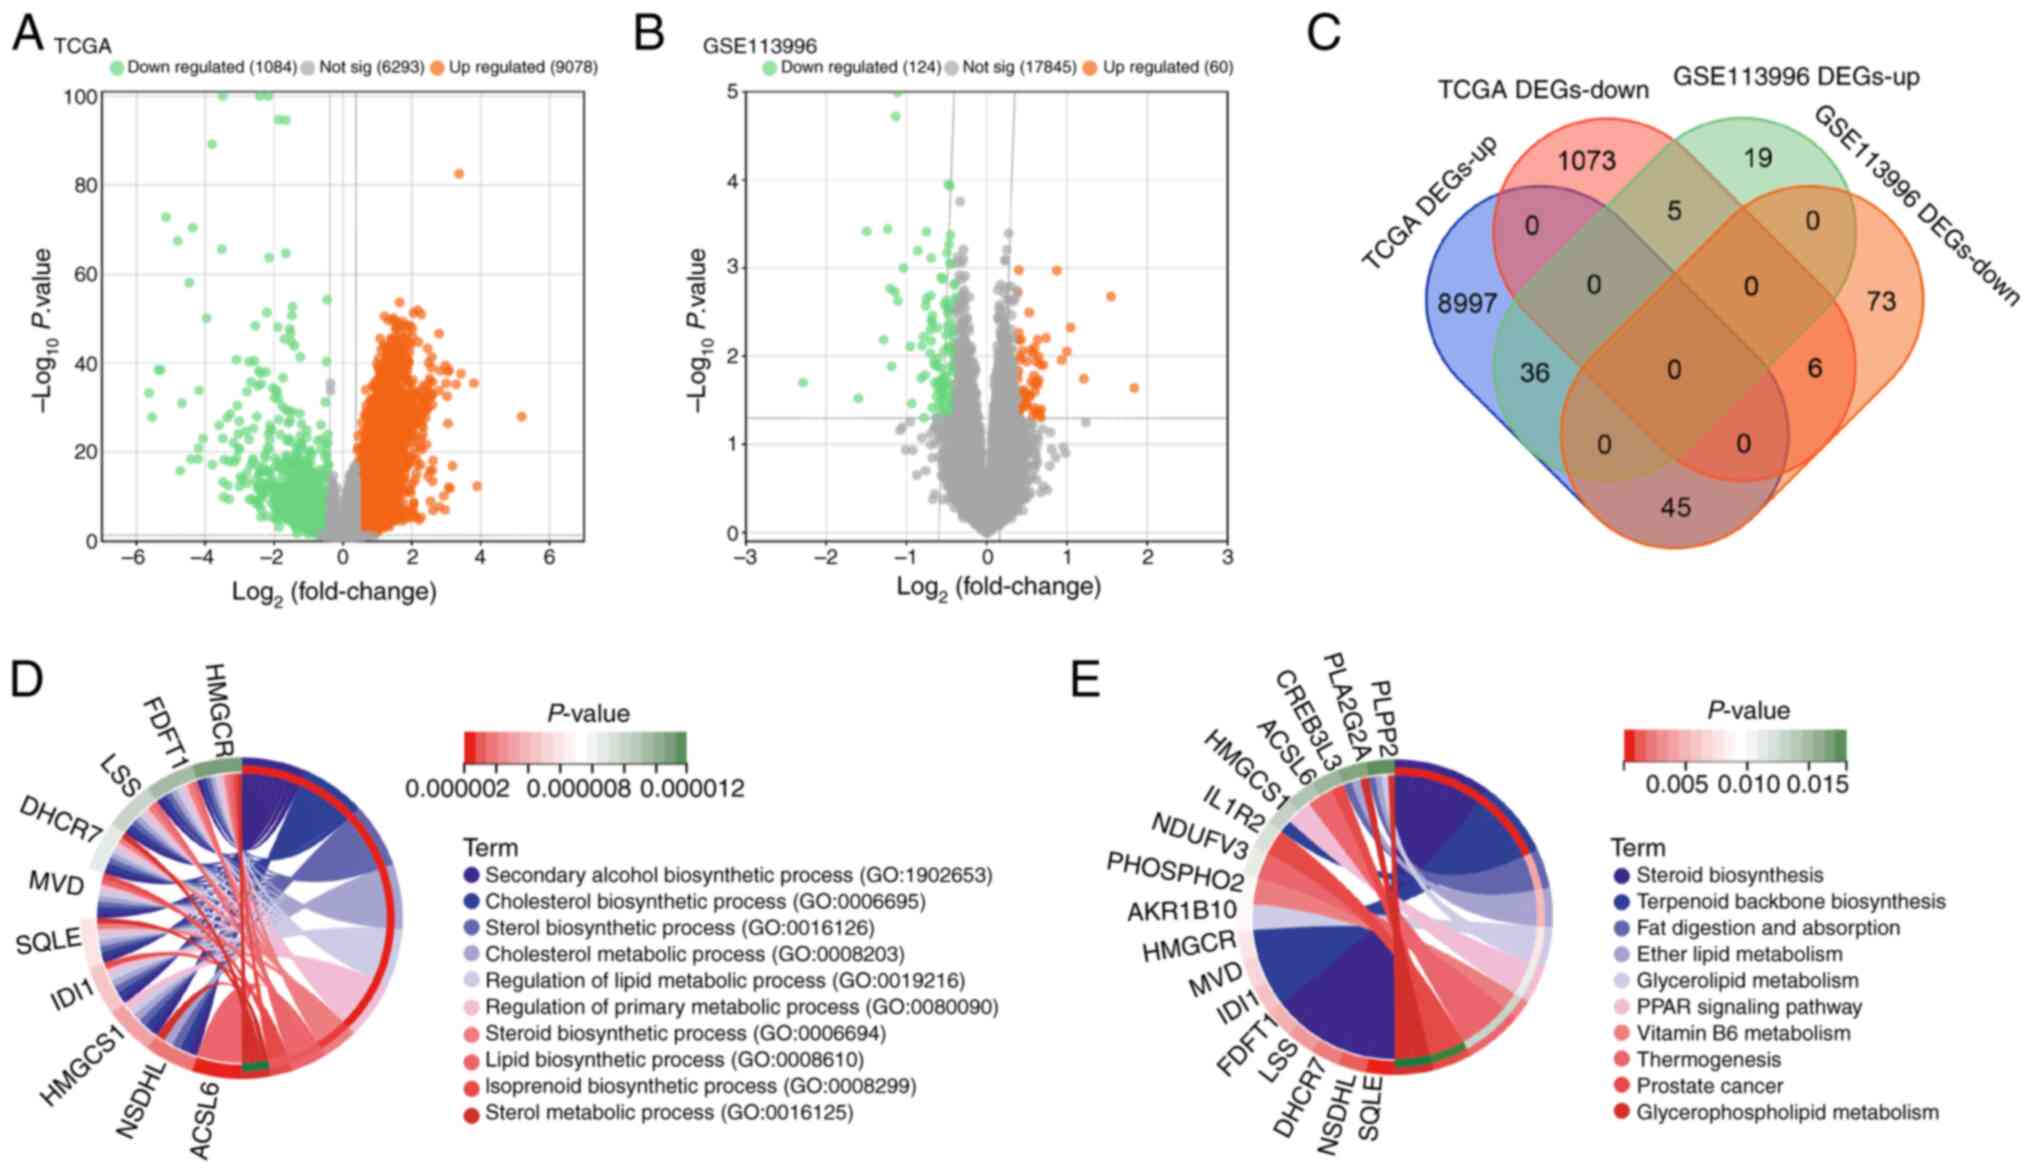
DEGs and 1,084 downregulated DEGs (Fig. 1A). By contrast, the GSE113996
dataset showed 60 upregulated and 124 downregulated DEGs (Fig. 1B). An overlap analysis of DEGs from
both datasets yielded 42 overlapping genes, including 36
overlapping upregulated DEGs and six overlapping downregulated DEGs
(Fig. 1C). Utilizing the
‘ClusterProfiler’ tool for functional pathway enrichment analysis,
these 42 genes were found to serve a significant role in various
BPs, notably including ‘cholesterol biosynthesis (GO: 0006695)’,
‘sterol biosynthetic process (GO: 0016126)’, ‘regulation of lipid
metabolic process (GO: 0018216)’, and ‘regulation of primary
metabolic process (GO: 0080090)’ (Fig.
1D). KEGG analysis further indicated their enrichment in
pathways including ‘glycerolipid metabolism’, ‘peroxisome
proliferator-activated receptor (PPAR) signaling’ and ‘vitamin B6
metabolism’ (Fig. 1E).
PPI network and survival analysis of
the overlapping genes
Using the Cytoscape software, a PPI network analysis
of the 42 overlapping genes was performed, yielding a network of 36
nodes and 45 edges (Fig. 2A). A KM
survival analysis on these genes was then performed after
categorizing the samples into high-risk and low-risk cohorts, with
samples above the median risk score classified as high-risk and
those below as low-risk. Notably, nine genes displayed significant
associations with OS (Fig. 2B-J).
Elevated expression of aldo-keto reductase family 1, member B10
(AKR1B10), aldo-keto reductase 1B15 (AKR1B15), CRYAB,
dihydrolipoamide S-acetyltransferase (DLAT), stanniocalcin 2
(STC2), heat shock protein family B member 8 (HSPB8),
NAD(P)-dependent steroid dehydrogenase-like (NSDHL) and squalene
epoxidase (SQLE) were found to associate with reduced OS, whilst
increased IFITM1 expression showed a superior OS. These data
suggest the prognostic importance of these genes in HCC.
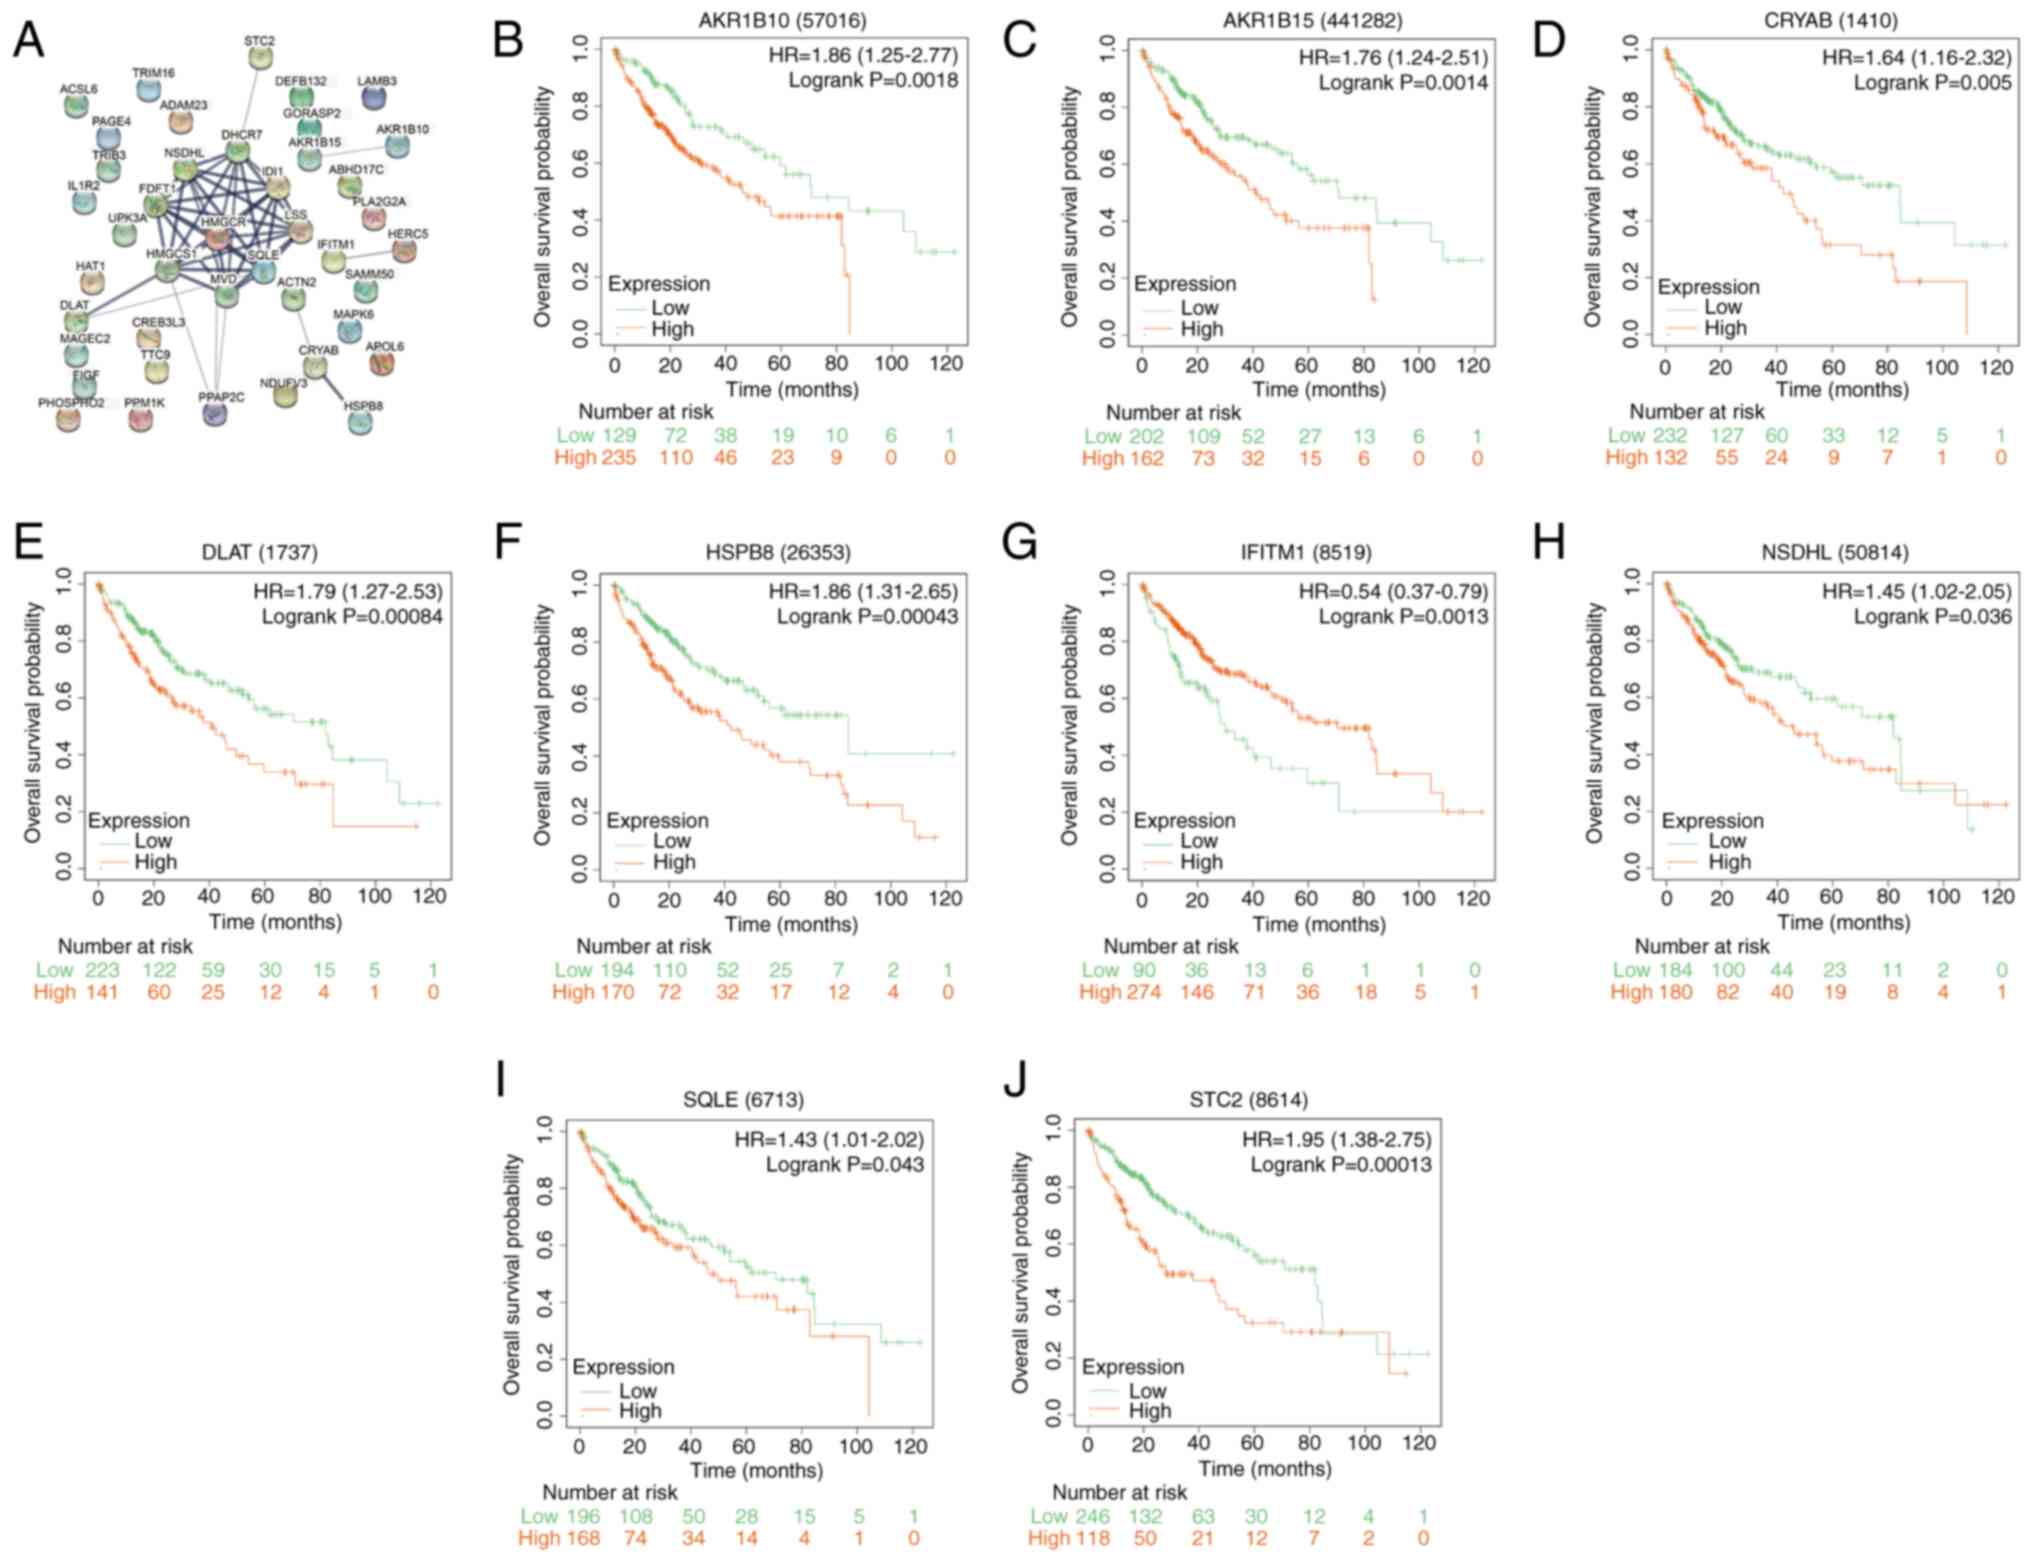 | Figure 2PPI network analysis and prognostic
significance of overlapping genes in liver cancer. (A) PPI network
representation of 42 overlapping genes. Nodes represent proteins or
protein domains, while edges represent interactions between these
proteins, with edge thickness representing the confidence of the
interaction. Kaplan-Meier survival curves for the identified
prognostically significant genes: (B) AKR1B10, (C) AKR1B15, (D)
CRYAB, (E) DLAT, (F) HSPB8, (G) IFITM1, (H) NSDHL, (I) SQLE and (J)
STC2. The x-axis represents survival time in months and the y-axis
represents survival probability. HR represents the risk of an event
in the high-risk group compared to the low-risk group. Log-rank
P-value indicates the statistical significance of the difference in
survival between high-risk and low-risk groups. PPI,
protein-protein interaction; HR, hazard ratio; AKR1B10, aldo-keto
reductase family 1, member B10; AKR1B15, aldo-keto reductase 1B15;
CRYAB, Crystallin αB; DLAT, dihydrolipoamide S-acetyltransferase;
HSPB8, heat shock protein family B member 8; IFITM1, interferon
induced transmembrane protein 1; NSDHL, NAD(P)-dependent steroid
dehydrogenase-like; SQLE, squalene epoxidase; STC2, stanniocalcin
2. |
Prognostic risk analysis and
identification of signature prognostic genes
The Lasso regression model was then parameterized,
which were used to develop a risk score model to predict patient
survival, leveraging the expression and regression analyses of the
prognostic genes (Fig. 3A and
B). In total, seven significant
genes were identified at λmin=0.019. This
λmin value was selected based on 10-fold
cross-validation within the Lasso regression model, aiming to
minimize the MSE and avoid overfitting. Utilizing the risk score
formula of riskscore=0.0125 x CRYAB + 0.1125 x AKR1B15 + 0.0019 x
HSPB8 + 0.1906 x STC2 + 0.2135 x NSDHL + 0.1357 x DLAT + (-0.0349)
x IFITM1, risk scores were assigned based on the gene expression
levels, which were then used to categorize the patients into
stratified groups of either high or low risk using the median risk
score as the cut-off. Fig. 3C
displayed the risk score distribution between these groups,
revealing both the survival status and duration for the different
risk classifications. Notably, a greater number of fatalities
occurred in the high-risk group, where seven significant prognostic
genes emerged. These genes, displayed in the heatmap in Fig. 3C, exhibit distinct expression
patterns between high-risk and low-risk groups. Specifically,
IFITM1 is highly expressed in the low-risk group, but shows low
expression in the high-risk group. By contrast, the remaining six
genes (CRYAB, AKR1B15, HSPB8, STC2, NSDHL and DLAT) are highly
expressed in the high-risk group and show low expression in the
low-risk group. Survival analysis highlighted a markedly reduced OS
in the high-risk group compared with that in its low-risk
counterpart (Fig. 3D).
Furthermore, ROC curve analysis verified the viable predictive
ability of the present model on the 1-year survival rate, with the
highest AUC value of 0.76 (Fig.
3E).
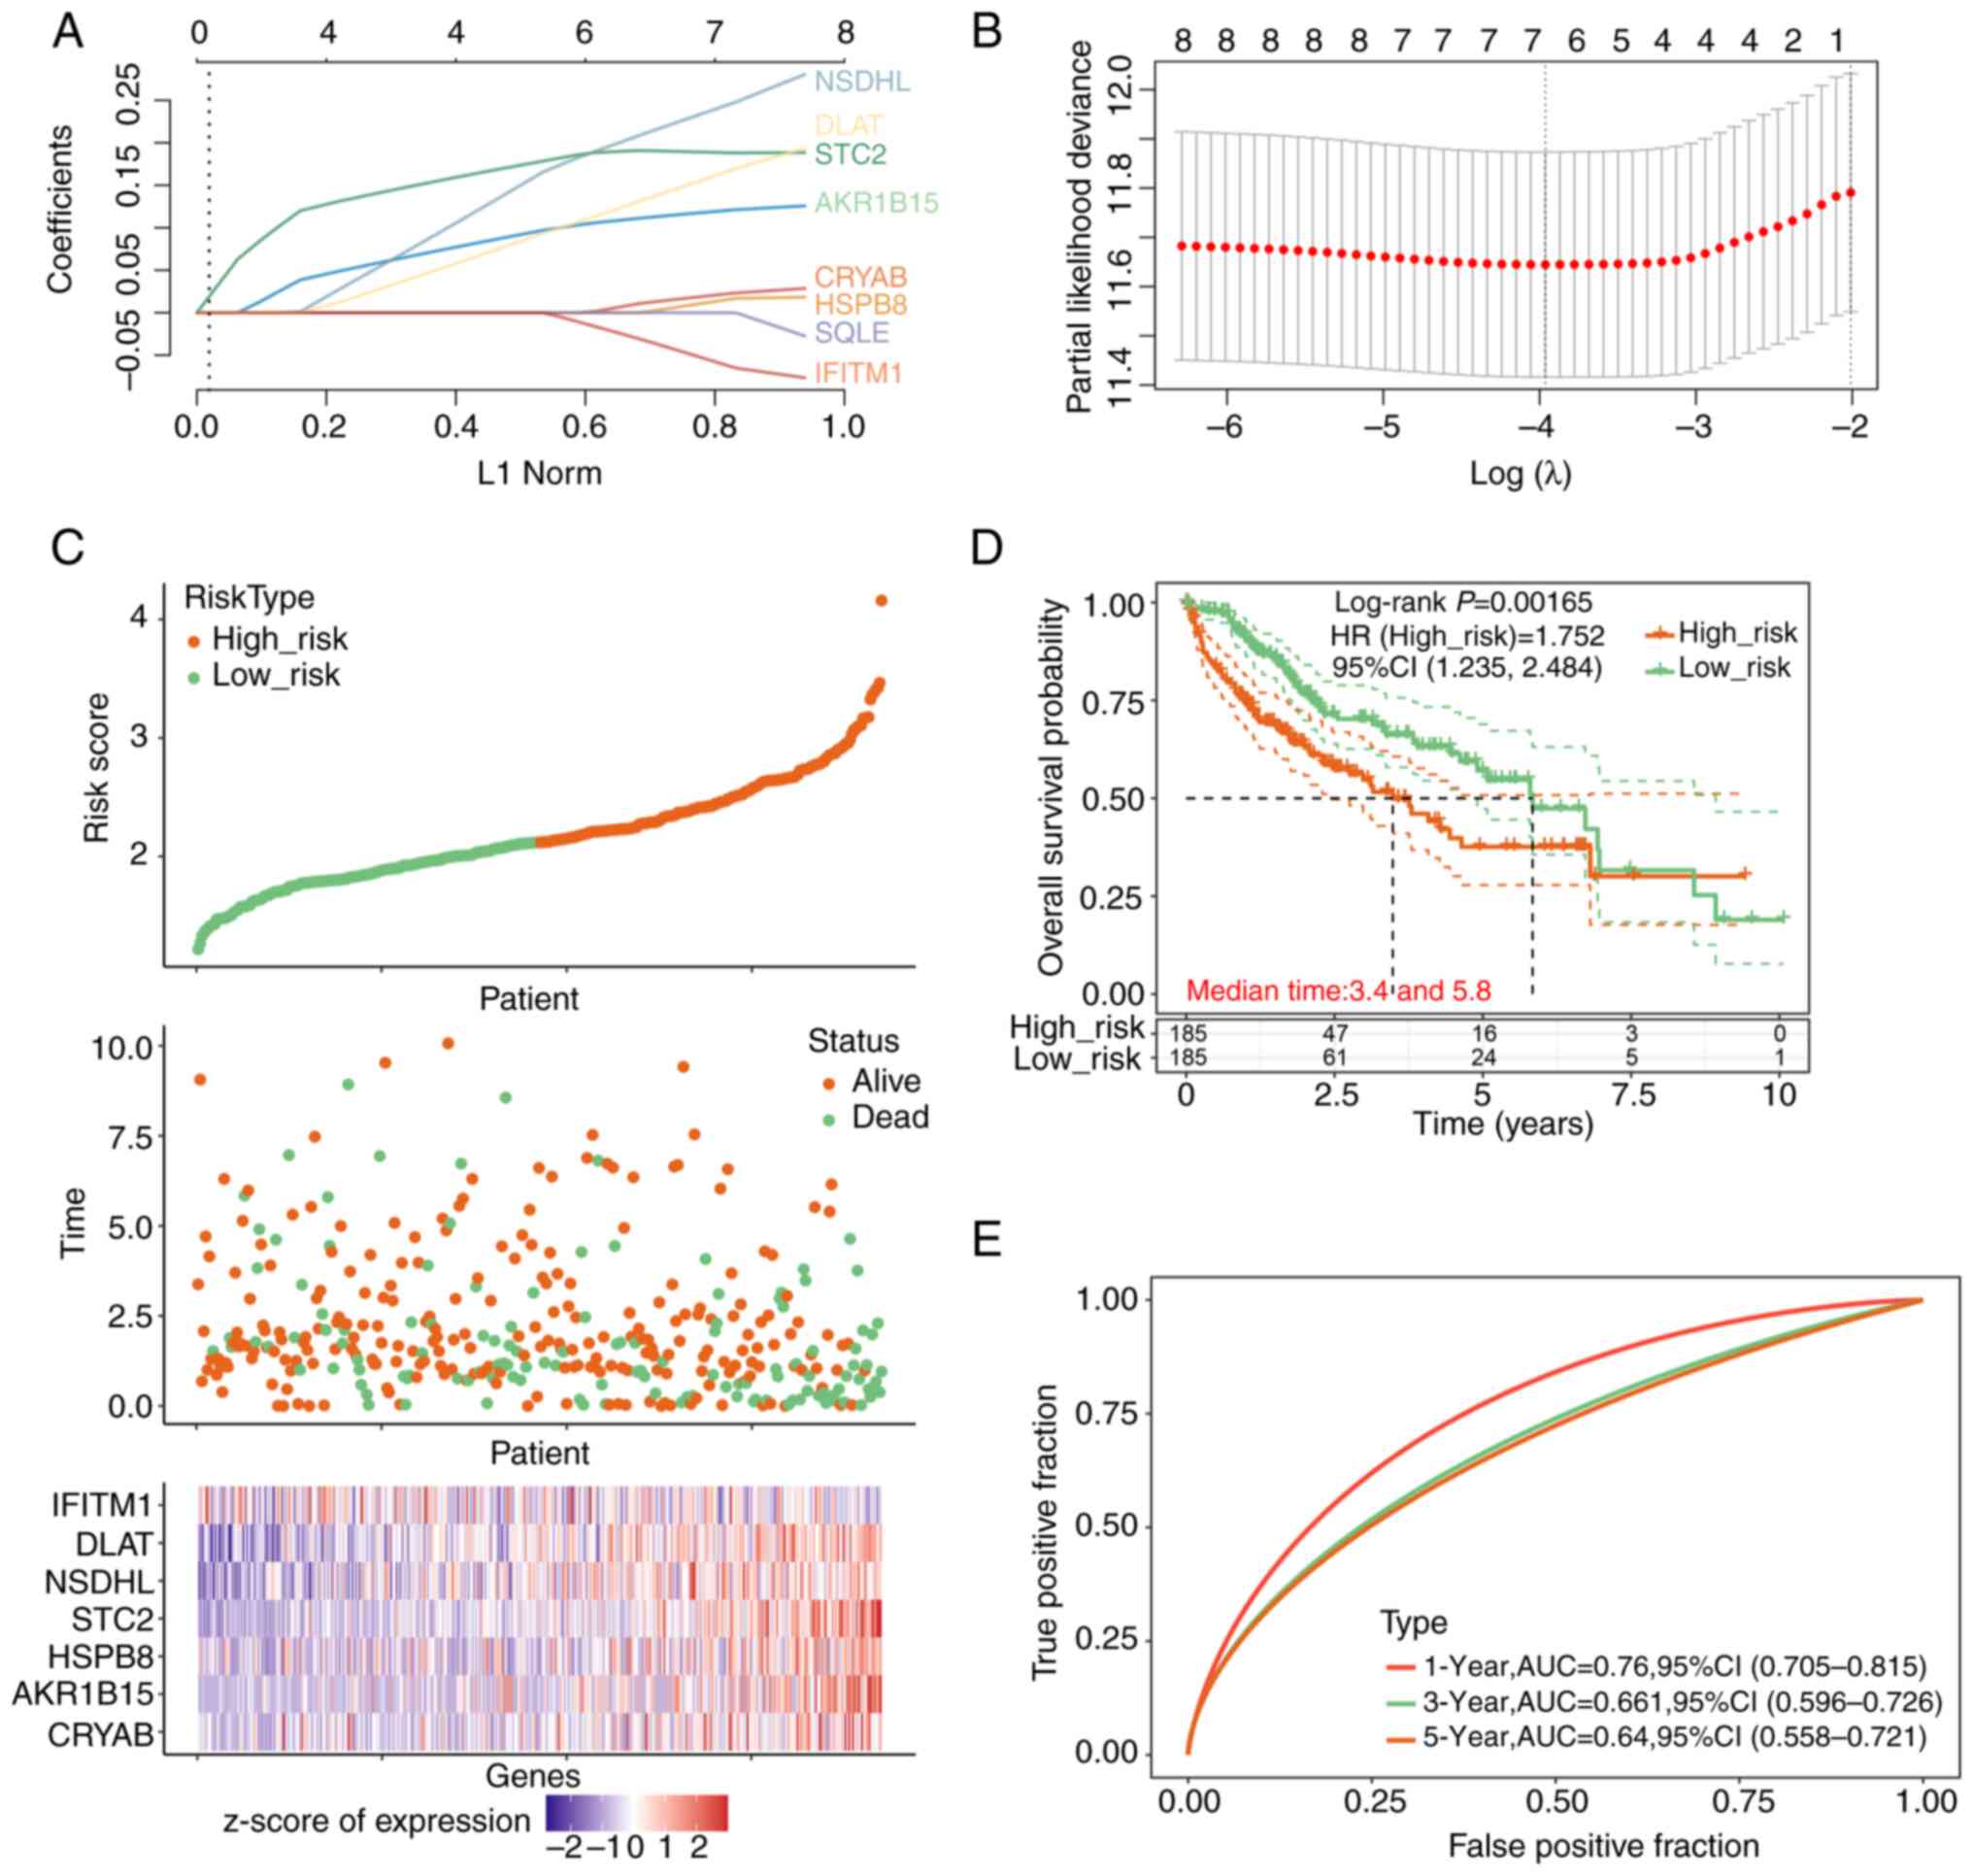 | Figure 3Risk prediction model analysis and
characterization of prognostic genes. (A) LASSO regression analysis
highlighting the coefficients of the eight prognosis-associated
genes against the L1 Norm. (B) Cross-validation utilized for tuning
parameter determination in the LASSO regression model. The x-axis
represents the log(λ) value and the y-axis indicates partial
likelihood deviance. (C) Risk score distribution of patients with
liver cancer, segregated into low-risk and high-risk categories.
The upper scatterplot elucidates the association between risk
scores and patient survival status and duration. The lower plot
shows a heatmap of z-scores of normalized expression levels of the
prognostic genes across the risk stratifications. The x-axis in the
upper scatterplot shows ‘patient’ identifiers, each representing an
individual's risk score and survival data. In the lower heatmap
below, the x-axis shows the ‘genes’ involved in liver cancer
prognosis, with their expression levels depicted across the
different risk categories. (D) Kaplan-Meier survival analysis
contrasting the overall survival between low- and high-risk
cohorts. The x-axis chronicles the time in years, whereas the
y-axis plots the overall survival probability. (E) Receiver
operating characteristic curves demonstrating the predictive
performance of the prognostic signature at 1-year, 3-year, and
5-year intervals. HR, hazard ratio; AUC, area under the curve;
LASSO, Least Absolute Shrinkage and Selection Operator; NSDHL,
NAD(P)-dependent steroid dehydrogenase-like; IFITM1, interferon
induced transmembrane protein 1; DLAT, dihydrolipoamide
S-acetyltransferase; STC2, stanniocalcin 2; HSPB8, heat shock
protein family B member 8; AKR1B15, aldo-keto reductase 1B15;
CRYAB, crystallin αB. |
Inhibition of HCC cell proliferation,
migration and invasion after CRYAB knockdown
CRYAB expression in the liver cancer cell lines and
human liver cell line THLE-2 was first measured using RT-qPCR and
WB (Fig. 4A and B). Elevated CRYAB expression was found in
the liver cancer cell lines compared with that in THLE-2 cells,
especially in MHCC97H and Huh7 cells. After knocking down CRYAB
expression, both RT-qPCR and WB analysis showed that CRYAB
expression was significantly reduced compared with that in the
si-NC group (Fig. 4C and D). Further functional assays demonstrated
the role of CRYAB in HCC cells. CCK-8 assay revealed a significant
decrease in cell proliferation after CRYAB knockdown compared with
that in the si-NC group (Fig. 4E
and F). In addition, Transwell
assays showed that CRYAB knockdown significantly inhibited cell
migration and invasion compared with that in the si-NC group in
both MHCC97H and Huh7 cell lines (Fig.
4G-J). Notably, CRYAB promoted HCC cell proliferation,
migration, and invasion. These observations suggest that CRYAB
knockdown not only inhibited its expression, but also significantly
inhibited liver cancer cell invasion.
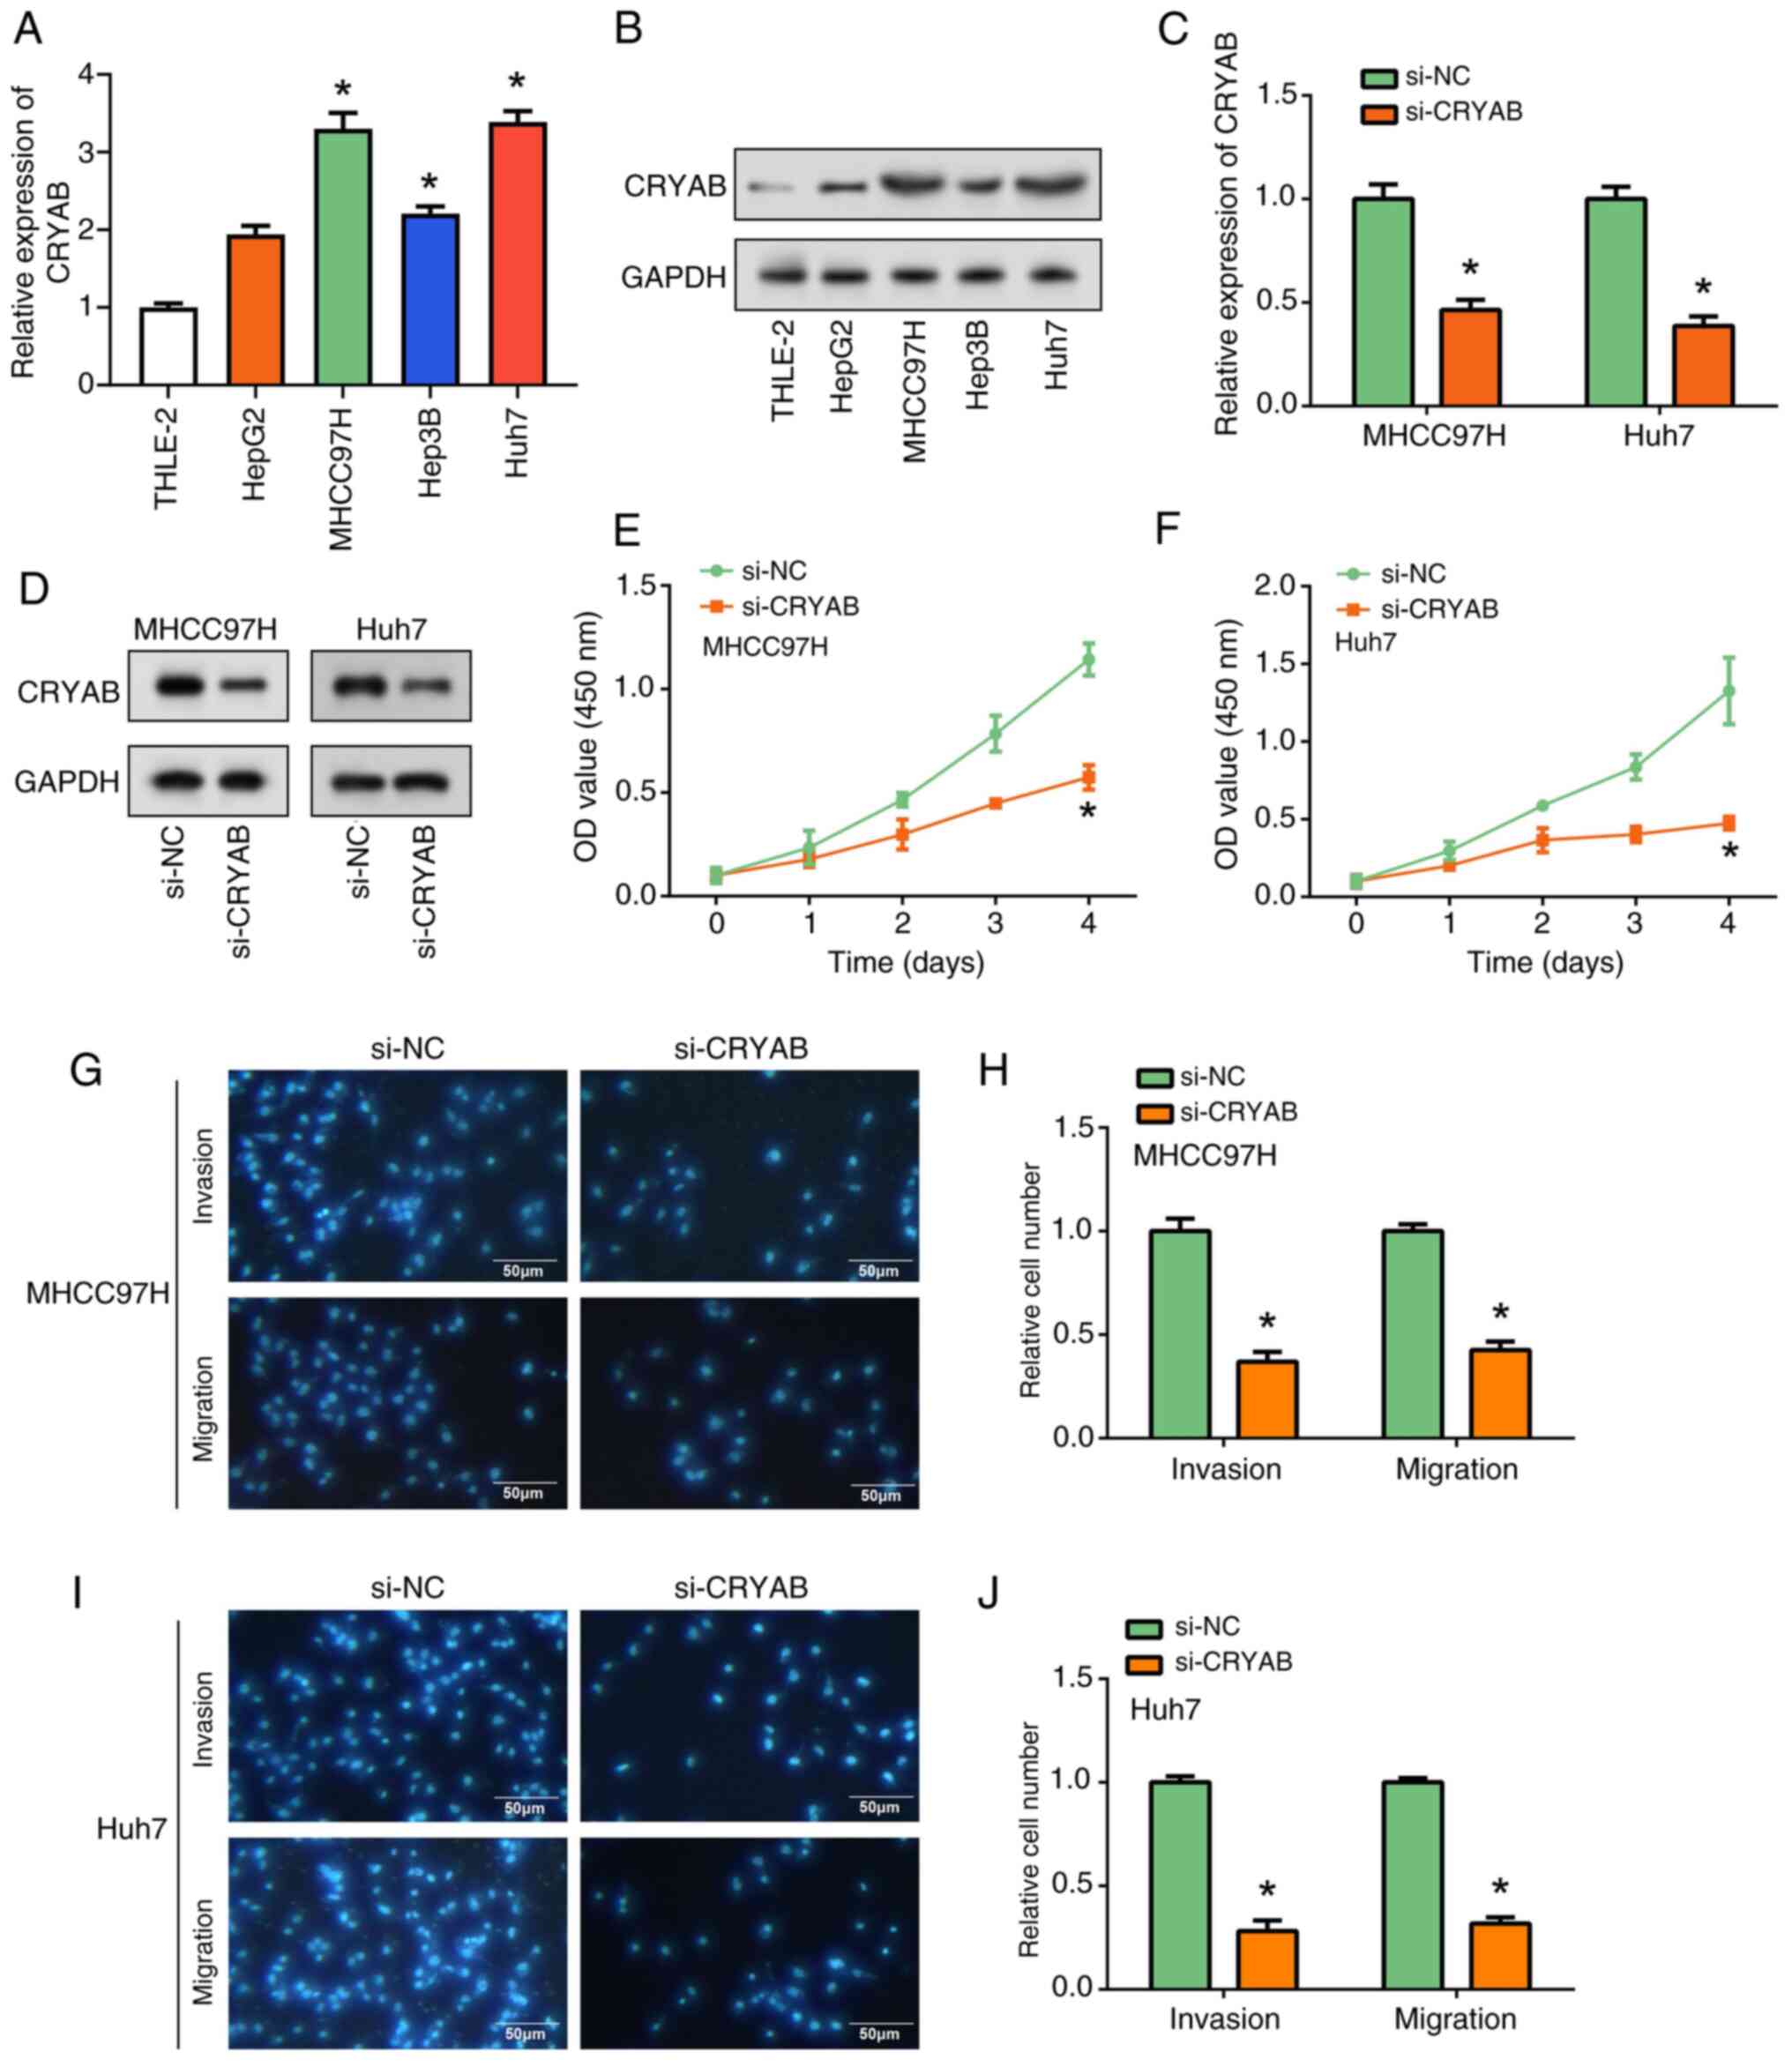 | Figure 4Regulation of liver cancer cell
proliferation, migration and invasion by CRYAB knockdown. (A)
RT-qPCR and (B) WB analysis of CRYAB expression in THLE-2 cells and
4 liver cancer cell lines (HepG2, MHCC97H, Huh7 and Hep3B).
*P<0.05 vs. THLE-2. (C) RT-qPCR and (D) WB were used
to evaluate the efficiency of CRYAB knockdown in MHCC97H and Huh7
cells. *P<0.05 vs. THLE-2. Cell Counting Kit-8 assay
of the effect of CRYAB knockdown on (E) MHCC97H and (F) cell
proliferation. *P<0.05 vs. si-NC. Transwell assay to
assess the effect of CRYAB knockdown on migration and invasion of
(G) MHCC97H cells and (H) were semi-quantified (scale bars, 50 µm).
Transwell assay to assess the effect of CRYAB knockdown on
migration and invasion of (I) Huh7 cells and (J) were
semi-quantified. *P<0.05 vs. si-NC. CRYAB, Crystallin
αB; RT-qPCR, reverse transcription-quantitative PCR; WB, western
blotting; si, small interfering; NC, negative control; OD, optical
density. |
NFIA regulates CRYAB transcriptional
activity in HCC cells
Utilizing the TIMER database to evaluate NFIA
expression levels across diverse types of cancers, the differential
expression patterns of this gene among the various malignancies
were assessed. Notably, compared with that in the control samples,
NFIA demonstrated significantly reduced expression in LIHC tumor
specimens (Fig. 5A). To further
investigate the functional relevance of NFIA, its knockdown and
overexpression were performed in MHCC97H and Huh7 cells. WB
analysis revealed that upon NFIA knockdown, there was a marked
decrease in the NFIA protein expression levels but those of CRYAB
were markedly increased. This inverse correlation suggests a
repressive regulatory effect of NFIA on CRYAB expression. However,
when NFIA was overexpressed, a marked decline in CRYAB protein
expression was evident (Fig. 5B).
Furthermore, using the JASPAR software, potential NFIA binding
sites were identified within the CRYAB promoter region at positions
344-353 relative to the transcription start site (TSS), pinpointing
a promising NFIA binding site for CRYAB transcriptional initiation
(Fig. 5C). To ascertain the
implications of NFIA binding to this CRYAB promoter, luciferase
reporter gene assays were next conducted. Luciferase reporter
vectors pGL3-CRYAB-WT and pGL3-CRYAB-MUT, which mirrored the
wild-type and mutant CRYAB binding sites, respectively, were
constructed (Fig. 5C). NFIA
overexpression significantly amplified the luciferase activity at
the CRYAB binding site, whilst NFIA knockdown significantly
mediated the opposite effects. This supports the regulatory role of
NFIA in suppressing CRYAB transcription. These aforementioned
effects did not occur on the pGL3-CRYAB-MUT sequences. These
findings suggest the pivotal role of NFIA in modulating CRYAB
expression in liver cancer cells by directly interacting with the
CRYAB promoter.
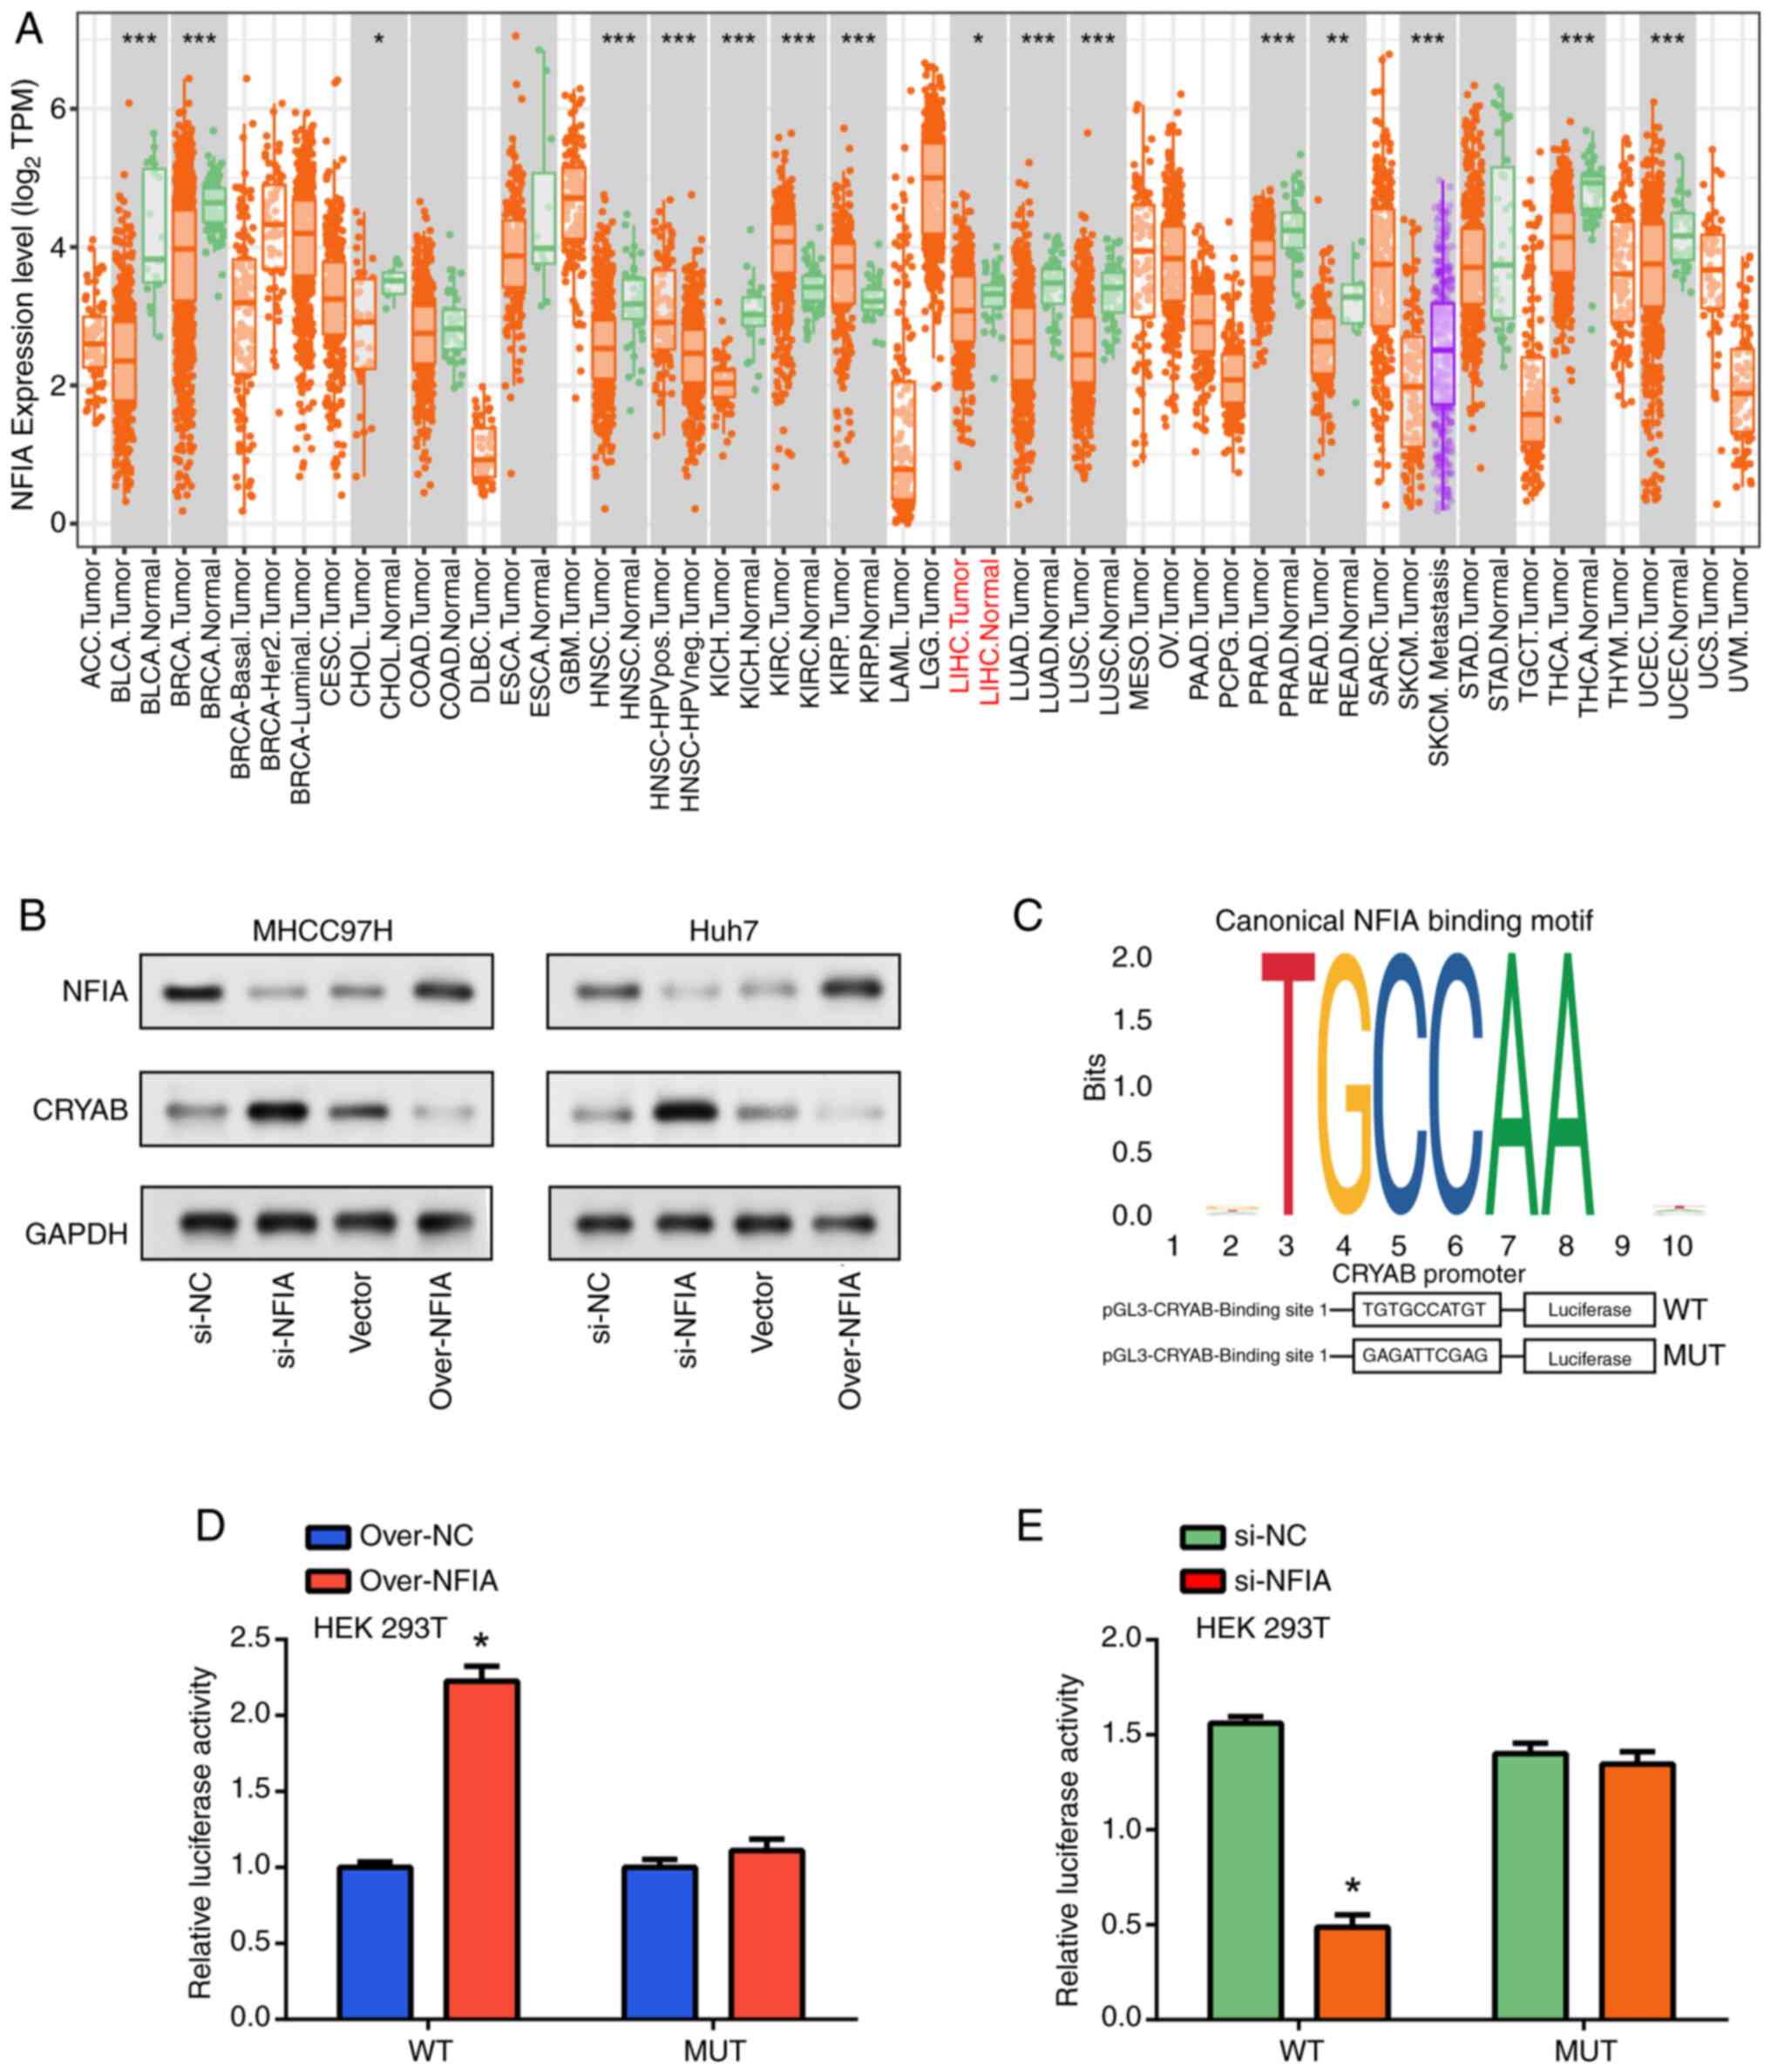 | Figure 5NFIA activates CRYAB gene expression
by binding to its promoter region. (A) Expression level analysis of
NFIA in pan-cancer using TIMER database. *P<0.05,
**P<0.01 and ***P<0.001. (B) Western
blotting analysis of NFIA and CRYAB expression in liver cell lines
after NFIA overexpression (using NFIA overexpression plasmid,
labeled as ‘over-NFIA’) and knockdown. ‘Vector’ refers to the
control plasmid used in the overexpression experiments, whilst
‘si-NC’ represents the negative control for siRNA knockdown
experiments. (C) Upper figure shows JASPAR software detecting
potential NFIA binding sites in the upstream genome sequence of the
CRYAB coding region, lower figure shows the structure diagram of
reporter genes based on the pGL3-Basic vector in luciferase
detection. Dual-luciferase reporter assay in 293T cells measuring
changes in wild-type and mutant luciferase activities after NFIA
(D) overexpression or (E) knockdown. *P<0.05 vs.
over-NC or si-NC. TPM, transcript per million; CRYAB, Crystallin
αB; NFIA, nuclear factor IA; WT, wild-type; MUT, mutant; over-,
overexpression plasmid; si-small interfering; NC, negative
control. |
Interaction between NFIA and CRYAB in
regulating liver cancer cell proliferation
To elucidate the functional roles of NFIA and CRYAB
in modulating liver cancer cell proliferation, invasion and
migration, CCK-8 and Transwell assays were performed across
different experimental groups (Fig.
6A-F). Upon the knockdown of NFIA expression, the liver cancer
cells exhibited a marked enhancement in their proliferative,
migratory and invasive capacities compared with those in the si-NC
group. By contrast, concomitant CRYAB knockdown expression led to a
significant reversal in these aforementioned effects mediated by
NFIA alone, thereby suggesting that NFIA likely acts as a
suppressor of tumor cell proliferation, migration and invasion,
while CRYAB may serve to counterbalance this effect. This suggests
the potential roles NFIA and CRYAB serve in the cellular dynamics
and malignancy of HCC.
Discussion
HCC represents a significant global health
challenge. Despite the availability of various diagnostic tools
(such as ultrasound, CT scan and MRI) and tumor marker analyses
(such as α-fetoprotein levels), early and precise detection of this
cancer remains elusive due to their limited sensitivity and
specificity (41-44).
The emergence of certain molecular biomarkers holds potential for
advancements in the diagnostic accuracy of HCC. Yang et al
(45) previously found that
DEAD-box 20 (DDX20) helicase is overexpressed in HCC, which
associated with poorer survival (45). DDX20 affects the tumor
microenvironment by interacting with miR-324-5p, affecting immune
cell dynamics and promoting macrophage differentiation. This
interaction also highlights the high dependence on EGFR signaling,
that is, EGFR activation supports DDX20-mediated tumor promotion. A
previous study showed that the reduction of runt-related
transcription factor 1 (RUNX1) expression can promote HCC
carcinogenesis. Specifically, the reduction of RUNX1 has been shown
to promote EMT by reducing E-cadherin expression and increasing
that of vimentin and MMP2, thereby enhancing tumor invasiveness and
metastatic potential. In addition, the reduction of RUNX1 lead to
reduced angiogenesis by downregulating VEGF expression, impairing
the ability of tumors to form new blood vessels necessary for
growth and survival in the tumor microenvironment (46). Other studies have indicated RUNX1
and its association with the upregulation of collagen 4A1 (COL4A1),
thereby stimulating HCC cell proliferation, emphasizing its promise
as a molecular candidate for HCC treatment (47,48).
Therefore, exploring and understanding these molecular markers of
HCC remain in high demand, not only for enhancing diagnostic
precision but also for paving the way for targeted therapeutic
strategies for HCC management.
From the analysis of both GSE113996 and TCGA-LIHC
datasets, DEGs that were significantly associated with essential
BPs were identified. Notably, the regulation of cholesterol
biosynthesis and lipid biosynthesis were found to be key pathways
enriched by these genes. This is in line with findings on
apolipoprotein H (APOH) in HCC, emphasizing the role of lipid
biosynthesis in tumor progression, especially in HBV-related cases.
APOH can regulate lipid metabolism and the tumor microenvironment
by promoting macrophage infiltration, contributing to HCC
progression through altered lipid biosynthesis and microenvironment
remodeling (49). Apart from
providing crucial membrane components for rapid tumor cell division
and proliferation, this pathway also produces a range of signaling
molecules, including sphingomyelin and phosphatidylinositol oxides
(50). Additionally, the
involvement of DEGs in the PPAR signaling pathway is consistent
with the findings of Lv et al (51), who revealed the potential of PPARγ
as a favorable prognostic indicator in bladder cancer. Prognostic
analysis, particularly in the context of complex diseases such as
HCC, is paramount for tailoring personalized treatment plans and
predicting patient outcomes. Among the seven prognostic markers
identified by survival analysis (IFITM1, DLAT, NSDHL, STC2, HSPB8,
AKR1B15 and CRYAB), CRYAB was selected as the hub gene for further
study. Previous reports have shown that CRYAB can serve a role in
other cancers, such as glioblastoma, breast cancer and lung cancer
(17,52), underscoring its potential
significance in oncology. However, its specific role in HCC remains
unclear, which is the focus of the present study.
CRYAB is a protein that has been investigated in
previous cancer studies. In colorectal cancer (CRC), CRYAB has been
demonstrated to facilitate the formation and maintenance of cancer
stem cells through the Wnt/β-catenin signaling pathway, thereby
enhancing their self-renewal and metastatic potential, underscoring
its significance as a molecular target for CRC therapeutic
strategies (53). Additionally,
owing to its role in immune cell infiltration, CRYAB has been
documented to serve as a tumor suppressor in CRC, offering
potential as a predictive biomarker for tumor progression and
patient prognosis (54). In
bladder cancer, CRYAB serves a suppressive role in cell migration,
invasion through the PI3K/AKT and ERK signaling pathways (55). In addition, the CRYAB C-802G G
allele has been associated with an increased risk of breast cancer,
highlighting its potential as an early detection marker in a
clinical setting (56). In the
present study, CRYAB was found to promote HCC cell proliferation,
migration and invasion, suggesting its important role in HCC
pathogenesis.
NFIA is garnering interest due to its implications
in a diverse range of cancer types, such as glioma, breast cancer
and CRC, highlighting its potential as a broad-spectrum factor in
oncological research and treatment strategies. In ovarian cancer,
Sry-box transcription factor 9 has been reported to promote
metastasis by upregulating NFIA and activating the Wnt/β-catenin
signaling pathway, suggesting a potential role for NFIA as a
therapeutic target and diagnostic marker (57). Additionally, NFIA has been
associated with the progression of CRC, as it is regulated by the
long intergenic non-coding RNA 00511/miR-29c-3p axis, where
LINC00511 serves as a competing endogenous RNA (ceRNA) to
upregulate NFIA expression by sponging miR-29c-3p, thereby
promoting cell proliferation, metastasis and stemness in CRC
tissues and cells (58). In
non-small cell lung cancer (NSCLC), NFIA has been noted to augment
radiosensitivity by reducing of AKT and ERK phosphorylation,
providing a potential avenue for enhancing the efficacy of
radiotherapy for patients with NSCLC (59). According to results from the
present study, NFIA was found to exert a modulatory effect on CRYAB
expression in HCC cells by directly binding to the CRYAB promoter.
Furthermore, the interplay between NFIA and CRYAB significantly
influenced the regulation of HCC cell proliferation, migration and
invasion capacities. Specifically, simultaneous knockdown of NFIA
and CRYAB reduced the enhanced cell activity observed when NFIA was
knocked down alone, highlighting the role of CRYAB in mediating the
effects of NFIA on HCC progression. This is consistent with the
findings of Zhu et al (60), where NFIA was found to directly
bind to the CRYAB promoter in prostate cancer. In CRC, elevated
CRYAB expression was previously found promote tumorigenesis and
metastasis by enhancing cell proliferation, migration and invasion
capabilities (61). This is
similar to the findings in the present study, where knockdown of
CRYAB in liver cancer cells led to a significant reduction in cell
proliferation, migration and invasion. Although NFIA expression was
associated with tumor characteristics, it was not significantly
associated with patient survival according to another previous
study, suggesting that it may not be an independent prognostic
factor (22). Collectively,
findings from the present study shed light on the complex interplay
between CRYAB and NFIA in liver cancer, offering novel insights
into their potential roles as prognostic indicators and therapeutic
targets.
The present in vitro study implicates NFIA
and CRYAB in HCC progression, suggesting their potential as targets
for novel tailored therapies. However, a number of limitations
persist in the present study. First, the limited use of distinct
cell lines and the number of biological replicates may impact the
robustness of our findings and further studies with greater
experimental diversity and sample sizes are needed to confirm these
observations. Second, potential confounding variables, such as
slight variations in cell culture conditions, differences in
transfection efficiency and inherent biological variability among
HCC cell lines, could influence the observed effects of NFIA and
CRYAB modulation, despite our efforts to standardize experimental
procedures. Additionally, the in vitro setup of the present
study may not fully reflect tumor microenvironment complexity in
vivo. In vivo studies are required to confirm the
present results for broader genomic and proteomic studies to
uncover additional pathways in HCC. Additionally, the influence of
dietary components, such as resveratrol, on gene expression and the
impact of pharmacological interventions on gene regulation must be
considered to develop a comprehensive understanding of HCC's
molecular landscape. The present findings point to several paths
for future research. Clinical trials are needed to assess the
efficacy of therapies that target NFIA and CRYAB. Understanding
factors that affect NFIA and CRYAB expression may lead to
personalized medicine and the development of biomarkers to predict
patient responses to targeted therapies is a priority. In summary,
the present study established a foundation for understanding the
roles of NFIA and CRYAB in liver but also indicates the necessity
for further research to bring these insights into clinical
application.
From the GSE113996 and TCGA-LIHC datasets, 42
overlapping genes involved in fundamental metabolic processes lipid
production and cholesterol. Among these, nine genes (AKR1B10,
AKR1B15, CRYAB, DLAT, HSPB8, IFITM1, NSDHL, SQLE and STC2) showed a
strong association with OS in HCC. Specifically, CRYAB promoted HCC
cell proliferation, migration and invasion. In addition, NFIA was
found to modulate CRYAB expression by binding to its promoter, and
luciferase reporter assay results showed reduced activity after
NFIA knockdown. NFIA knockdown significantly affected HCC cell
dynamics, promoting cell proliferation, invasion and migration.
These effects were attenuated by simultaneous CRYAB knockdown,
highlighting the regulatory role of CRYAB in mediating the effects
of NFIA on HCC cell behavior. Results from the present study
suggest the significance of the NFIA and CRYAB interplay in HCC
progression, providing potential therapeutic targets for
intervention.
Acknowledgements
Not applicable.
Funding
Funding: The present study was supported by the Minsheng
Research Project of Pudong New Area Science and Technology
Development Fund (grant no. PKJ2022-Y39), Health Science and
Technology Project of Pudong New Area Health Commission (grant no.
PW2023A-33), Outstanding Clinical Discipline Project of Shanghai
Pudong New Area (grant no. PWYgy2021-09), Famous Doctor of Yunnan
‘Xingdian Talent Support Program’ (grant no. XDYC-MY-2022-0032),
Yunnan Fundamental Research Project (grant no. 202201AS070002),
Yunnan Science and Technology Commission from Yunnan provincial
Science and Technology Department and Kunming Medical University
(grant no. 02401AY070001-105), Kunming University of Science and
Technology & the First People's Hospital of Yunnan Province
Joint Special Project on Medical Research (grant no.
KUST-KH2023022Y).
Availability of data and materials
The data generated in the present study may be
requested from the corresponding author.
Authors' contributions
YJ, PH, JH and HS took part in the conception and
design of the study. YJ, PH took part in the acquisition of data.
JH and WG performed the in vitro assays. YJ, PH, YD and WG
took part in analysis and interpretation of data. YD and WG took
part in statistical analysis. JH and HS took part in the revision
of manuscript for important intellectual content. All authors read
and approved the final version of the manuscript. YJ and HS confirm
the authenticity of all the raw data.
Ethics approval and consent to
participate
Not applicable.
Patient consent for publication
Not applicable.
Competing interests
The authors declare that they have no competing
interests.
References
|
1
|
Qiu S, Cai J, Yang Z, He X, Xing Z, Zu J,
Xie E, Henry L, Chong CR, John EM, et al: Trends in Hepatocellular
Carcinoma Mortality Rates in the US and Projections Through 2040.
JAMA Netw Open. 7(e2445525)2024.PubMed/NCBI View Article : Google Scholar
|
|
2
|
Giri S and Singh A: Epidemiology of
Hepatocellular Carcinoma in India-An Updated Review for 2024. J
Clin Exp Hepatol. 14(101447)2024.PubMed/NCBI View Article : Google Scholar
|
|
3
|
Hahn JW, Woo S, Park J, Lee H, Kim HJ, Ko
JS, Moon JS, Rahmati M, Smith L, Jang J, et al: Global, Regional,
and National Trends in Liver Disease-Related Mortality Across 112
Countries From 1990 to. 2021, With Projections to 2050:
Comprehensive Analysis of the WHO Mortality Database. J Korean Med
Sci. 39(e292)2024.PubMed/NCBI View Article : Google Scholar
|
|
4
|
Sagnelli E, Macera M, Russo A, Coppola N
and Sagnelli C: Epidemiological and etiological variations in
hepatocellular carcinoma. Infection. 48:7–17. 2020.PubMed/NCBI View Article : Google Scholar
|
|
5
|
McGlynn KA, Petrick JL and El-Serag HB:
Epidemiology of hepatocellular carcinoma. Hepatology. 73:4–13.
2021.PubMed/NCBI View Article : Google Scholar
|
|
6
|
Pandyarajan V, Govalan R and Yang JD: Risk
factors and biomarkers for chronic hepatitis B associated
hepatocellular carcinoma. Int J Mol Sci. 22(479)2021.PubMed/NCBI View Article : Google Scholar
|
|
7
|
Li W and Ni CF: Current status of the
combination therapy of transarterial chemoembolization and local
ablation for hepatocellular carcinoma. Abdom Radiol (NY).
44:2268–2275. 2019.PubMed/NCBI View Article : Google Scholar
|
|
8
|
Viveiros P, Riaz A, Lewandowski RJ and
Mahalingam D: Current state of liver-directed therapies and
combinatory approaches with systemic therapy in hepatocellular
carcinoma (HCC). Cancers (Basel). 11(1085)2019.PubMed/NCBI View Article : Google Scholar
|
|
9
|
Nazzal M, Gadani S, Said A, Rice M, Okoye
O, Taha A and Lentine KL: Liver targeted therapies for
hepatocellular carcinoma prior to transplant: Contemporary
management strategies. Glob Surg Feb. 15:2018.PubMed/NCBI View Article : Google Scholar : (Epub ahead of
print).
|
|
10
|
Fuster-Anglada C, Mauro E, Ferrer-Fàbrega
J, Caballol B, Sanduzzi-Zamparelli M, Bruix J, Fuster J, Reig M,
Díaz A and Forner A: Histological predictors of aggressive
recurrence of hepatocellular carcinoma after liver resection. J
Hepatol. 81:995–1004. 2024.PubMed/NCBI View Article : Google Scholar
|
|
11
|
Glavas D, Bao QR, Scarpa M, Ruffolo C,
Brown ZJ, Pawlik TM and Spolverato G: Treatment and prognosis of
fibrolamellar hepatocellular carcinoma: A systematic review of the
recent literature and meta-analysis. J Gastrointest Surg.
27:705–715. 2023.PubMed/NCBI View Article : Google Scholar
|
|
12
|
Xu Y, Zhang X, Zhang R, Sun Y, Liu J, Luo
C, Yang J, Fang W, Guo Q and Wei L: AFP deletion leads to
anti-tumorigenic but pro-metastatic roles in liver cancers with
concomitant CTNNB1 mutations. Cancer Lett.
566(216240)2023.PubMed/NCBI View Article : Google Scholar
|
|
13
|
Zheng Y, Zhu M and Li M: Effects of
alpha-fetoprotein on the occurrence and progression of
hepatocellular carcinoma. J Cancer Res Clin Oncol. 146:2439–2446.
2020.PubMed/NCBI View Article : Google Scholar
|
|
14
|
Xu W, Guo Y, Huang Z, Zhao H, Zhou M,
Huang Y, Wen D, Song J, Zhu Z, Sun M, et al: Small heat shock
protein CRYAB inhibits intestinal mucosal inflammatory responses
and protects barrier integrity through suppressing IKKβ activity.
Mucosal Immunol. 12:1291–1303. 2019.PubMed/NCBI View Article : Google Scholar
|
|
15
|
Yin B, Tang S, Xu J, Sun J, Zhang X, Li Y
and Bao E: CRYAB protects cardiomyocytes against heat stress by
preventing caspase-mediated apoptosis and reducing F-actin
aggregation. Cell Stress Chaperones. 24:59–68. 2019.PubMed/NCBI View Article : Google Scholar
|
|
16
|
Huang Z, Mou T, Luo Y, Pu X, Pu J, Wan L,
Gong J, Yang H, Liu Y, Li Z, et al: Inhibition of miR-450b-5p
ameliorates hepatic ischemia/reperfusion injury via targeting
CRYAB. Cell Death Dis. 11(455)2020.PubMed/NCBI View Article : Google Scholar
|
|
17
|
Zhang J, Liu J, Wu J, Li W, Chen Z and
Yang L: Progression of the role of CRYAB in signaling pathways and
cancers. Onco Targets Ther. 12:4129–4139. 2019.PubMed/NCBI View Article : Google Scholar
|
|
18
|
Fane M, Harris L, Smith AG and Piper M:
Nuclear factor one transcription factors as epigenetic regulators
in cancer. Int J Cancer. 140:2634–2641. 2017.PubMed/NCBI View Article : Google Scholar
|
|
19
|
Wu YZ, Chan KYY, Leung KT, Lam HS, Tam YH,
Lee KH, Li K and Ng PC: The miR-223/nuclear factor I-A axis
regulates inflammation and cellular functions in intestinal tissues
with necrotizing enterocolitis. FEBS Open Bio. 11:1907–1920.
2021.PubMed/NCBI View Article : Google Scholar
|
|
20
|
Lee J, Hoxha E and Song HR: A novel
NFIA-NFκB feed-forward loop contributes to glioblastoma cell
survival. Neuro Oncol. 19:524–534. 2017.PubMed/NCBI View Article : Google Scholar
|
|
21
|
Liu C, Duan P, Li B, Huang C, Jing Y and
Yan W: miR-29a activates Hes1 by targeting Nfia in esophageal
carcinoma cell line TE-1. Oncol Lett. 9:96–102. 2015.PubMed/NCBI View Article : Google Scholar
|
|
22
|
Kaczorowski M, Matysiak J, Kielb P,
Malkiewicz B and Halon A: Nuclear Factor IA Is Down-regulated in
Muscle-invasive and High-grade Bladder Cancers. Anticancer Res.
42:493–500. 2022.PubMed/NCBI View Article : Google Scholar
|
|
23
|
Chen M, Wu GB, Xie ZW, Shi DL and Luo M: A
novel diagnostic four-gene signature for hepatocellular carcinoma
based on artificial neural network: Development, validation, and
drug screening. Front Genet. 13(942166)2022.PubMed/NCBI View Article : Google Scholar
|
|
24
|
Jin Y, Dai Y, Qiao O, Hu P and Han J:
miR-1972 inhibits hepatocellular carcinoma proliferation by
targeting GZMH-mediated DNA replication in the cell cycle. J Pharm
Pharmacol: Apr 18, 2024 (Epub ahead of print).
|
|
25
|
Xie Z, Huang J, Li Y, Zhu Q, Huang X, Chen
J, Wei C, Luo S, Yang S and Gao J: Single-cell RNA sequencing
revealed potential targets for immunotherapy studies in
hepatocellular carcinoma. Sci Rep. 13(18799)2023.PubMed/NCBI View Article : Google Scholar
|
|
26
|
Ritchie ME, Phipson B, Wu D, Hu Y, Law CW,
Shi W and Smyth GK: limma powers differential expression
analyses for RNA-sequencing and microarray studies. Nucleic Acids
Res. 43(7)2015.doi: 10.1093/nar/gkv007.
|
|
27
|
Jia A, Xu L and Wang Y: Venn diagrams in
bioinformatics. Brief Bioinform. 22(bbab108)2021.PubMed/NCBI View Article : Google Scholar
|
|
28
|
Yu G, Wang LG, Han Y and He QY:
clusterProfiler: An R package for comparing biological themes among
gene clusters. OMICS. 16:284–287. 2012.PubMed/NCBI View Article : Google Scholar
|
|
29
|
Zhang S, Shi YN, Gu J, He P, Ai QD, Zhou
XD, Wang W and Qin L: Mechanisms of dihydromyricetin against
hepatocellular carcinoma elucidated by network pharmacology
combined with experimental validation. Pharm Biol. 61:1108–1119.
2023.PubMed/NCBI View Article : Google Scholar
|
|
30
|
Wang H, Cheng W, Hu P, Ling T, Hu C, Chen
Y, Zheng Y, Wang J, Zhao T and You Q: Integrative analysis
identifies oxidative stress biomarkers in non-alcoholic fatty liver
disease via machine learning and weighted gene co-expression
network analysis. Front Immunol. 15(1335112)2024.PubMed/NCBI View Article : Google Scholar
|
|
31
|
Jin AL, Zhang CY, Zheng WJ, Xian JR, Yang
WJ, Liu T, Chen W, Li T, Wang BL, Pan BS, et al: CD155/SRC complex
promotes hepatocellular carcinoma progression via inhibiting the
p38 MAPK signalling pathway and correlates with poor prognosis.
Clin Transl Med. 12(e794)2022.PubMed/NCBI View Article : Google Scholar
|
|
32
|
Ballout N, Etievant L and Viallon V: On
the use of cross-validation for the calibration of the adaptive
lasso. Biom J. 65(2200047)2023.PubMed/NCBI View Article : Google Scholar
|
|
33
|
Lee M, Teber ET, Holmes O, Nones K, Patch
AM, Dagg RA, Lau LMS, Lee JH, Napier CE, Arthur JW, et al: Telomere
sequence content can be used to determine ALT activity in tumours.
Nucleic Acids Res. 46:4903–4918. 2018.PubMed/NCBI View Article : Google Scholar
|
|
34
|
Yan C, Niu Y, Ma L, Tian L and Ma J:
System analysis based on the cuproptosis-related genes identifies
LIPT1 as a novel therapy target for liver hepatocellular carcinoma.
J Transl Med. 20(452)2022.PubMed/NCBI View Article : Google Scholar
|
|
35
|
Koch DT, Yu H, Beirith I, Schirren M,
Drefs M, Liu Y, Knoblauch M, Koliogiannis D, Sheng W, De Toni EN,
et al: Tigecycline causes loss of cell viability mediated by
mitochondrial OXPHOS and RAC1 in hepatocellular carcinoma cells. J
Transl Med. 21(876)2023.PubMed/NCBI View Article : Google Scholar
|
|
36
|
Zhao S, Zhang Y, Lu X, Ding H, Han B, Song
X, Miao H, Cui X, Wei S, Liu W, et al: CDC20 regulates the cell
proliferation and radiosensitivity of P53 mutant HCC cells through
the Bcl-2/Bax pathway. Int J Biol Sci. 17:3608–3621.
2021.PubMed/NCBI View Article : Google Scholar
|
|
37
|
Livak KJ and Schmittgen TD: Analysis of
relative gene expression data using real-time quantitative PCR and
the 2(-Delta Delta C(T)) method. Methods. 25:402–408.
2001.PubMed/NCBI View Article : Google Scholar
|
|
38
|
Kong J, Wang X, Wang J and Yu G: Silencing
of RAB42 down-regulated PD-L1 expression to inhibit the immune
escape of hepatocellular carcinoma cells through inhibiting the E2F
signaling pathway. Cell Signal. 108(110692)2023.PubMed/NCBI View Article : Google Scholar
|
|
39
|
Fornes O, Castro-Mondragon JA, Khan A, Van
der Lee R, Zhang X, Richmond PA, Modi BP, Correard S, Gheorghe M,
Baranašić D, et al: JASPAR 2020: Update of the open-access database
of transcription factor binding profiles. Nucleic Acids Res.
48(D1):D87–D92. 2020.PubMed/NCBI View Article : Google Scholar
|
|
40
|
Zhong H, Shi Q, Wen Q, Chen J, Li X, Ruan
R, Zeng S, Dai X, Xiong J, Li L, et al: Pan-cancer analysis reveals
potential of FAM110A as a prognostic and immunological biomarker in
human cancer. Front Immunol. 14(1058627)2023.PubMed/NCBI View Article : Google Scholar
|
|
41
|
Hsiao CY, Chen PD and Huang KW: A
prospective assessment of the diagnostic value of contrast-enhanced
ultrasound, dynamic computed tomography and magnetic resonance
imaging for patients with small liver tumors. J Clin Med.
8(1353)2019.PubMed/NCBI View Article : Google Scholar
|
|
42
|
Park HJ, Jang HY, Kim SY, Lee SJ, Won HJ,
Byun JH, Choi SH, Lee SS, An J and Lim YS: Non-enhanced magnetic
resonance imaging as a surveillance tool for hepatocellular
carcinoma: Comparison with ultrasound. J Hepatol. 72:718–724.
2020.PubMed/NCBI View Article : Google Scholar
|
|
43
|
Kong S, Yue X, Kong S and Ren Y:
Application of contrast-enhanced ultrasound and enhanced CT in
diagnosis of liver cancer and evaluation of radiofrequency
ablation. Oncol Lett. 16:2434–2438. 2018.PubMed/NCBI View Article : Google Scholar
|
|
44
|
Galle PR, Foerster F, Kudo M, Chan SL,
Llovet JM, Qin S, Schelman WR, Chintharlapalli S, Abada PB, Sherman
M and Zhu AX: Biology and significance of alpha-fetoprotein in
hepatocellular carcinoma. Liver Int. 39:2214–2229. 2019.PubMed/NCBI View Article : Google Scholar
|
|
45
|
Yang Y, Yang M, Pang H, Qiu Y, Sun T, Wang
T, Shen S and Wang W: A macrophage differentiation-mediated gene:
DDX20 as a molecular biomarker encompassing the tumor
microenvironment, disease staging, and prognoses in hepatocellular
carcinoma. Oxid Med Cell Longev. 2022(9971776)2022.PubMed/NCBI View Article : Google Scholar
|
|
46
|
Krajnović M, Kožik B, Božović A and
Jovanović-Ćupić S: Multiple roles of the RUNX gene family in
hepatocellular carcinoma and their potential clinical implications.
Cells. 12(2303)2023.PubMed/NCBI View Article : Google Scholar
|
|
47
|
Wang T, Jin H, Hu J, Li X, Ruan H, Xu H,
Wei L, Dong W, Teng F, Gu J, et al: COL4A1 promotes the growth and
metastasis of hepatocellular carcinoma cells by activating FAK-Src
signaling. J Exp Clin Cancer Res. 39(148)2020.PubMed/NCBI View Article : Google Scholar
|
|
48
|
Lin TC: RUNX1 and cancer. Biochim Biophys
Acta Rev Cancer. 1877(188715)2022.PubMed/NCBI View Article : Google Scholar
|
|
49
|
Liu Y, Wu Z, Zhao Y, Zhen M, Wang Y and
Liu Q: Apolipoprotein H-based prognostic risk correlates with liver
lipid metabolism disorder in patients with HBV-related
hepatocellular carcinoma. Heliyon. 10(e31412)2024.PubMed/NCBI View Article : Google Scholar
|
|
50
|
Huang C and Freter C: Lipid metabolism,
apoptosis and cancer therapy. Int J Mol Sci. 16:924–949.
2015.PubMed/NCBI View Article : Google Scholar
|
|
51
|
Lv S, Wang W, Wang H, Zhu Y and Lei C:
PPARγ activation serves as therapeutic strategy against bladder
cancer via inhibiting PI3K-Akt signaling pathway. BMC Cancer.
19(204)2019.PubMed/NCBI View Article : Google Scholar
|
|
52
|
Cai HB, Zhao MY, Li XH, Li YQ, Yu TH, Wang
CZ, Wang LN, Xu WY, Liang B, Cai YP, et al: Single cell sequencing
revealed the mechanism of CRYAB in glioma and its diagnostic and
prognostic value. Front Immunol. 14(1336187)2024.PubMed/NCBI View Article : Google Scholar
|
|
53
|
Dai A, Guo X, Yang X, Li M, Fu Y and Sun
Q: Effects of the CRYAB gene on stem cell-like properties of
colorectal cancer and its mechanism. J Cancer Res Ther.
18:1328–1337. 2022.PubMed/NCBI View Article : Google Scholar
|
|
54
|
Deng J, Chen X, Zhan T, Chen M, Yan X and
Huang X: CRYAB predicts clinical prognosis and is associated with
immunocyte infiltration in colorectal cancer. PeerJ.
9(e12578)2021.PubMed/NCBI View Article : Google Scholar
|
|
55
|
Ruan H, Li Y, Wang X, Sun B, Fang W, Jiang
S and Liang C: CRYAB inhibits migration and invasion of bladder
cancer cells through the PI3K/AKT and ERK pathways. Jpn J Clin
Oncol. 50:254–260. 2020.PubMed/NCBI View Article : Google Scholar
|
|
56
|
Su CH, Liu LC, Hsieh YH, Wang HC, Tsai CW,
Chang WS, Ho CY, Wu CI, Lin CH, Lane HY and Bau DT: Association of
Alpha B-Crystallin (CRYAB) genotypes with breast cancer
susceptibility in Taiwan. Cancer Genomics Proteomics. 8:251–254.
2011.PubMed/NCBI
|
|
57
|
Lu R, Tang P, Zhang D, Lin S, Li H, Feng
X, Sun M and Zhang H: SOX9/NFIA promotes human ovarian cancer
metastasis through the Wnt/β-catenin signaling pathway. Pathol Res
Pract. 248(154602)2023.PubMed/NCBI View Article : Google Scholar
|
|
58
|
Hu Y, Zhang Y, Ding M and Xu R: Lncrna
linc00511 acts as an oncogene in colorectal cancer via sponging
mir-29c-3p to upregulate nfia. Onco Targets Ther. 13:13413–13424.
2021.PubMed/NCBI View Article : Google Scholar
|
|
59
|
Sun C, Li Y, Tan Y, Zhang H, Liang Y, Zeng
J, Yu J and Zou H: A novel role for NFIA in restoring
radiosensitivity in radioresistant NSCLC cells by downregulating
the AKT and ERK pathways. Biochem Biophys Res Commun. 515:558–564.
2019.PubMed/NCBI View Article : Google Scholar
|
|
60
|
Zhu Z, Luo L, Xiang Q, Wang J, Liu Y, Deng
Y and Zhao Z: MiRNA-671-5p Promotes prostate cancer development and
metastasis by targeting NFIA/CRYAB axis. Cell Death Dis.
11(949)2020.PubMed/NCBI View Article : Google Scholar
|
|
61
|
Shi C, Yang X, Bu X, Hou N and Chen P:
Alpha B-crystallin promotes the invasion and metastasis of
colorectal cancer via epithelial-mesenchymal transition. Biochem
Biophys Res Commun. 489:369–374. 2017.PubMed/NCBI View Article : Google Scholar
|