Introduction
Gliomas are among the most common and aggressive
primary brain tumors, with glioblastoma (GBM) being the most
malignant subtype (1). Despite
advancements in surgical and therapeutic interventions, GBM
prognosis remains poor, with a median survival of ~15 months
(2). Low-grade gliomas (LGGs)
progress more slowly but often transforme into higher-grade tumors.
The heterogeneity and molecular complexity of gliomas pose
significant challenges to effective treatment and prognosis
(3,4).
Aging is a well-recognized risk factor for numerous
cancers, including gliomas. Aging induces cellular and molecular
changes that create a favorable environment for tumor development
and progression (5). One of the
most critical changes is genomic instability, accompanied by
significant epigenetic alterations, such as aberrant DNA
methylation and histone modifications, which dysregulate gene
expression and promote malignancy (6,7).
The tumor microenvironment (TME) also undergoes
remodeling with aging, involving changes in the extracellular
matrix (ECM), blood vessels and immune cell infiltration, which
collectively enhance tumor growth and metastasis (8). In gliomas, these aging-related
changes are particularly relevant. Dysregulation of pathways such
as the p53 tumor suppressor and PI3K/AKT/mTOR, crucial for cell
cycle regulation and survival, is common in gliomas and is
exacerbated by aging (9).
Moreover, mutations in IDH1 and IDH2, more prevalent in younger
patients and associated with improved outcomes, highlight the
complex interplay between aging and glioma biology (3,10).
The specific role of aging-related genes in glioma
prognosis and their utility in prognostic models remain
underexplored. In the present study, an aging-related risk score
model that effectively predicts glioma patient prognosis,
immunotherapy efficacy, and chemotherapy sensitivity, was
developed. However, as the current findings are based on
bioinformatics analysis, further experimental validation is
required to confirm the model's clinical relevance.
Materials and methods
The present study utilized data from The Cancer
Genome Atlas (TCGA) (TCGA-GBM and TCGA-LGG; https://portal.gdc.cancer.gov/) and the Chinese Glioma
Genome Atlas (CGGA) (CGGA-mRNAseq_693; http://www.cgga.org.cn/) to analyze gene expression
differences between LGGs and GBM. Gene expression profiles and
corresponding clinical information were downloaded from these
databases. The data acquisition and preprocessing steps are as
follows:
Data acquisition and
preprocessing
Glioma RNA sequencing and clinical data were
obtained from the TCGA website (https://portal.gdc.cancer.gov). Glioma expression data
and clinical information were downloaded from the CGGA website
(http://www.cgga.org.cn/). Samples with missing or
incomplete clinical information were excluded. The gene expression
data were normalized and background-corrected via the ‘limma’ (v
3.58.1) package in R.
Differential gene expression
analysis
To identify genes differentially expressed between
LGG and GBM, TCGA and CGGA expression data were normalized and
log2-transformed using the ‘limma’ package in R. |LogFC|>1 was
selected and P<0.05 was adjusted to capture biologically
meaningful differences while minimizing false positives, consistent
with widely accepted thresholds in transcriptome studies.
Senescence-related gene screening
A total of 279 senescence-related genes were
downloaded from the Human Aging Genomic Resources (HAGR) database
and used Venn diagrams to identify the overlap between these
senescence-related genes and the differentially expressed genes
(DEGs) from the TCGA and CGGA datasets.
Risk score model construction and
validation
From the DEGs, 29 senescence-related genes were
selected to construct a risk score model. Univariate Cox regression
analysis (P<0.001) identified significant genes, followed by
LASSO regression to narrow the selection to 12 genes. Multivariate
Cox regression finalized 8 genes for the model. The risk score
formula was defined as: risk score=Σ (gene expression x gene
coefficient), stratifying patients into high-risk and low-risk
groups.
The model's performance was assessed using
Kaplan-Meier (K-M) survival and receiver operating characteristic
(ROC) curve analyses in TCGA and CGGA datasets. R packages
‘survival’ (v3.2.1) and ‘survminer’ (v3.3.3) were utilized, with
P<0.05 considered significant. Area Under Curve (AUC) values
>0.9 indicated excellent performance, >0.8 favorable
performance, and >0.7 useful discrimination.
Construction and validation of the
nomogram
Univariate and multivariate Cox regression analyses
were performed to identify potential prognostic factors for overall
survival (OS) in patients with glioma. A nomogram was constructed
to predict the 1-, 3-, and 5-year OS probabilities. Calibration
plots and ROC curves were used to evaluate the nomogram's
performance. All analyses were performed via the ‘survival
(v3.2.1)’, ‘ggplot2 (v3.3.3)’, and ‘rms (v6.2.0)’ R packages, with
P<0.05 considered significant.
Functional enrichment analysis and
gene set variation analysis (GSVA)
Using the STRING database (https://string-db.org/) (score ≥0.4, max 50
interactors), 110 genes interacting with the 8 senescence risk
score genes were identified. Gene Ontology (GO) and Kyoto
Encyclopedia of Genes and Genomes (KEGG) enrichment analyses were
performed using the ‘ggplot2’ (v 3.5.2) and ‘clusterProfiler’ (v
4.10.1) R packages.
GSVA, an unsupervised method, evaluated gene set
enrichment based on mRNA expression data. Gene sets from the
Molecular Signatures Database (v7.0) (https://www.gsea-msigdb.org/gsea/msigdb) were used to
assess functional differences between high- and low-risk groups.
Heatmaps were visualized with the ‘ComplexHeatmap’ R package.
Immune microenvironment
assessment
The CIBERSORT algorithm estimated differences in
immune cell infiltration between high- and low-risk groups, while
the ESTIMATE method assessed relationships between the risk score,
stromal score, immune score, ESTIMATE score, and tumor purity.
CIBERSORT results were analyzed using weighted gene co-expression
network analysis (WGCNA). The ‘pickSoftThreshold’ function
calculated soft threshold power, and the adjacency matrix was
converted into a topological overlap matrix for hierarchical
clustering. Co-expressed gene modules were identified using dynamic
tree-cutting, and key module genes underwent GO and KEGG enrichment
analyses.
Drug sensitivity analysis
Drug sensitivity in high- and low-risk groups was
assessed using data from the Genomics of Drug Sensitivity in Cancer
(www.cancerrxgene.org) database, combined
with gene expression data. Pearson correlation analysis evaluated
the relationship between gene expression and drug response.
scRNA-seq data processing and
analysis
Raw 10X scRNA-seq data from GSE162631(11) were downloaded from Gene Expression
Omnibus (https://www.ncbi.nlm.nih.gov/geo/) and processed as
follows: i) data were converted into a Seurat object using the
‘Seurat’ R package (12,13); ii) quality control was performed by
excluding cells with <200 or >5,000 detected genes and those
with >15% mitochondrial content; iii) the ‘FindVariableFeatures’
function identified the top 2,000 highly variable genes; iv)
principal component analysis (PCA) and UMAP were applied for
dimensionality reduction and clustering (14); v) the ‘FindMarkers’ function
identified marker genes for each cluster (fold change >1); vi)
clusters were annotated using the ‘SingleR’ package to define cell
types (15); and vii) M1
macrophages were identified via markers NOS2 and CD80, while M2
macrophages were marked by CD163, MRC1, IL10, IL6 and ARG1. DEGs
between M1 and M2 macrophages were identified using the
‘FindMarkers’ function.
Cell lines and reverse
transcription-quantitative (RT-qPCR)
Human astrocytes (HA; cat. no. 1800; ScienCell
Research Laboratories), U251 GBM cells (CVCL_0021; Cell Bank of the
Chinese Academy of Sciences), and U87 MG GBM of unknown origin
(CVCL_0022; American Type Culture Collection) were cultured
following the suppliers' protocols. Cell line authentication was
not additionally performed in the present study, which represents a
limitation.
Total RNA was extracted using TRIzol™ Reagent
(Invitrogen; Thermo Fisher Scientific, Inc.). Reverse transcription
was performed with the PrimeScript™ RT Reagent Kit (Takara Bio,
Inc.) according to the manufacturer's instructions. qPCR was
performed using PowerUp™ SYBR™ Green Master Mix (Applied
Biosystems; Thermo Fisher Scientific, Inc.) on an ABI 7500
Real-Time PCR System (Applied Biosystems; Thermo Fisher Scientific,
Inc.). The thermal cycling program consisted of an initial
denaturation at 95˚C for 2 min, followed by 40 cycles of 95˚C for
15 s and 60˚C for 1 min, with a final melt-curve stage to verify
amplification specificity. Primer sequences are provided in
Table SII. GAPDH was used as the
internal control, and relative expression levels were calculated
using the 2-ΔΔCq method (16).
Statistical analysis
All the statistical analyses were conducted via R
software (version 4.0.5; https://www.r-project.org/). P<0.05 was considered
to indicate a statistically significant difference.
Results
Screening of DEGs and model
construction
In the TCGA dataset, 12,178 DEGs were identified
(7,604 upregulated, 4,574 downregulated) (|LogFC|>1, adjusted
P<0.05) (Fig. 1A), while 1,890
DEGs were identified in the CGGA dataset (930 upregulated, 960
downregulated) (Fig. 1B). A total
of 279 senescence-related genes were obtained from the HAGR. By
intersecting DEGs from TCGA and CGGA with these genes, 29
overlapping genes were identified (Fig. 1C).
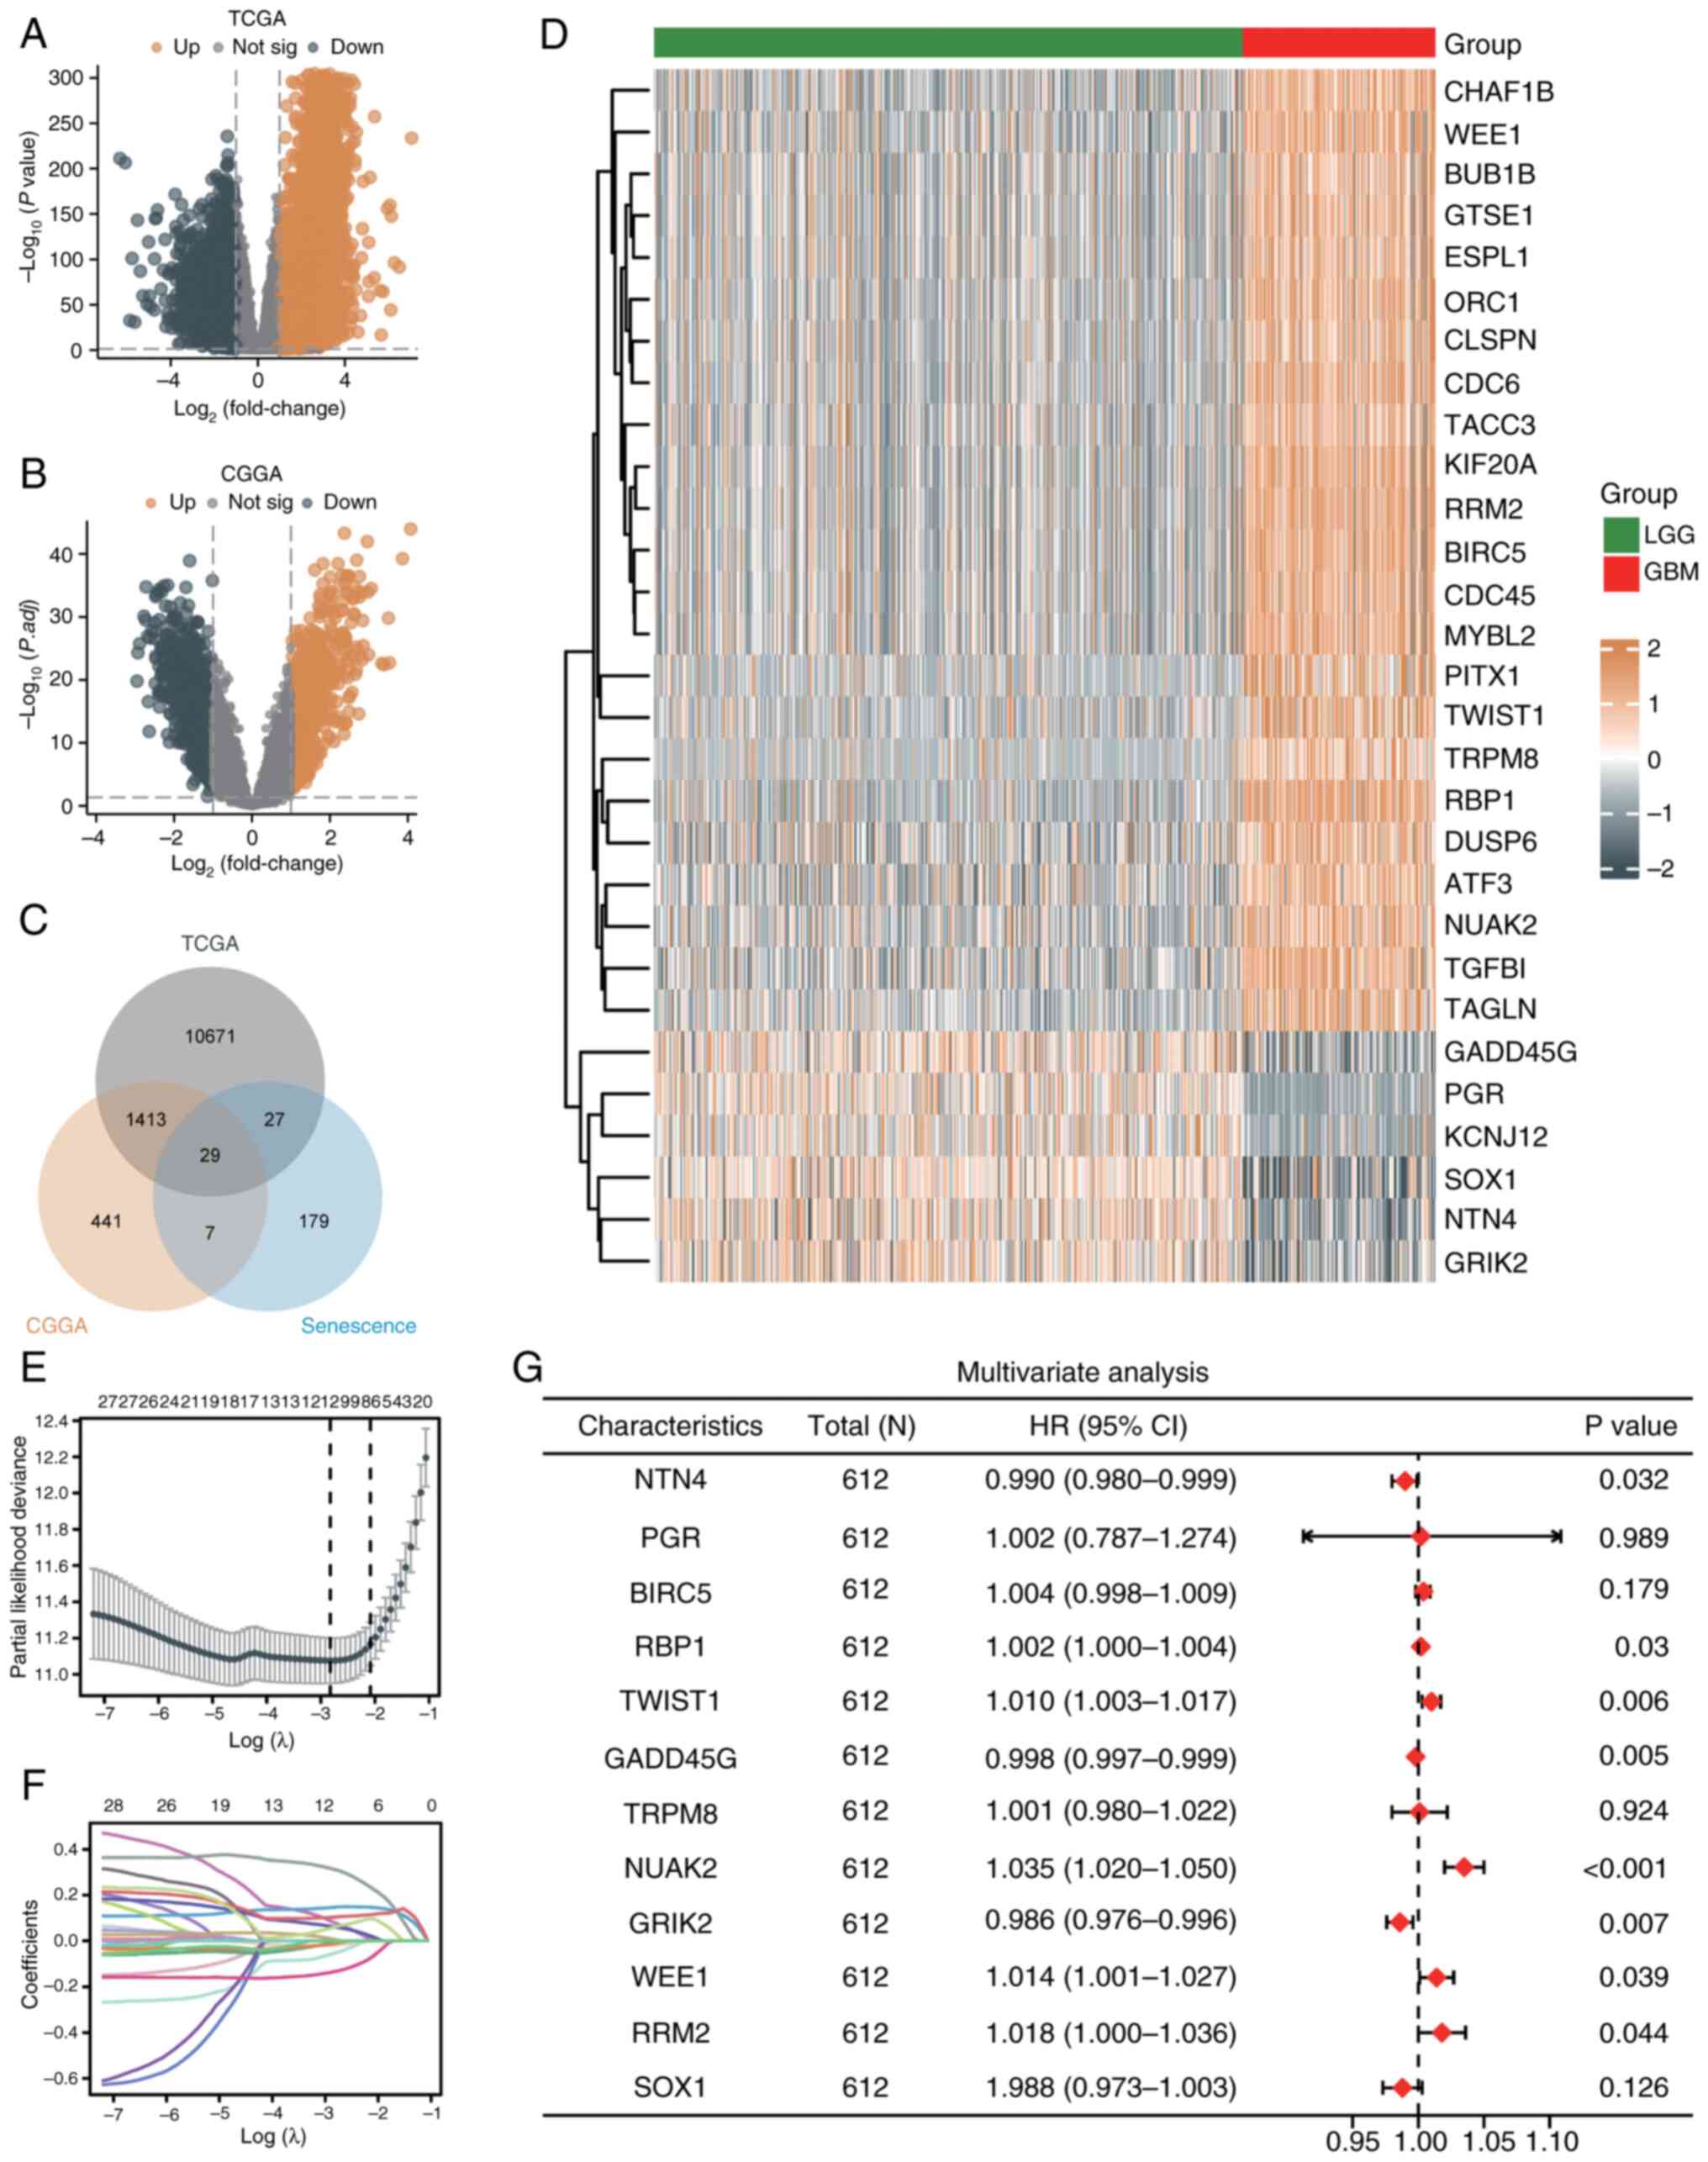 | Figure 1Screening of DEGs and model
construction. (A) Volcano plot of significantly upregulated (red)
and downregulated (blue) genes in the TCGA dataset (|LogFC|>1,
adjusted P<0.05). (B) Volcano plot of DEGs in the CGGA dataset
(|LogFC|>1, adjusted P<0.05). (C) Venn diagram showing 29
shared senescence-related genes from TCGA and CGGA datasets. (D)
Heatmap of hierarchical clustering of 29 genes, separating LGG and
GBM samples. (E) Partial likelihood deviance plot from LASSO
regression identifying 12 genes at the optimal lambda. (F)
Coefficient profiles of 12 genes across lambda values in LASSO
analysis. (G) Forest plot from multivariate Cox regression of 8
genes significantly associated with prognosis, displaying HRs and
P-values. DEGs, differentially expressed genes; TCGA, The Cancer
Genome Atlas; CGGA, Chinese Glioma Genome Atlas; LGG, low-grade
glioma; GBM, glioblastoma; HR, hazard ratio; CI, confidence
interval. |
To evaluate the prognostic potential of these genes,
univariate Cox regression was used (Table SI). Hierarchical clustering
separated samples into GBM-dominated (23 upregulated genes) and
LGG-dominated (6 downregulated genes) groups (Fig. 1D). Using LASSO regression, 12 genes
were selected by minimizing partial likelihood deviance (Fig. 1E), with the coefficient paths shown
in Fig. 1F. Multivariate Cox
regression further identified 8 of these genes as independently
prognostic (Fig. 1G). Based on
these 8 genes, a risk score model was constructed.
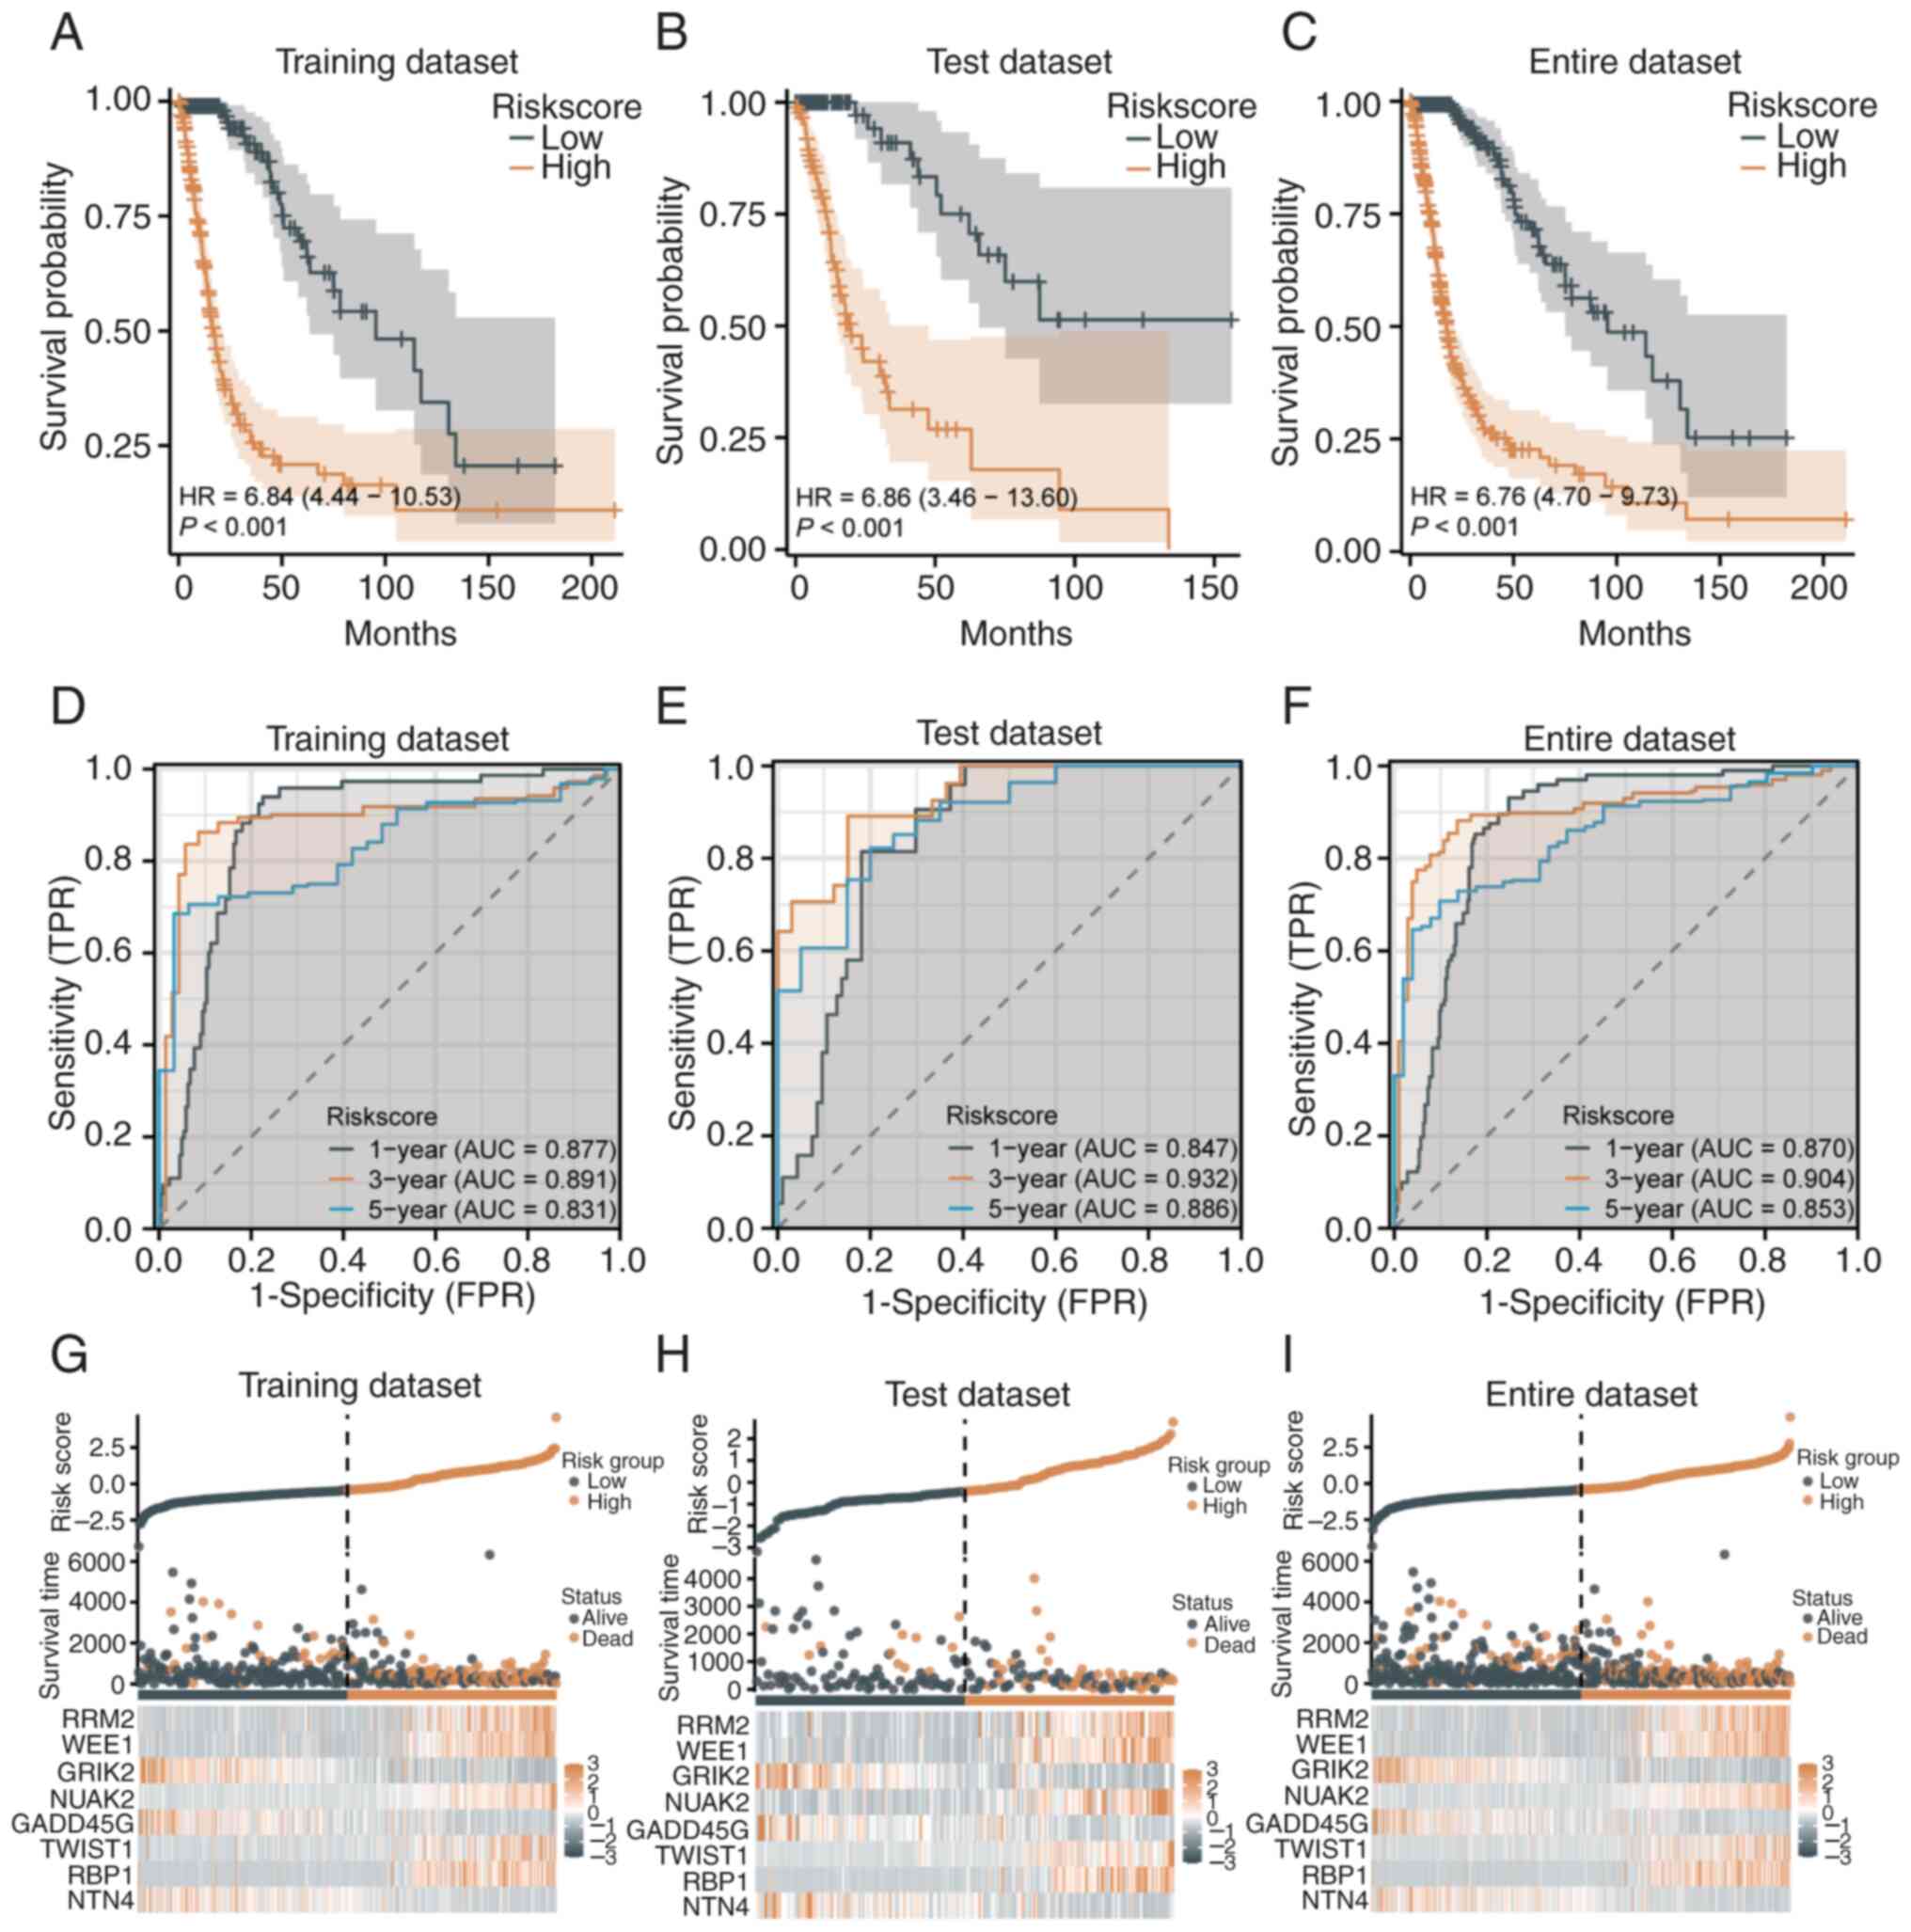
Evaluation of the prognostic
predictive ability of the risk score model
The prognostic predictive ability of the 8-gene risk
score model was further evaluated in the TCGA dataset. K-M analysis
demonstrated that high-risk patients had significantly lower
survival rates compared with low-risk patients in the training set
(HR=6.84, 95% CI=4.44-10.53, P<0.001; median survival: 16.6 vs.
95.5 months; Fig. 2A), test set
(HR=6.86, 95% CI=3.46-13.60, P<0.001; 11.9 vs. 50.5 months,
Fig. 2B), and the entire dataset
(HR=6.676, 95% CI=4.70-9.73, P<0.001; 17.7 vs. 95.5 months,
Fig. 2C). ROC curves confirmed
strong model performance, with AUC values of 0.877, 0.891 and 0.831
for 1-, 3- and 5-year predictions in the training set (Fig. 2D), 0.847, 0.932 and 0.886 in the
test set (Fig. 2E), and 0.870,
0.904 and 0.853 in the entire dataset (Fig. 2F). These results indicated high
sensitivity and specificity in predicting patient survival at
various time points. Risk score distribution and survival analysis
revealed clear stratification between high- and low-risk groups.
High-risk patients, primarily distributed on the right side, showed
shorter survival times and higher mortality in the training
(Fig. 2G) and test sets (Fig. 2H). Similar trends in the entire
dataset validated the model's generalizability and effectiveness
(Fig. 2I).
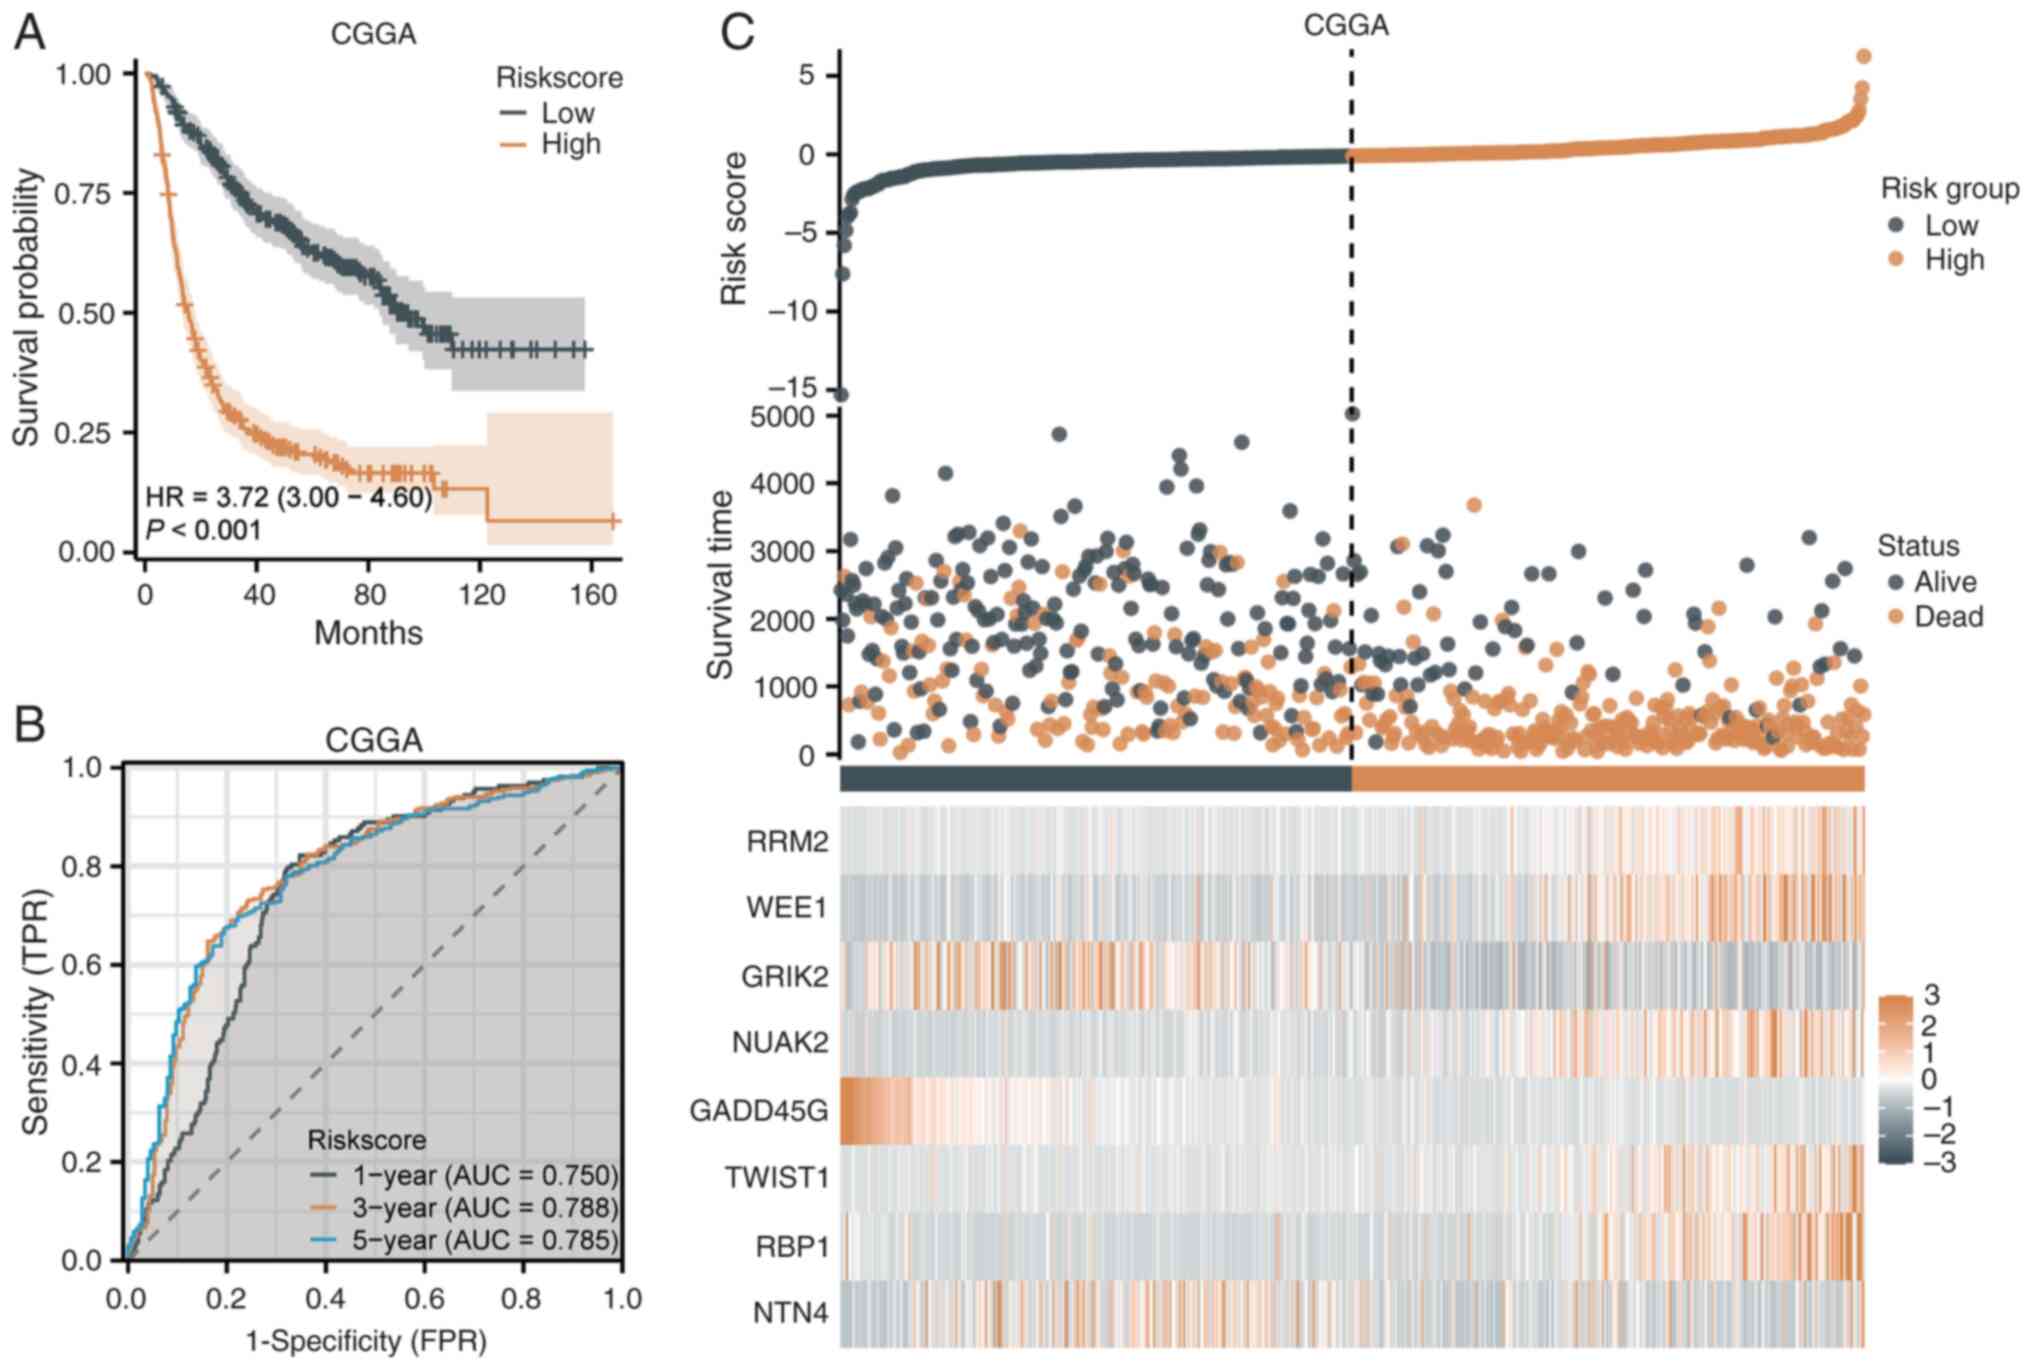
Validation of the risk score model in
the CGGA dataset
The prognostic performance of the senescence-related
risk score model was validated in the CGGA dataset. K-M analysis
showed significantly lower survival rates in the high-risk group
compared with the low-risk group (HR=3.72, 95% CI=3.00-4.60,
P<0.001; 15.6 vs. 94.4 months) (Fig. 3A). The median survival time was
notably shorter in the high-risk group, confirming the model's
effectiveness. ROC analysis demonstrated AUC values of 0.750, 0.788
and 0.785 for 1-, 3- and 5-year prognoses, respectively, indicating
favorable sensitivity and specificity (Fig. 3B). The risk score distribution
revealed a clear survival time distinction, with early-stage deaths
more frequent in the high-risk group, while the low-risk group
showed longer survival (Fig. 3C).
A heatmap highlighted differential expression of the 8 key genes,
with ribonucleotide reductase regulatory subunit (RRM2) and WEE1
upregulated in the high-risk group and glutamate ionotropic
receptor kainate type subunit 2 (GRIK2) and growth arrest and DNA
damage inducible gamma (GADD45G) downregulated (Fig. 3C).
Prognostic ability of the risk score
model in different clinical and molecular subgroups
The prognostic predictive ability of the
senescence-related risk score model was assessed across clinical
and molecular subgroups (Fig.
4A-R).
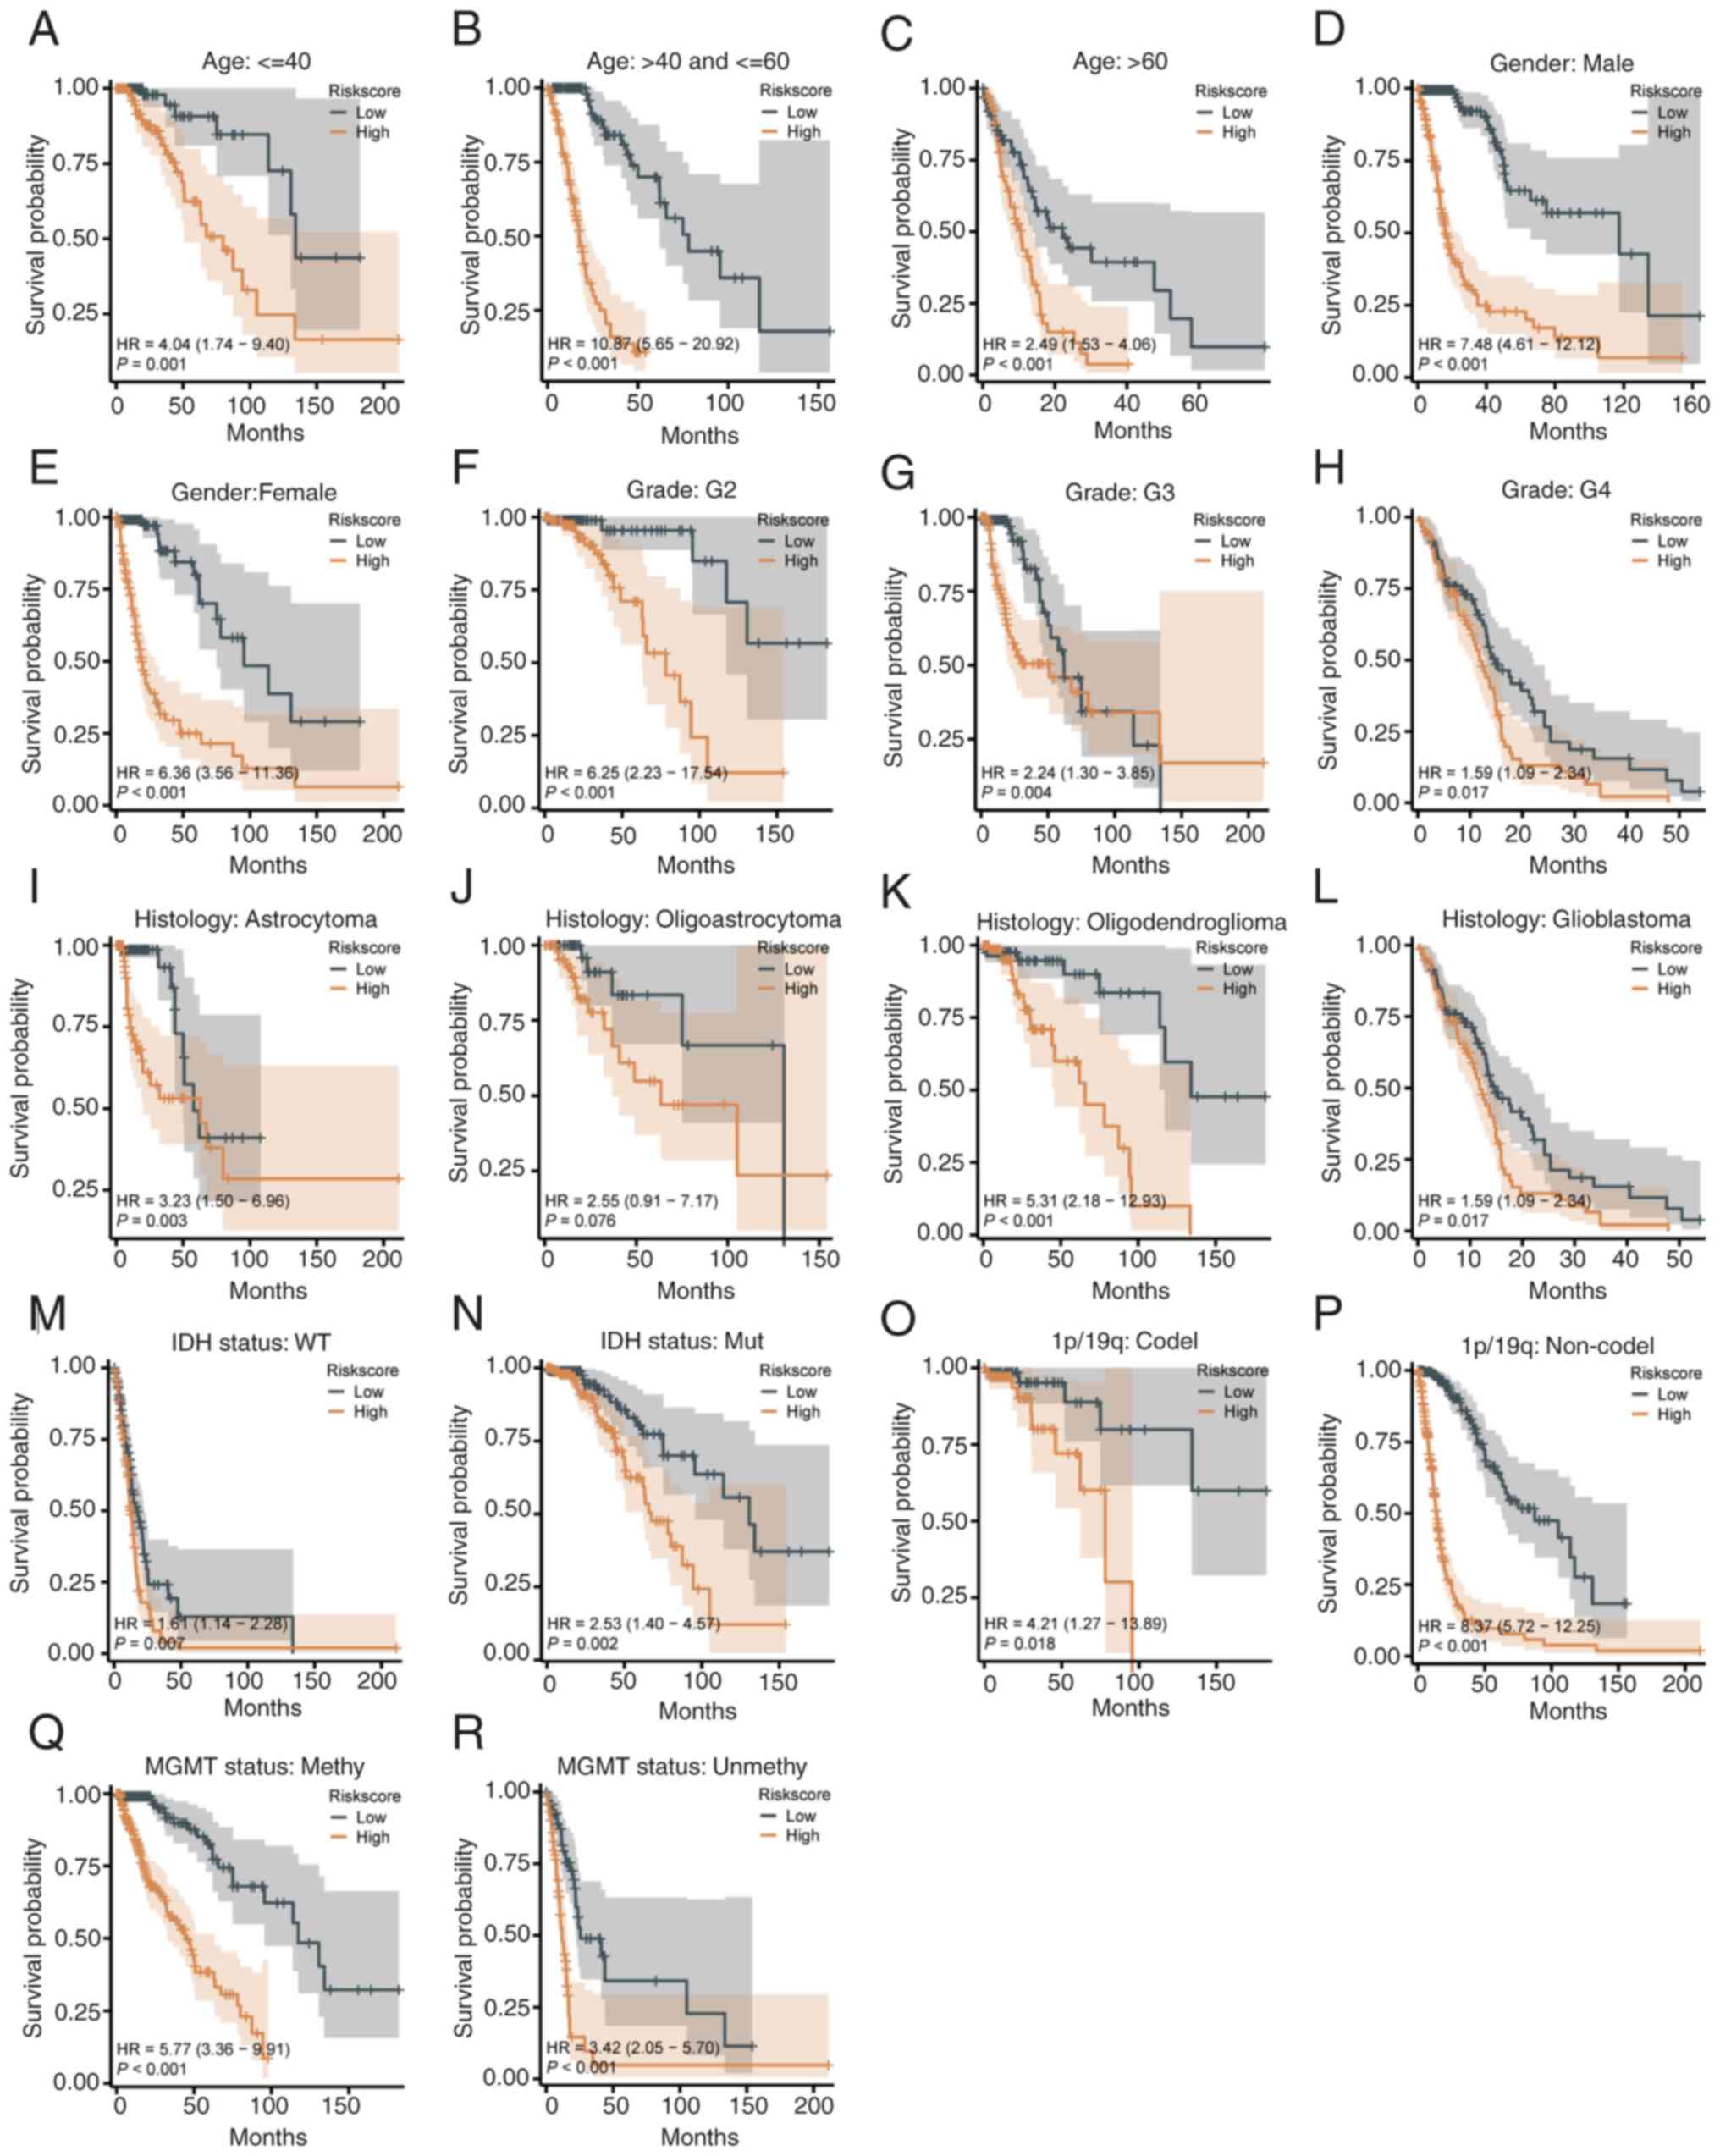 | Figure 4Prognostic ability of the risk score
model in clinical and molecular subgroups. (A-C) Kaplan-Meier
curves for age groups under 40 years (A), 40-60 years (B), and over
60 years (C), showing worse survival in high-risk patients. (D and
E) Survival stratification by sex, with high-risk groups having
worse outcomes for both males and females. (F-H) Stratification by
tumor grade (G2-G4), where high-risk patients consistently had
shorter survival. (I-L) Stratification by histological type,
showing significant differences for astrocytoma (I),
oligoastrocytoma (K) and glioblastoma (L), but not for
oligodendroglioma (J). (M and N) (M and N) Kaplan-Meier curves for
IDH wild-type (M) and IDH-mutant (N) patients, revealing worse
survival in the high-risk group. (O and P) Stratification by 1p/19q
status, with significant differences in patients with (O) and
without (P) codeletion. (Q and R) Stratification by the MGMT
methylation status, with worse survival in the high-risk group for
both methylated (Q) and unmethylated (R) patients. |
Age stratification. The model demonstrated
strong discriminatory power across all age groups. Low-risk
patients had significantly improved survival compared with
high-risk patients, with HR values of 4.04 (95% CI=1.74-9.40,
P<0.001) for all ages (Fig.
4A), 10.19 (95% CI=5.65-20.92, P<0.001) for ages 40-60
(Fig. 4B), and 2.41 (95%
CI=1.23-4.70, P=0.010) for patients over 60 (Fig. 4C). Regarding sex stratification,
both male and female low-risk patients exhibited significantly
improved survival than high-risk patients (P<0.001, Fig. 4D and E).
Tumor grade stratification. High-risk
patients had consistently shorter survival across tumor grades G2
to G4 (Fig. 4F-H).
Histological type stratification. Low-risk
patients with astrocytoma, oligoastrocytoma and GBM had improved
survival compared with high-risk patients (Fig. 4I, K and L).
For oligodendroglioma, the model showed limited discriminatory
ability, with a non-significant difference (HR=2.55, 95%
CI=0.91-7.17, P=0.076; Fig.
4J).
Molecular characteristic stratification. IDH
status: High-risk patients had worse survival in both IDH wild-type
(HR=6.77, 95% CI=3.35-13.67, P<0.001, Fig. 4M) and IDH-mutant groups (HR=2.53,
95% CI=1.40-4.56, P=0.002, Fig.
4N).
1p/19q status. Low-risk patients with 1p/19q
codeletion showed improved survival (HR=4.21, 95% CI=1.27-13.89,
P=0.018, Fig. 4O), while high-risk
patients without codeletion had significantly poorer outcomes
(HR=3.62; 95% CI=1.52-7.25; P<0.001; Fig. 4P).
MGMT methylation status. Low-risk patients
with MGMT methylation had improved survival (HR=5.77, 95%
CI=3.36-9.91, P<0.001; Fig.
4Q), with significant differences also observed in unmethylated
patients (HR=4.32, 95% CI=2.05-9.10, P<0.001; Fig. 4R).
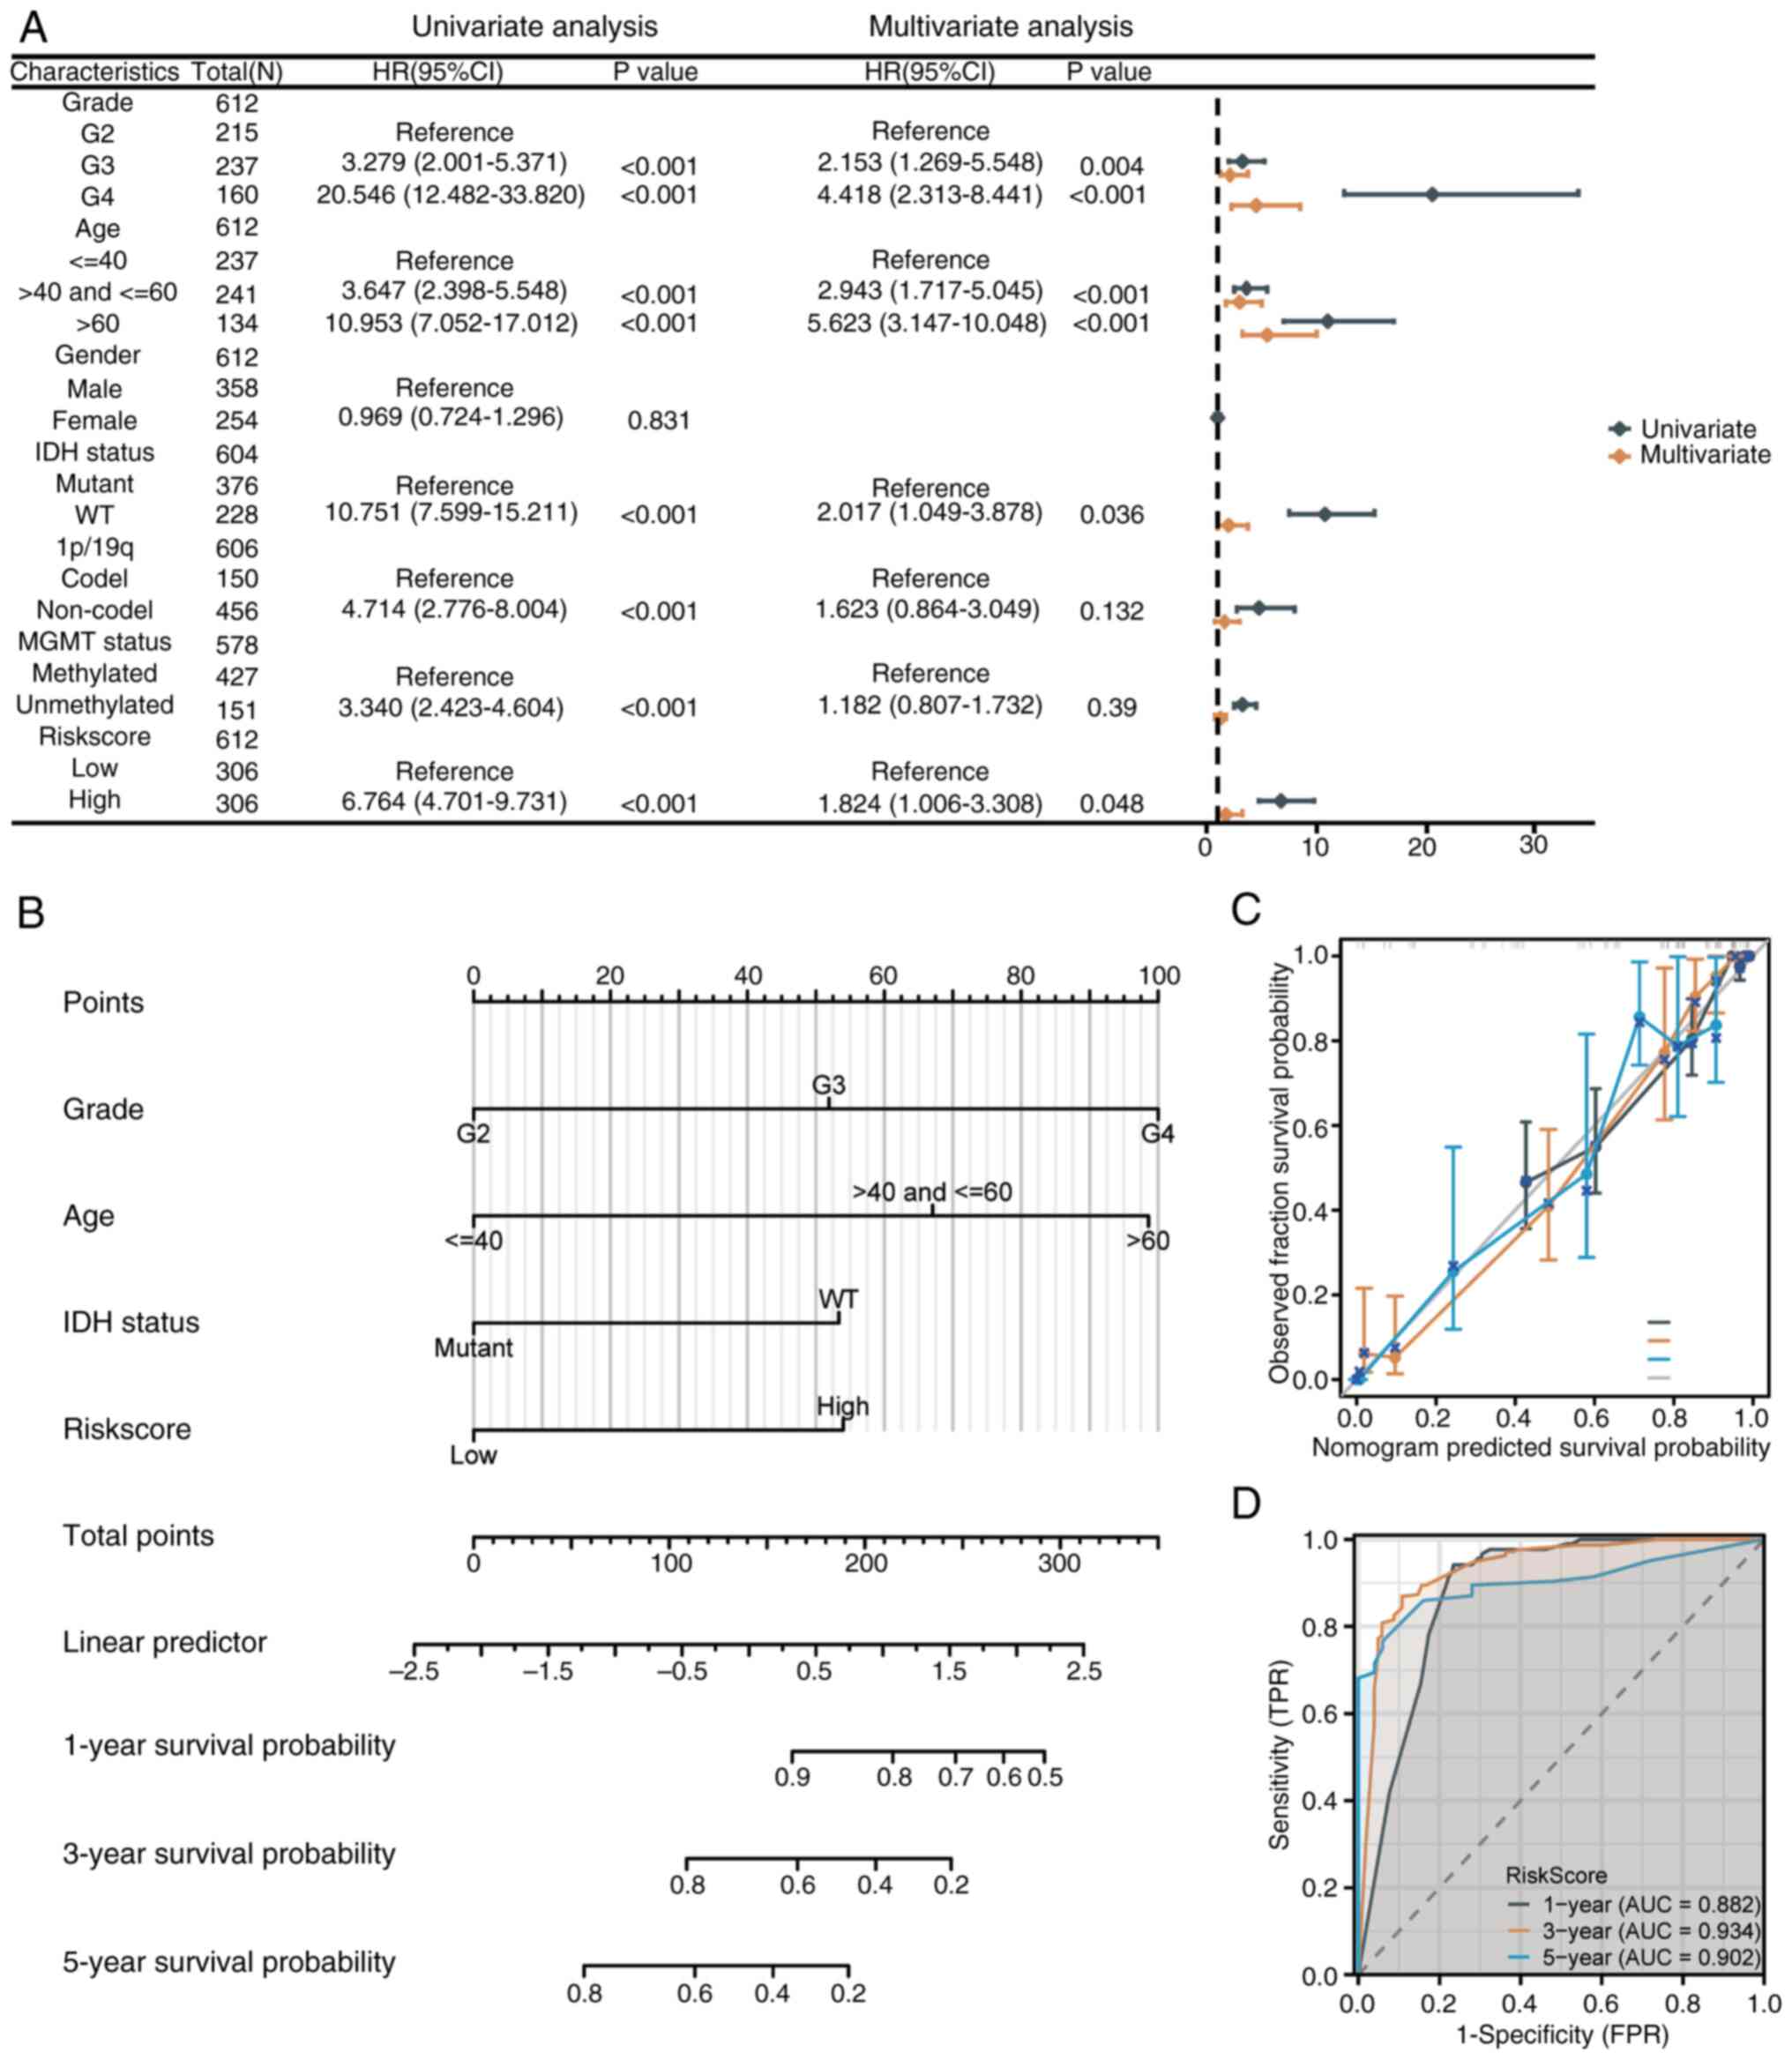
Construction and evaluation of the
nomogram
Univariate and multivariate Cox regression analyses
were performed, incorporating the senescence-related risk score and
clinicopathological factors (Fig.
5A). Multivariate analysis identified tumor grade, age, IDH
status and risk score as independent prognostic factors. G3
(HR=2.153, P=0.004) and G4 (HR=4.418, P<0.001) grades, along
with ages 40-60 (HR=2.943, P<0.001) and over 60 (HR=5.623,
P<0.001), were associated with poorer survival. IDH wild-type
(HR=2.017, P=0.036) and high-risk scores (HR=1.824, P=0.048) also
indicated increased mortality. A prognostic nomogram was developed
to predict 1-, 3-, and 5-year survival probabilities (Fig. 5B). G4 grade and age over 60
contributed the highest points, with total scores mapped to
survival probabilities. The nomogram was validated using the
C-index (0.853, P<2x10-16), calibration plots and ROC
curves. Calibration plots closely matched the diagonal line
(Fig. 5C). ROC curves showed AUCs
of 0.882, 0.934 and 0.902 for 1-, 3- and 5-year predictions,
confirming excellent accuracy (Fig.
5D).
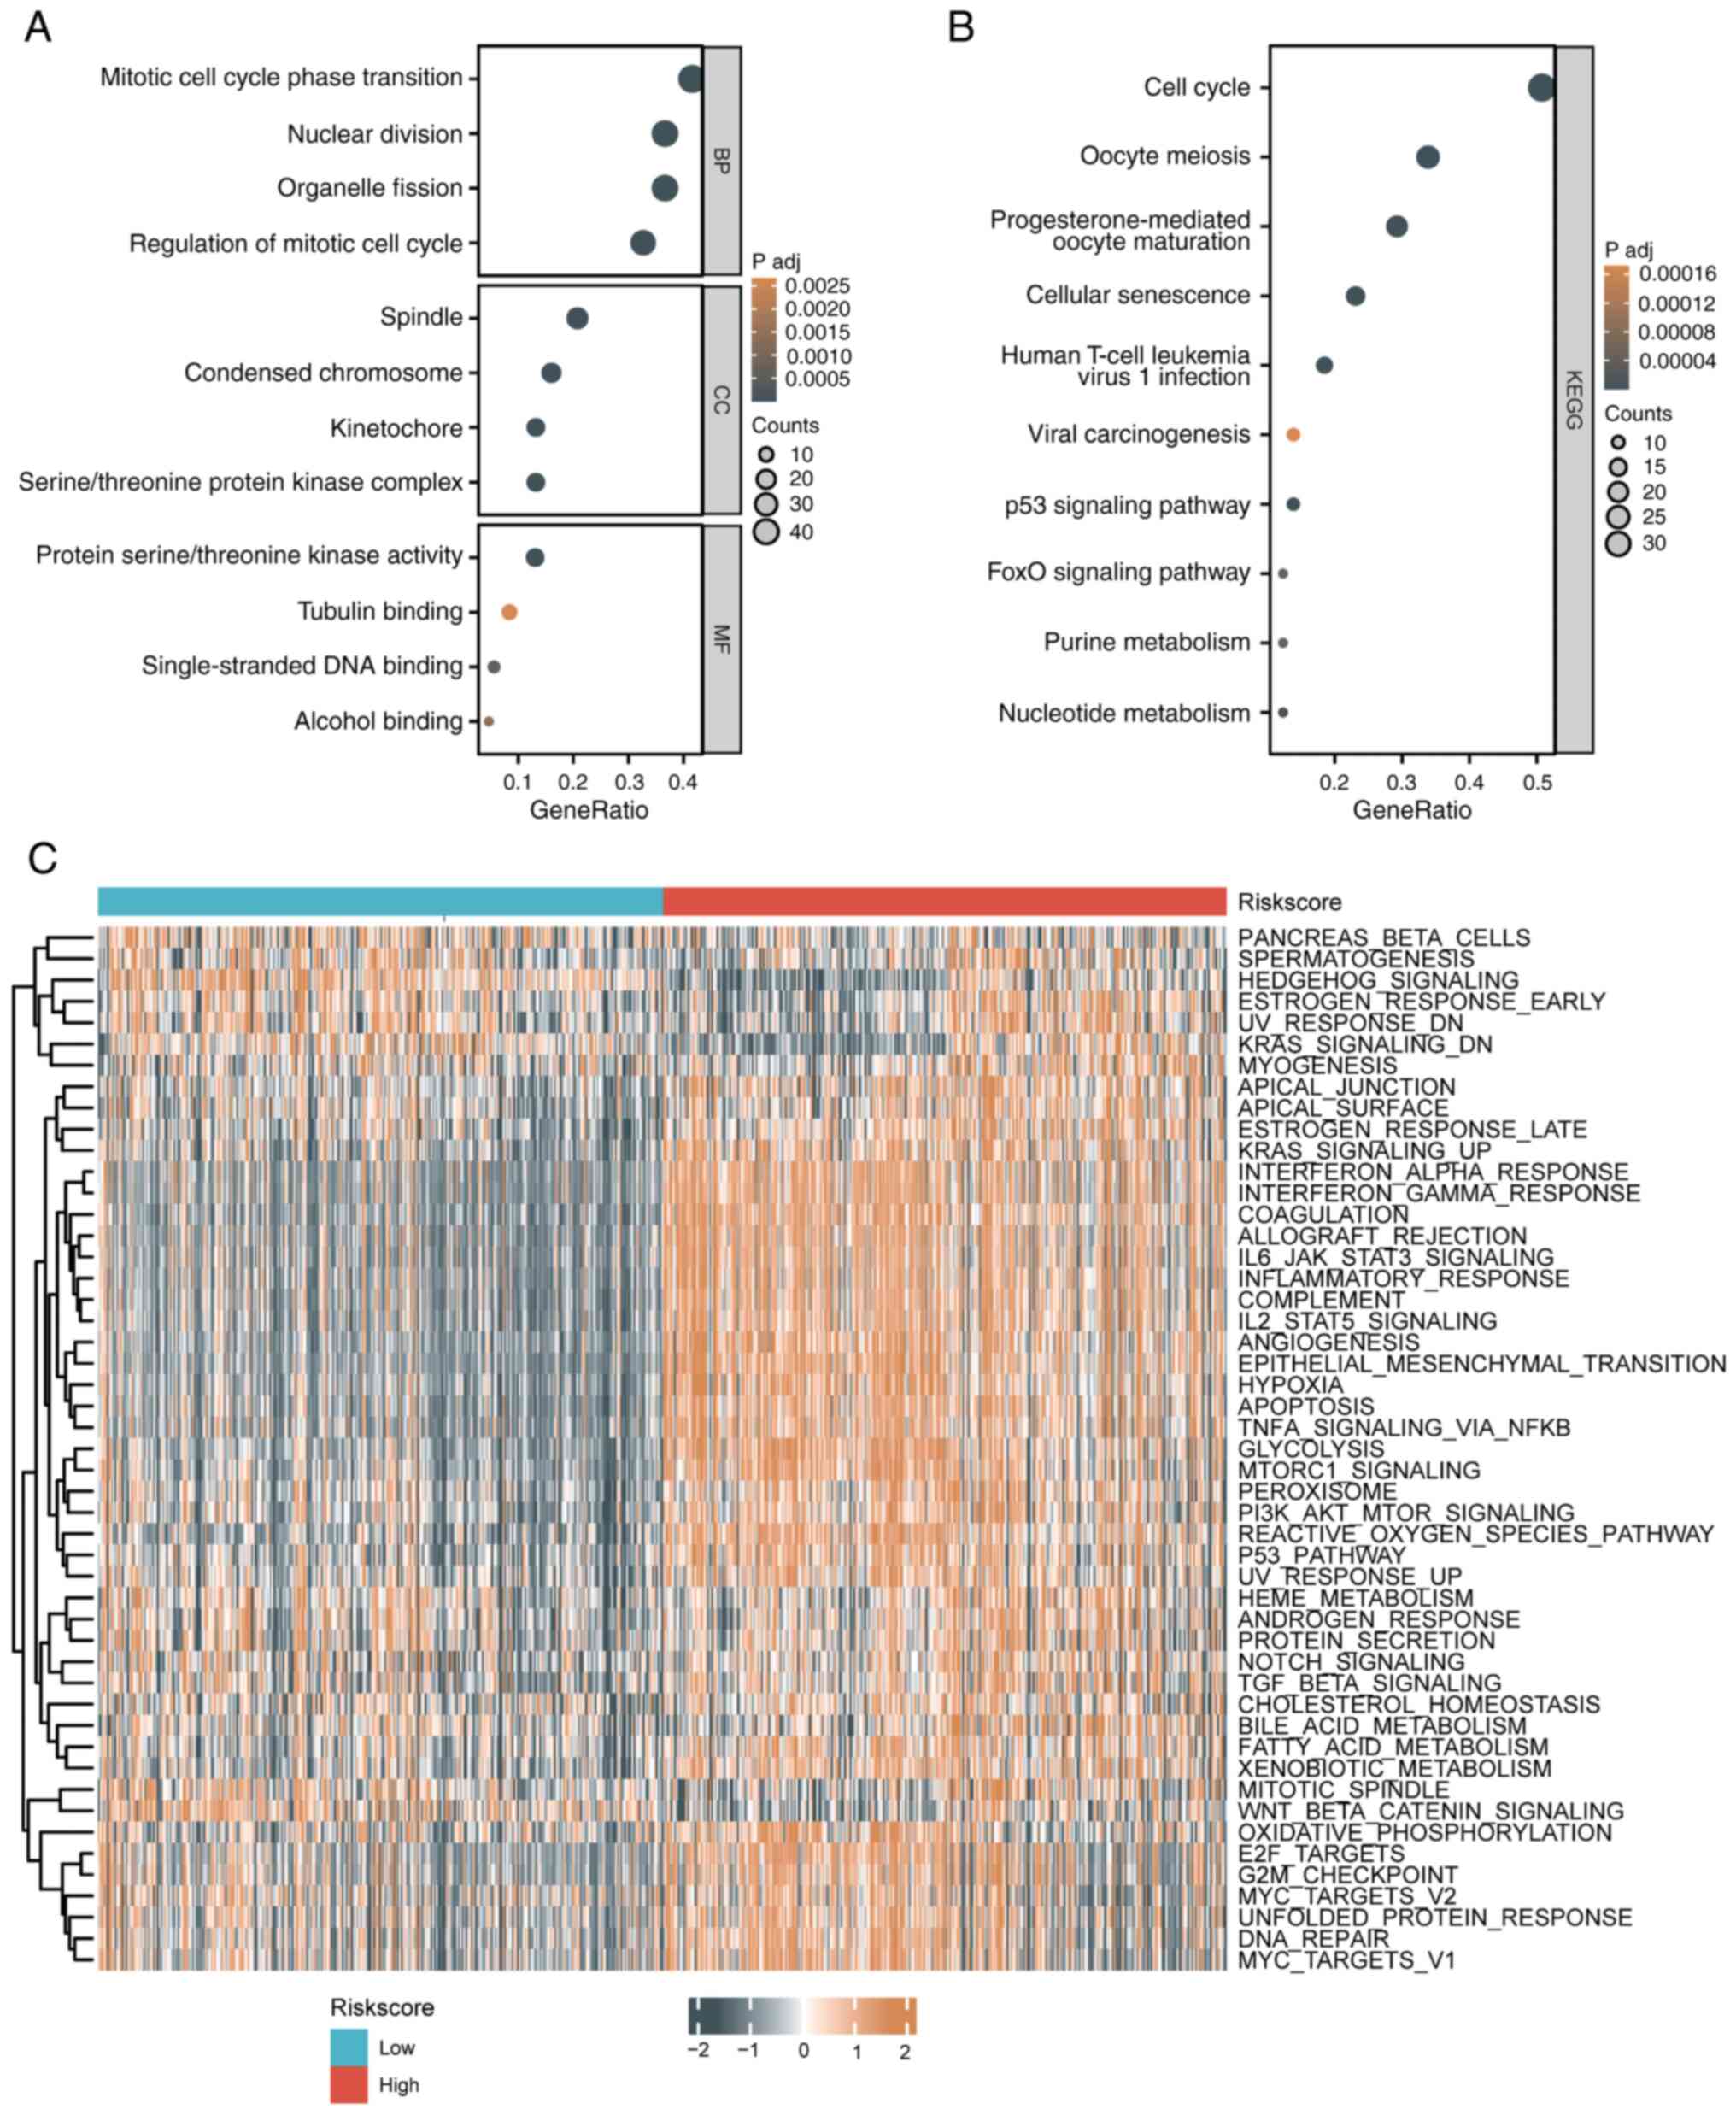
Biological function differences
between patients with high-risk and low-risk glioma
Using the STRING database, 110 genes interacting
with the 8 senescence-related risk score genes were identified
(threshold: score ≥0.4, interactors ≤50). GO analysis revealed
enrichment in processes like mitotic cell cycle transition, nuclear
division, spindle assembly and DNA binding, while KEGG analysis
highlighted pathways such as the cell cycle, senescence, p53
signaling and FoxO signaling (Fig.
6A and B). GSVA showed that
high-risk groups had upregulated pathways, including KRAS
signaling, MYC targets, G2M checkpoint, and glycolysis, whereas
low-risk groups exhibited upregulation in pathways like oxidative
phosphorylation, DNA repair and apical junctions, reflecting
differences in cell cycle, metabolism and immune responses
(Fig. 6C).
Evaluation of the immune
microenvironment in patients with high-risk and low-risk
glioma
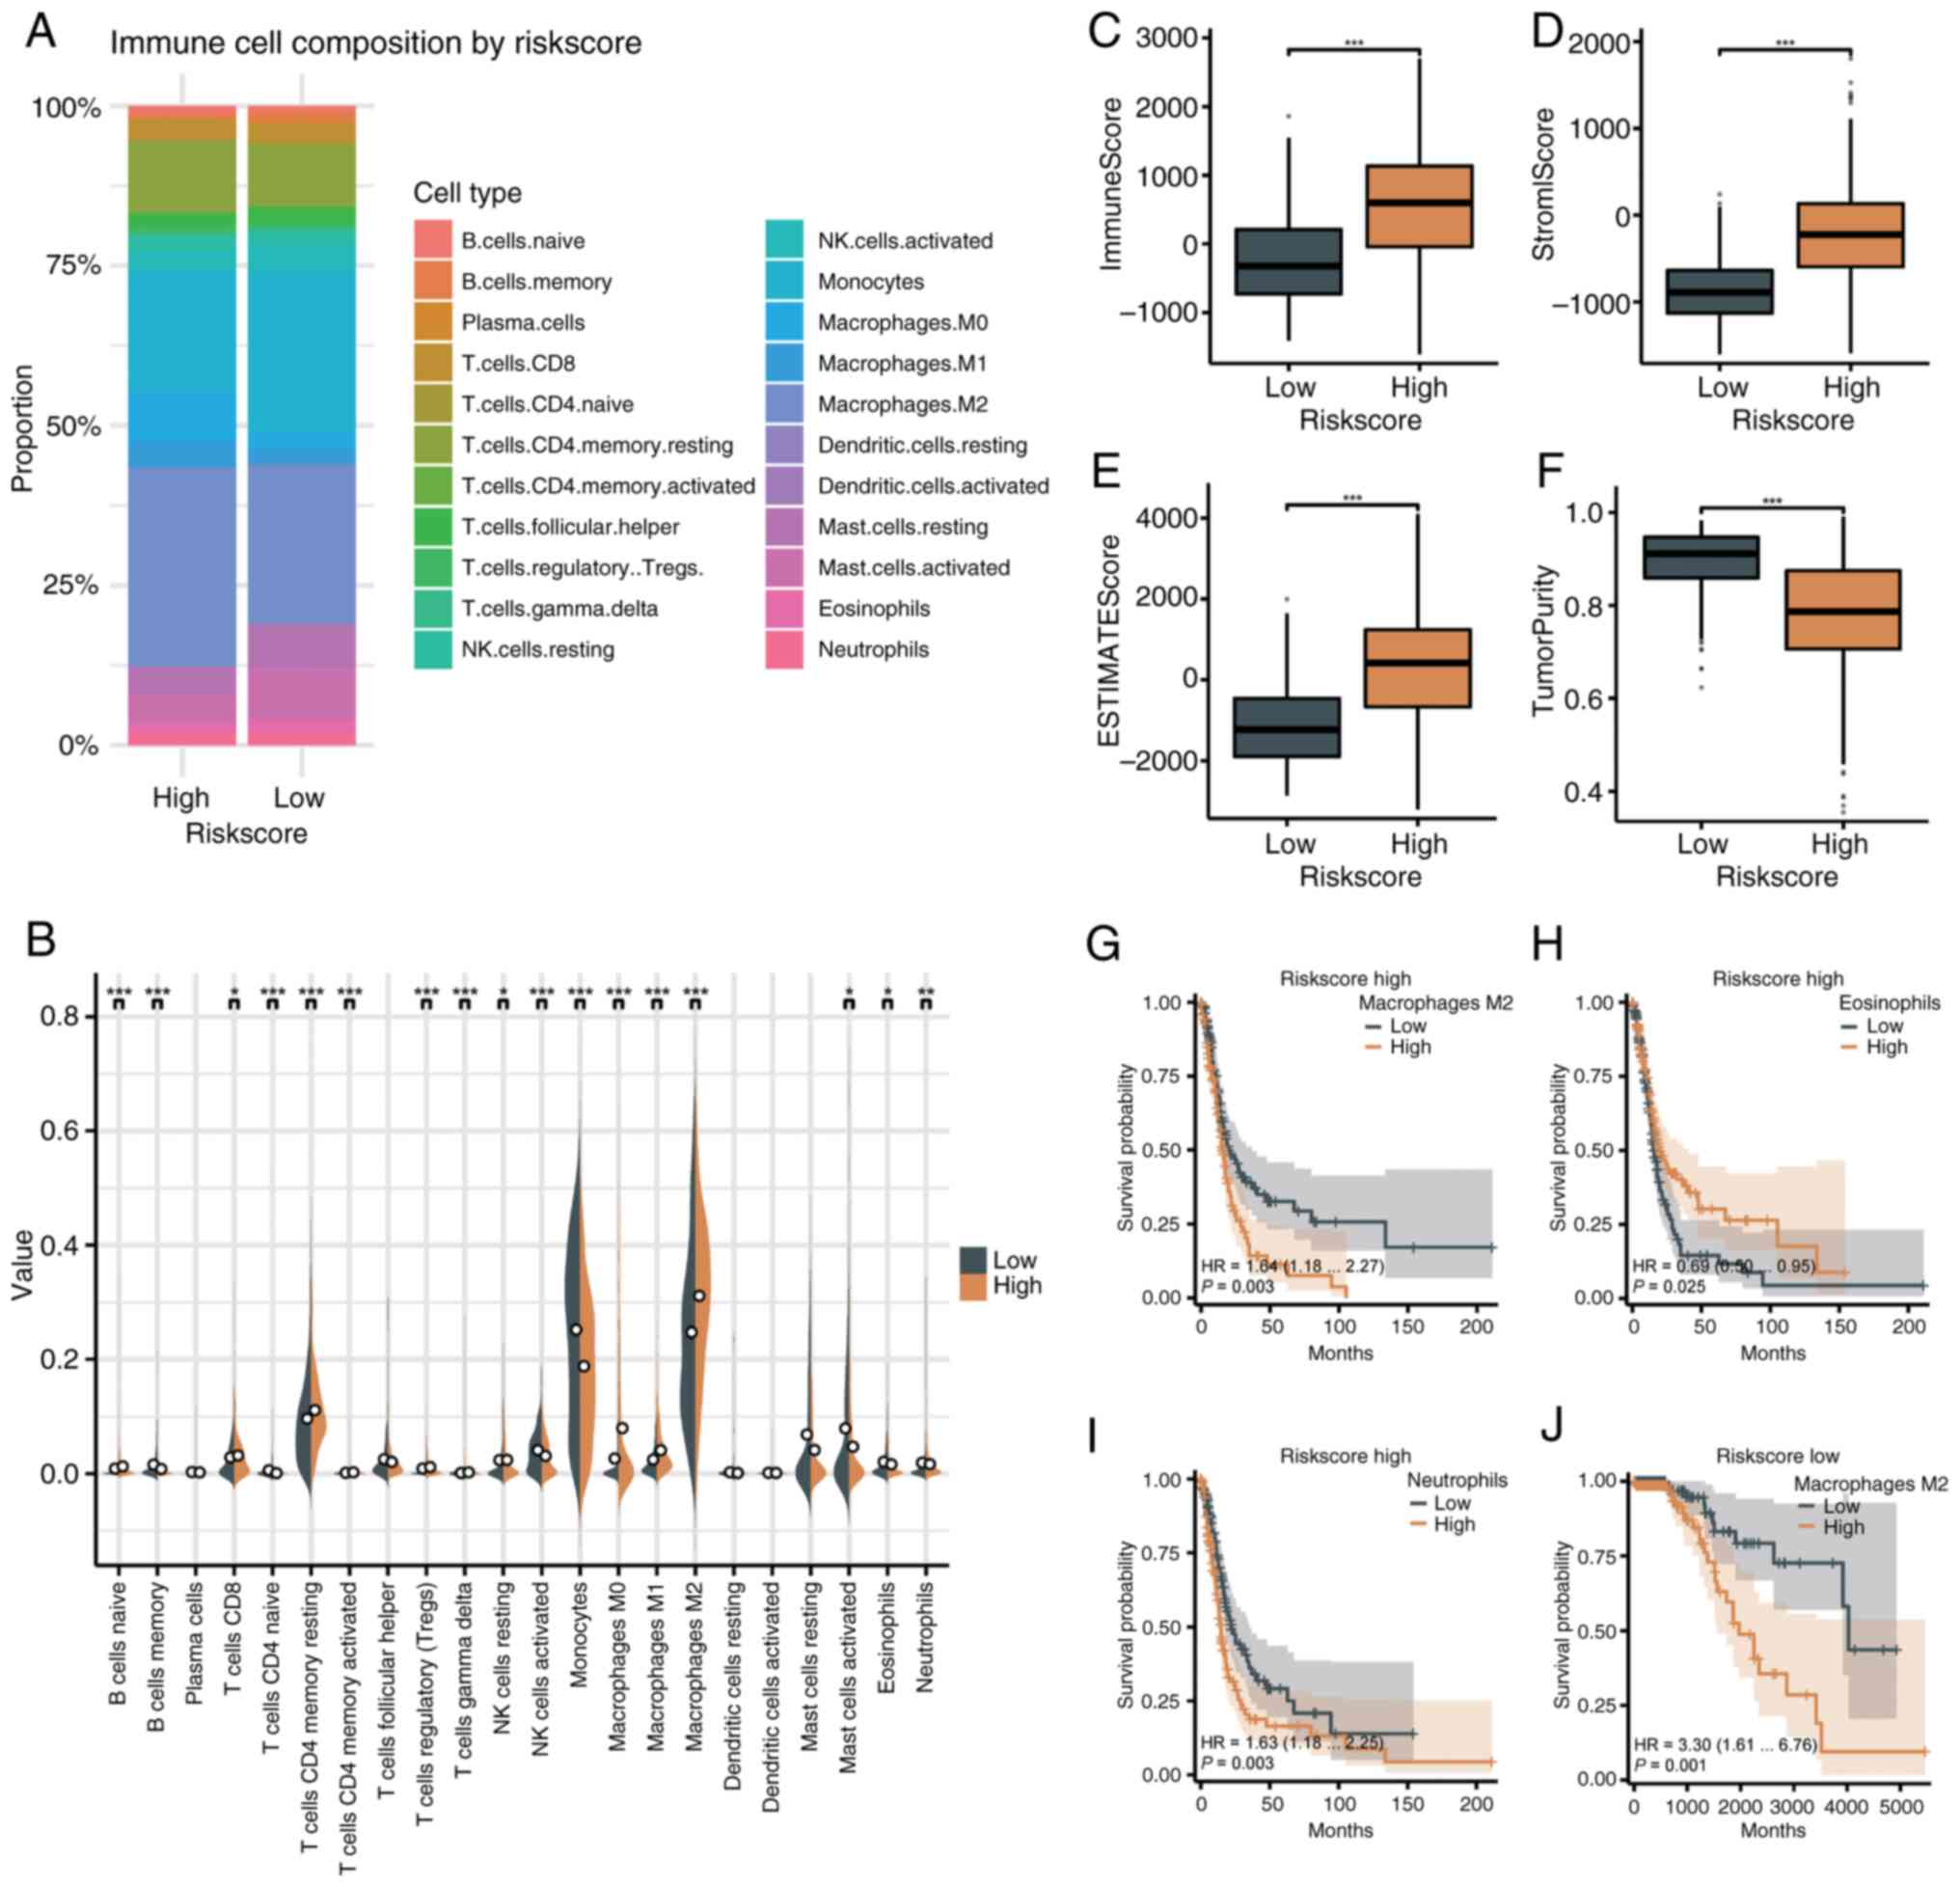
The senescence-related risk score was analyzed with
the immune microenvironment using CIBERSORT. In the high-risk
group, M2 macrophages (31.11%) and monocytes (18.79%) were most
abundant, while monocytes (25.19%) and M2 macrophages (24.72%)
dominated in the low-risk group (Fig.
7A). High-risk tumors showed greater infiltration of immune
cells, including naïve B cells, CD8+ T cells, memory
CD4+ T cells, Tregs, gamma delta T cells, and
macrophages (M0, M1 and M2). Low-risk tumors had higher levels of
memory B cells, naïve CD4+ T cells, activated natural
killer (NK) cells, monocytes, mast cells, eosinophils and
neutrophils (Fig. 7B). Immune,
stromal and ESTIMATE scores were higher in the high-risk group
(P<0.001), while tumor purity was lower (P<0.001) (Fig. 7C-F). Greater infiltration of M2
macrophages and neutrophils in high-risk patients correlated with
worse survival (P=0.003), while higher eosinophil levels indicated
improved survival (P=0.025). In low-risk patients, M2 macrophage
infiltration was linked to poorer survival (P=0.001) (Fig. 7G-J).
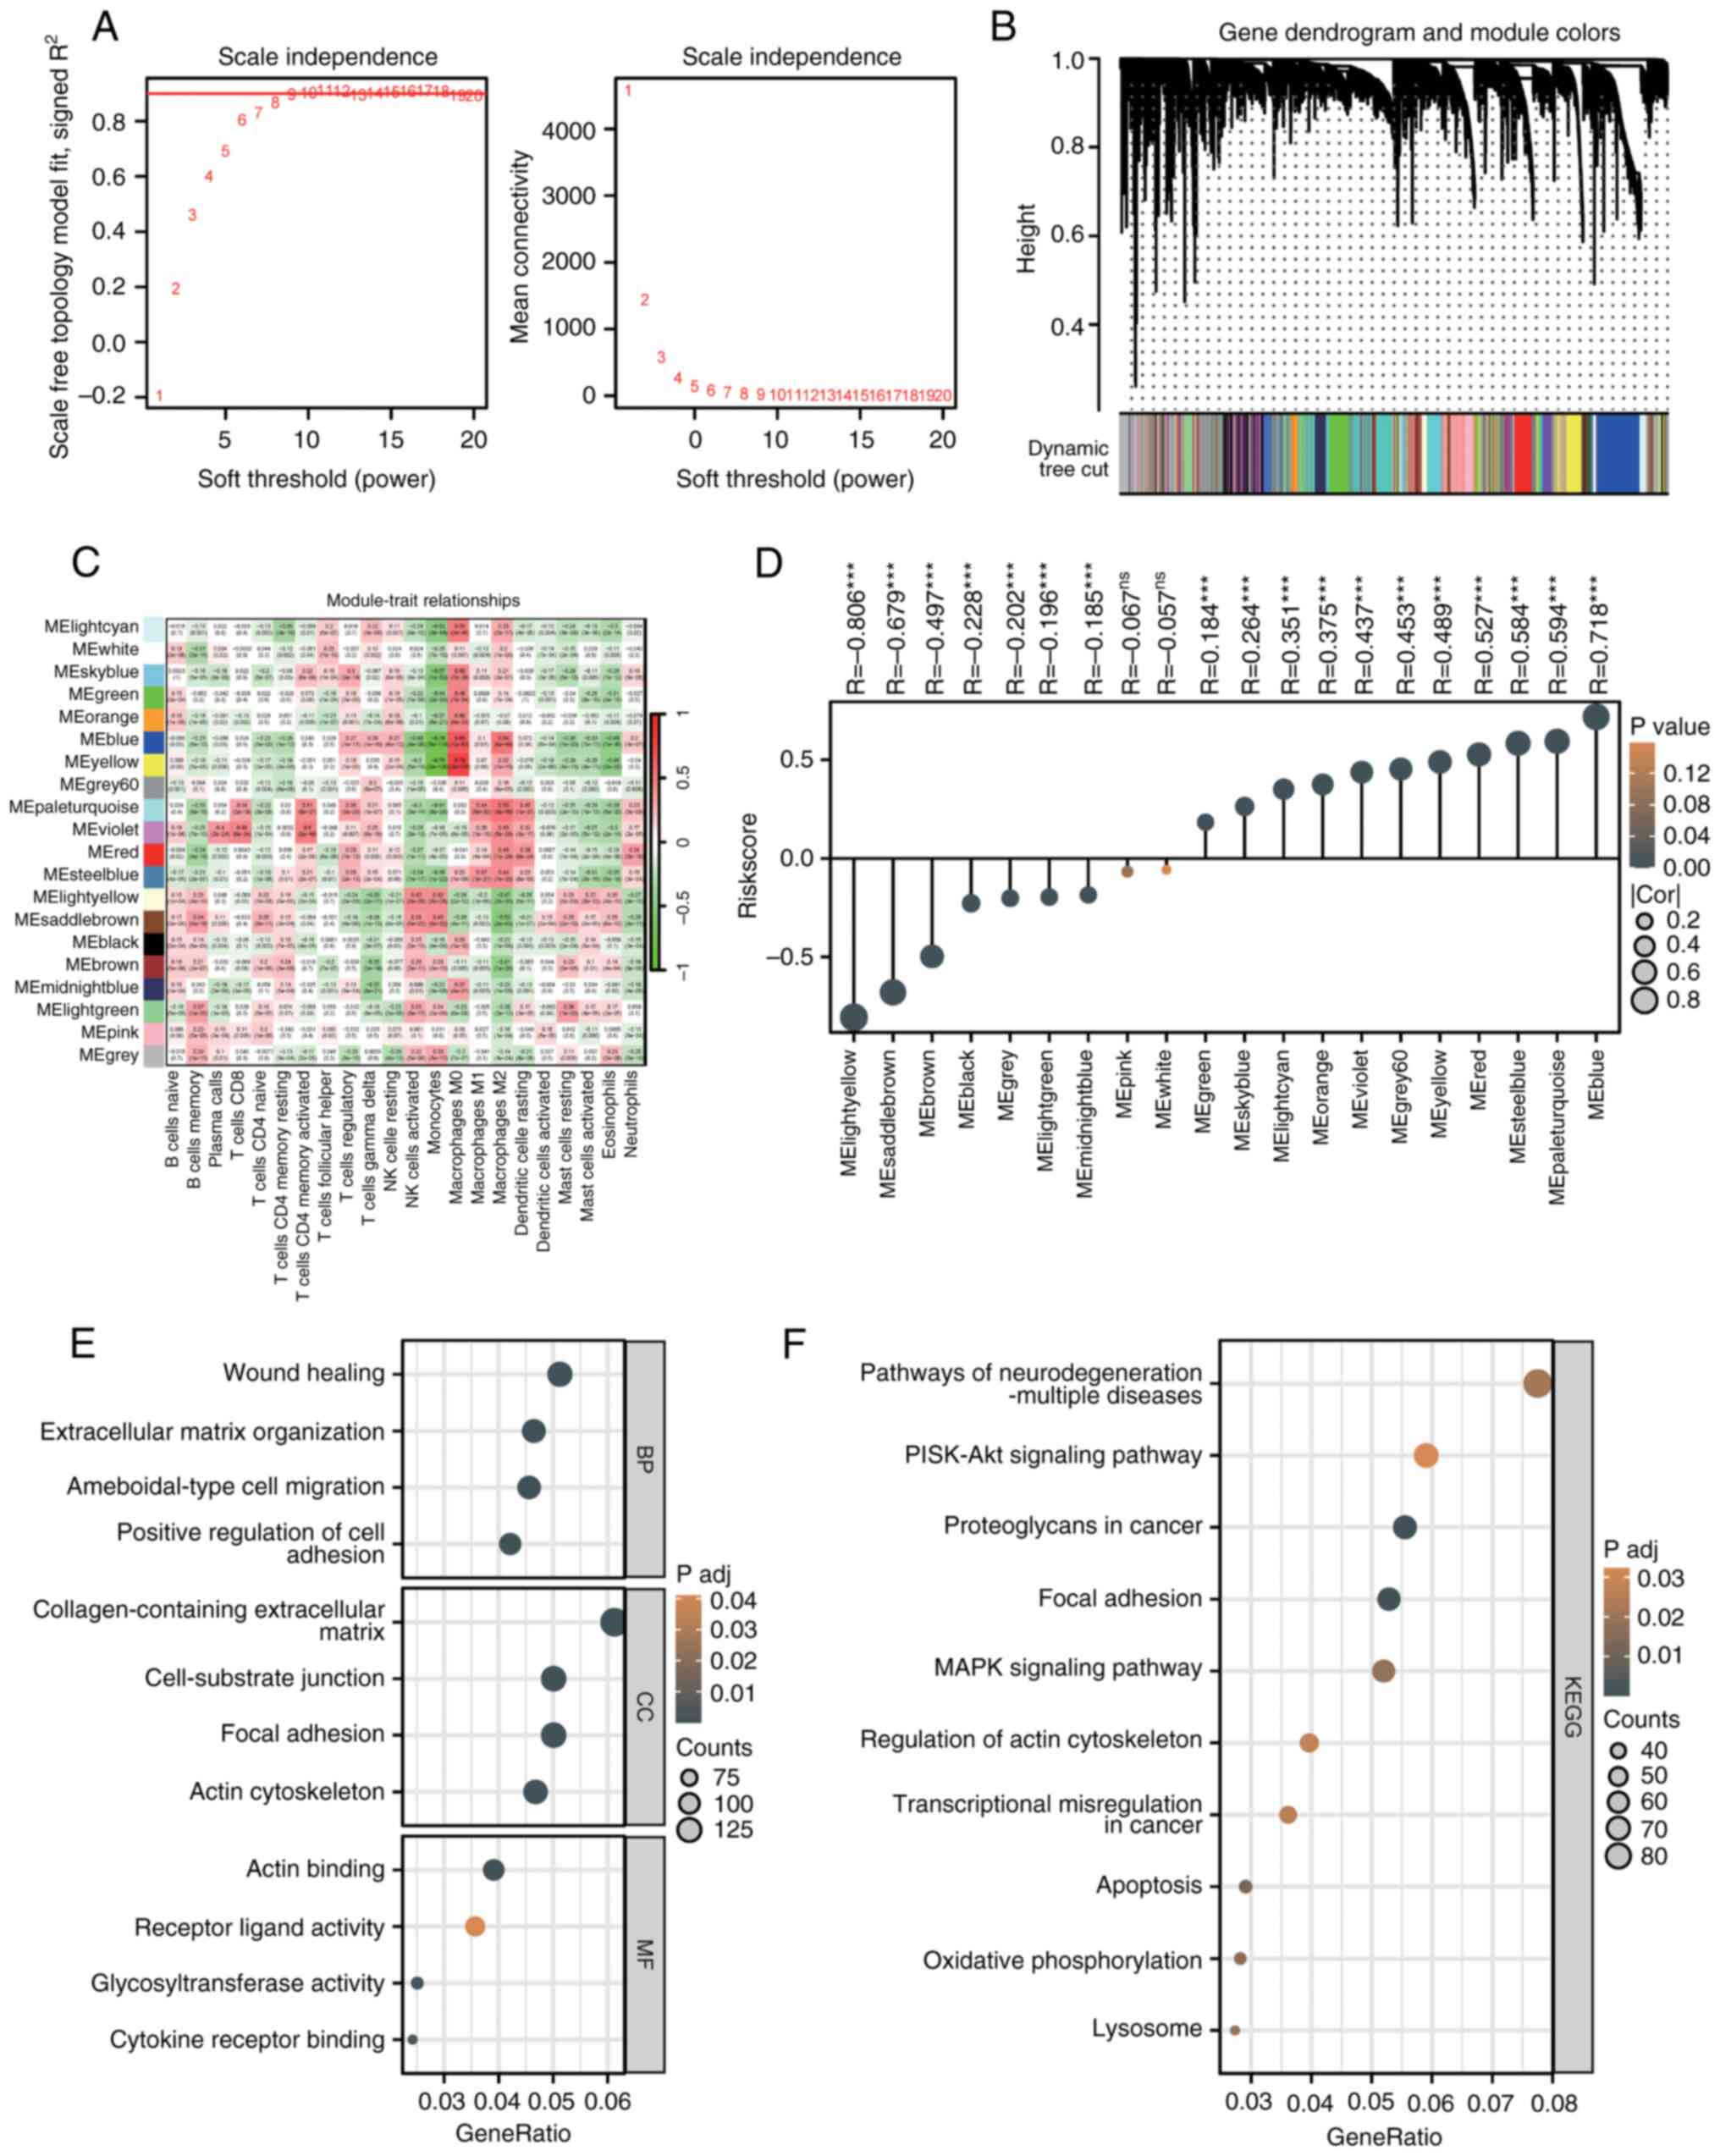
WGCNA analysis of CIBERSORT results
and functional enrichment analysis
WGCNA was performed on CIBERSORT results to identify
gene modules associated with immune cell infiltration. At a soft
threshold of 12, the R² value stabilized near 1, indicating
scale-free topology with sparse yet moderate connectivity (Fig. 8A). The gene dendrogram identified
20 co-expression modules (Fig.
8B), and correlation analysis revealed functional roles of
specific modules in the immune microenvironment (Fig. 8C). The MEblue module was positively
correlated with immunosuppressive cells (M2 macrophages, Tregs) and
negatively correlated with antitumor cells (activated NK cells),
suggesting its role in promoting an immunosuppressive
environment.
A strong positive correlation was observed between
the risk score and the MEblue module (R=0.718, P<0.001, Fig. 8D). Functional enrichment analysis
of MEblue genes revealed GO terms related to ECM organization, cell
adhesion and actin binding (Fig.
8E). KEGG analysis highlighted enrichment in PI3K-Akt
signaling, proteoglycans in cancer, focal adhesion and MAPK
signaling pathways (Fig. 8F).
Association of the risk score with
immune checkpoint molecules, immunotherapy and chemotherapy
sensitivity
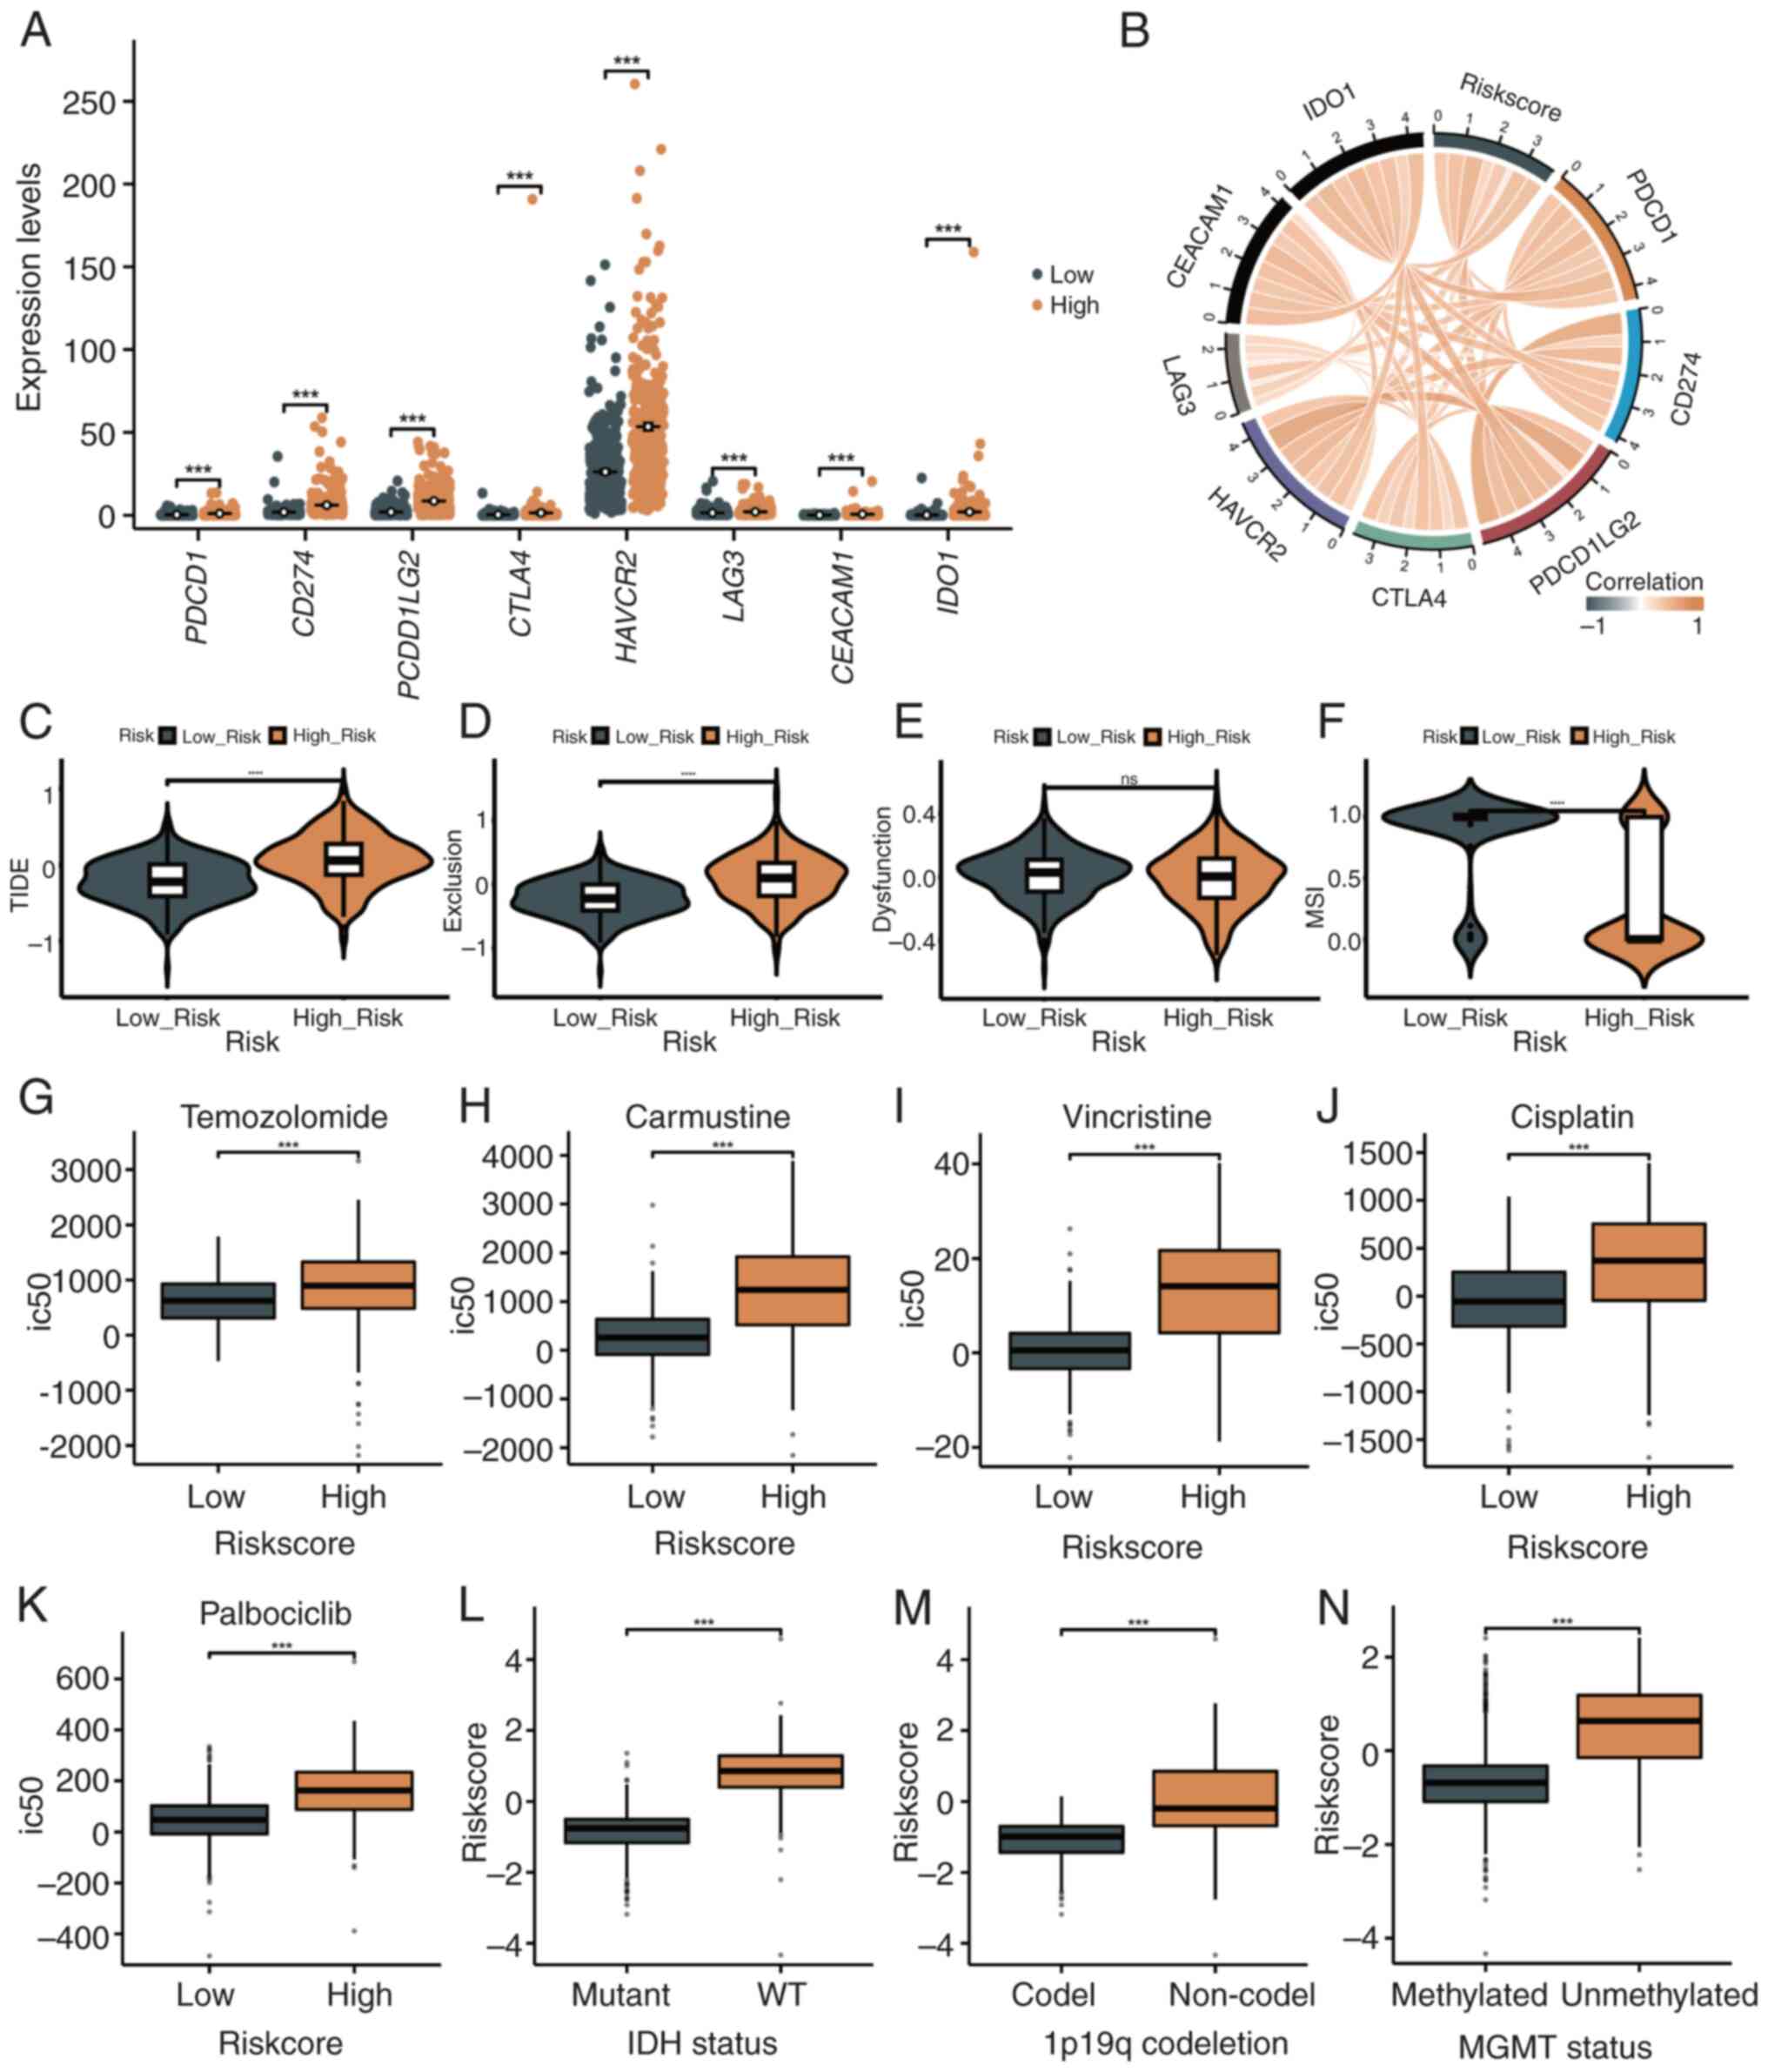
Immune checkpoint gene expression and its
association with immune evasion, suppression and the immune
microenvironment were analyzed in patients with glioma. Immune
checkpoint genes, including PDCD1 (PD-1), CD274 (PD-L1), PDCD1LG2
(PD-L2), CTLA4, HAVCR2 (TIM-3), LAG3, CEACAM1 and IDO1, were
significantly upregulated in high-risk patients compared with
low-risk patients (P<0.001, Fig.
9A). The risk score demonstrated a strong positive correlation
with these molecules (P<0.05, Fig.
9B).
Using the TIDE algorithm, high-risk patients
exhibited higher immune evasion and exclusion scores (P<0.001,
Fig. 9C and D), while dysfunction scores did not
differ significantly (P>0.05, Fig.
9E). Higher microsatellite instability scores were observed in
the high-risk group (P<0.001, Fig.
9F).
Chemotherapy sensitivity analysis revealed reduced
sensitivity in high-risk patients to temozolomide, carmustine,
vincristine, cisplatin and palbociclib, as indicated by higher
IC50 values (P<0.001, Fig. 9G-K). High-risk patients with
wild-type IDH, 1p/19q non-codeletion, and unmethylated MGMT had
significantly higher risk scores (P<0.001, Fig. 9L-N), explaining their lower drug
sensitivity or resistance.
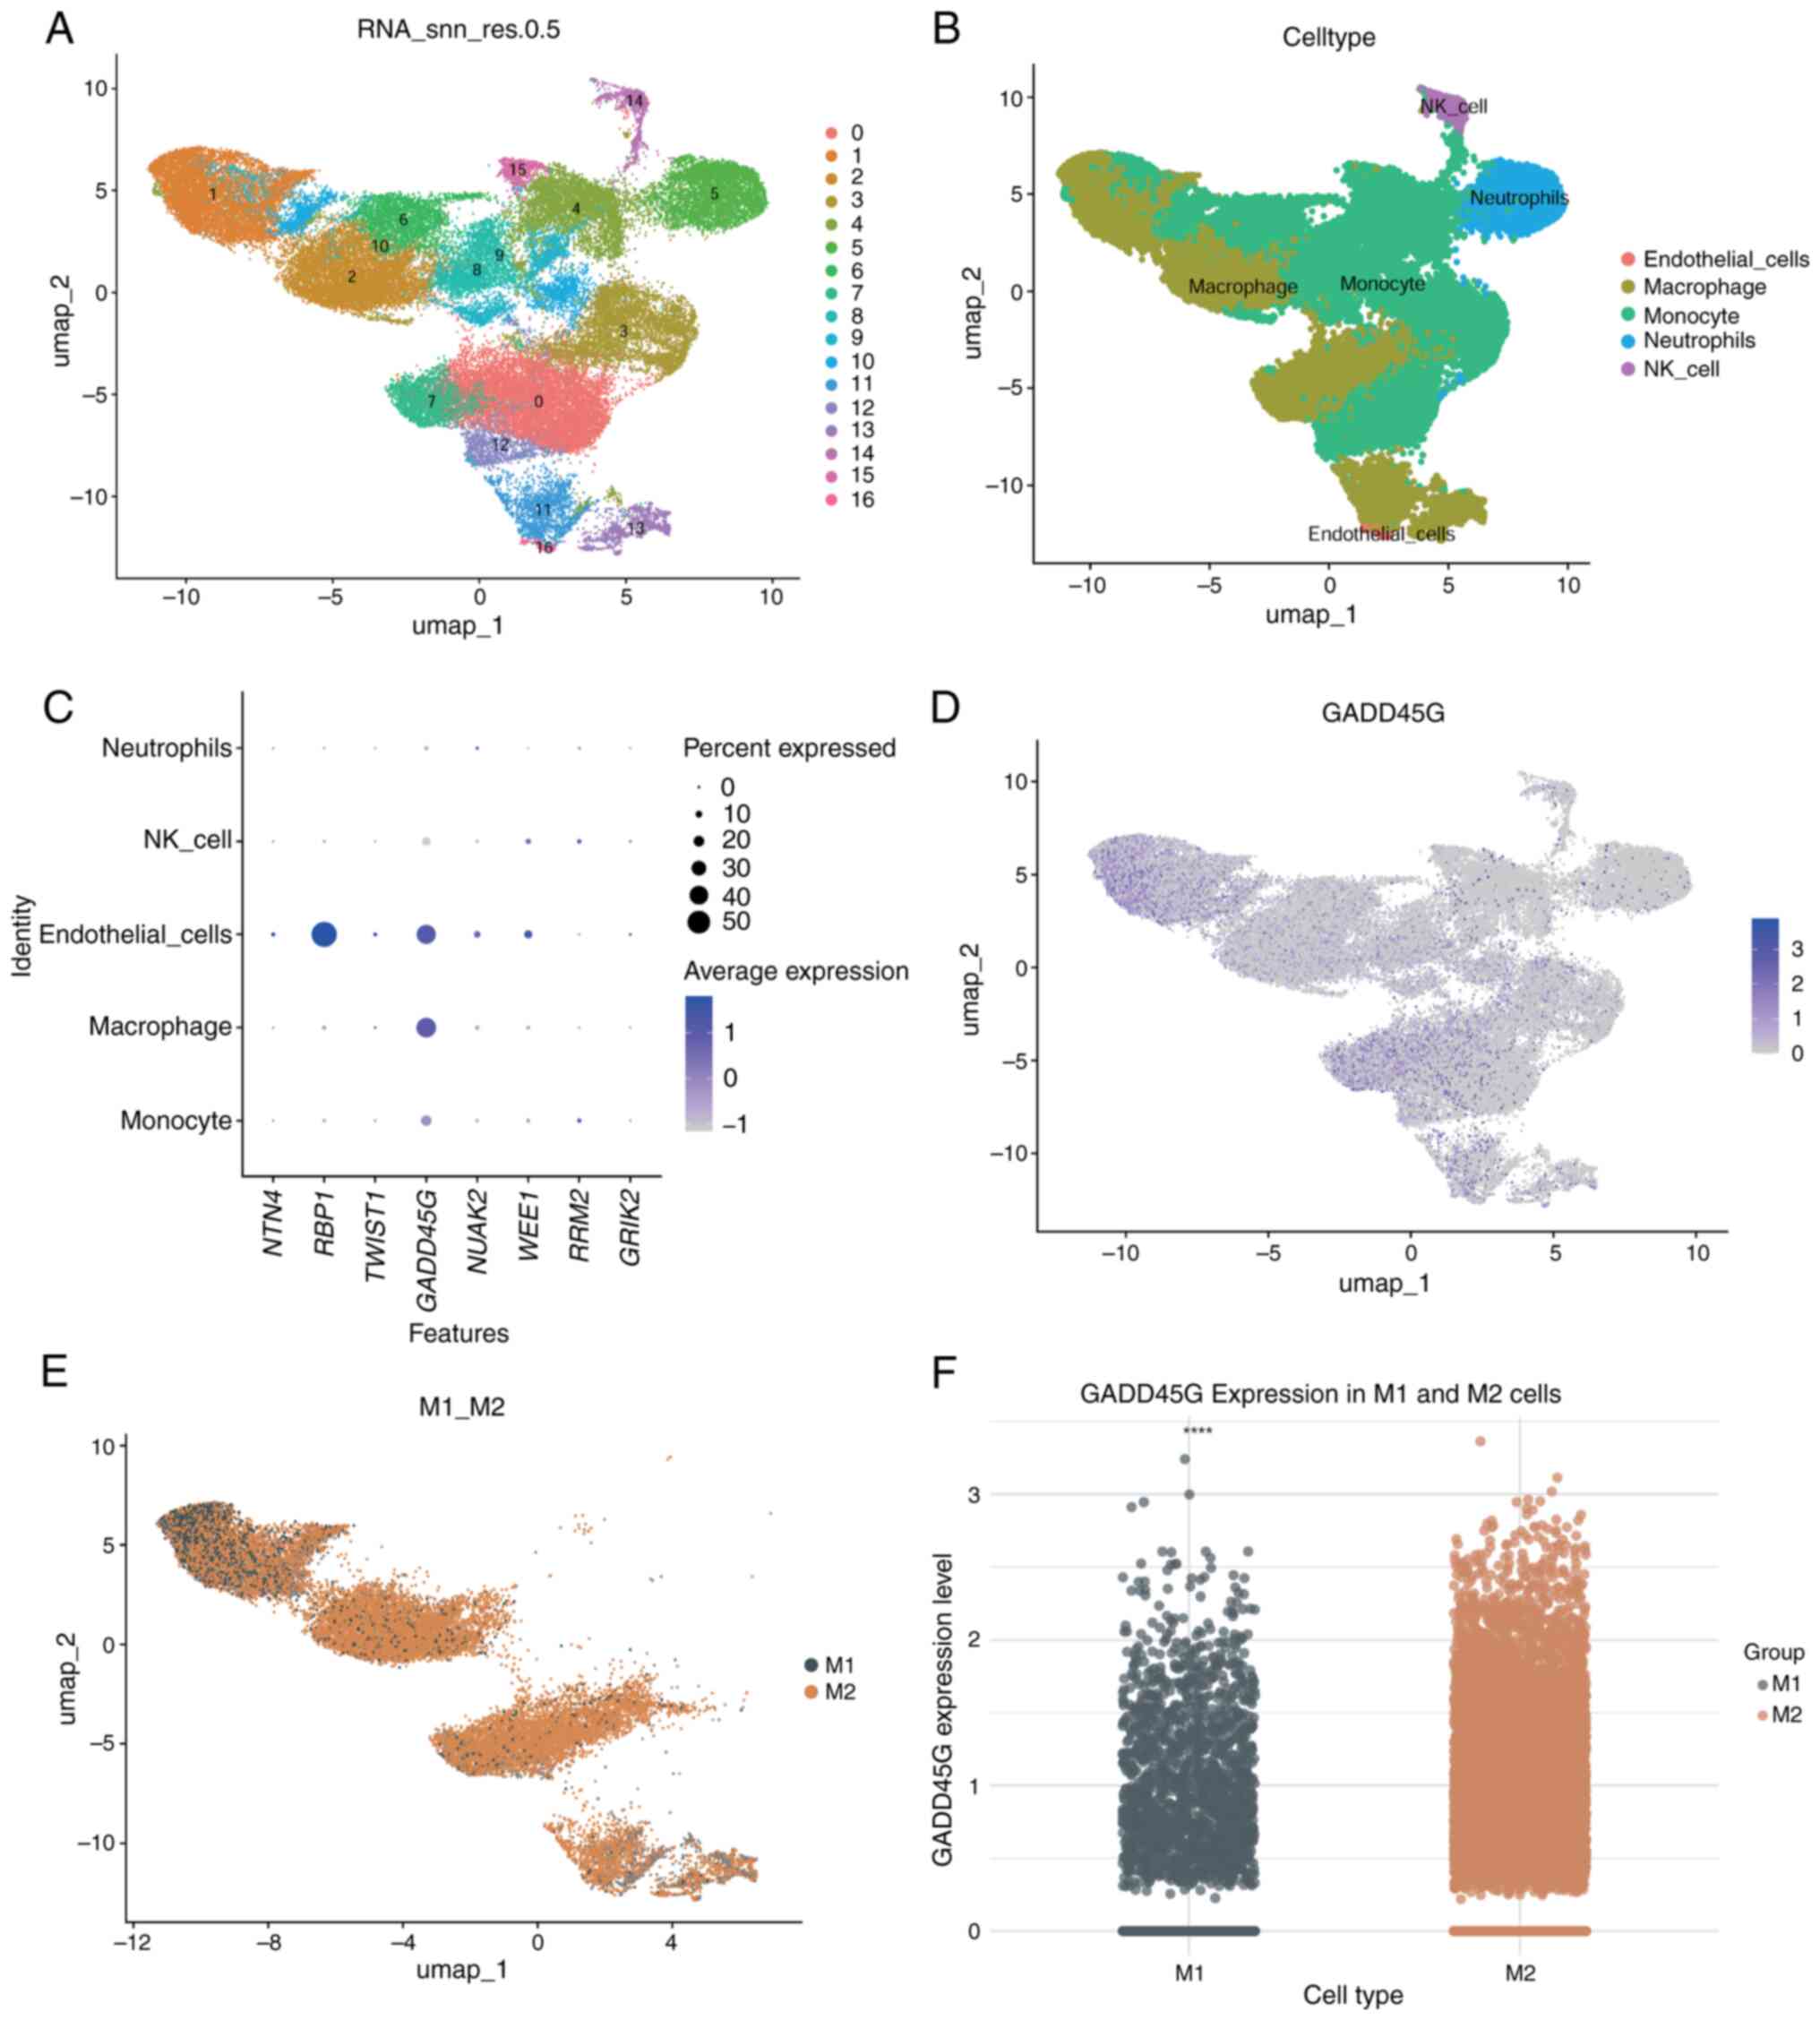
Single-cell differential expression
analysis of GADD45G in M1 and M2 macrophages
Single-cell analysis was performed on four GBM
samples from GSE162631. After filtering cells with mitochondrial
gene expression >15%, 55,757 high-quality cells were retained
(Fig. S1A). The
‘FindVariableFeatures’ function identified the top 2,000 most
variable genes (Fig. S1B).
Dimensionality reduction using PCA and UMAP resulted in 17 cell
clusters (Fig. 10A), which were
annotated with ‘SingleR’ to identify subpopulations, including
monocytes, macrophages, endothelial cells, neutrophils and NK cells
(Fig. 10B). Expression analysis
of the eight model genes showed retinol-binding protein 1(RBP1) was
highly expressed in endothelial cells, while GADD45G was expressed
in both macrophages and endothelial cells (Fig. 10C). UMAP further confirmed
GADD45G's predominant expression in macrophages (Fig. 10D). M1 and M2 macrophages were
manually annotated (Fig. 10E),
and differential expression analysis revealed significantly higher
GADD45G expression in M2 macrophages compared with M1 macrophages
(Fig. 10F).
Validation of 8-gene expression by
RT-qPCR in normal and GBM cells
RT-qPCR was performed to validate the expression of
eight genes [netrin-4 (NTN4), RBP1, Twist Family BHLH Transcription
Factor 1 (TWIST1), GADD45G, NUAK2, GRIK2, WEE1 and RRM2] in normal
astrocytes (HA) and GBM cell lines (U251 and U87).
Regarding NTN4, significantly higher expression was
observed in HA compared with U251 and U87 (Fig. 11A; P<0.05). RBP1 was
significantly elevated in U251 compared with HA (P<0.05;
Fig. 11B). TWIST1 was strongly
upregulated in U251 and U87 compared with HA (P<0.05; Fig. 11C). GADD45G demonstrated higher
expression in HA compared with U251, but differences between HA and
U87 were not significant (Fig.
11D). NUAK2 was increased in HA compared with U251 (P<0.05),
while no significant difference was observed between HA and U87
(Fig. 11E). GRIK2 exhibited
significantly higher expression in U251 and U87 compared with HA
(P<0.05; (Fig. 11F). WEE1
revealed increased expression in both U251 and U87 compared with HA
(P<0.05; (Fig. 11G). Regarding
RRM2, no significant differences were observed across HA, U251 and
U87 groups (Fig. 11H).
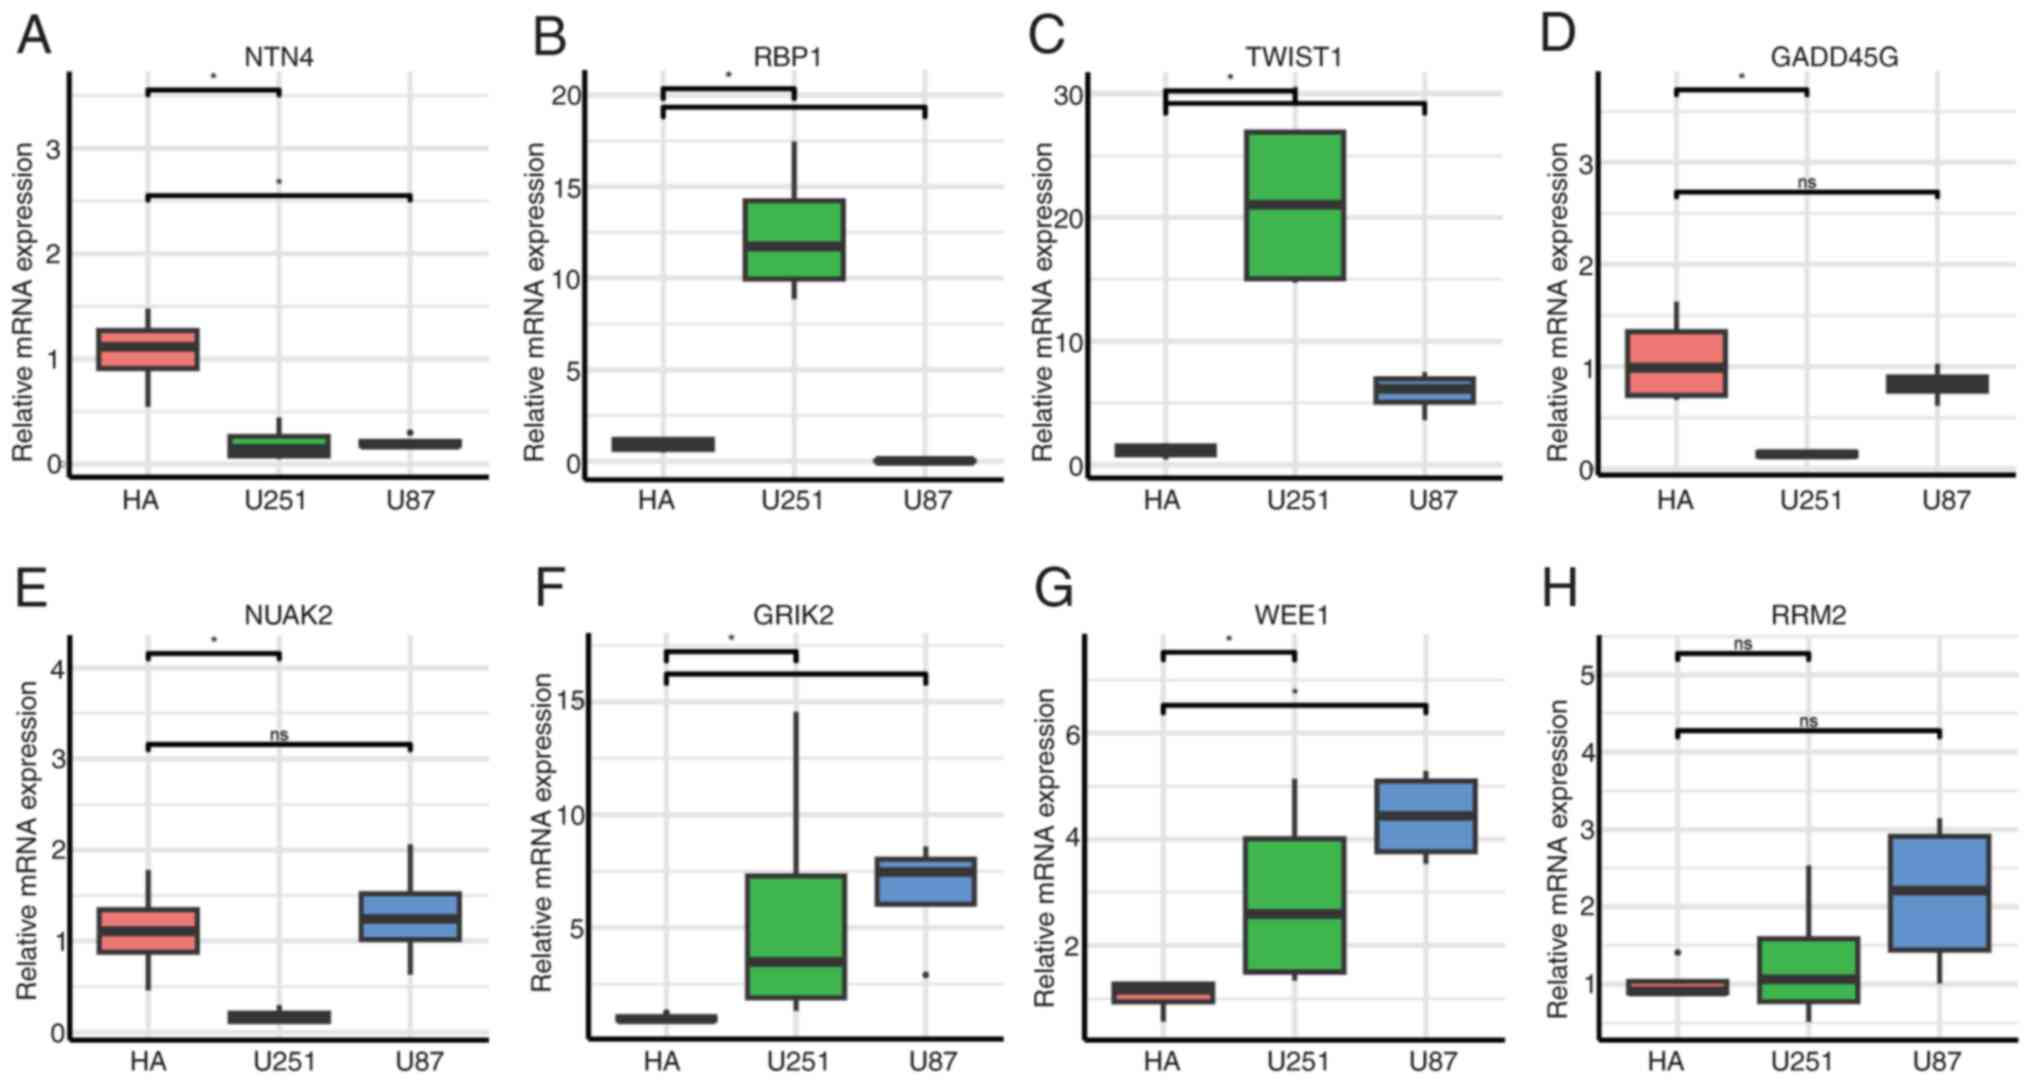 | Figure 11RT-qPCR validation of 8-gene
expression in normal astrocytes (HA) and glioblastoma cell lines
(U251 and U87). (A-H) RT-qPCR analysis of eight genes: (A) NTN4,
(B) RBP1, (C) TWIST1, (D) GADD45G, (E) NUAK2, (F) GRIK2, (G) WEE1
and (H) RRM2. *P<0.05. RT-qPCR, reverse
transcription-quantitative PCR; NTN4, netrin-4; RBP1,
retinol-binding protein 1; TWIST1, Twist Family BHLH Transcription
Factor 1; GADD45G, growth arrest and DNA damage inducible gamma;
RRM2, ribonucleotide reductase regulatory subunit; GRIK2, glutamate
ionotropic receptor kainate type subunit 2; ns, not
significant. |
Discussion
Aging-related genes play critical roles in tumors by
regulating the cell cycle, DNA repair, metabolism and immune
evasion (6,17). In the present study, 29
aging-related genes critical to GBM progression were identified and
an eight-gene risk score model was developed with strong prognostic
and discriminative performance in the TCGA and CGGA datasets,
demonstrating its broad applicability and reliability. Unlike prior
prognostic signatures based on senescence or immune-related genes,
our model integrates aging-related genes curated from HAGR with
multi-cohort transcriptomic validation, scRNA-seq profiling and
RT-qPCR assays and extends to immune microenvironment and drug
resistance analyses. These genes participate in diverse biological
processes relevant to glioma. NTN4 is associated with poor
prognosis, likely due to its role in ECM regulation and tumor
invasion (18); RBP1 may affect
tumor differentiation and survival via the retinoic acid signaling
pathway (19); TWIST1 plays a
pivotal role in cancer progression, primarily by driving
epithelial-mesenchymal transition, which in turn enhances the
invasive and metastatic potential of tumor cells (20,21);
Accumulating evidence suggests that GADD45G proteins participate in
the regulation of tumor progression, including that of gliomas,
particularly under conditions of oncogenic stress (22-24);
NUAK2 is involved in neural tube development, and its aberrant
expression is strongly associated with tumor progression and poor
patient prognosis, including in GBM (25-27);
GRIK2 has been reported to participate in the development of
gastric (28,29); however, its potential involvement
in glioma has not yet been clearly elucidated; WEE1, a key cell
cycle regulator, has shown therapeutic potential in GBM clinical
trials (30); and RRM2 has been
reported to facilitate the proliferation, migration and invasive
behavior of human GBM cells, while simultaneously suppressing
apoptosis (31). Collectively,
these genes converge on pathways of cell cycle regulation, DNA
damage response, invasion and metabolic adaptation, consistent with
their reported functions in glioma biology. Their integration into
a unified signature highlights their combined prognostic value.
The risk score model showed strong predictive power
across clinical and molecular subgroups, demonstrating its utility
in both overall and subgroup prognosis. High-risk patients with
wild-type IDH and 1p/19q non-codeletion had significantly lower
survival rates, consistent with these molecular features being key
glioma prognostic factors. IDH mutations are linked to improved
prognosis and treatment response, while 1p/19q codeletion enhances
sensitivity to chemotherapy and radiotherapy (10). To improve clinical applicability,
the risk score model was integrated with clinicopathological
features to construct a nomogram, which exhibited high predictive
accuracy and consistency. This validates the model's utility in
providing valuable prognostic insights across diverse molecular
subtypes and clinical contexts.
GO and KEGG analyses highlighted key biological
functions and pathways related to the risk score model, including
the cell cycle, DNA repair and metabolism. WEE1, a critical
regulator of cell cycle checkpoints, prevents damaged cells from
entering mitosis (32). KEGG
analysis linked the model genes to pathways such as the cell cycle,
cellular senescence, p53 signaling and FoxO signaling, which are
central to tumorigenesis and progression. For instance, p53
suppresses glioma by regulating the cell cycle and inducing
apoptosis (33,34). Cellular senescence, triggered by
DNA damage, telomere shortening, or oncogenic stress, plays a dual
role in glioma by suppressing tumor formation while potentially
promoting progression via proinflammatory factor secretion
(35).
GSVA showed significant upregulation of
cancer-related pathways, including KRAS signaling, MYC targets and
E2F targets, in the high-risk group. KRAS drives sustained
proliferation and survival via the MAPK and PI3K/AKT pathways,
contributing to poor prognosis and therapy resistance in GBM
(36,37). MYC overexpression promotes
malignant transformation and high proliferative capacity, with
MYC-regulated genes playing critical roles in cancer progression
(38,39). In the low-risk group, pathways
related to oxidative phosphorylation, DNA repair, tight junctions
and interferon responses were upregulated. Enhanced oxidative
phosphorylation, indicating a reliance on mitochondrial energy
production, is linked to reduced tumor proliferation and improved
prognosis (40). Upregulated DNA
repair-related genes promote genomic stability, reduce
carcinogenesis risk, and improve chemotherapy response (41,42).
The TME plays a vital role in tumor growth,
metastasis and treatment response, consisting of immune cells,
fibroblasts, vascular cells and stromal components (43). In the high-risk group, elevated
infiltration of M2 macrophages, an immunosuppressive subtype linked
to poor prognosis, was observed. M2 macrophages promote glioma
growth and immune evasion by secreting anti-inflammatory cytokines
and stimulating angiogenesis (44). Regulatory T cells (Tregs), also
abundant in this group, suppress antitumor responses by inhibiting
effector T-cell and NK cell activity via cytokines like IL-10 and
TGF-β (45). High-risk patients
exhibited significantly higher immune, stromal and ESTIMATE scores
(P<0.001), indicating a greater abundance of nontumor components
such as fibroblasts and stromal cells, which promote tumor
expansion and invasion by secreting growth factors and
matrix-degrading enzymes (46).
These components, along with immunosuppressive cells, create
barriers that reduce the effectiveness of chemotherapy and
radiotherapy, potentially explaining the poorer therapeutic
responses in patients with high-risk GBM.
WGCNA analysis of CIBERSORT results identified the
MEblue module as positively correlated with immunosuppressive cells
(M2 macrophages and Tregs) and negatively correlated with antitumor
immune cells (activated NK cells), suggesting an association in
immune evasion and tumor progression. GO and KEGG analyses showed
that MEblue genes regulate ECM organization and cell adhesion,
which are known to support the immunosuppressive tumor environment.
ECM remodeling, a key step in cancer progression, involves proteins
and enzymes like collagen, matrix metalloproteinases, and integrins
(47). In gliomas, ECM remodeling
promotes tumor invasion and metastasis through cell-matrix
interactions and focal adhesions. Integrins bind ECM components,
such as fibronectin, and activate downstream pathways, including
PI3K-Akt and MAPK, which regulate cell proliferation, survival and
migration, driving GBM progression (48,49).
In the high-risk group, key immune checkpoint genes,
including PDCD1 (PD-1), CD274 (PD-L1) and PDCD1LG2 (PD-L2), were
significantly upregulated, consistent with an immunosuppressive
state. PD-1 binding to PD-L1 or PD-L2 reduces T-cell proliferation
and cytotoxicity, allowing tumor cells to evade immune surveillance
(50). High CTLA-4 expression
further supports immune evasion by inhibiting T-cell activation
through competitive binding to B7 molecules (51). The high-risk group also exhibited
significantly higher TIDE scores (P<0.001), consistent with
stronger immune evasion potential and poorer responses to immune
checkpoint inhibitors. Elevated immune exclusion scores in this
group were associated with reduced T-cell infiltration and
cytotoxic activity through physical and chemical barriers, aligning
with findings of increased immune and stromal components in the
high-risk group.
The glioma immune microenvironment is not static but
evolves with tumor stage, progression and recurrence. GBM generally
exhibits higher levels of M2 macrophages and exhausted T cells than
LGG, and recurrent tumors often show stromal fibrosis and stronger
immunosuppressive signaling (52-54).
In the present study, the computational analysis could not capture
these stage-specific dynamics, which should be addressed in future
studies using longitudinal sampling, spatial transcriptomics and
multiplex immunohistochemistry.
Drug sensitivity analysis showed that high-risk
patients were less responsive to chemotherapeutic agents, including
temozolomide, carmustine, vincristine, cisplatin and palbociclib,
compared with low-risk patients. In the present study, GSVA and
KEGG enrichment analyses indicated that the high-risk group was
enriched in PI3K/AKT/mTOR, E2F target, and KRAS signaling pathways,
which are known to promote tumor survival, inhibit apoptosis, and
drive therapeutic resistance in glioma (37,55,56).
Key genes in our signature, including RRM2 and WEE1, regulate DNA
synthesis and G2/M checkpoint control, respectively, mechanisms
that facilitate DNA repair and contribute to resistance to
temozolomide and radiotherapy (57,58).
Furthermore, immune deconvolution revealed that the high-risk
subgroup exhibited increased infiltration of M2 macrophages and
Tregs, which secrete immunosuppressive cytokines such as IL-10 and
TGF-β, thereby limiting antitumor immunity and drug efficacy
(59). These changes are
consistent with the immunosuppressive remodeling and stromal
fibrosis observed in advanced gliomas (60). By contrast, the low-risk group was
enriched for IDH mutation, 1p/19q codeletion, and MGMT promoter
methylation, well-established molecular features associated with
improved chemosensitivity and prognosis (61-63).
Taken together, these findings suggest that the diminished drug
sensitivity in the high-risk group results from the combined
effects of cell-cycle dysregulation (RRM2 and WEE1),
PI3K/AKT-mediated survival signaling, and an immunosuppressive TME,
consistent with previous mechanistic studies in glioma biology.
In summary, the present study highlights the
critical role of aging-related genes in glioma and introduces a
gene expression-based risk score model for predicting patient
survival. These findings offer new insights and potential targets
for personalized treatment and prognosis. However, this study has
several limitations. Functional validation experiments (for
example, knockdown/overexpression assays and in vivo models)
were not performed, and drug sensitivity and immune analyses relied
on computational inference without experimental confirmation. The
scRNA-seq dataset was relatively small, and the RT-qPCR validation
was conducted only in established glioma cell lines (U87, U251 and
HA). Although these models are widely used and provide preliminary
support for the expression patterns of the signature genes, they do
not fully recapitulate the molecular heterogeneity and TME
interactions observed in patient tissues. Long-term cultured cell
lines may acquire genetic drift and altered signaling pathways,
potentially affecting gene expression and treatment response.
Therefore, future studies should include validation using
patient-derived glioma tissues, organoid cultures, or xenograft
models to better reflect the in vivo tumor context and
confirm clinical relevance. In addition, grade-specific analyses
for LGG and GBM were not conducted. These limitations warrant
further validation in future studies.
Supplementary Material
Data processing and identification of
variable genes. (A) Cells with >15% mitochondrial gene
expression were filtered, leaving 55,757 high-quality cells. (B)
The top 2,000 most variable genes identified via the
‘FindVariableFeatures’ function.
Each gene was evaluated for its
association with overall survival in 698 patients with glioma.
Sequences of primers used for reverse
transcription-quantitative PCR.
Acknowledgements
Not applicable.
Funding
Funding: No funding was received.
Availability of data and materials
The data generated in the present study may be found
at the following URL: (portal.gdc.cancer.gov) (https://www.cgga.org.cn/download.jsp).
Authors' contributions
QZ conceptualized the study, and wrote, reviewed and
edited the manuscript. ZL developed methodology and wrote the
original draft. LZ and PL performed data visualization. XLi and
XLiang conducted formal analysis. TW, JY and QY curated data. QZ
and ZL confirm the authenticity of all the raw data. All authors
read and approved the final version of the manuscript.
Ethics approval and consent to
participate
Not applicable.
Patient consent for publication
Not applicable.
Competing interests
The authors declare that they have no competing
interests.
References
|
1
|
Louis DN, Perry A, Reifenberger G, von
Deimling A, Figarella-Branger D, Cavenee WK, Ohgaki H, Wiestler OD,
Kleihues P and Ellison DW: The 2016 world health organization
classification of tumors of the central nervous system: A summary.
Acta Neuropathol. 131:803–820. 2016.PubMed/NCBI View Article : Google Scholar
|
|
2
|
Ostrom QT, Gittleman H, Truitt G, Boscia
A, Kruchko C and Barnholtz-Sloan JS: CBTRUS Statistical report:
Primary brain and other central nervous system tumors diagnosed in
the United States in 2011-2015. Neuro Oncol. 20 (Suppl 4):iv1–iv86.
2018.PubMed/NCBI View Article : Google Scholar
|
|
3
|
Yan H, Parsons DW, Jin G, McLendon R,
Rasheed BA, Yuan W, Kos I, Batinic-Haberle I, Jones S, Riggins GJ,
et al: IDH1 and IDH2 mutations in gliomas. N Engl J Med.
360:765–773. 2009.PubMed/NCBI View Article : Google Scholar
|
|
4
|
Wen PY and Kesari S: Malignant gliomas in
adults. N Engl J Med. 359:492–507. 2008.PubMed/NCBI View Article : Google Scholar
|
|
5
|
Campisi J: Aging, cellular senescence, and
cancer. Annu Rev Physiol. 75:685–705. 2013.PubMed/NCBI View Article : Google Scholar
|
|
6
|
Lopez-Otin C, Blasco MA, Partridge L,
Serrano M and Kroemer G: The hallmarks of aging. Cell.
153:1194–1217. 2013.PubMed/NCBI View Article : Google Scholar
|
|
7
|
De Carvalho DD, You JS and Jones PA: DNA
methylation and cellular reprogramming. Trends Cell Biol.
20:609–617. 2010.PubMed/NCBI View Article : Google Scholar
|
|
8
|
Hinshaw DC and Shevde LA: The tumor
microenvironment innately modulates cancer progression. Cancer Res.
79:4557–4566. 2019.PubMed/NCBI View Article : Google Scholar
|
|
9
|
Hoxhaj G and Manning BD: The PI3K-AKT
network at the interface of oncogenic signalling and cancer
metabolism. Nat Rev Cancer. 20:74–88. 2020.PubMed/NCBI View Article : Google Scholar
|
|
10
|
Weller M, van den Bent M, Preusser M, Le
Rhun E, Tonn JC, Minniti G, Bendszus M, Balana C, Chinot O, Dirven
L, et al: EANO guidelines on the diagnosis and treatment of diffuse
gliomas of adulthood. Nat Rev Clin Oncol. 18:170–186.
2021.PubMed/NCBI View Article : Google Scholar
|
|
11
|
Xie Y, He L, Lugano R, Zhang Y, Cao H, He
Q, Chao M, Liu B, Cao Q, Wang J, et al: Key molecular alterations
in endothelial cells in human glioblastoma uncovered through
single-cell RNA sequencing. JCI Insight. 6(e150861)2021.PubMed/NCBI View Article : Google Scholar
|
|
12
|
Macosko EZ, Basu A, Satija R, Nemesh J,
Shekhar K, Goldman M, Tirosh I, Bialas AR, Kamitaki N, Martersteck
EM, et al: Highly parallel Genome-wide expression profiling of
individual cells using nanoliter droplets. Cell. 161:1202–1214.
2015.PubMed/NCBI View Article : Google Scholar
|
|
13
|
Habicht J, Mooneyham A, Shetty M, Zhang X,
Shridhar V, Winterhoff B, Zhang Y, Cepela J, Starr T, Lou E and
Bazzaro M: UNC-45A is preferentially expressed in epithelial cells
and binds to and co-localizes with interphase MTs. Cancer Biol
Ther. 20:1304–1313. 2019.PubMed/NCBI View Article : Google Scholar
|
|
14
|
Becht E, McInnes L, Healy J, Dutertre CA,
Kwok IWH, Ng LG, Ginhoux F and Newell EW: Dimensionality reduction
for visualizing single-cell data using UMAP. Nat Biotechnol: Dec 3,
2018 (Epub ahead of print) doi: 10.1038/nbt.4314.
|
|
15
|
Aran D, Looney AP, Liu L, Wu E, Fong V,
Hsu A, Chak S, Naikawadi RP, Wolters PJ, Abate AR, et al:
Reference-based analysis of lung single-cell sequencing reveals a
transitional profibrotic macrophage. Nat Immunol. 20:163–172.
2019.PubMed/NCBI View Article : Google Scholar
|
|
16
|
Livak KJ and Schmittgen TD: Analysis of
relative gene expression data using real-time quantitative PCR and
the 2(-Delta Delta C(T)) method. Methods. 25:402–408.
2001.PubMed/NCBI View Article : Google Scholar
|
|
17
|
Childs BG, Durik M, Baker DJ and van
Deursen JM: Cellular senescence in aging and age-related disease:
From mechanisms to therapy. Nat Med. 21:1424–1435. 2015.PubMed/NCBI View Article : Google Scholar
|
|
18
|
Li L, Huang Y, Gao Y, Shi T, Xu Y, Li H,
Hyytiäinen M, Keski-Oja J, Jiang Q, Hu Y and Du Z: EGF/EGFR
upregulates and cooperates with Netrin-4 to protect glioblastoma
cells from DNA damage-induced senescence. BMC Cancer.
18(1215)2018.PubMed/NCBI View Article : Google Scholar
|
|
19
|
Guo Z, Zhao Y, Wu Y, Zhang Y, Wang R, Liu
W, Zhang C and Yang X: Cellular retinol-binding protein 1: A
therapeutic and diagnostic tumor marker. Mol Biol Rep.
50:1885–1894. 2023.PubMed/NCBI View Article : Google Scholar
|
|
20
|
Yang J, Mani SA, Donaher JL, Ramaswamy S,
Itzykson RA, Come C, Savagner P, Gitelman I, Richardson A and
Weinberg RA: Twist, a master regulator of morphogenesis, plays an
essential role in tumor metastasis. Cell. 117:927–939.
2004.PubMed/NCBI View Article : Google Scholar
|
|
21
|
Yu X, He T, Tong Z, Liao L, Huang S,
Fakhouri WD, Edwards DP and Xu J: Molecular mechanisms of
TWIST1-regulated transcription in EMT and cancer metastasis. EMBO
Rep. 24(e56902)2023.PubMed/NCBI View Article : Google Scholar
|
|
22
|
Hollander MC, Sheikh MS, Bulavin DV,
Lundgren K, Augeri-Henmueller L, Shehee R, Molinaro TA, Kim KE,
Tolosa E, Ashwell JD, et al: Genomic instability in
Gadd45a-deficient mice. Nat Genet. 23:176–184. 1999.PubMed/NCBI View Article : Google Scholar
|
|
23
|
Qiu W, David D, Zhou B, Chu PG, Zhang B,
Wu M, Xiao J, Han T, Zhu Z, Wang T, et al: Down-regulation of
growth arrest DNA damage-inducible gene 45beta expression is
associated with human hepatocellular carcinoma. Am J Pathol.
162:1961–1974. 2003.PubMed/NCBI View Article : Google Scholar
|
|
24
|
Wang W, Huper G, Guo Y, Murphy SK, Olson
JA Jr and Marks JR: Analysis of methylation-sensitive transcriptome
identifies GADD45a as a frequently methylated gene in breast
cancer. Oncogene. 24:2705–2714. 2005.PubMed/NCBI View Article : Google Scholar
|
|
25
|
Li Y, Song X, Liu L and Yue L: NUAK2
silencing inhibits the proliferation, migration and
epithelial-to-mesenchymal transition of cervical cancer cells via
upregulating CYFIP2. Mol Med Rep. 24(817)2021.PubMed/NCBI View Article : Google Scholar
|
|
26
|
Namiki T, Yaguchi T, Nakamura K, Valencia
JC, Coelho SG, Yin L, Kawaguchi M, Vieira WD, Kaneko Y, Tanemura A,
et al: NUAK2 amplification coupled with PTEN deficiency promotes
melanoma development via CDK activation. Cancer Res. 75:2708–2715.
2015.PubMed/NCBI View Article : Google Scholar
|
|
27
|
Tang L, Tong SJ, Zhan Z, Wang Q, Tian Y
and Chen F: Expression of NUAK2 in gastric cancer tissue and its
effects on the proliferation of gastric cancer cells. Exp Ther Med.
13:676–680. 2017.PubMed/NCBI View Article : Google Scholar
|
|
28
|
Wang R, Su D, Liu Y, Huang H, Qiu J, Cao
Z, Yang G, Chen H, Luo W, Tao J, et al: The NF-kappaB/NUAK2
signaling axis regulates pancreatic cancer progression by targeting
SMAD2/3. iScience. 27(109406)2024.PubMed/NCBI View Article : Google Scholar
|
|
29
|
Wu CS, Lu YJ, Li HP, Hsueh C, Lu CY, Leu
YW, Liu HP, Lin KH, Hui-Ming Huang T and Chang YS: Glutamate
receptor, ionotropic, kainate 2 silencing by DNA hypermethylation
possesses tumor suppressor function in gastric cancer. Int J
Cancer. 126:2542–2552. 2010.PubMed/NCBI View Article : Google Scholar
|
|
30
|
Sanai N, Li J, Boerner J, Stark K, Wu J,
Kim S, Derogatis A, Mehta S, Dhruv HD, Heilbrun LK, et al: Phase 0
Trial of AZD1775 in First-recurrence glioblastoma patients. Clin
Cancer Res. 24:3820–3828. 2018.PubMed/NCBI View Article : Google Scholar
|
|
31
|
Li C, Zheng J, Chen S, Huang B, Li G, Feng
Z, Wang J and Xu S: RRM2 promotes the progression of human
glioblastoma. J Cell Physiol. 233:6759–6767. 2018.PubMed/NCBI View Article : Google Scholar
|
|
32
|
Aarts M, Sharpe R, Garcia-Murillas I,
Gevensleben H, Hurd MS, Shumway SD, Toniatti C, Ashworth A and
Turner NC: Forced mitotic entry of S-phase cells as a therapeutic
strategy induced by inhibition of WEE1. Cancer Discov. 2:524–539.
2012.PubMed/NCBI View Article : Google Scholar
|
|
33
|
Xiao Y, Li M, Ma T, Ning H and Liu L:
AMG232 inhibits angiogenesis in glioma through the p53-RBM4-VEGFR2
pathway. J Cell Sci. 136(jcs260270)2023.PubMed/NCBI View Article : Google Scholar
|
|
34
|
Zhao Y, Chen Y, Wei L, Ran J, Wang K, Zhu
S and Liu Q: p53 inhibits the Urea cycle and represses polyamine
biosynthesis in glioma cell lines. Metab Brain Dis. 38:1143–1153.
2023.PubMed/NCBI View Article : Google Scholar
|
|
35
|
Herranz N and Gil J: Mechanisms and
functions of cellular senescence. J Clin Invest. 128:1238–1246.
2018.PubMed/NCBI View Article : Google Scholar
|
|
36
|
Ryan MB and Corcoran RB: Therapeutic
strategies to target RAS-mutant cancers. Nat Rev Clin Oncol.
15:709–720. 2018.PubMed/NCBI View Article : Google Scholar
|
|
37
|
Zuchegna C, Leone S, Romano A, Porcellini
A and Messina S: KRAS is a molecular determinant of platinum
responsiveness in glioblastoma. BMC Cancer. 24(77)2024.PubMed/NCBI View Article : Google Scholar
|
|
38
|
Chen Z, Yan X, Miao C, Liu L, Liu S, Xia
Y, Fang W, Zheng D and Luo Q: Targeting MYH9 represses
USP14-mediated NAP1L1 deubiquitination and cell proliferation in
glioma. Cancer Cell Int. 23(220)2023.PubMed/NCBI View Article : Google Scholar
|
|
39
|
Stine ZE, Walton ZE, Altman BJ, Hsieh AL
and Dang CV: MYC, Metabolism, and Cancer. Cancer Discov.
5:1024–1039. 2015.PubMed/NCBI View Article : Google Scholar
|
|
40
|
Qiu X, Li Y and Zhang Z: Crosstalk between
oxidative phosphorylation and immune escape in cancer: A new
concept of therapeutic targets selection. Cell Oncol (Dordr).
46:847–865. 2023.PubMed/NCBI View Article : Google Scholar
|
|
41
|
Ashton TM, McKenna WG, Kunz-Schughart LA
and Higgins GS: Oxidative phosphorylation as an emerging target in
cancer therapy. Clin Cancer Res. 24:2482–2490. 2018.PubMed/NCBI View Article : Google Scholar
|
|
42
|
Kuo CL, Ponneri Babuharisankar A, Lin YC,
Lien HW, Lo YK, Chou HY, Tangeda V, Cheng LC, Cheng AN and Lee AY:
Mitochondrial oxidative stress in the tumor microenvironment and
cancer immunoescape: Foe or friend? J Biomed Sci.
29(74)2022.PubMed/NCBI View Article : Google Scholar
|
|
43
|
Mun JY, Leem SH, Lee JH and Kim HS: Dual
relationship between stromal cells and immune cells in the tumor
microenvironment. Front Immunol. 13(864739)2022.PubMed/NCBI View Article : Google Scholar
|
|
44
|
Deng Y, Chen Q, Wan C, Sun Y, Huang F, Hu
Y and Yang K: Microglia and macrophage metabolism: A regulator of
cerebral gliomas. Cell Biosci. 14(49)2024.PubMed/NCBI View Article : Google Scholar
|
|
45
|
Li C, Jiang P, Wei S, Xu X and Wang J:
Regulatory T cells in tumor microenvironment: New mechanisms,
potential therapeutic strategies and future prospects. Mol Cancer.
19(116)2020.PubMed/NCBI View Article : Google Scholar
|
|
46
|
Feng B, Wu J, Shen B, Jiang F and Feng J:
Cancer-associated fibroblasts and resistance to anticancer
therapies: Status, mechanisms, and countermeasures. Cancer Cell
Int. 22(166)2022.PubMed/NCBI View Article : Google Scholar
|
|
47
|
Borst R, Meyaard L and Pascoal Ramos MI:
Understanding the matrix: Collagen modifications in tumors and
their implications for immunotherapy. J Transl Med.
22(382)2024.PubMed/NCBI View Article : Google Scholar
|
|
48
|
Wei R, Zhou J, Bui B and Liu X: Glioma
actively Orchestrate a self-advantageous extracellular matrix to
promote recurrence and progression. BMC Cancer.
24(974)2024.PubMed/NCBI View Article : Google Scholar
|
|
49
|
Ellert-Miklaszewska A, Poleszak K,
Pasierbinska M and Kaminska B: Integrin signaling in glioma
pathogenesis: From biology to therapy. Int J Mol Sci.
21(888)2020.PubMed/NCBI View Article : Google Scholar
|
|
50
|
Wu M, Huang Q, Xie Y, Wu X, Ma H, Zhang Y
and Xia Y: Improvement of the anticancer efficacy of PD-1/PD-L1
blockade via combination therapy and PD-L1 regulation. J Hematol
Oncol. 15(24)2022.PubMed/NCBI View Article : Google Scholar
|
|
51
|
Pulanco MC, Madsen AT, Tanwar A, Corrigan
DT and Zang X: Recent advancements in the B7/CD28 immune checkpoint
families: New biology and clinical therapeutic strategies. Cell Mol
Immunol. 20:694–713. 2023.PubMed/NCBI View Article : Google Scholar
|
|
52
|
Vidyarthi A, Agnihotri T, Khan N, Singh S,
Tewari MK, Radotra BD, Chatterjee D and Agrewala JN: Predominance
of M2 Macrophages in gliomas leads to the suppression of local and
systemic immunity. Cancer Immunol Immunother. 68:1995–2004.
2019.PubMed/NCBI View Article : Google Scholar
|
|
53
|
Ravi VM, Neidert N, Will P, Joseph K,
Maier JP, Kückelhaus J, Vollmer L, Goeldner JM, Behringer SP,
Scherer F, et al: T-cell dysfunction in the glioblastoma
microenvironment is mediated by myeloid cells releasing
interleukin-10. Nat Commun. 13(925)2022.PubMed/NCBI View Article : Google Scholar
|
|
54
|
Puviindran BJ, Wallace S, Ayasoufi K,
Lerner E and Fecci PE: Within and beyond the tumor: Mechanisms of
glioblastoma-induced immunosuppression. Neurooncol Adv. 7 (Suppl
4):iv4–iv18. 2025.PubMed/NCBI View Article : Google Scholar
|
|
55
|
Zajac A, Sumorek-Wiadro J, Langner E,
Wertel I, Maciejczyk A, Pawlikowska-Pawlęga B, Pawelec J, Wasiak M,
Hułas-Stasiak M, Bądziul D, et al: Involvement of PI3K pathway in
glioma cell resistance to temozolomide treatment. Int J Mol Sci.
22(5155)2021.PubMed/NCBI View Article : Google Scholar
|
|
56
|
Meng J, Qian W, Yang Z, Gong L, Xu D,
Huang H, Jiang X, Pu Z, Yin Y and Zou J: p53/E2F7 axis promotes
temozolomide chemoresistance in glioblastoma multiforme. BMC
Cancer. 24(317)2024.PubMed/NCBI View Article : Google Scholar
|
|
57
|
Perrault EN, Shireman JM, Ali ES, Lin P,
Preddy I, Park C, Budhiraja S, Baisiwala S, Dixit K, James CD, et
al: Ribonucleotide reductase regulatory subunit M2 drives
glioblastoma TMZ resistance through modulation of dNTP production.
Sci Adv. 9(eade7236)2023.PubMed/NCBI View Article : Google Scholar
|
|
58
|
Pokorny JL, Calligaris D, Gupta SK,
Iyekegbe DO Jr, Mueller D, Bakken KK, Carlson BL, Schroeder MA,
Evans DL, Lou Z, et al: The efficacy of the wee1 inhibitor MK-1775
combined with temozolomide is limited by heterogeneous distribution
across the Blood-brain barrier in glioblastoma. Clin Cancer Res.
21:1916–1924. 2015.PubMed/NCBI View Article : Google Scholar
|
|
59
|
Hussain SF, Yang D, Suki D, Aldape K,
Grimm E and Heimberger AB: The role of human glioma-infiltrating
microglia/macrophages in mediating antitumor immune responses.
Neuro Oncol. 8:261–279. 2006.PubMed/NCBI View Article : Google Scholar
|
|
60
|
Quail DF and Joyce JA: The
microenvironmental landscape of brain tumors. Cancer Cell.
31:326–341. 2017.PubMed/NCBI View Article : Google Scholar
|
|
61
|
Deng R, Qin J, Wang L, Li H, Wen N, Qin K,
Dong J, Wu J, Zhu D and Sun X: Energy metabolism-related GLUD1
contributes to favorable clinical outcomes of IDH-mutant glioma.
BMC Neurol. 24(344)2024.PubMed/NCBI View Article : Google Scholar
|
|
62
|
Familiari P, Lapolla P, Picotti V,
Palmieri M, Pesce A, Carosi G, Relucenti M, Nottola S, Gianno F,
Minasi S, et al: Role of 1p/19q codeletion in diffuse Low-grade
glioma tumour prognosis. Anticancer Res. 43:2659–2670.
2023.PubMed/NCBI View Article : Google Scholar
|
|
63
|
Mansouri A, Hachem LD, Mansouri S, Nassiri
F, Laperriere NJ, Xia D, Lindeman NI, Wen PY, Chakravarti A, Mehta
MP, et al: MGMT promoter methylation status testing to guide
therapy for glioblastoma: Refining the approach based on emerging
evidence and current challenges. Neuro Oncol. 21:167–178.
2019.PubMed/NCBI View Article : Google Scholar
|