Introduction
Fatty liver is a condition of excessive triglyceride
accumulation inside hepatocytes. Known risk factors for fatty liver
include excessive alcohol consumption, insulin
resistance/lifestyle-related diseases, abnormal lipid metabolism
and endocrine disorders (1,2). Among these, non-alcoholic fatty liver
disease (NAFLD) refers to fatty liver due to excessive alcohol
consumption. Of NAFLD cases, 80-90% of affected patients have
NAFLD, while the remaining 10-20% have non-alcoholic
steatohepatitis (NASH), which gradually deteriorates into fatty
degeneration, inflammatory cell infiltration and balloon-like
degeneration. If left untreated for a long period of time, the
disease may quietly progress into fibrosis and may increase the
risk of developing cirrhosis or hepatocellular carcinoma (3,4). Fat
droplet accumulation in hepatocytes is one of the factors involved
in both conditions, and understanding the mechanisms of fat droplet
formation is critical for the prevention of fatty liver.
A model for intracellular fat droplet formation
includes the method of treating 3T3-L1 mouse fibroblasts with
insulin, isobutylmethylxanthine or dexamethasone to induce
adipocyte differentiation (5).
Treatment of the liver cancer cell line, HepG2, with oleic acid
leads to the formation of intracellular fat droplets and can be
used to study the mechanisms of fat droplet accumulation (6). These models are critical in
vitro models for understanding the mechanisms of fat droplet
formation.
In general, fat droplet formation in cells involve
the endoplasmic reticulum. First, triglyceride synthase, which is
present in the endoplasmic reticulum membrane in the cell,
synthesizes triglycerides in the endoplasmic reticulum membrane and
triglycerides accumulate to form the fat droplet lens (7). Gradually, the triglyceride lenses bud
to the cytoplasmic side and separate from the endoplasmic reticulum
membrane, causing fat droplet accumulation in the cytoplasm, which
becomes fat droplets (7). One of the
molecules associated with these fat droplet formations is Seipin,
which contributes to their budding to the cytoplasmic side by
preventing their budding to the lumenal side of the endoplasmic
reticulum (8). However, fat droplet
formation indicates the involvement of a number of other molecules.
The present study used an in vitro fatty liver formation
model of the liver cancer cell line, HepG2, to comprehensively
search for fat droplet formation-related genes whose expression
changes during fat droplet formation.
Materials and methods
Cells and cell culture
Adipogenesis was performed in vitro using the
liver cancer cell line, HepG2. The Japanese Collection of Research
Bioresources provided the HepG2 cells (JCRB1054; https://cellbank.nibiohn.go.jp/~cellbank/en/search_res_det.cgi?ID=2936),
and Dulbecco's modified Eagle's medium (FUJIFILM Wako Pure Chemical
Corporation) with 10% fetal bovine serum and antibiotics, including
penicillin and streptomycin was used to culture the HepG2 cells.
The cells were cultured at 37˚C in 5% CO2.
Oleic acid solution
Bovine serum albumin (BSA) (FUJIFILM Wako Pure
Chemical Corporation) was prepared by dissolving in 0.1 mol/l
Tris-HCl (FUJIFILM Wako Pure Chemical Corporation) (pH 8.0) to a
concentration of 5% and filtered through a 0.22-µm filter for
sterilization. Oleic acid (FUJIFILM Wako Pure Chemical Corporation)
was dissolved in 5% BSA solution to prepare 4 mM oleic acid
solution. Oleic acid use solution was diluted to 0, 50, 200 and 500
µM with the aforementioned culture medium.
Oil Red O staining solution
Oil Red O powder (FUJIFILM Wako Pure Chemical
Corporation) was dissolved at 0.15 g with 50 ml isopropanol
(FUJIFILM Wako Pure Chemical Corporation) to prepare the Oil Red O
preservation solution. A total of 20 ml distilled water were added
to 30 ml Oil Red O preservation solution, followed by incubation
for 10 min, and filtering through a 0.22-µm filter. This filtrate
was used as an Oil Red O staining solution.
Oleic acid treatment and Oil Red O
staining of HepG2 cells
The HepG2 cells were seeded at 5x10³
cells/well in eight-well chamber slides and cultured at 37˚C in 5%
CO2. The culture medium containing 0, 50, 200 or 500 µM
of oleic acid was used to replace the culture medium after 72 h
followed by incubation at 37˚C in 5% CO2 for 24 h.
Subsequently, the culture medium was discarded and the cells
incubated with 4% paraformaldehyde (FUJIFILM Wako Pure Chemical
Corporation) at room temperature for 30 min. Glass slides was
washed three times with Dulbecco's phosphate-buffered saline
(D-PBS) (-) (FUJIFILM Wako Pure Chemical Corporation). A drop of
Oil Red O stain was added to each well followed by incubation at
60˚C for 10 min. The glass slides were then washed twice with D-PBS
(-) and sealed with water-soluble sealant (Nichirei Biosciences).
Cell counts and fat droplet areas in the images were analyzed using
ImageJ version 1.52r (National Institutes of Health).
Total RNA extraction
The HepG2 cells were seeded at 1x10⁵
cells/well in six-well plates and incubated at 37˚C in 5%
CO2. The culture medium was replaced with 0, 50, 200 or
500 µM oleic acid after 72 h and the cells were incubated at 37˚C
in 5% CO2 for 24 h. Total RNA was then extracted used
the RNeasy Mini kit (Qiagen, Inc.) following the manufacturer's
instructions. A NanoDrop spectrophotometer (NanoDrop Technologies;
Thermo Fisher Scientific, Inc.) was used to assess the quality and
concentration of total RNA. All RNA samples demonstrated 260/280-nm
absorbance ratios of 1.8-2.0. An Agilent 2100 Bioanalyzer and an
Agilent RNA 6000 Pico Kit (Agilent Technologies, Inc.) confirmed
the peaks of total RNAs, following the manufacturer's
instructions.
Microarray analysis
In a previous study (9), the authors performed microarray
analysis using 150 ng liver total RNA. Screening was performed for
genes whose expression varied by >2.0-fold when treated with any
oleic acid concentration compared to the untreated control. The
obtained microarray data were registered with Gene Expression
Omnibus (GSE248166). Furthermore, NetworkAnalyst (https://www.networkanalyst.ca/) was used to
estimate the genes associated with fatty liver.
Reverse transcription-quantitative
polymerase chain reaction (RT-qPCR)
The expression levels of human perilipin
(PLIN) family (PLIN1, PLIN2, PLIN3,
PLIN4 and PLIN5) and glyceraldehyde-3-phosphate
dehydrogenase (GAPDH) mRNAs in HepG2 cells were examined
using qPCR. cDNA was synthesized from 20 ng/µl total RNA using the
Applied Biosystems™ High Capacity cDNA Reverse
Transcription kit (Thermo Fisher Scientific, Inc.) according to the
manufacturer's instructions. qPCR was performed using a FastStart
Universal SYBR-Green Master (MilliporeSigma), 10 µM forward and
reverse primer pairs (Tables I and
S1), and the StepOne Plus Real-time
PCR system (Thermo Fisher Scientific, Inc.) under the following
conditions: 10 min at 95˚C, followed by 40 cycles each of 95˚C for
15 sec, and 60˚C for 60 sec. GAPDH was used as an internal
control. The quantification of gene expression was calculated using
the 2-ΔΔCq method based on previous reports (10-12).
 | Table IPrimer pairs used for reverse
transcription-quantitative PCR. |
Table I
Primer pairs used for reverse
transcription-quantitative PCR.
| Primer | Sequence (5' to
3') | Amplicon size
(bp) |
|---|
| PLIN2
forward |
TCAGCTCCATTCTACTGTTCACC | 74 |
| PLIN2
reverse |
CCTGAATTTTCTGATTGGCACT | |
| GAPDH
forward |
AGCCACATCGCTCAGACAC | 66 |
| GAPDH
reverse |
GCCCAATACGACCAAATCC | |
Statistical analysis
All statistical analyses were performed using
Statcel 3 software (OMS Publishing Inc.). A one-way analysis of
variance was performed followed by Tukey-Kramer post hoc analysis
to compare the results of the three groups. P-values
<0.05 were considered to indicate statistically significant
differences.
Results
Fat droplet formation induced by
treatment with oleic acid in HepG2 cells
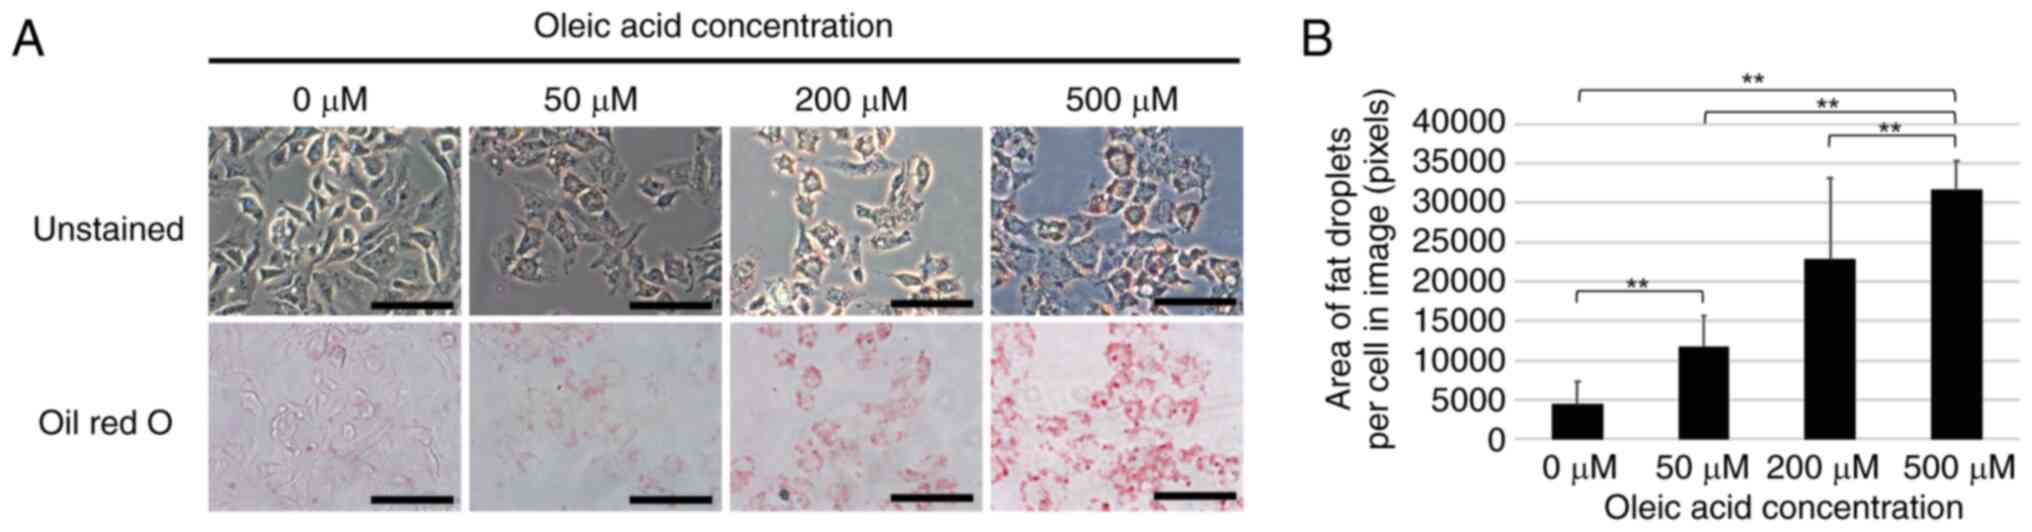
A model of fat droplet formation was established by
treatment of the HepG2 cells with oleic acid in an aim to elucidate
the mechanisms of fat droplet formation in NAFLD. Oleic acid was
added at final concentrations of 0, 50, 200 or 500 µM to the
culture medium of HepG2 cells and Oil Red O staining was performed
following 24 h of culture. The results revealed a
concentration-dependent increase in the number of fat droplets in
the cells treated with oleic acid (Fig.
1).
Changes in gene expression during fat
droplet formation induced by oleic acid treatment
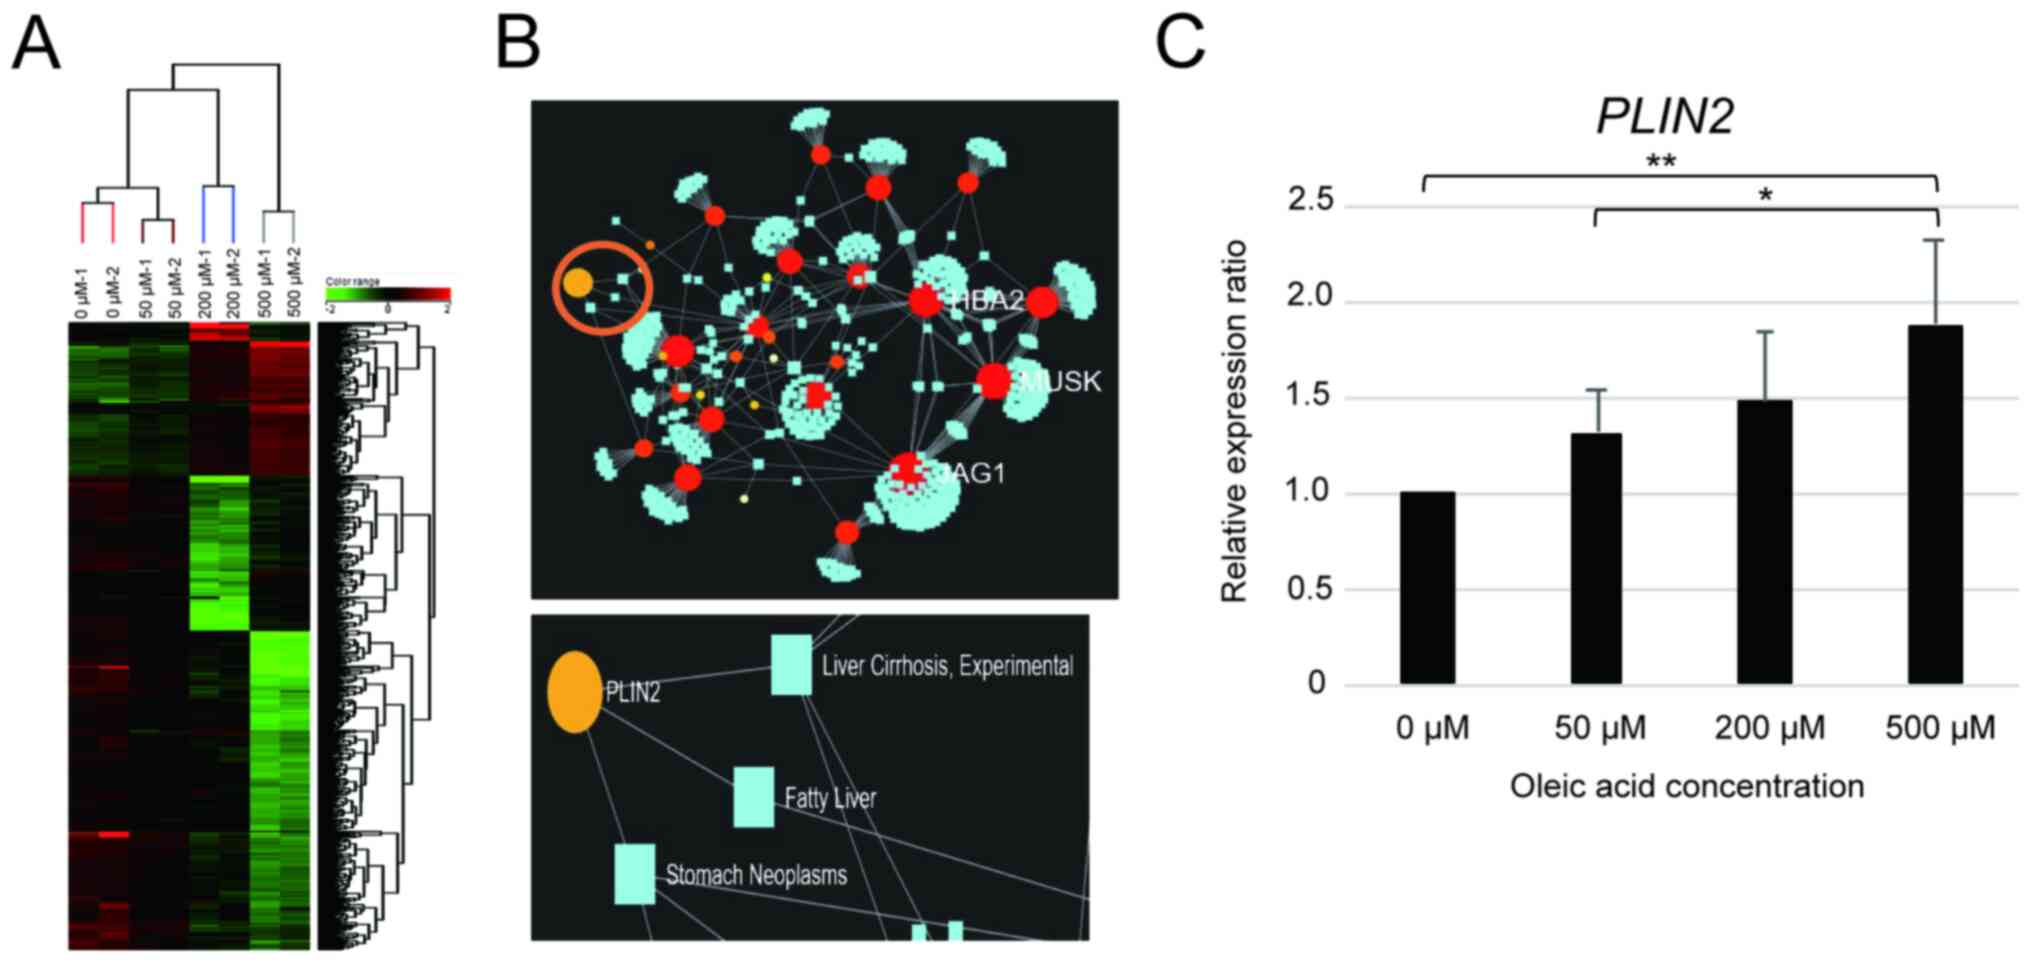
A microarray analysis was performed on the HepG2
cells 24 h following treatment with the respective oleic acid
concentrations to determine the changes in gene expression that
occur during lipid droplet formation. The genes whose expression
increased by >2.0-fold in the cells treated with 50, 200 or 500
µM compared to 0 µM oleic acid accounted for 142, while the number
of genes whose expression decreased was 426 (Fig. 2A). These results revealed that oleic
acid treatment induced various changes in gene expression in HepG2
cells.
NetworkAnalyst was used to estimate and determine
the genes associated with NAFLD among the genes which exhibited a
variable expression in the oleic acid-treated HepG2 cells. The
PLIN2 gene was found to be associated with ‘fatty liver’ and
‘liver cirrhosis’ (Fig. 2B).
Additionally, PLIN2 expression in the HepG2 cells exhibited
a concentration-dependent increase following treatment with oleic
acid (Fig. 2C). However, there was
no statistically significant difference in the levels of
PLIN1, PLIN3 and PLIN4 in the HepG2 cells
treated with oleic acid. Of note, PLIN5 expression exhibited
a significant decrease in the cells treated with oleic acid
(Fig. S1). These results indicate
the association between PLIN2 and the development of
NAFLD.
Discussion
NASH is a condition of NAFLD characterized by fatty
degeneration, inflammatory cell infiltration and balloon-like
degeneration (13); however, the
mechanisms responsible for fat droplet formation in fatty
degeneration remain unknown. Therefore, the present study used an
experimental cell model of fat droplet formation by using HepG2
liver cancer cells treated with oleic acid. Oleic acid is a
cis-unsaturated fatty acid and is used as a model for fat
droplet formation as it is less toxic and more sensitive to
cholesterol acyltransferases and diacylglycerol acyltransferases
that are involved in fat droplet formation than other saturated and
trans fatty acids (14,15). In the present study, treatment of the
HepG2 cells with oleic acid induced a concentration-dependent
increase in the number of fat droplets (Fig. 1). It was also revealed various gene
expression changes that occurred in HepG2 cells treated with
various concentrations of oleic acid in an aim to identify genes
involved in fat droplet formation. Network analysis identified
PLIN2 as a gene associated with fatty liver and cirrhosis
(Fig. 2B), and its expression
increased with the increasing number of fat droplets (Fig. 2C). These results indicate that
PLIN2 plays a critical role in fat droplet formation.
PLIN2 is one of the five PLIN family
members; it exists as a protein that binds to fat droplet surfaces,
and it plays a role in stabilizing fat droplets by interfering with
the breakdown of triglycerides by enzymes (16,17). A
previous study examining the distribution of the PLIN family
in the body revealed that all PLIN family members were
expressed in the majority of organs, and were particularly
overexpressed in adipocytes and mammary glands, as well as in the
liver (18). The present study also
examined the expression of not only the PLIN2 gene, but also
that of the PLIN1, PLIN3, PLIN4, and
PLIN5 genes during lipid droplet formation using RT-qPCR,
and found that only PLIN2 expression was increased in a
concentration-dependent manner following oleic acid treatment in
this model of fat droplet formation (Figs. 1 and S1). On the other hand, PLIN5
expression was significantly downregulated by oleic acid treatment.
This suggests that PLIN2 plays a crucial role in lipid
droplet formation induced by oleate treatment and PLIN5
plays an antagonistic role. To the best of our knowledge, to date,
no previous studies have focused on changes in PLIN family
expression in a model of fat droplet formation induced by the oleic
acid treatment of HepG2 cells, and the present study is the first
to demonstrate that PLIN2 and PLIN5 exhibit opposite
expression patterns. Recently, Jin et al (19) demonstrated that the overexpression of
PLIN2 in HepG2 cells decreased PLIN5 expression,
while the knockdown of PLIN2 increased PLIN5
expression. This suggests that an increased PLIN2 expression
in HepG2 cells may be associated with a decreased PLIN5
expression. However, the functional association between
PLIN2 and PLIN5 in fat droplet formation remains
unclear and warrants further investigation. In addition, microarray
analysis was performed on a small number of samples in the present
study, and statistical analysis was not sufficient. Although
changes in the expression of PLIN2 and other PLIN
family members could be reproduced by RT-qPCR, it is necessary to
confirm the expression of other genes individually using RT-qPCR or
other methods.
Several studies have reported the association
between PLIN2 and liver diseases, and its involvement in
fatty liver has been reported in in vivo analysis, since
PLIN2 is closely related to fat droplet accumulation in the
liver. Nocetti et al (20)
reported that hepatocytes from mice with NAFLD induced by a
high-fat diet exhibited an increase in Plin2 expression
along with highly oxidized fat droplets. Griffin et al
(21) also demonstrated that
diet-induced hepatic lipidosis was ameliorated in liver-specific
Plin2 knockout mice. This suggests that Plin2 is
associated with NASH/NAFLD. On the other hand, Mak et al
(22) demonstrated that alcohol
consumption in rats induced a renewal of Plin2 expression.
Carr et al (23) indicated
that alcohol consumption in Plin2 knockout mice suppressed
the development of fatty liver. These reports indicate that
PLIN2 contributes to the development of fatty liver by
increasing PLIN2 expression in the liver, regardless of
alcohol intake. Notably, there is a single nucleotide polymorphism
in human PLIN2, and Faulkner et al (24) reported that humans carrying the
rs35568725 mutant allele encoding Ser251Pro are at an increased
risk of developing NASH. Recently, PLIN2 was highlighted as
a potential therapeutic target for NASH/NAFLD (25). In the future, it is hoped that the
pharmacological suppression of PLIN2 will lead to the
development of novel therapies which can be used combat fatty liver
disease.
Supplementary Material
Changes in PLIN1, PLIN3,
PLIN4 and PLIN5 expression during fat droplet
formation induced by oleic acid treatment. (A-D) PLIN1,
PLIN3, PLIN4 and PLIN5 expression analysis in
oleic acid-treated HepG2 cells. Values are presented as the mean ±
2 SD (n=3). *P<0.05. PLIN, perilipin.
Primer pairs used for reverse
transcription quantitative PCR.
Acknowledgements
Not applicable.
Funding
Funding: The present study was supported in part by The JSPS
KAKENHI (grant nos. 21H04844 and 20K21692).
Availability of data and materials
The datasets used and/or analyzed during the present
study are available from the corresponding author upon reasonable
request. The obtained microarray data were registered with Gene
Expression Omnibus (GSE248166).
Authors' contributions
MC was a major contributor in performing the
experiments and in writing the manuscript. YO, KM and CT assisted
in conducting the experiments. MC and KM confirm the authenticity
of all the raw data. All authors have read and approved the final
manuscript.
Ethics approval and consent to
participate
Not applicable.
Patient consent for publication
Not applicable.
Competing interests
The authors declare that they have no competing
interests.
References
|
1
|
Zhu B, Chan SL, Li J, Li K, Wu H, Cui K
and Chen H: Non-alcoholic steatohepatitis pathogenesis, diagnosis,
and treatment. Front Cardiovasc Med. 8(742382)2021.PubMed/NCBI View Article : Google Scholar
|
|
2
|
Dufour JF, Anstee QM, Bugianesi E,
Harrison S, Loomba R, Paradis V, Tilg H, Wong VW and Zelber-Sagi S:
Current therapies and new developments in NASH. Gut. 71:2123–2134.
2022.PubMed/NCBI View Article : Google Scholar
|
|
3
|
Shah PA, Patil R and Harrison SA:
NAFLD-related hepatocellular carcinoma: The growing challenge.
Hepatology. 77:323–338. 2023.PubMed/NCBI View Article : Google Scholar
|
|
4
|
Santos JPMD, Maio MC, Lemes MA, Laurindo
LF, Haber JFDS, Bechara MD, Prado PSD Jr, Rauen EC, Costa F,
Pereira BCA, et al: Non-alcoholic steatohepatitis (NASH) and
organokines: What is now and what will be in the future. Int J Mol
Sci. 23(498)2022.PubMed/NCBI View Article : Google Scholar
|
|
5
|
Zeigerer A, Rodeheffer MS, McGraw TE and
Friedman JM: Insulin regulates leptin secretion from 3T3-L1
adipocytes by a PI 3 kinase independent mechanism. Exp Cell Res.
314:2249–2256. 2008.PubMed/NCBI View Article : Google Scholar
|
|
6
|
Tie F, Ding J, Hu N, Dong Q, Chen Z and
Wang H: Kaempferol and kaempferide attenuate oleic acid-induced
lipid accumulation and oxidative stress in HepG2 cells. Int J Mol
Sci. 22(8847)2021.PubMed/NCBI View Article : Google Scholar
|
|
7
|
Scorletti E and Carr RM: A new perspective
on NAFLD: Focusing on lipid droplets. J Hepatol. 76:934–945.
2022.PubMed/NCBI View Article : Google Scholar
|
|
8
|
Nettebrock NT and Bohnert M: Born this
way-Biogenesis of lipid droplets from specialized ER subdomains.
Biochim Biophys Acta Mol Cell Biol Lipids.
1865(158448)2020.PubMed/NCBI View Article : Google Scholar
|
|
9
|
Chiba M, Kubota S, Sato K and Monzen S:
Exosomes released from pancreatic cancer cells enhance angiogenic
activities via dynamin-dependent endocytosis in endothelial cells
in vitro. Sci Rep. 8(11972)2018.PubMed/NCBI View Article : Google Scholar
|
|
10
|
Chiba M, Kimura M and Asari S: Exosomes
secreted from human colorectal cancer cell lines contain mRNAs,
microRNAs and natural antisense RNAs, that can transfer into the
human hepatoma HepG2 and lung cancer A549 cell lines. Oncol Rep.
28:1551–1558. 2012.PubMed/NCBI View Article : Google Scholar
|
|
11
|
Chiba M: Differential expression of
natural antisense transcripts during liver development in embryonic
mice. Biomed Rep. 2:918–922. 2014.PubMed/NCBI View Article : Google Scholar
|
|
12
|
Livak KJ and Schmittgen TD: Analysis of
relative gene expression data using real-time quantitative PCR and
the 2(-Delta Delta C(T)) method. Methods. 25:402–408.
2001.PubMed/NCBI View Article : Google Scholar
|
|
13
|
Alonso-Peña M, Del Barrio M,
Peleteiro-Vigil A, Jimenez-Gonzalez C, Santos-Laso A, Arias-Loste
MT, Iruzubieta P and Crespo J: Innovative therapeutic approaches in
non-alcoholic fatty liver disease: When knowing your patient is
key. Int J Mol Sci. 24(10718)2023.PubMed/NCBI View Article : Google Scholar
|
|
14
|
Gómez-Lechón MJ, Donato MT,
Martínez-Romero A, Jiménez N, Castell JV and O'Connor JE: A human
hepatocellular in vitro model to investigate steatosis. Chem Biol
Interact. 165:106–116. 2007.PubMed/NCBI View Article : Google Scholar
|
|
15
|
Campos-Espinosa A and Guzmán C: A model of
experimental steatosis in vitro: Hepatocyte cell culture in lipid
overload-conditioned medium. J Vis Exp. 171(e62543)2021.PubMed/NCBI View
Article : Google Scholar
|
|
16
|
Okumura T: Role of lipid droplet proteins
in liver steatosis. J Physiol Biochem. 67:629–636. 2011.PubMed/NCBI View Article : Google Scholar
|
|
17
|
Pereira-Dutra FS and Bozza PT: Lipid
droplets diversity and functions in inflammation and immune
response. Expert Rev Proteomics. 18:809–825. 2021.PubMed/NCBI View Article : Google Scholar
|
|
18
|
Fagerberg L, Hallström BM, Oksvold P,
Kampf C, Djureinovic D, Odeberg J, Habuka M, Tahmasebpoor S,
Danielsson A, Edlund K, et al: Analysis of the human
tissue-specific expression by genome-wide integration of
transcriptomics and antibody-based proteomics. Mol Cell Proteomics.
13:397–406. 2014.PubMed/NCBI View Article : Google Scholar
|
|
19
|
Jin Y, Tan Y, Chen L, Liu Y and Ren Z:
Reactive oxygen species induces lipid droplet accumulation in HepG2
cells by increasing perilipin 2 expression. Int J Mol Sci.
19(3445)2018.PubMed/NCBI View Article : Google Scholar
|
|
20
|
Nocetti D, Espinosa A, Pino-De la Fuente
F, Sacristán C, Bucarey JL, Ruiz P, Valenzuela R, Chouinard-Watkins
R, Pepper I, Troncoso R and Puente L: Lipid droplets are both
highly oxidized and Plin2-covered in hepatocytes of diet-induced
obese mice. Appl Physiol Nutr Metab. 45:1368–1376. 2020.PubMed/NCBI View Article : Google Scholar
|
|
21
|
Griffin JD, Bejarano E, Wang XD and
Greenberg AS: Integrated action of autophagy and adipose tissue
triglyceride lipase ameliorates diet-induced hepatic steatosis in
liver-specific PLIN2 knockout mice. Cells. 10(1016)2021.PubMed/NCBI View Article : Google Scholar
|
|
22
|
Mak KM, Ren C, Ponomarenko A, Cao Q and
Lieber CS: Adipose differentiation-related protein is a reliable
lipid droplet marker in alcoholic fatty liver of rats. Alcohol Clin
Exp Res. 32:683–689. 2008.PubMed/NCBI View Article : Google Scholar
|
|
23
|
Carr RM, Peralta G, Yin X and Ahima RS:
Absence of perilipin 2 prevents hepatic steatosis, glucose
intolerance and ceramide accumulation in alcohol-fed mice. PLoS
One. 9(e97118)2014.PubMed/NCBI View Article : Google Scholar
|
|
24
|
Faulkner CS, White CM, Shah VH and Jophlin
LL: A single nucleotide polymorphism of PLIN2 is associated with
nonalcoholic steatohepatitis and causes phenotypic changes in
hepatocyte lipid droplets: A pilot study. Biochim Biophys Acta Mol
Cell Biol Lipids. 1865(158637)2020.PubMed/NCBI View Article : Google Scholar
|
|
25
|
Teixeira FS, Pimentel LL, Pintado ME and
Rodríguez-Alcalá LM: Impaired hepatic lipid metabolism and
biomarkers in fatty liver disease. Biochimie. 215:69–74.
2023.PubMed/NCBI View Article : Google Scholar
|