Introduction
Colorectal cancer is the third most frequently
diagnosed cancer in males and the second most commonly diagnosed
cancer in females, with over 1.2 million new cases and 608,700
deaths estimated to have occurred in 2008 worldwide (1). Early detection is essential for the
successful diagnosis and treatment of CRC as well as for increasing
the survival rate of CRC patients (2–4).
Unfortunately, there are no significant clinical symptoms at an
early stage making it difficult to provide effective diagnostic
proposals for CRC patients (5).
The existing diagnostic methods for CRC include fecal occult blood
test, colonoscopy and carcinoembryonic antigen, but their
sensitivity and accuracy is inadequate (6–9).
Therefore, it is essential to identify novel serum biomarkers for
CRC with high sensitivity and specificity.
Surface-enhanced laser desorption/ionization
time-of-flight mass spectrometry (SELDI-TOF-MS) and matrix-assisted
laser desorption/ionization time-of-flight mass spectrometry
(MALDI-TOF-MS) are high throughput techniques for the analysis of
complex biological specimens with high sensitivity and specificity
(10,11). SELDI-TOF-MS combined with
ProteinChip technology has been used to identify novel biomarkers
for CRC, breast cancer, thyroid cancer, endometriosis and other
diseases (12–16). This technology can detect
biomarkers in serum samples effectively, but it can only obtain the
molecular weight data of biomarkers without protein sequences. In
the present study, several technologies were combined to purify and
identify a CRC-related protein. The SELDI-TOF-MS combined with
ProteinChip technology was first used to detect the 3.9-kDa protein
in serum samples. HPLC and MALDI-TOF-MS were then applied to purify
and track the 3.9-kDa protein, which provided a pure 3.9-kDa
protein biomarker. Liquid chromatography/mass spectometry
(LC-MS/MS) was finally adopted to identify and decode the
structural information of the 3.9-kDa protein biomarker.
Materials and methods
Patients
A total of 99 serum samples were collected upon
approval by the Department of Surgical Oncology, The Second
Affiliated School of Zhejiang University. All the serum samples
used in this paper were collected with the agreement of the
patients. Another 73 serum samples were collected from CRC
patients, along with an additional 26 samples from healthy
individuals. Patients with CRC had a median age of 56 years
(ranging from 41 to 75; 46 male and 27 female) and consisted of 9
stage I, 21 stage II, 32 stage III and 11 stage IV patients,
according to the TNM stage-system of UICC. The healthy control
group was age- and gender-matched with the CRC group. Diagnoses of
all the CRCs were confirmed pathological by two pathologists. All
blood samples were collected preoperatively in the morning without
food intake. The blood samples were placed at room temperature for
1–2 h, and centrifuged at 3,000 rpm for 10 min. Finally, the serum
samples were stored at −80°C for further research.
Prochip array analysis
All serum specimens were thawed on ice and
centrifuged at 10,000 rpm for 4 min at 4°C. An amount of 5 μl of
each supernatant was mixed with 10 μl U9 buffer (9 M Urea, 2%
CHAPS, 1% DTT) in a 96-well plate, and then the plate was agitated
on a platform shaker for 30 min at 4°C. The U9/serum mixture was
further diluted with 185 μl binding buffer (50 mM sodium acetate,
pH 4.0). At the same time, the weak cation exchange (CM10) chips
were activated by adding 200 μl binding buffer and agitated for 5
min twice. A 100 μl of diluted serum sample was added into each
well of the activated Prochip arrays and agitated for 60 min. The
chips were washed three times with 200 μl binding buffer and twice
with 200 μl deionized water. After being air-dried, 1 μl of
saturated solution of sinapinic acid in 50% acetonitrile and 0.5%
trifluoroacetic acid was added to each well twice. Finally, the
chips were detected using the Protein Biological System II
(PBS-II), a mass spectrometer reader (Ciphergen Biosystems,
USA).
Date were obtained by an average of 100 laser shots
with an intensity of 170, a detector sensitivity of 6, a highest
mass of 50 kDa and an optimized range of 2–20 kDa. The instrument
was calibrated using the all-in-one peptide molecular mass standard
before detecting samples.
Bioinformatic analysis
After baseline subtraction, the spectra intensities
of all samples were normalized to the total ion current. Noise was
filtered from the spectra, and then markers were detected with an
automatic peak detection pass. Peak clusters were completed to
cluster the markers in different samples with similar masses, which
were defined by a mass window of 0.3% mass error. All the above
analysis was performed using ProteinChip software 3.2.
Serum fractionation
After freeze thawing on ice, 100 μl of the serum
sample was mixed with 200 μl U9 buffer (9 M Urea, 1% DTT 2% CHAPS)
and vibrated on ice for 30 min. Then the sample was diluted with 5
ml WCX binding buffer (50 mM NaAc, pH 4.0) and loaded on the Oasis
WCX SPE column (6 cc/150 mg, 30 μm) (Waters, USA). After washing
with 5 ml WCX binding buffer, the column was eluted with 3 ml WCX
elution buffer (1 M NaCl, 50 mM NaAc, pH 4.0). Every eluted
fraction was concentrated to 100 μl using SpeedVac for further
purification.
Purification of candidate protein
biomarker
HPLC separation was performed using SCL-10AVP
(Shimadzu, Japan) with a Sunchrom C18 column (250×4.6 mm, 5-μm
particle size, 300 Å) (Waters, USA) and a C18 guard column (10 × 3
mm)(Shimadzu). The mobile phase consisted of solvent A (0.1%
TFA/H2O) and solvent B (0.1% TFA/ACN). The HPLC
separation was achieved with a linear solvent gradient: 100% A (0
min - 100% A (10 min) - 70% B (60 min) - 100% B (65 min) - 100% B
(90 min) at a flow-rate of 0.5 ml/min. Multiple wavelengths of 214,
254 and 280 nm were used to detect the eluate. Each peak fraction
was collected and concentrated using SpeedVac. The concentrated
samples were analyzed using AXIMA-CFR™ Plus MALDI-TOF mass
spectrometer (Shimadzu/Kratos, Manchester, UK) in linear mode to
trace the protein biomarkers with α-cyano-4-hydroxycinnamic acid as
matrix.
Identification of the candidate protein
marker using LC-MS/MS
The fraction containing the candidate protein
biomarker was in-solution digested following a standard protocol.
Briefly, each fraction was dissolved in 25 mM
NH4HCO3, and reduced with 10 mM DTT for 1 h
at room temperature, alkylated by using 40 mM iodoacetamide in the
dark for 1 h at room temperature. Then 40 mM DTT was added to
quench the iodacetamide for 30 min at room temperature. An amount
of 0.1 μg Trypsin (Promega Corporation, USA) was then added into
the sample solution and incubated at 37°C overnight. A total amount
of 1 μl formic acid was added to stop the digestion. The digested
sample was loaded onto a home-made C18 column (100 mm × 100 μm)
packed with Sunchron packing-material (SP-120-3-ODS-A, 3 μm)
followed by nano-LC-ESI-MS/MS analysis. The LTQ mass spectrometer
was operated in the data-dependent mode, in which the initial MS
scan recorded the mass to charge (m/z) ratios of ions over the mass
range from 400–2,000 Da, and then the 5 most abundant ions were
automatically selected for subsequent collision-activated
dissociation. All MS/MS data were searched in a human protein
database downloaded from NCBI using the SEQUEST program (Thermo,
USA). The p-values were calculated with the SPSS version 11.0
software and a p<0.05 was required for the results to be
considered statistically significant.
Results
Discovery analysis
The data derived from the CRC and the healthy
control groups were analyzed. The qualified peaks were ranked by
the p-value of the non-parametric tests, and the top 10 peaks with
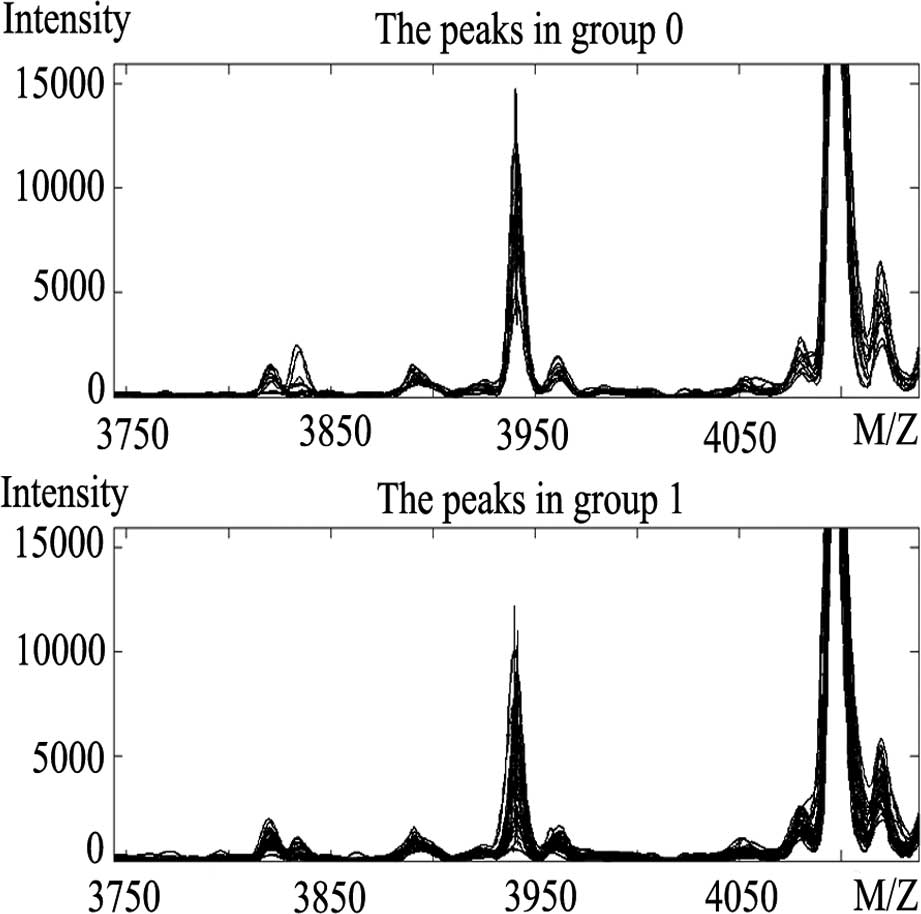
obvious differences were selected and listed in Table I. Results showed that the intensity
of the 3.9-kDa peak in the healthy controls (mean intensity value
6127.9) was much higher than that of the CRC patients (mean
intensity value 2404.3) (Fig.
1).
 | Table IComparison of the protein peak
intensities between the CRC patients and the healthy controls. |
Table I
Comparison of the protein peak
intensities between the CRC patients and the healthy controls.
| Biomarker (m/z) | p-value | Mean in group 0 | Mean in group 1 | Std in group 0 | Std in group 1 |
|---|
| 5639.535 | 1.64E-11 | 2007.398 | 7988.462 | 877.703 | 3904.474 |
| 5864.255 | 2.05E-11 | 60.212 | 263.025 | 38.586 | 161.735 |
| 5846.277 | 2.37E-11 | 38.989 | 347.398 | 23.900 | 234.303 |
| 5661.475 | 6.52E-11 | 176.875 | 529.646 | 72.959 | 242.287 |
| 8942.126 | 3.76E-10 | 2028.114 | 279.755 | 1333.727 | 663.509 |
| 5086.084 | 2.16E-09 | 62.566 | 284.565 | 56.215 | 176.938 |
| 5910.981 | 2.46E-09 | 1481.202 | 5753.641 | 994.956 | 3391.010 |
| 3938.931 | 5.37E-09 | 6127.917 | 2404.337 | 2567.623 | 1644.808 |
| 8146.209 | 5.37E-09 | 993.202 | 239.002 | 557.253 | 297.599 |
| 5070.722 | 8.94E-09 | 131.457 | 645.025 | 153.796 | 522.170 |
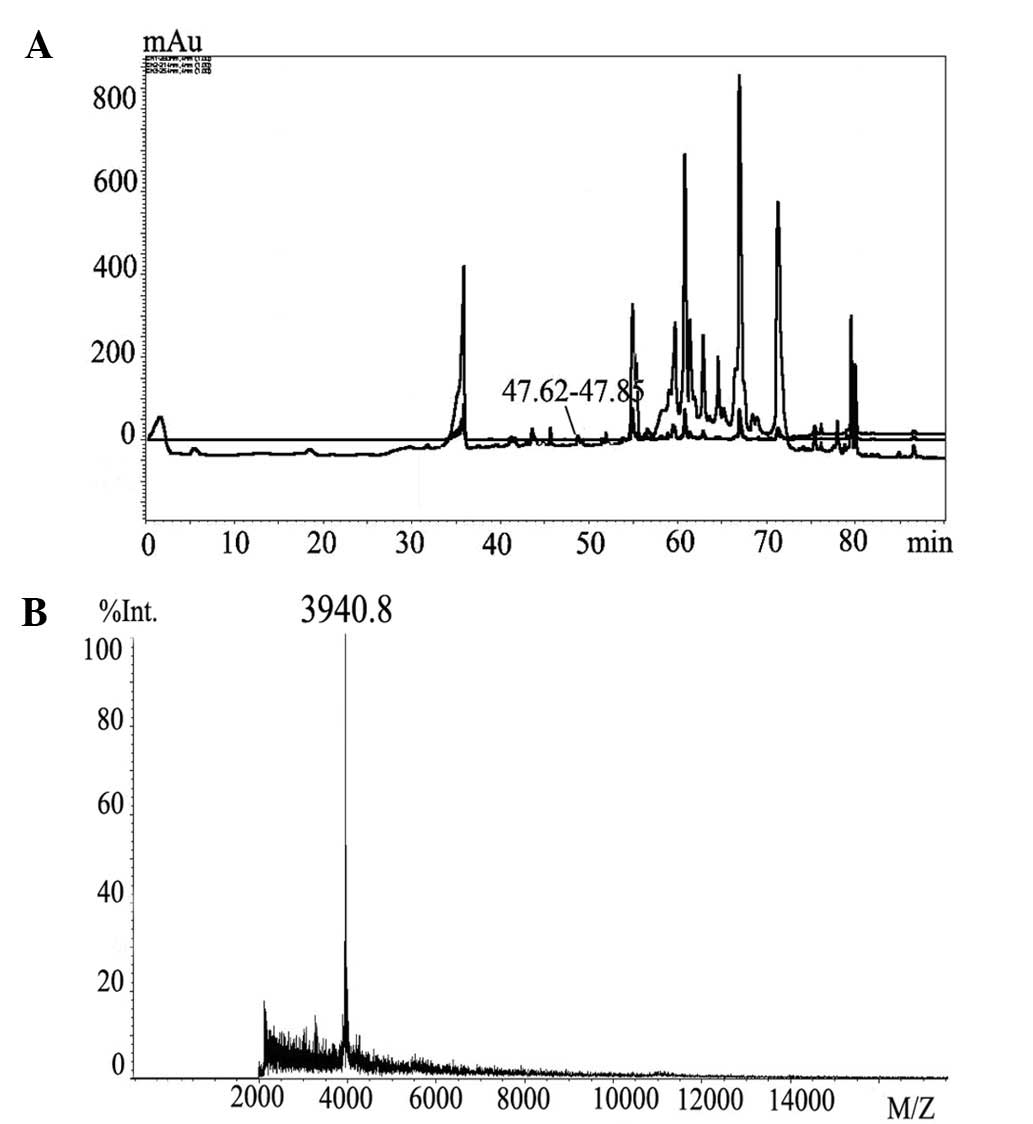
Purification of the 3.9-kDa
biomarker
The separation and purification of all the 10
biomarkers were carried out, and it was found that the purification
of the 3.9-kDa protein was much easier than the others. As shown in
Table I, the difference in the
concentration of the 3.9-kDa protein in the serum of CRC patients
and health controls was also very distinct. Therefore, the 3.9-kDa
protein was selected as a biomarker for CRC and was further
separated and purified. Serum samples were separated by HPLC and
the eluate was sampled every 2 min. All of the eluates were
analyzed by MALDI-TOF-MS. The 3.9-kDa biomarker was present in the
eluate between 47 and 48 min (Fig.
2A). Then, we focused on the elutate from 47 and 48 min during
HPLC separation, and the sampling frequency during this period was
found to be even higher. Finally, it was confirmed that the 3.9-kDa
protein flowed out from 47.62 to 47.85 min. Fig. 2B shows the result of the
MALDI-TOF-MS analysis data of the 3.9-kDa biomarker.
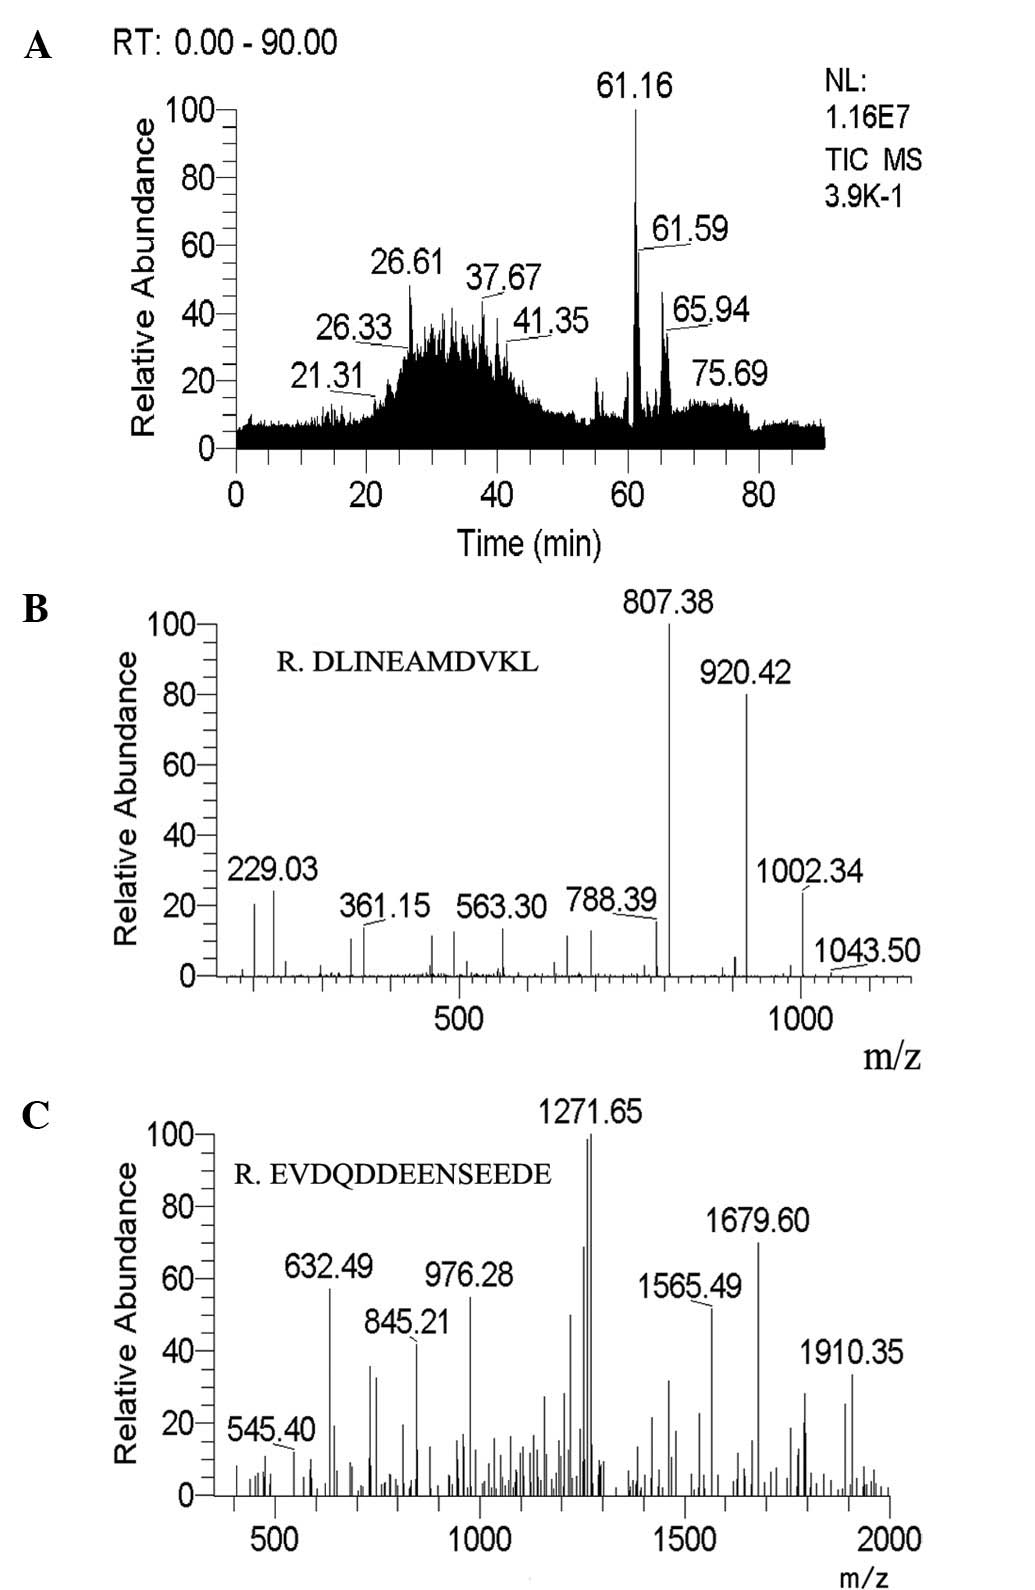
Identification of the 3.9-kDa
biomarker
The purified 3.9-kDa protein was identified by
HPLC-ESI-MS/MS, with the data shown in Fig. 3. After trypsin digestion, the
protein was divided into several protein segments. After searching
the database, two peptide fragments were found including R.
DLINEAMDVKL and R. EVDQDDEENSEEDE (Table II). Therefore, the sequence of the
3.9-kDa protein was decoded as DLINEAMDVKLKRQESQQKEVDQDD-EENSEEDE,
which is a peptide fragment of serine/theonine kinase 4.
| Table IIStructural data of the 3.9 kDa protein
biomarker. |
Table II
Structural data of the 3.9 kDa protein
biomarker.
| Peptide | p-value | Sf | Score |
|---|
| R. DLINEAMDVKL | 3.8E-005 | 0.87 | 2.207 |
| R.
EVDQDDEENSEEDE | 1.1E-007 | 0.97 | 6.254 |
Discussion
Early diagnosis is important to increase the
survival rate for CRC patients. Carcinoembryonic antigen (CEA) and
carbohydrate antigen 19-9 (CA19-9) are tumor biomarkers for the
diagnosis of CRC (17,18). However, these tumor markers either
lack sensitivity or have a poor positive predictive value.
Therefore, it is necessary to identify novel biomarkers with high
sensitivity and specificity for the accurate diagnosis of CRC.
There are many different types of methods to
identify protein biomarkers for various diseases. Two-dimensional
polyacrylamide gel electrophoresis (2D-PAGE) has been widely used
to identify the differences in protein expression for the
identification of useful biomarkers (19). However, this technique has poor
reproducibility and limited resolution for proteins with molecular
weights less than 20,000 Da. The SELDI-TOF-MS and MALDI-TOF-MS
technologies are rapid and have sensitivity and high throughput.
They can identify low-molecular-weight proteins, even with a
molecular weight less than 20 kDa (20,21).
These two technologies have identified a great number of small
proteins, and the profiles of such proteins could be used to
indicate the presence or absence of a disease with a variety of
tumor types (22–25).
The protein biomarkers detected by SELDI-TOF-MS
simply are assigned an M/Z value, but no protein name and
structural information are provided. In this study, SELDI-TOF-MS
combined with CM10 ProteinChip was used to identify the 3.9-kDa
protein biomarker for CRC. We applied several biochemical
technologies to perform the separation and purification of this
biomarker. First, we used WCX-SPE column to enrich the proteins,
which can be enriched by a CM10 protein chip. Then, HPLC was
applied to separate and purify the 3.9-kDa protein with the eluates
and was monitored by MALDI-TOF-MS. Finally, the biomarker was
identified and decoded as a peptide fragment of MST1/STK4.
Serine/theonine kinase 4 (MST1/STK4) can
phosphorylate H2B at S14 depending upon the cleavage of MST1 by
caspase-3 and the phosphorylation is uniquely associated with
apoptotic chromatin in humans (26). Researchers have reported that
MST1/STK4 is a CRC-related protein according to the results of
protein micro-arrays (27,28). It was also observed that the higher
expression of MST1/STK4 was associated with an improved survival
rate of colon cancer patients (29). Therefore, as a peptide fragment of
MST1/STK4, the 3.9-kDa protein in serum is more meaningful for the
diagnosis and prognosis for CRC patients.
In summary, we successfully found a 3.9-kDa protein
biomarker, which has the clinical potential for the early diagnosis
of CRC. The structural information of the 3.9-kDa protein biomarker
also indicates that it is a peptide fragment of MST1/STK4. Further
studies involving larger patient population or using pre-diagnostic
serum are needed to confirm the importance of the 3.9-kDa protein
biomarker as a diagnostic marker for CRC.
Acknowledgements
The authors appreciate the support from the National
Natural Science Foundation of China (30901731), the National High
Technology Research and Development Program of China (2012AA02A506)
and the Fundamental Research Funds for the Central Universities
(2012FZA7004).
References
|
1
|
Jemal A, Bray F, Center MM, Ferlay J, Ward
E and Forman D: Global cancer statistics. CA Cancer J Clin.
61:69–90. 2011. View Article : Google Scholar
|
|
2
|
Yu ZJ, Zhi JL, Peng XF, Zhong XH and Xu
AG: Clinical significance of HSP27 expression in colorectal cancer.
Mol Med Report. 3:953–958. 2010.PubMed/NCBI
|
|
3
|
Jemal A, Siegel R, Ward E, Hao YP, Xu JQ
and Thun MJ: Cancer statistics. CA Cancer J Clin. 59:225–249.
2009.
|
|
4
|
Ohsawa T, Sahara T, Muramatsu S, Nishimura
Y, Yathuoka T, Tanaka Y, Yamaguchi K, Ishida H and Akagi K:
Colorectal cancer susceptibility associated with the HMLH1 V384D
variant. Mol Med Report. 2:887–891. 2009.PubMed/NCBI
|
|
5
|
Poston GJ, Tait D, O’Connell S, Bennett A
and Berendse S: Guidelines diagnosis and management of colorectal
cancer: summary of NICE guidance. BMJ. View Article : Google Scholar
|
|
6
|
Lisi D, Hassan CC and Crespi M; AMOD Study
Group. Participation in colorectal cancer screening with FOBT and
colonoscopy: an Italian, multicentre, randomized population study.
Dig Liver Dis. 42:371–376. 2010. View Article : Google Scholar : PubMed/NCBI
|
|
7
|
Basbug M, Arikanoglu Z, Bulbuller N,
Cetinkaya Z, Aygen E, Akbulut S and Satici O: Prognostic value of
preoperative CEA and CA 19-9 levels in patients with colorectal
cancer. Hepatogastroenterology. 58:400–405. 2011.PubMed/NCBI
|
|
8
|
Dihlmann W: Economical and standardized
double contrast radiography of the colon in adults. Deut Med
Wochenschr. 105:1138–1141. 1980.
|
|
9
|
Choi Y, Choi HS, Jeon WK, Kim BI, Park DI,
Cho YK, Kim HJ, Park JH and Sohn CI: Optimal number of endoscopic
biopsies in diagnosis of advanced gastric and colorectal cancer. J
Korean Med Sci. 27:36–39. 2012. View Article : Google Scholar : PubMed/NCBI
|
|
10
|
Hong YJ, Wang XD, Shen D and Zeng S:
Discrimination analysis of mass spectrometry proteomics for ovarian
cancer detection. Acta Pharmacol Sin. 29:1240–1246. 2008.
View Article : Google Scholar : PubMed/NCBI
|
|
11
|
Liu C, Shen J, Pan C, Yang L, Mou S, Wang
H and Liang Y: MALDI-TOF-MS combined with magnetic beads for
detecting serum protein biomarkers and establishment of boosting
decision tree model for diagnosis of hepatocellular carcinoma. Am J
Clin Pathol. 134:235–241. 2010. View Article : Google Scholar
|
|
12
|
Yu JK, Chen YD and Zheng S: An integrated
approach to the detection of colorectal cancer utilizing proteomics
and bioinformatics. World J Gastroenterol. 10:3127–3131.
2004.PubMed/NCBI
|
|
13
|
Hu Y, Zhang SZ, Yu JK, Liu J and Zheng S:
SELDI-TOF-MS: the proteomics and bioinformatics approaches in the
diagnosis of breast cancer. Breast. 14:250–255. 2005. View Article : Google Scholar : PubMed/NCBI
|
|
14
|
Wang JX, Yu JK, Wang L, Liu QL, Zhang J
and Zheng S: Application of serum protein fingerprint in diagnosis
of papillary thyroid carcinoma. Proteomics. 6:5344–5349. 2006.
View Article : Google Scholar : PubMed/NCBI
|
|
15
|
Zheng N, Pan C and Liu W: New serum
biomarkers for detection of endometriosis using matrix-assisted
laser desorption/ionization time-of-flight mass spectrometry. J Int
Med Res. 39:1184–1192. 2011. View Article : Google Scholar
|
|
16
|
Guo RY, Pan CQ, Shen JM and Liu CB: New
serum biomarkers for detection of esophageal carcinoma using
matrix-assisted laser desorption/ionization time-of-flight mass
spectrometry. J Cancer Res Clin Oncol. 137:513–519. 2011.
View Article : Google Scholar : PubMed/NCBI
|
|
17
|
Raeisossadati R, Farshchian M, Ganji A,
Tavassoli A, Velayati A, Dadkhah E, Chavoshi S, Mehrabi Bahar M,
Memar B, Rajabi Mashhadi MT, et al: Quantitative analysis of TEM-8
and CEA tumor markers indicating free tumor cells in the peripheral
blood of colorectal cancer patients. Int J Colorectal Dis.
26:1265–1270. 2011. View Article : Google Scholar
|
|
18
|
Ial’chenko NA, Lagutin VD, Lavik NN and
Musin II: The clinical-value of immunoenzyme assay of CA-19-9, CEA
and AFP in cancer of the stomach, pancreas, colon and rectum. Vopr
Onkol. 37:921–924. 1991.(in Russian).
|
|
19
|
Marengo E, Robotti E, Bobba M, Milli A,
Campostrini N, Righetti SC, Cecconi D and Righetti PG: Application
of partial least squares discriminant analysis and variable
selection procedures: a 2D-PAGE proteomic study. Anal Bioanal Chem.
390:1327–1342. 2008. View Article : Google Scholar : PubMed/NCBI
|
|
20
|
Deng BP, Dong ZG, Liu YG, Wang C, Liu J,
Wang C and Qu X: Effects of pretreatment protocols on human
amniotic fluid protein profiling with SELDI-TOF-MS using protein
chips and magnetic beads. Clin Chim Acta. 411:1051–1057. 2010.
View Article : Google Scholar : PubMed/NCBI
|
|
21
|
Shi CY, Meng JR and Deng CH: Enrichment
and detection of small molecules using magnetic graphene as an
adsorbent and a novel matrix of MALDI-TOF-MS. Chem Commun (Camb).
48:2418–2420. 2012. View Article : Google Scholar : PubMed/NCBI
|
|
22
|
Ge Z, Zhu YL, Zhong X, Yu JK and Zheng S:
Discovering differential protein expression caused by caga-induced
ERK pathway activation in AGS cells using the SELDI-ProteinChip
platform. World J Gastroenterol. 14:554–562. 2008. View Article : Google Scholar
|
|
23
|
Han MY, Liu Q, Yu JK and Zheng S:
Detection and significance of serum protein markers of small-cell
lung cancer. J Clin Lab Anal. 22:131–137. 2008. View Article : Google Scholar : PubMed/NCBI
|
|
24
|
Dridi B, Raoult D and Drancourt M:
Matrix-assisted laser desorption/ionization time-of-flight mass
spectrometry identification of archaea: towards the universal
identification of living organisms. APMIS. 120:85–91. 2012.
View Article : Google Scholar
|
|
25
|
Liu YP, Liu P, Dai RY, Wang J, Zheng Y,
Shen J, Guo F, Wang L, Li H and Wei M: Analysis of plasma proteome
from cases of the different traditional Chinese medicine syndromes
in patients with chronic hepatitis B. J Pharm Biomed Anal.
59:173–178. 2012. View Article : Google Scholar : PubMed/NCBI
|
|
26
|
Cheung WL, Ajiro K, Samejima K, Kloc M,
Cheung P, Mizzen CA, Beeser A, Etkin LD, Chernoff J, Earnshaw WC
and Allis CD: Apoptotic phosphorylation of histone H2B is mediated
by mammalian sterile twenty kinase. Cell. 113:507–517. 2003.
View Article : Google Scholar : PubMed/NCBI
|
|
27
|
Babel I, Barderas R, Diaz-Uriarte R,
Martinez-Torrecuadrada JL, Sánchez-Carbayo M and Casal JI:
Identification of tumor-associated autoantigens for the diagnosis
of colorectal cancer in serum using high density protein
microarrays. Mol Cell Proteomics. 8:2382–2395. 2009. View Article : Google Scholar : PubMed/NCBI
|
|
28
|
Babel I, Barderas R, Diaz-Uriarte R,
Moreno V, Suarez A, Fernandez-Acenero MJ, Salazar R, Capellá G and
Casal JI: Identification of MST1/STK4 and SULF1 proteins as
autoantibody targets for the diagnosis of colorectal cancer by
using phage microarrays. Mol Cell Proteomics. 10:M110.0017842011.
View Article : Google Scholar : PubMed/NCBI
|
|
29
|
Adams H, Tzankov A, Lugli A and Zlobec I:
New time-dependent approach to analyse the prognostic significance
of immunohistochemical biomarkers in colon cancer and diffuse large
B-cell lymphoma. J Clin Pathol. 62:986–997. 2009. View Article : Google Scholar : PubMed/NCBI
|