Introduction
Oral lichen planus (OLP) is a chronic inflammatory
disorder that frequently presents as a white, lacy and reticular
pattern on the mucosa, gingiva or lateral border of the tongue
(1). The major subtypes of OLP
include reticular, erosive, atrophic and popular lesions.
Histological examination has shown that lesions are characterized
by infiltrating bands of lymphocytes at the epidermal-dermal
junction with damage to the basal cells of the epidermis (2). Although the etiology of OLP remains
unclear, it appears to be a T cell-mediated autoimmune disorder in
which CD8+ T cells induce apoptosis of epithelial cells
within the lesion (3). Clones of
lymphocytes (the majority of which are CD8+) isolated
from oral lesions in the lichen planus have been found to have
suppressive effects on keratinocytes (4,5).
Elevations in proinflammatory cytokine synthesis and membrane
receptor expression have been identified in local inflammatory
cells and keratinocytes, which then activate multiple signaling
networks (6). Previous studies
suggested there is a T-helper cell (Th)1/Th2 imbalance in the
cell-mediated immune response of OLP (7,8),
which is consistent with the chronic and vacillating inflammatory
nature of OLP. Atrophic or erosive lesions may reflect an
exacerbated condition and these forms are associated with malignant
development (9). Regardless of the
central role of CD4+CD25+ regulatory T cells
(Tregs) in the immunological tolerance and suppression of immune
activation, limited information on the role of Tregs in OLP is
available.
Tregs are CD4+CD25+ T cells
that have a significant role in immune homeostasis and protect
against autoimmunity (10). Tregs
are anergic via stimulation through the T-cell receptor. Tregs are
capable of suppressing the activation of
CD4+CD25− and CD8+ T cells through
cell contact-dependent mechanisms and cytokine-independent
pathways. The aforementioned pathways may involve transforming
growth factor-β (TGF-β) or interleukin (IL)-10, which is consistent
with the immunosuppressive function (11,12).
Tregs are also involved in the immune response in a wide spectrum
of pathology, such as autoimmune diseases, infectious diseases,
allergies, cancer, and organ transplantation (13). The associated molecular markers of
Tregs include CD25, Forkhead-box protein 3 (Foxp3), cytotoxic T
lymphocyte-associated antigen 4 (CTLA-4) and glucocorticoid-induced
tumor necrosis factor receptor (GITR). Foxp3 is a member of the
highly conserved forkhead/winged helix transcription protein family
that controls the development, differentiation, maturation and
function maintenance of CD4+CD25+ Tregs
(14,15).
Considering the critical role of Foxp3 in the
development and function of Tregs, Foxp3 is considered a specific
molecular marker of the Treg functional activity (16,17).
The aim of the present study was to characterize Foxp3 expression
in CD4+CD25+ T cells from peripheral blood
lymphocytes and oral lesions in patients wih OLP (including
evaluation of the OLP subtype, duration and relapse).
Materials and methods
Study subjects
Thirty-two patients with OLP and 10 healthy
volunteers were recruited from The First Affiliated Hospital of
Jinan University (Guangzhou, China) from 2007 to 2010. Experimental
procedures were conducted in accordance with the guidelines of the
Medical Ethics committee of the Health Bureau of Guangdong Province
of China. Informed consent was obtained from each participant and
the study protocol was approved by the Ethics Committee of The
First Affiliated Hospital of Jinan University.
Thirty-two patients (females, 23 and males, 9) with
an average age of 42.8±15.4 years (range, 26–61) were diagnosed
with OLP. Patients who had been treated with corticosteroid or
immunosuppressive medications in the previous 6 months, and
patients with diabetes mellitus and autoimmune diseases (e.g.,
systemic lupus erythematosus and rheumatoid arthritis) were
excluded from this study. Ten gender- and age-matched volunteers
served as the healthy controls.
Incisional biopsies were obtained from
representative oral lesions. Each biopsy specimen was bisected for
histological and molecular assessment. Half of the specimens
obtained were fixed in 4%-buffered formaldehyde and embedded in
paraffin for histopathological verification of OLP. The clinical
diagnosis of OLP was verified, based on their histopathological
features. The histopathological features included lesions
characterized by infiltrating bands of lymphocytes at the
epidermal-dermal junction with damage to the basal cells of the
epidermis. The remaining specimens were minced with surgical blades
and immediately immersed in liquid nitrogen, and then stored at
−80°C until isolation of the total RNA. Gingival biopsies were
obtained from 10 gender- and age-matched subjects immediately after
the third molar extraction.
All oral lesions were localized without contact with
dental restorations. In terms of OLP subtype, 18 of the 32 patients
with OLP presented with reticular lesions, while the remaining
patients exhibited erosive or atrophic lesions. According to the
duration of disease, based on the self-report of the subjects,
patients were divided into three groups: <6 months (14 cases);
6–12 months (10 cases); and >12 months (8 cases). Of the 32
patients with OLP, 25 presented with a first diagnosis of OLP and
without prior treatment of corticosteroid or immunosuppressive
therapy. Seven patients with OLP had previously received
corticosteroid or immunosuppressive therapy on ≥2 occasions with
clinical relapse. Grouping of the study subjects is shown in
Table I.
 | Table IGrouping of participants in relation
to the subtype, duration and relapse of OLP. |
Table I
Grouping of participants in relation
to the subtype, duration and relapse of OLP.
| OLP subtype | OLP duration | OLP relapse |
|---|
|
|
|
|
|---|
| Groups | Erosive OLP | Reticular OLP | >12 months | 6–12 months | <6 months | Relapse | First
diagnosis |
|---|
| OLP | 14 | 18 | 8 | 10 | 14 | 7 | 25 |
| Control | 10 | | 10 | | | 10 | |
Preparation of peripheral blood
mononuclear cells (PBMCs)
Blood samples were collected from all subjects and
stored in heparin-containing tubes. PBMCs were isolated immediately
using the Ficoll-Hypaque gradient centrifugation technique to
further separate CD4+CD25+ T cells.
CD4+CD25+ T-cell
separation by magnetic beads magnetic cell sorting (MACS)
Purified human CD4+CD25+ T
cells were isolated according to the manufacturer’s instructions in
a two-step procedure. CD4+ T cells were isolated from
PBMCs using positive selection with antibody-coated paramagnetic
MultiSort MicroBeads [magnetic-activated cell sorting (MACS);
Miltenyi Biotec GmbH, Bergisch Gladbach, Germany].
CD4+CD25+ T cells were obtained from the
CD4+ T cells with CD25 MicroBeads (Miltenyi Biotec) by
positive selection. The purity of the CD4+ and
CD4+CD25+ T cells was established using flow
cytometry of cells stained with anti-human CD4-FITC and anti-human
CD25−PE (purity of >95% CD4+ T cells and
>90% CD4+CD25+ T cells).
Total RNA isolation from
CD4+CD25+ T cells and OLP tissues followed by
cDNA synthesis
Total RNA was extracted from
CD4+CD25+ T cells using TRIzol reagent
(Invitrogen Life Technologies, Carlsbad, CA, USA), following the
manufacturer’s instructions. Specimens were homogenized in liquid
nitrogen and subjected to total RNA extraction using the Tissue RNA
Extraction kit (Takara Biotechnology, Dalian, China) and treated
with RNase-free DNase (Ambion®; Invitrogen Life
Technologies) to remove contaminating genomic DNA. The RNA yield
and purity were determined by a spectrophotometer at 260/280 nm.
RNA samples were treated with DNase in strict accordance with the
manufacturers’ instructions (Invitrogen Life Technologies). The RNA
quality was monitored using spectrophotometry and electrophoresis.
The cDNA was synthesized using the Transcriptor First Strand cDNA
Synthesis Kit (Roche Diagnostics Corp., Indianapolis, IN, USA)
following the manufacturer’s instructions.
qPCR
For qPCR, primers for the Foxp3 gene and the
reference gene (i.e., β-actin) were: Foxp3; forward, 5′-ACC
CCCTTTCACCTACGC-3′ and reverse, 5′-CCTTCTC GCTCTCCACTC-3′; and
β-actin; forward, 5′-CACCAA CTGGGACGACAT-3′ and reverse,
5′-ACAGCCTGGA TAGCAACG-3′. The primers were synthesized by Shanghai
Yingjun Biotechnology Co., Ltd. (Shanghai, China).
Expression levels of Foxp3 and the reference gene
(β-actin) were determined by SYBR-Green I real-time PCR. PCR was
performed as previously described by Chen et al (18). Correction for inefficiencies in RNA
input or reverse transcriptase were made by normalization of the
housekeeping gene, β-actin. The 2 (−ΔCT) method was used
to compare expression levels of Foxp3 relative to β-actin (19). Briefly, PCR of 25 μl total volume
was performed with ~1 μl cDNA, 0.5 μM of each primer and 2.5X
RealMasterMix 11.25 μl (Tiangen Biotech Co., Ltd, Beijing, China).
After the initial denaturation at 95°C for 2 min, 45 cycles at 95°C
(15 sec), 60°C (60 sec) and 82°C (1 sec) were performed for plate
reading using MJ Research DNA Engine Opticon 2 PCR cycler (Bio-Rad,
Hercules, CA, USA). Homogeneity of products from each reaction was
confirmed by a melt-curve analysis. The size and quantity of
amplified products were confirmed by 2% agarose gels and visualized
by staining gels with ethidium bromide. The Foxp3 mRNA expression
levels were calculated as previously described (20).
Western blot analysis of Foxp3
expression
The samples were solubilized in lysis buffer
containing 20 mM Tris (pH 7.5), 135 mM NaCl, 2 mM EDTA, 2 mM DTT,
25 mM β-glycerophosphate, 2 mM sodium pyrophosphate, 10% glycerol,
1% Triton X-100, 1 mM sodium orthovanadate, 10 mM NaF, 10 μg/ml
aprotinin, 10 μg/ml leupeptin and 1 mM phenylmethylsulfonyl
fluoride for 30 min. Lysates were centrifuged (15,000 × g) at 4°C
for 15 min. Equal concentrations of the soluble proteins were
denatured in sodium dodecyl sulfate (SDS), electrophoresed on a 12%
SDS-polyacrylamide gel, transferred to nitrocellulose membranes and
probed with antibodies, including rabbit anti-human polyclonal
antibodies against human Foxp3, goat anti-rabbit antibodies and
mouse anti-human GAPDH antibody (Santa Cruz Biotechnology, Inc.,
Santa Cruz, CA, USA). GAPDH was used as an internal control to
monitor equal protein loading. Western blot bands were observed
using the Odyssey infrared imaging system (LI-COR Biosciences,
Lincoln, NE, USA). The results represent three independent
experiments.
Immunohistochemical evaluation of Foxp3
expression
For the immunohistochemical procedure, sections were
pre-incubated overnight in Tris-EGTA buffer (0.05 M Tris and 2.5 mM
EGTA) at 60°C followed by 1.5% H2O2 in
Tris-buffered saline (TBS)/Nonidet (TBS; 0.05 M Tris, pH 7.4, 0.15
M NaCl; with 0.01% Nonidet P-40) (Sigma-Aldrich, Missouri, MO, USA)
for 15 min at room temperature (20°C) to extinguish endogenous
peroxidase. Subsequently, sections were incubated in 10% goat serum
(In Vitro A/S, Fredensborg, Denmark; code 04009-1B) for 30
min at room temperature in order to block non-specific binding.
Sections were then incubated with antibodies, including rabbit
anti-human polyclonal antibodies against human Foxp3. Sections were
always processed and stained simultaneously and under the same
laboratory conditions. Foxp3 was mainly expressed in the nucleus.
The percentage of staining was estimated by two independent
observers, three representative areas were selected and evaluated
on high-power fields (magnification, ×200). The mean percentage of
positive cells was represented by the mean of each slide.
Statistical analysis
Data are expressed as the means ± standard deviation
and subject to nonparametric analysis using the Mann-Whitney and
Kruskal Wallis tests (IBM SPSS Statistics; IBM Corp., Armonk, NY,
USA). P<0.05 was considered to indicate a statistically
significant difference.
Results
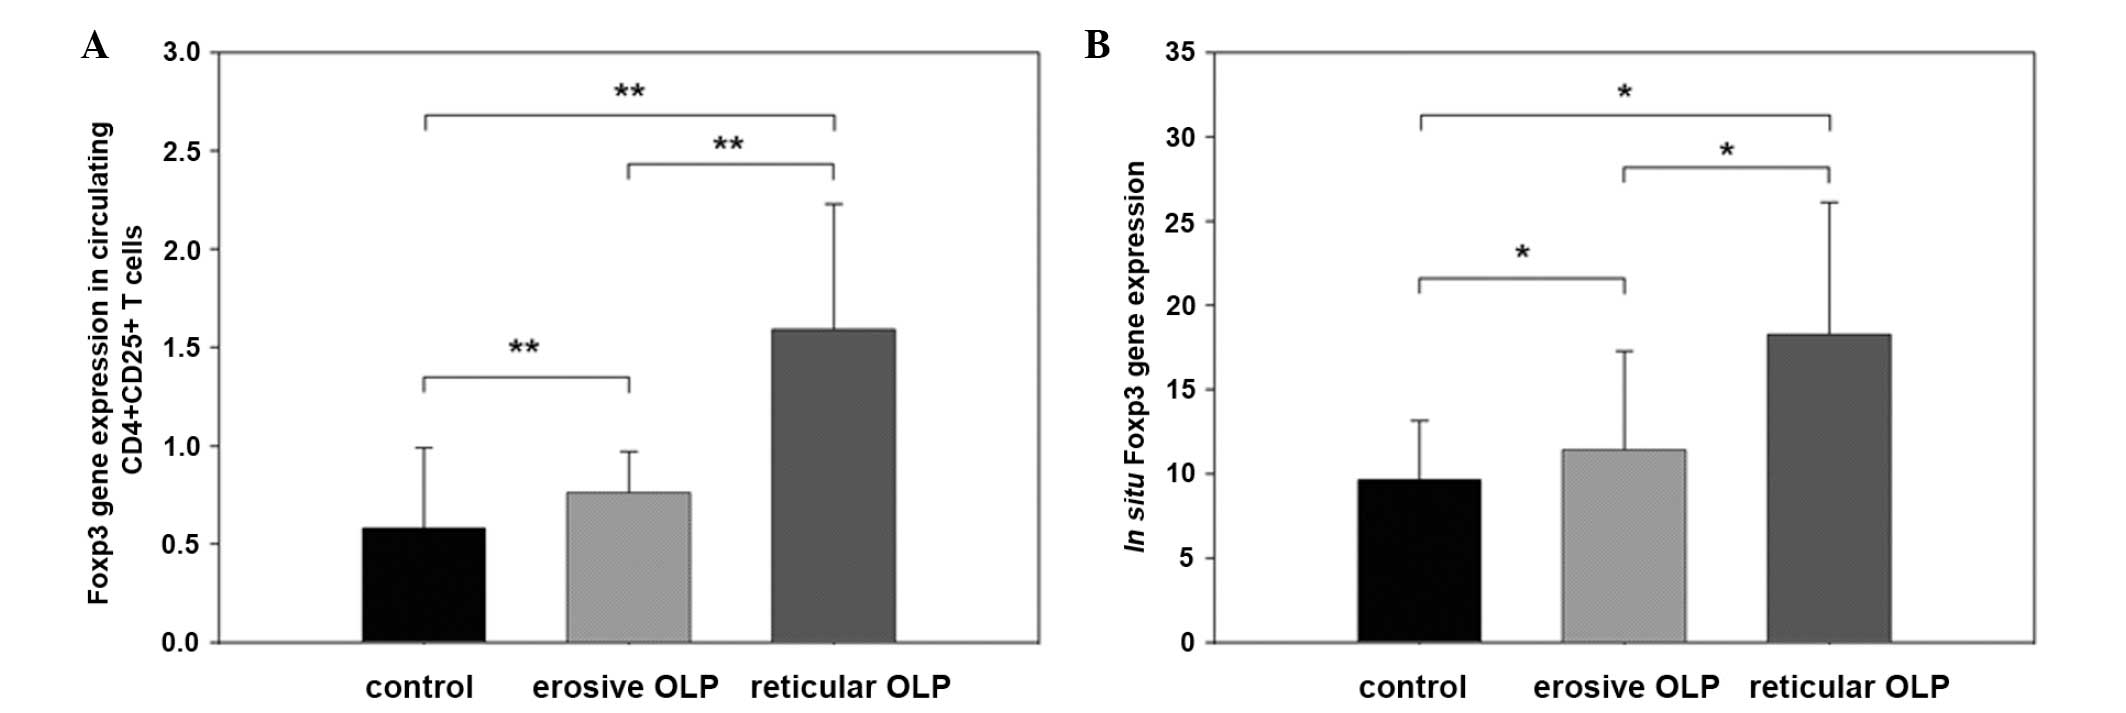
Comparison of Foxp3 mRNA expression
between OLP subtypes
Foxp3 mRNA expression was analyzed using qPCR.
Correction for inefficiencies in RNA input or reverse transcriptase
was made by normalization of the housekeeping gene (β-actin). A
melting curve analysis was performed to ensure the specificity of
the primers. In circulating CD4+CD25+ T
cells, Foxp3 mRNA expression in reticular lesions of OLP was
significantly higher than that in the erosive lesions and the
healthy control group (1.59±0.64 versus 0.76±0.21 and 0.58±0.41,
respectively) (P<0.01). Compared with that of the control group,
Foxp3 mRNA expression in erosive OLP lesions was significantly
higher (0.76±0.21 versus 0.58±0.41, respectively; P<0.01)
(Fig. 1A).
The in situ Foxp3 mRNA expression in
reticular OLP lesions was significantly higher than that in erosive
OLP lesions and the healthy control group (18.27±7.83 versus
11.41±5.86 and 9.63±3.54, respectively; P<0.05). Compared with
that of the healthy control group, Foxp3 mRNA expression in erosive
OLP lesions was significantly higher (11.41±5.86 versus 9.63±3.54,
respectively; P<0.05) (Fig.
1B).
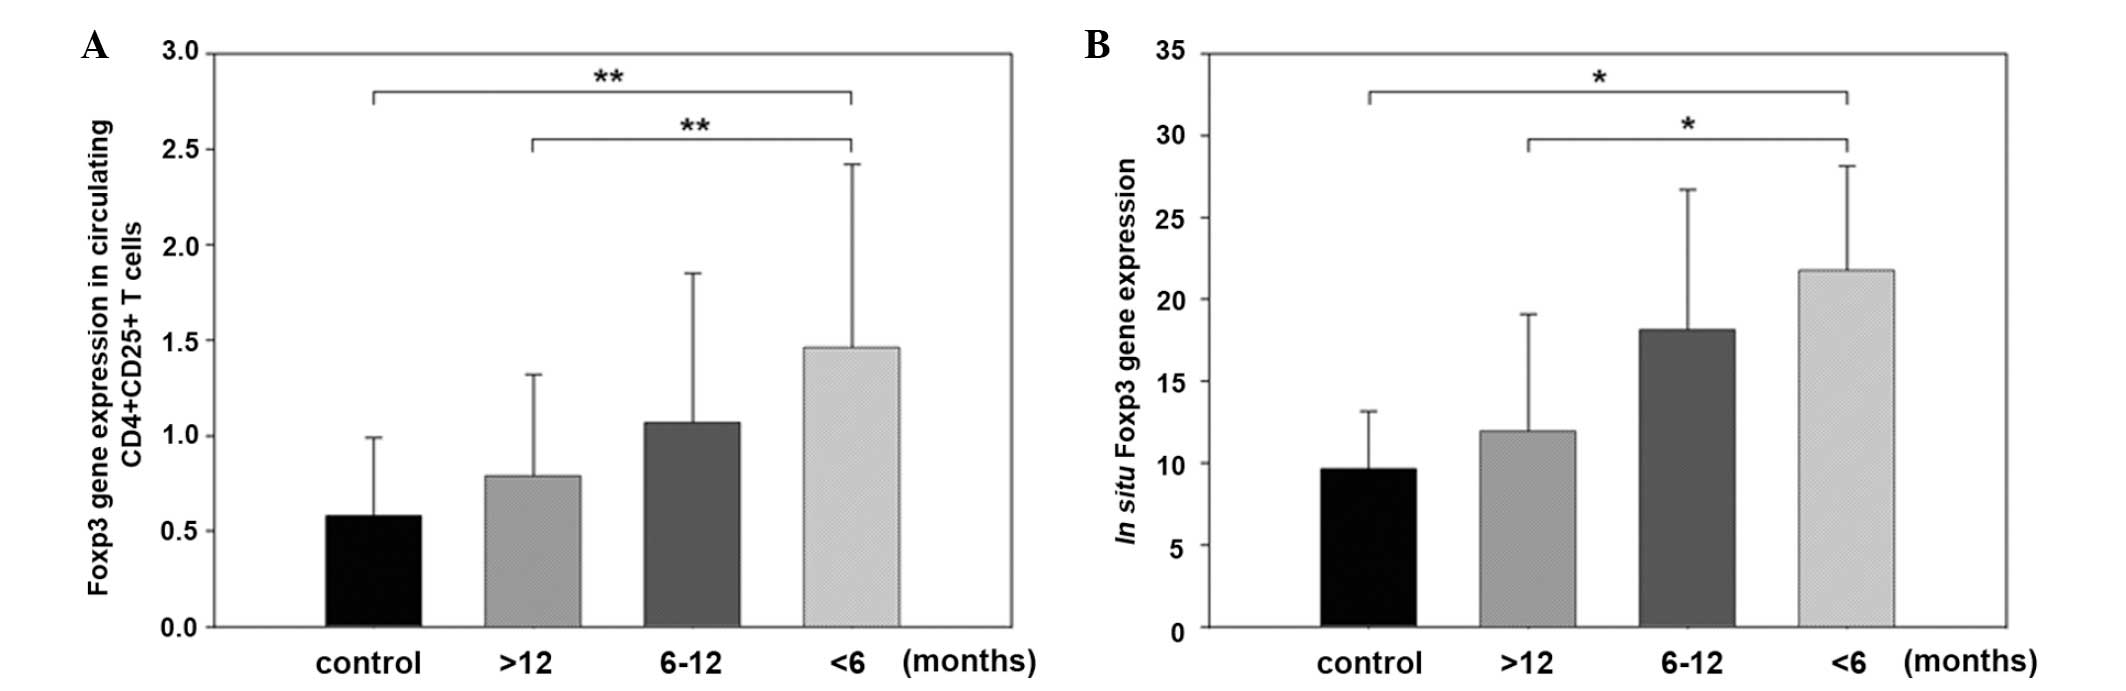
Comparison of Foxp3 mRNA expression
levels between groups of OLP duration
Foxp3 mRNA expression levels in circulating
CD4+CD25+ T cells from patients with OLP
duration of >6 months (the >12 months group and the 6–12
months group, 0.79±0.53 and 1.07±0.78, respectively) did not differ
significantly from that of the control group (0.58±0.41). Foxp3
mRNA expression levels in patients with OLP duration of <6
months (1.46±0.96) was significantly higher than that in patients
with a duration of >12 months and the control group (P<0.01)
(Fig. 2A).
In patients with OLP for <6 months, the in
situ Foxp3 mRNA expression level (21.76±6.38) was significantly
higher than that of the patients with OLP for >12 months
(11.96±7.13) and the healthy controls (9.63± 3.54) (P<0.05). The
in situ Foxp3 mRNA expression levels in patients with OLP
for 6–12 months (18.13±8.57) failed to present a significant
difference as compared to the other groups (P>0.05) (Fig. 2B).
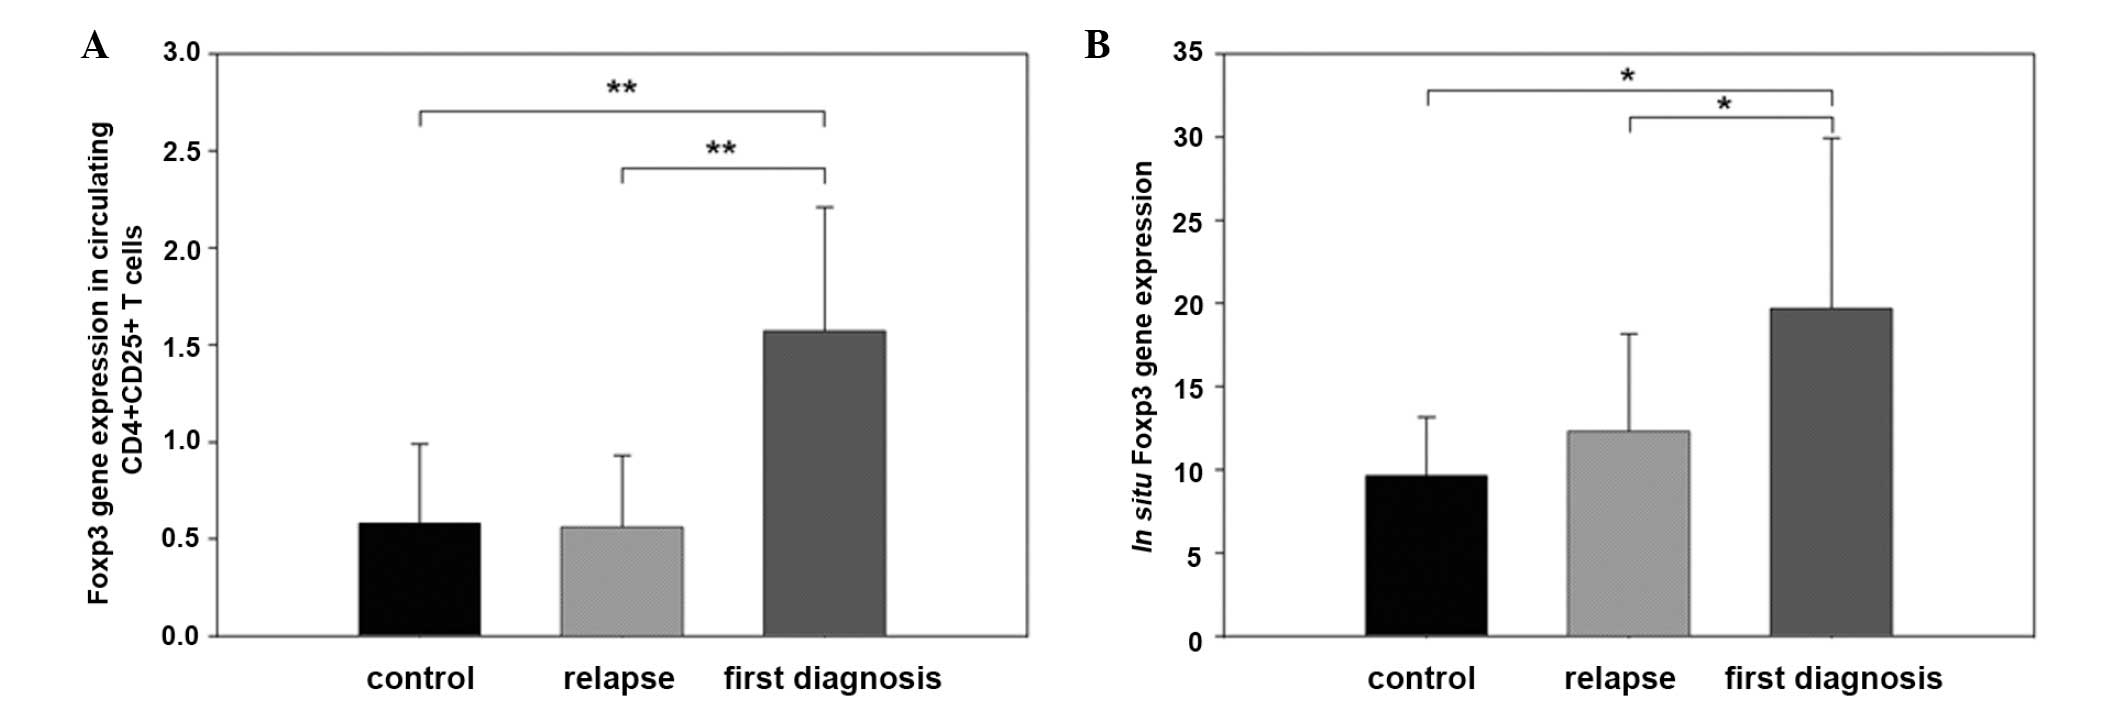
Comparison of Foxp3 mRNA expression
between OLP relapse groups
In circulating CD4+CD25+ T
cells, Foxp3 mRNA expression of the first diagnosis group
(1.57±0.64) was significantly higher compared with that of the
control and the relapse groups (0.58±0.41 and 0.56±0.37,
respectively) (P<0.01). No differences of Foxp3 mRNA expression
were found between the control and relapse groups (Fig. 3A).
In situ mRNA expression of Foxp3 was also
higher in tissues from patients in the first diagnosis group
(19.68±10.24), compared with that of the relapse and control groups
(12.31±5.85 and 9.63±3.54, respectively; P<0.05). No differences
of Foxp3 mRNA expression were found between the control group and
the relapse group (Fig. 3B).
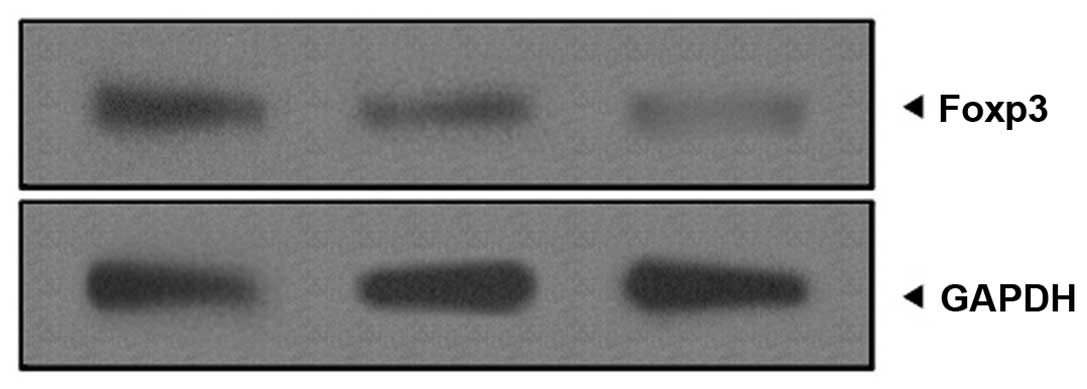
Foxp3 protein expression was analyzed
using western blotting and immunohistochemistry
Foxp3 protein expression was analyzed by western
blotting. As shown in Fig. 4,
Foxp3 protein expression in the reticular OLP lesions was
significantly higher than that in the erosive OLP lesions and the
healthy control group. In addition, compared with that of the
healthy control group, Foxp3 protein expression in the erosive OLP
lesions was also high.
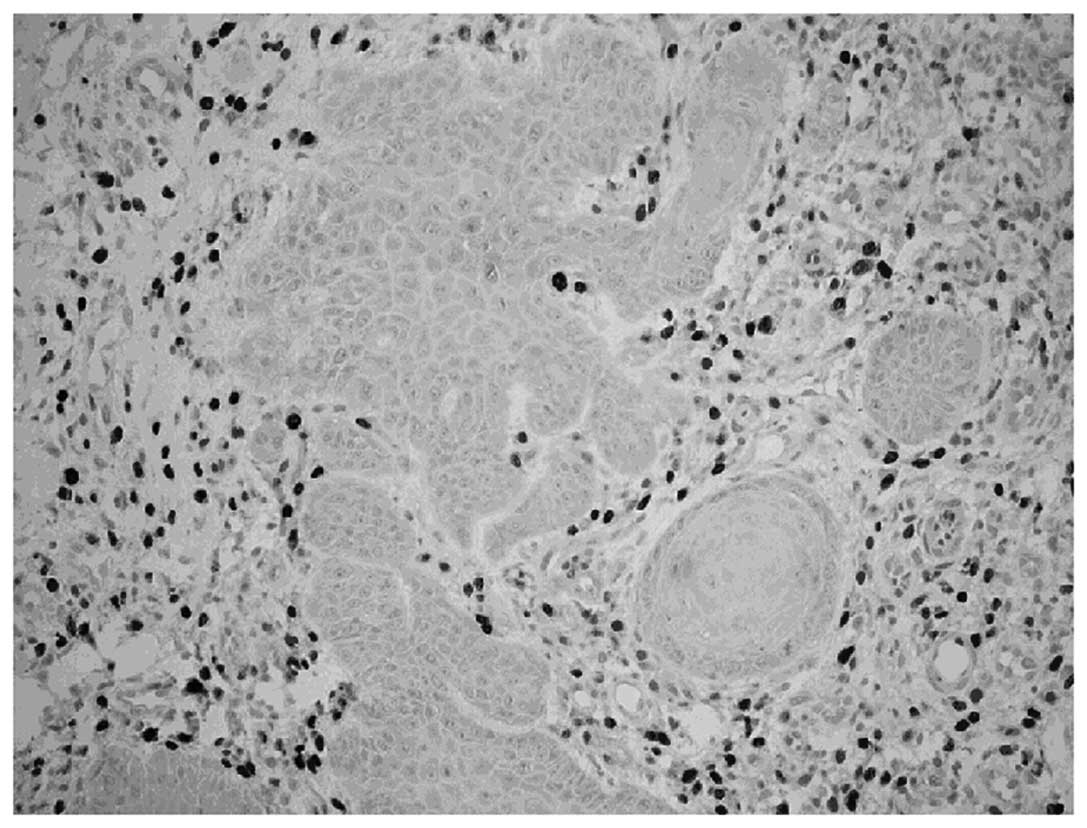
Furthermore, as shown in Fig. 5, under a light microscope, the
distribution of Foxp3 was mainly observed in the nuclei of
lymphocytes, which were sporadically scattered in the lamina
propria of local lesions. The incidence of Foxp3 expression in OLP
tissues was 36.24±18.92% and 10.44±6.51% in normal oral mucosa, and
there was a significant difference (P=0.019). Atrophic/erosive OLP
lesions showed a higher proportion of Foxp3-expressing cells in the
lamina propria of local lesions than that of the reticular OLP
(P<0.05).
Discussion
OLP is typically characterized by a dense,
well-defined infiltration of T-lymphocytes in the lamina propria.
CD4+ and CD8+ T cells appear to be
predominant in local lesions. These cells have been shown to be
cytotoxic T cells that migrate through the basement membrane in OLP
(21). These cells may trigger
keratinocyte apoptosis (22)
promoted by Th1 cytokines. Previous studies (23,24)
have shown that T cells in OLP were resistant to apoptosis
resulting in inappropriate immune homeostasis and accumulation of T
cells. A number of mechanisms may contribute to the biological
basis of OLP (which largely remains unclear), including activation
of the inflammatory mediator, nuclear factor-κB (25), dysfunction of the TGF-β signal
transduction on CD8+ T cells (26), and CD8+ and
CD4+ T-cell resistance to activation-induced cell death
(24), suggesting a dysregulation
of local inflammation.
The suppressive function of Tregs is consistent with
the hypothesis that the change of Foxp3 expression in T cells may
contribute to the pathogenesis of OLP. In the present study, higher
levels of Foxp3 mRNA and protein expression in both circulating
CD4+CD25+ T cells and local tissues were
found in patients with OLP compared with that of the healthy
controls. However, differences in Foxp3 expression were also
associated with the clinical form, including reticular versus
erosive lesions, and duration and relapse status. Our data suggest
that OLP may be associated with the change of Foxp3 expression in
CD4+CD25+ cells.
Foxp3+CD25+CD4+
Tregs are produced in the thymus and are also induced in the
periphery from naive T cells as a functionally mature T-cell
subpopulation forming a functionally distinct T-cell subpopulation
in the periphery. Tregs are dedicated to the control of immune
responses and mediate the tolerance against harmless non-self or
self-antigens (27). The
differentiation and function of Treg cells require Foxp3 (11,12).
A number of autoimmune diseases, such as arthritis, diabetes
mellitus, immunodysregulation polyendocrinopathy, enteropathy and
X-linked syndrome, may develop spontaneously following elimination
of CD4+CD25+ Tregs (28,29).
In the present study, Foxp3 mRNA and protein
expression levels in peripheral blood
CD4+CD25+ T cells were higher in patients
with OLP than that of the healthy controls. Similar elevations in
the expression pattern were observed in local lesions of reticular
and erosive forms of OLP, although the expression in the erosive
form was lower than that in the reticular form. Foxp3 localization
observed in this study supported the findings of Tao et al
(30), who identified a higher
Foxp3 expression and frequency of Foxp3+ Tregs in the
reticular OLP lesions than that in the erosive OLP lesions. A
potential interpretation for the enrichment of Foxp3+
Tregs in patients with OLP was that Tregs differentially traffic to
the oral mucosa in response to chemokines, which is possibly
elaborated by keratinocytes. Recent studies (31,32)
examining Foxp3+ T-cell function in chronic inflammatory
conditions, including systemic lupus erythematosus and rheumatoid
arthritis, have shown that the Foxp3+ T cells may not
have the ability to exert a suppressive function due to the
resistance from effector cells. Therefore, such inflammatory
diseases may become chronic due to the inability of Tregs to
control cytokine-activated T-cell function (33). Our findings also supported the
possibility that Foxp3+ Tregs may be dysfunctional in
patients with OLP.
Reduced Foxp3 mRNA expression levels were noted in
the erosive OLP lesions than those of the reticular OLP lesions,
which were similar to the expression levels in the control group,
both in the circulating CD4+CD25+ T cells and
in situ. Immunoregulatory and histological differences have
been documented between T cells in reticular and atrophic/erosive
OLP (8,34). The epithelial cells in the erosive
form of OLP showed increased apoptotic cells as compared to the
reticular form (35), which is
consistent with the more aggressive form of erosive lichen planus.
A previous study hypothesized that the erosive form corresponded to
a more active and symptomatic stage of the condition, whereas the
reticular form corresponded to a quiescent and asymptomatic phase
(36). In the present study, the
severity of OLP was significantly associated with Foxp3 expression
levels; the greater the severity, the lower the Foxp3 expression
levels. The latter observation was consistent with the hypothesis
that lower Foxp3 expression levels resulted from upregulation of
Foxp3-related suppressive mechanisms in the development of the
disorder. With increasing disease severity, characterized by the
formation and exacerbation of erosive lesions, the abnormally high
ratio of activated T cells to Treg cells may have hampered the
functional ability of Tregs. In this situation, T cells incur
resistance to apoptosis resulting in inappropriate immune
homeostasis and accumulation of T cells in the tissues. High
proinflammatory cytokine levels may negatively affect the
activation of Foxp3+ Tregs cells in local lesions
(37,38). In the active inflammatory
compartment, overproduction of Th1 proinflammatory cytokines and
deficiencies in TGF-β1 (7,39,40)
signaling cascades may abrogate Treg-mediated suppression (37,41–44).
Moreover, the relative activity of these cytokines may determine
the level of immunological activity in OLP lesions and the clinical
behavior of the disease (7).
The present study also compared Foxp3 expression and
duration of disease, providing an insight into the regulation of
the inflammatory response. The results suggest that the protracted
disease was associated with reduced Foxp3 expression, which may be
partially responsible for the maintenance of the inflammatory
infiltrate. Therefore, it was possible that the function and number
of Tregs may become increasingly impaired with advancing duration
of disease, resulting in continued amplification and extension of
local inflammation.
Current therapeutic agents for OLP are largely
immunosuppressive and improve the management of symptoms, with
clinical relapse commonly occurring after discontinuation of
treatment. Pathological alterations in the proportion of immune
cells, including regulatory cell subsets, may account for
phenotypic differences in the observed inflammatory condition. A
diminution of Foxp3 Tregs would represent one possible scenario. In
the latter, the failure of Tregs to control autoimmune
dysregulation may provide important therapeutic targets for the
management of OLP. Several studies have shown that a reduction of
Foxp3 levels in natural CD4+CD25+ Tregs
blocked their suppressive activities (45,46),
and were associated with relapse of the disease (47). The balance between Tregs and T
effector cells may determine corresponding levels of inflammation
and therefore, may be linked to periods of relapse or
remission.
In conclusion, the present study examined elevated
Foxp3 expression levels in circulating
CD4+CD25+ T cells and oral lesions in
patients with OLP, suggesting altered immune suppression in the
development, clinical course and responsiveness to treatment. The
observation of lower Foxp3 expression levels in erosive lesions
compared with that of the reticular lesions of lichen planus,
further suggested that a dysregulation of suppressor mechanisms
contributed to the evolution and chronicity of inflammation.
Acknowledgements
We would like to thank all authors for their
contribution. This study was supported by the Nature Science
Foundation of Guangdong Province (grant no. 8151063201000065).
References
|
1
|
de Moura Castro Jacques C, Cardozo Pereira
AL, Cabral MG, Cardoso AS and Ramos-e-Silva M: Oral lichen planus
part I: epidemiology, clinics, etiology, immunopathogeny, and
diagnosis. Skinmed. 2:342–347. 2003.PubMed/NCBI
|
|
2
|
Sugerman PB, Savage NW, Walsh LJ, et al:
The pathogenesis of oral lichen planus. Crit Rev Oral Biol Med.
13:350–365. 2002. View Article : Google Scholar : PubMed/NCBI
|
|
3
|
Sugerman PB and Savage NW: Oral lichen
planus: causes, diagnosis and management. Aust Dent J. 47:290–297.
2002. View Article : Google Scholar : PubMed/NCBI
|
|
4
|
Gadenne AS, Strucke R, Dunn D, Wagner M,
Bleichner P and Bigby M: T-cell lines derived from lesional skin of
lichen planus patients contain a distinctive population of T-cell
receptor gamma delta-bearing cells. J Invest Dermatol. 103:347–351.
1994. View Article : Google Scholar
|
|
5
|
Sugerman PB, Savage NW and Seymour GJ:
Phenotype and suppressor activity of T-lymphocyte clones extracted
from lesions of oral lichen planus. Br J Dermatol. 131:319–324.
1994. View Article : Google Scholar : PubMed/NCBI
|
|
6
|
Roopashree MR, Gondhalekar RV, Shashikanth
MC, et al: Pathogenesis of oral lichen planus - a review. J Oral
Pathol Med. 39:729–734. 2010. View Article : Google Scholar : PubMed/NCBI
|
|
7
|
Khan A, Farah CS, Savage NW, et al: Th1
cytokines in oral lichen planus. J Oral Pathol Med. 32:77–83. 2003.
View Article : Google Scholar : PubMed/NCBI
|
|
8
|
Lu R, Zhou G, Du G, Xu X, Yang J and Hu J:
Expression of T-bet and GATA-3 in peripheral blood mononuclear
cells of patients with oral lichen planus. Arch Oral Biol.
56:499–505. 2011. View Article : Google Scholar : PubMed/NCBI
|
|
9
|
Pindborg JJ, Reichart PA, Smith CJ, et al:
Histological typing of cancer and precancer of the oral mucosa.
World Health Organization International histological classification
of tumours. 2nd edition. Springer; 25. Berlin, Germany: pp. 29–30.
1997
|
|
10
|
Sakaguchi S, Sakaguchi N, Asano M, Itoh M
and Toda M: Immunologic self-tolerance maintained by activated T
cells expressing IL-2 receptor alpha-chains (CD25). Breakdown of a
single mechanism of self-tolerance causes various autoimmune
diseases. J Immunol. 155:1151–1164. 1995.
|
|
11
|
Josefowicz SZ, Lu LF and Rudensky AY:
Regulatory T cells: mechanisms of differentiation and function.
Annu Rev Immunol. 30:531–564. 2012. View Article : Google Scholar : PubMed/NCBI
|
|
12
|
Wing K and Sakaguchi S: Regulatory T cells
exert checks and balances on self-tolerance and autoimmunity. Nat
Immunol. 11:7–13. 2010. View
Article : Google Scholar : PubMed/NCBI
|
|
13
|
Taams LS, Palmer DB, Akbar AN, Robinson
DS, Brown Z and Hawrylowicz CM: Regulatory T cells in human disease
and their potential for therapeutic manipulation. Immunology.
118:1–9. 2006. View Article : Google Scholar : PubMed/NCBI
|
|
14
|
Hori S, Nomura T and Sakaguchi S: Control
of regulatory T cell development by the transcription factor Foxp3.
Science. 299:1057–1061. 2003. View Article : Google Scholar : PubMed/NCBI
|
|
15
|
Gavin MA, Rasmussen JP, Fontenot JD, et
al: Foxp3-dependent programme of regulatory T-cell differentiation.
Nature. 445:771–775. 2007. View Article : Google Scholar : PubMed/NCBI
|
|
16
|
Yagi H, Takashi Nomura T, Nakamura K, et
al: Crucial role of Foxp3 in the development and function of human
CD25+CD4+ regulatory T cells. Int Immunol.
16:1643–1656. 2004. View Article : Google Scholar : PubMed/NCBI
|
|
17
|
Bignone PA and Banham AH: Foxp3+
regulatory T cells as biomarkers in human malignancies. Expert Opin
Biol Ther. 8:1897–1920. 2008.
|
|
18
|
Chen S, Yang L, Lu X, et al: Gene
expression profiling of CD3gamma, delta, epsilon, and zeta chains
in CD4(+) and CD8(+) T cells from human umbilical cord blood.
Hematology. 15:230–235. 2010.PubMed/NCBI
|
|
19
|
Livak KJ and Schmittgen TD: Analysis of
relative gene expression data using real-time quantitative PCR and
the 2(−Delta Delta C(T)) Method. Methods. 25:402–408. 2001.
|
|
20
|
Livak KJ and Schmittgen TD: Analysis of
relative gene expression data using real-time quantitative PCR and
the 2(−Delta Delta C(T)) Method. Methods. 25:402–408. 2001.
|
|
21
|
Zhou XJ, Sugerman PB, Savage NW, Walsh LJ
and Seymour GJ: Intra-epithelial CD8+ T cells and
basement membrane disruption in oral lichen planus. J Oral Pathol
Med. 31:23–27. 2002.PubMed/NCBI
|
|
22
|
Sugerman PB, Satterwhite K and Bigby M:
Autocytotoxic T-cell clones in lichen planus. Br J Dermatol.
142:449–456. 2000. View Article : Google Scholar : PubMed/NCBI
|
|
23
|
Bascones-Ilundain C, Gonzalez-Moles MA,
Esparza-Gómez G, Gil-Montoya JA and Bascones-Martínez A: Importance
of apoptotic mechanisms in inflammatory infiltrate of oral lichen
planus lesions. Anticancer Res. 26:357–362. 2006.PubMed/NCBI
|
|
24
|
Lei L, Tan WX, Zhou XL and Zheng PE:
Expression of Fas and Fas ligand in infiltrating lymphocytes in
patients with oral lichen planus. Zhonghua Kou Qiang Yi Xue Za Zhi.
45:219–222. 2010.(In Chinese).
|
|
25
|
Santoro A, Majorana A, Bardellini E, Festa
S, Sapelli P and Facchetti F: NF-kappaB expression in oral and
cutaneous lichen planus. J Pathol. 201:466–472. 2003. View Article : Google Scholar : PubMed/NCBI
|
|
26
|
Lei L, Yu M, Gao XY, Zhou XL and Zhan LH:
Expression of TGF-beta receptors in CD8+T cells of oral lichen
planus. Zhonghua Kou Qiang Yi Xue Za Zhi. 43:99–100. 2008.(In
Chinese).
|
|
27
|
Apostolou I, Sarukhan A, Klein L and von
Boehmer H: Origin of regulatory T cells with known specificity for
antigen. Nat Immunol. 3:756–763. 2002.PubMed/NCBI
|
|
28
|
Wildin RS, Ramsdell F, Peake J, et al:
X-linked neonatal diabetes mellitus, enteropathy and endocrinopathy
syndrome is the human equivalent of mouse scurfy. Nat Genet.
27:18–20. 2001. View
Article : Google Scholar : PubMed/NCBI
|
|
29
|
Lourenço EV and La Cava A: Natural
regulatory T cells in autoimmunity. Autoimmunity. 44:33–42.
2011.
|
|
30
|
Tao XA, Xia J, Chen XB, et al: Foxp3 T
regulatory cells in lesions of oral lichen planus correlated with
disease activity. Oral Dis. 16:76–82. 2010. View Article : Google Scholar : PubMed/NCBI
|
|
31
|
Vargas-Rojas MI, Crispín JC, Richaud-Patin
Y and Alcocer-Varela J: Quantitative and qualitative normal
regulatory T cells are not capable of inducing suppression in SLE
patients due to T-cell resistance. Lupus. 17:289–294. 2008.
View Article : Google Scholar : PubMed/NCBI
|
|
32
|
Beavis PA, Gregory B, Green P, et al:
Resistance to regulatory T cell-mediated suppression in rheumatoid
arthritis can be bypassed by ectopic foxp3 expression in pathogenic
synovial T cells. Proc Natl Acad Sci USA. 108:16717–16722. 2011.
View Article : Google Scholar : PubMed/NCBI
|
|
33
|
Buckner JH: Mechanisms of impaired
regulation by CD4(+)CD25(+)FOXP3(+) regulatory T cells in human
autoimmune diseases. Nat Rev Immunol. 10:849–859. 2010.
|
|
34
|
Jungell P, Malmström M, Wartiovaara J,
Konttinen Y and Sane J: Ultrastructure of oral leukoplakia and
lichen planus I. Basal region and inflammatory cells. J Oral
Pathol. 16:170–178. 1987. View Article : Google Scholar : PubMed/NCBI
|
|
35
|
Brant JMC, Vasconcelos AC and Rodrigues
LV: Role of apoptosis in erosive and reticular oral lichen planus
exhibiting variable epithelial thickness. Braz Dent J. 19:179–185.
2008.PubMed/NCBI
|
|
36
|
Karatsaidis A, Schreurs O, Helgeland K,
Axéll T and Schenck K: Erythematous and reticular forms of oral
lichen planus and oral lichenoid reactions differ in pathological
features related to disease activity. J Oral Pathol Med.
32:275–281. 2003. View Article : Google Scholar : PubMed/NCBI
|
|
37
|
Wan YY and Flavell RA: The roles for
cytokines in the generation and maintenance of regulatory T cells.
Immunological Rev. 212:114–130. 2006. View Article : Google Scholar : PubMed/NCBI
|
|
38
|
van Amelsfort JM, van Roon JA, Noordegraaf
M, et al: Proinflammatory mediator-induced reversal of CD4+, CD25+
regulatory T cell-mediated suppression in rheumatoid arthritis.
Arthritis Rheum. 56:732–742. 2007.PubMed/NCBI
|
|
39
|
Simark-Mattsson C, Bergenholtz G, Jontell
M, et al: Distribution of interleukin-2, -4, -10, tumour necrosis
factor-alpha and transforming growth factor-beta mRNAs in oral
lichen planus. Arch Oral Biol. 44:499–507. 1999. View Article : Google Scholar : PubMed/NCBI
|
|
40
|
Prime SS, Pring M, Davies M and Paterson
IC: TGF-beta signal transduction in oro-facial health and
non-malignant disease (part I). Crit Rev Oral Biol Med. 15:324–336.
2004. View Article : Google Scholar : PubMed/NCBI
|
|
41
|
Valencia X, Stephens G, Goldbach-Mansky R,
Wilson M, Shevach EM and Lipsky PE: TNF downmodulates the function
of human CD4+CD25hi T-regulatory cells. Blood. 108:253–261.
2006.
|
|
42
|
O’Sullivan BJ, Thomas HE, Pai S, et al:
IL-1 beta breaks tolerance through expansion of CD25+ effector T
cells. J Immunol. 176:7278–7287. 2006.PubMed/NCBI
|
|
43
|
Wan S, Xia C and Morel L: IL-6 produced by
dendritic cells from lupus-prone mice inhibits
CD4+CD25+ T cell regulatory functions. J
Immunol. 178:271–279. 2007. View Article : Google Scholar : PubMed/NCBI
|
|
44
|
Marie JC, Letterio JJ, Gavin M and
Rudensky AY: TGF-beta1 maintains suppressor function and Foxp3
expression in CD4+CD25+ regulatory T cells. J
Exp Med. 201:1061–1067. 2005. View Article : Google Scholar : PubMed/NCBI
|
|
45
|
Wan YY and Flavell RA: Regulatory T-cell
functions are subverted and converted owing to attenuated Foxp3
expression. Nature. 445:766–770. 2007. View Article : Google Scholar : PubMed/NCBI
|
|
46
|
Williams LM and Rudensky AY: Maintenance
of the Foxp3-dependent developmental program in mature regulatory T
cells requires continued expression of Foxp3. Nat Immunol.
8:277–284. 2007. View
Article : Google Scholar : PubMed/NCBI
|
|
47
|
Frisullo G, Nociti V, Iorio R, et al:
Regulatory T cells fail to suppress CD4T+-bet+ T cells in relapsing
multiple sclerosis patients. Immunology. 127:418–428.
2009.PubMed/NCBI
|