Introduction
Diabetic nephropathy (DN) is one of the most serious
microvascular complications in patients with diabetes mellitus
(DM), accounting for a high percentage of the mortality and
disability associated with DM (1).
Despite certain drugs, including angiotensin-converting enzyme
inhibitors and angiotensin receptor blockers, which can effectively
reduce albuminuria and slow the progression of DN (2–4), the
incidence of DN has continued to increase at a high rate. The
existence of a metabolic memory in patients with DM, in which an
incidence of high blood glucose increases the risk of DM-associated
diseases regardless of its long-term resolution, also affects DN
(5). Thus, it has been
hypothesized that epigenetic mechanisms may have a role in the
pathogenesis of DM, possibly promoting genetic tendencies for
DM-associated complications (6).
Maier and Olek (7) demonstrated
that DM is regulated by DNA methylation, while Bell et al
(8) analyzed the promoter regions
of 14,495 genes in a case-control study of 192 patients with DM and
found that there were 19 CpG islands associated with DN. However,
there was not sufficient evidence for those differences being a
cause of DN (8).
Connective tissue growth factor (CTGF) is an
important cytokine involved in the development of DN, and has been
shown to be closely associated with the occurrence and prognosis of
DN (9,10). It has been confirmed that CTGF gene
expression is sensitive to DNA methylation (11,12).
The methylation state of the CTGF promoter has been shown to be
negatively correlated with CTGF expression in ovarian cancer cells,
and epigenetic inactivation caused by hypermethylation of the CTGF
promoter plays a role in ovarian tumorigenesis (11). Chiba et al (12) reported abnormal CTGF gene
methylation in a variety of liver cancer cell lines and primary
liver cancer tissues, and suggested that CTGF methylation may be
involved in liver tumorigenesis.
A previous study by our group investigated the
effects of high glucose levels and 5-aza-2′-deoxycytidine
(5-aza-dCyd), a selective DNA methyltransferase inhibitor, on CTGF
expression and methylation levels in human glomerular mesangial
cells (HMCs) (13). The study
revealed that high glucose levels and 5-aza-dCyd were able to
induce the demethylation process of the CTGF gene promoter and
increase the expression of CTGF mRNA and protein, indicating that
DNA methylation is involved in the regulation of CTGF gene
expression in HMCs. However, the methylation state of the CTGF
promoter has yet to be investigated in patients with DN and it
remains to be elucidated whether this particular gene-specific
modification is involved in the pathogenesis of DN.
The present study was designed to use
high-performance liquid chromatography (HPLC), methylation-specific
polymerase chain reaction (MSP) and bisulfite sequencing (BS) to
investigate the methylation levels of the whole genome and the CTGF
promoter in patients with type 2 DM, and to analyze the possible
correlation with serum CTGF expression and the pathogenesis of
nephropathy.
Materials and methods
Subjects
A total of 75 patients [estimated glomerular
filtration rate (eGFR) ≥30 ml/min/1.73 m2], who had been
diagnosed with type 2 DM according to the 1999 World Health
Organization revised criteria for diagnosis and classification of
diabetes between December 2008 and December 2009 (14) in the Department of Endocrinology
and Nephrology (The Third Xiangya Hospital, Central South
University, Changsha, China), were enrolled in the present study.
Patients with chronic nephritis, urinary tract infection, primary
hypertension and heart failure were excluded from the study.
According to the Kidney Disease Outcomes Quality Initiative
Clinical Practice Guidelines and Clinical Practice Recommendations
for Diabetes (15) and the study
by Nichols et al (16),
these patients were divided into two groups based on their urinary
albumin-to-creatinine ratio (UACR): A non-diabetic nephropathy
group (NDN group; UACR <30 μg/mg, n=37) and a diabetic
nephropathy group (DN group; UACR >30<300 μg/mg, n=38). All
enrolled patients with DN were characterized as having diabetic
retinopathy by examination of the fundus of the eye. Twenty-nine
healthy volunteers, who had attended routine physical examinations
at the Third Xiangya Hospital, were recruited for the control group
(NDM group). The present study was designed in accordance with the
Declaration of Helsinki and was performed with approval from the
Ethics Committee of the Third Xiangya Hospital. Written informed
consent was obtained from all participants.
Biochemical parameter detection
Blood samples were collected after an 8-h overnight
fast and 2 h after breakfast, respectively. Fasting blood sugar
(FBS), postprandial blood sugar (PBS), blood urea nitrogen (BUN)
and creatinine (Cr) levels were assessed using an automatic
biochemical analyzer (Model no. 7600, Hitachi Co., Tokyo, Japan).
Levels of glycosylated hemoglobin (HbA1c) were assessed using HPLC.
First-morning, midstream urine samples were collected and
centrifuged, and the supernatant was used for analysis. Urine
albuminuria was assessed using an immunonephelometric method
(Turbox Microalbuminaria Assay kit; Orion Diagnostica Oy, Espoo,
Finland) and urine Cr was assessed using a biochemical assay and
automatic biochemical analyzer (Model no. 7600, Hitachi Co.). The
eGFR was calculated using the abbreviated Modification of Diet in
Renal Disease equation, as follows: 186.3 ×
(sCr/88.4)−1.154 × age−0.203 (× 0.742 if
female).
HPLC analysis of genomic DNA
methylation
Genomic DNA was extracted from peripheral blood by
using the Wizard Genomic DNA Purification kit (Promega Corp.,
Madison, WI, USA), and the purity the of DNA was assessed using a
spectrophotometer. The standard working curve was generated and the
degree of genomic DNA methylation was assessed using HPLC according
to the manufacturer’s instructions (Agilent 1100 system; Agilent
Technologies, Inc., Santa Clara, CA, USA). Levels of genomic DNA
methylation were calculated from the levels of deoxidized
5-methylcytosine (5mdC) and deoxidized cytosine (dC) detected by
HPLC using the following formula: [5mdC molarity/(5mdC molarity +
dC molarity)] × 100%.
MSP analysis of CTGF promoter
methylation
Methylation-specific primers were designed based on
the promoter sequence of CTGF, with 5′-TCGTTTCGGTCG ATAGTTTC-3′ as
the forward primer and 5′-CGAAAC CCATACTAACGACG-3′ as the reverse
primer. The sequences 5′-TTGTTTTGGTTGATAGTTTT-3′ and 5′-CAA
AACCCATACTAACAACA-3′ were used for the forward and reverse
non-methylation-specific primers, respectively. The following
thermal cycling conditions were used: Initial denaturation at 95°C
for 5 min; 38 cycles of denaturation at 94°C for 45 sec, annealing
at 50°C for 30 sec and extension at 72°C for 30 sec; final
extension at 72°C for 7 min. The 159-bp MSP product was isolated
using electrophoresis in a 1.5% agarose gel and analyzed using an
ultraviolet (UV) gel imaging system (ImageQuant 350; GE Healthcare
Co., Little Chalfont, UK).
BS analysis of CTGF promoter
methylation
BS primers for the CTGF promoter region were
designed to avoid methylated CpGs. Once the DNA sample treated with
sodium bisulfite was fully sulfonated, the BS product was amplified
with forward 5′-GTTGAGAGGAGATAGTTAGTG-3′ and reverse
5′-GGTTGTTAGGGAGGGATT-3′ primers. The polymerase chain reaction
(PCR) thermal cycling conditions were: Initial denaturation at 95°C
for 5 min; 36 cycles of denaturation at 94°C for 45 sec, annealing
at 52°C for 30 sec and extension at 72°C for 30 sec; final
extension at 72°C for 5 min. The 296-bp amplification product was
isolated using electrophoresis in a 1.5% agarose gel and visualized
under UV light. A 10-μl aliquot of the PCR product was subjected to
further sequencing by the Beijing Genomics Institute (Beijing,
China). The BS primer amplification products from the samples of
the three groups were compared with completely sulfonated promoter
target sequences using the JellyFish 1.3 data application software
(Field Scientific, LCC, Lewisburg, PA, USA). The target sequence
was known to contain 39 methylated cytosine-guanine (C-G) pairs,
and any remaining methylated cytosines (mCs) in the sequence
indicated a methylation site. The methylation level was calculated
as: (mC/C-G) × 100%.
Enzyme-linked immunosorbent assay (ELISA)
for CTGF protein detection
The CTGF protein levels in the serum were assessed
using a commercially available ELISA kit (Wuhan Xinqidi Biological
Technology Co., Wuhan, China), according to the manufacturer’s
instructions.
Statistical analysis
Normally distributed data are presented as the mean
± standard deviation, while non-normally distributed data are
presented as the median (interquartile range). The SPSS software
package (version 17.0; SPSS, Inc., Chicago, IL, USA) was used for
all statistical analyses. Intergroup differences were evaluated
using one-way analysis of variance (ANOVA) or one-way ANOVA with
post hoc tests, wherever appropriate. Correlations between
different parameters were evaluated by Pearson’s correlation test
and multiple stepwise regression analyses. P<0.05 was considered
to indicate a statistically significant difference.
Results
Comparison of clinical
characteristics
There were no differences in age, gender, body mass
index or systolic and diastolic blood pressure among the groups.
The FBS and PBS in the NDN and DN groups were significantly higher
than those in the NDM group, and HbA1c levels in the DN group were
higher than those in the NDN group. BUN and Cr levels in the DN
group were significantly higher than those in the NDM and NDN
groups, while there was no difference in the duration of diabetes
between the NDN and DN groups (Table
I).
 | Table IComparison of clinical
characteristics. |
Table I
Comparison of clinical
characteristics.
| Variables | NDM group, n=29 | NDN group, n=37 | DN group, n=38 |
|---|
| Age (years) | 57.69±11.96 | 56.0±9.52 | 58.42±9.89 |
| Gender, male/female
(n/n) | 16/13 | 20/17 | 19/19 |
| Duration of diabetes
(years) | - | 2.0 (1.0–7.0) | 5.0 (1.0–10.0) |
| BMI
(kg/m2) | 22.77
(20.26–24.37) | 23.74
(21.84–24.43) | 23.88
(23.51–24.62) |
| SBP (mmHg) | 126 (118–132) | 128 (118–140) | 130 (120–140) |
| DBP (mmHg) | 80 (63–81) | 80 (80–85) | 80 (76–89) |
| FBS (mmol/l) | 4.90 (4.15–5.30) | 6.10
(5.04–7.55)a | 6.52
(5.98–7.40)a |
| PBS (mmol/l) | 6.20 (5.50–7.00) | 9.20
(8.16–10.70)a | 9.55
(9.13–10.43)a |
| BUN (mmol/l) | 5.42 (4.34–5.99) | 5.21 (4.03–5.99) | 6.00
(5.08–7.41)a,b |
| Cr (μmol/l) | 57.00
(52.50–68.00) | 59.00
(54.00–68.00) | 68.00
(57.00–80.75)a |
| HbA1c (%) | - | 7.63±1.24 | 8.28±1.48b |
| UACR (μg/mg) | 7.30 (6.41–8.22) | 23.10
(16.73–26.30)a | 102.15
(56.88–182.13)a,b |
| eGFR (ml/min/1.73
m2) | 117.14±28.19 | 110.97±23.55 | 94.47±26.58a,b |
Genomic DNA methylation levels
The peak time of dC and 5mdC in the peripheral blood
genomic DNA samples of the patients was 7.942 and 10.025 min,
respectively, which was consistent with the standard. There was no
notable peak interference due to impurities. The corresponding
concentration was determined via the sample peak area (Fig. 1A). The genomic DNA methylation
level, calculated using the formula [5mdC molarity/(5mdC molarity +
dC molarity)] × 100%, was 5.23±0.09% in the DN group, 4.71±0.03% in
the NDN group and 4.37±0.01% in the NDM group. There were no
significant differences among the groups (P>0.05; Fig. 1B).
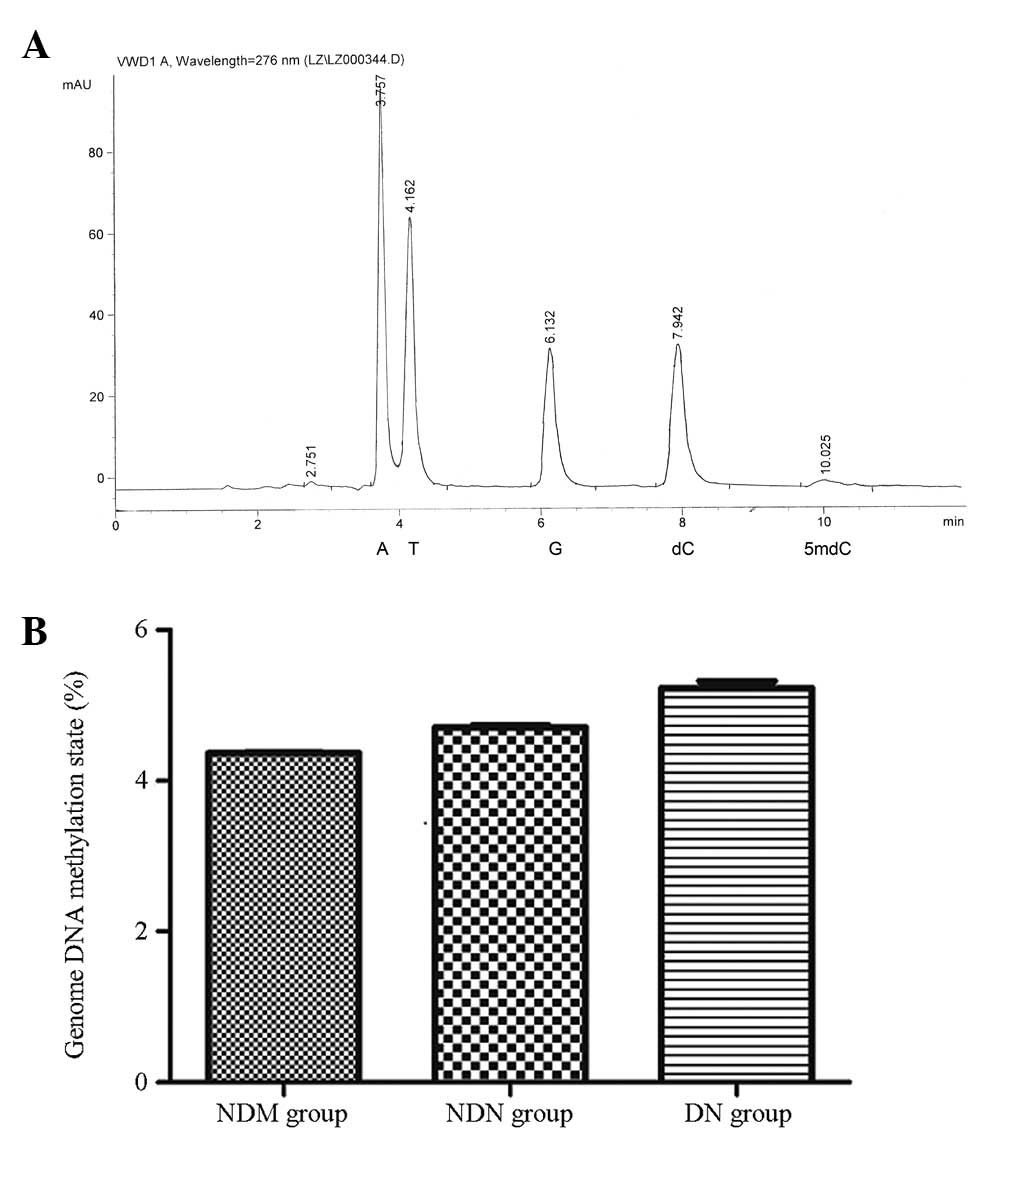 | Figure 1Genomic DNA methylation levels
analyzed by high-performance liquid chromatography. (A) Sample
chromatogram map. The peak time of sample dC was 7.942 min and that
of 5mdC was 10.025 min. Nucleotides: A, adenine; T, thymine; G,
guanine; dC, deoxidized cytosine; 5mdC, deoxidized 5-methyl
cytosine. (B) Quantified genomic DNA methylation levels in the
different groups. The genomic DNA methylation rate was 5.23±0.09%
in the DN group, 4.71±0.03% in the NDN group and 4.37±0.01% in the
NDM group. There were no significant differences among the groups.
NDM, non-diabetes control; NDN, diabetes without nephropathy; DN,
diabetes with nephropathy; VWD, variable wavelength detector. |
CTGF gene promoter methylation
states
BS amplification results confirmed complete
sulfonation of the DNA in the three groups. MSP analysis revealed
high levels of methylation in the CTGF gene promoter in the NDM
group. Methylation levels in the CTGF promoter were moderately
decreased in the NDN group (P<0.05) and significantly reduced in
the DN group (P<0.01; Fig. 2).
The rate of CTGF promoter methylation was 82.8% (24/29) in the NDM
group, compared with 43.2% (16/37) and 31.6% (12/38) in the NDN and
DN groups, respectively. Thus, the CTGF promoter in individuals in
the NDM group showed significantly higher methylation levels than
those in patients in the NDN or DN groups. The methylation rate in
the NDM group was 1.92-fold higher than that in the NDN group, and
2.62-fold higher than that in the DN group. The methylation rate in
the NDN group was 1.37-fold higher than that in the DN group.
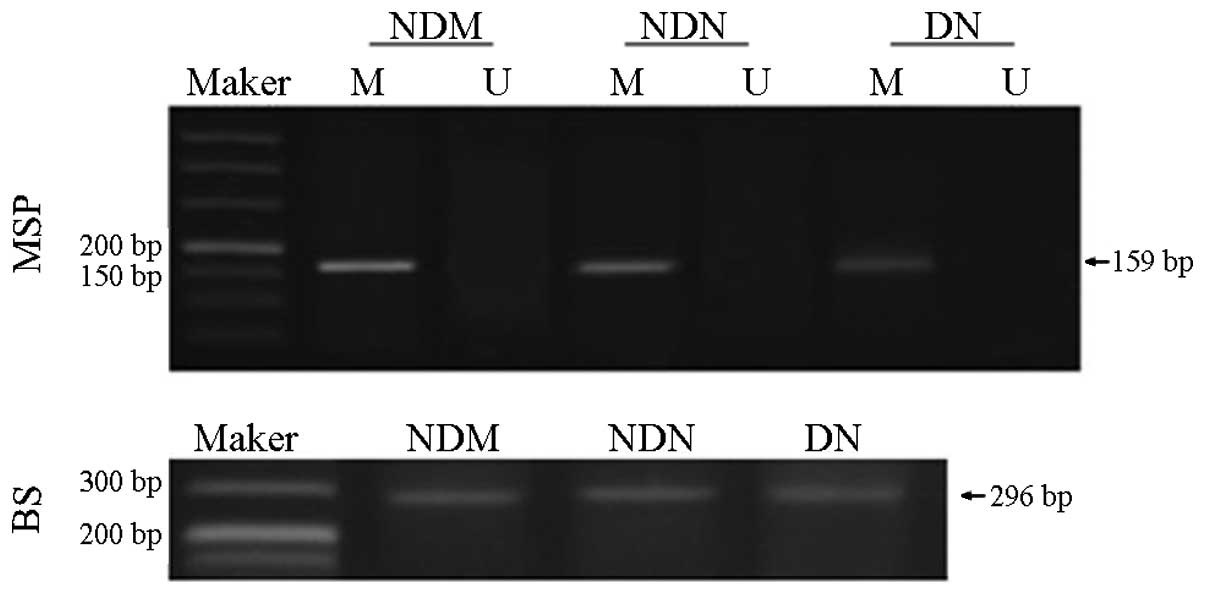 | Figure 2CTGF gene promoter methylation level
detected by MSP. The results show a high degree of methylation in
the CTGF gene promoter in the NDM group, which was moderately
decreased in the NDN group and significantly reduced in the DN
group. BS amplification results confirmed complete sulfonation
modification of DNA in the three groups. Marker, 50 bp DNA ladder;
M, amplified products with methylation-specific primers; U,
amplified products with non-methylation-specific primers. CTGF,
connective tissue growth factor; MSP, methylation-specific
polymerase chain reaction; BS, bisulfite sequencing; NDM,
non-diabetes control; NDN, diabetes without nephropathy; DN,
diabetes with nephropathy. |
The sequence maps for the NDM, NDN, and DN groups
are shown in Fig. 3A. The target
fragment was 296 bp long, and included 39 methylated C-G pairs.
Orig-all C-T was the original sequence fully sulfonated by sodium
bisulfate. In this sequence, all C-G pairs were sulfonated and not
methylated. The base sequence difference between the samples and
Orig-all C-T was compared using the JellyFish 1.3 software, and
mC/C-G (39) × 100% was used to calculate the methylation degree of
each sample. According to this, the calculated CTGF promoter
methylation level was 72.2±19.3% in the NDM group, which was
significantly higher than that in the NDN group (49.2±8.0%,
P=0.045). In addition, the CTGF promoter methylation level was
22.0±12.9% in the DN group, which was significantly lower than that
in the NDM group (P<0.001) and the NDN group (P=0.019) (Fig. 3B).
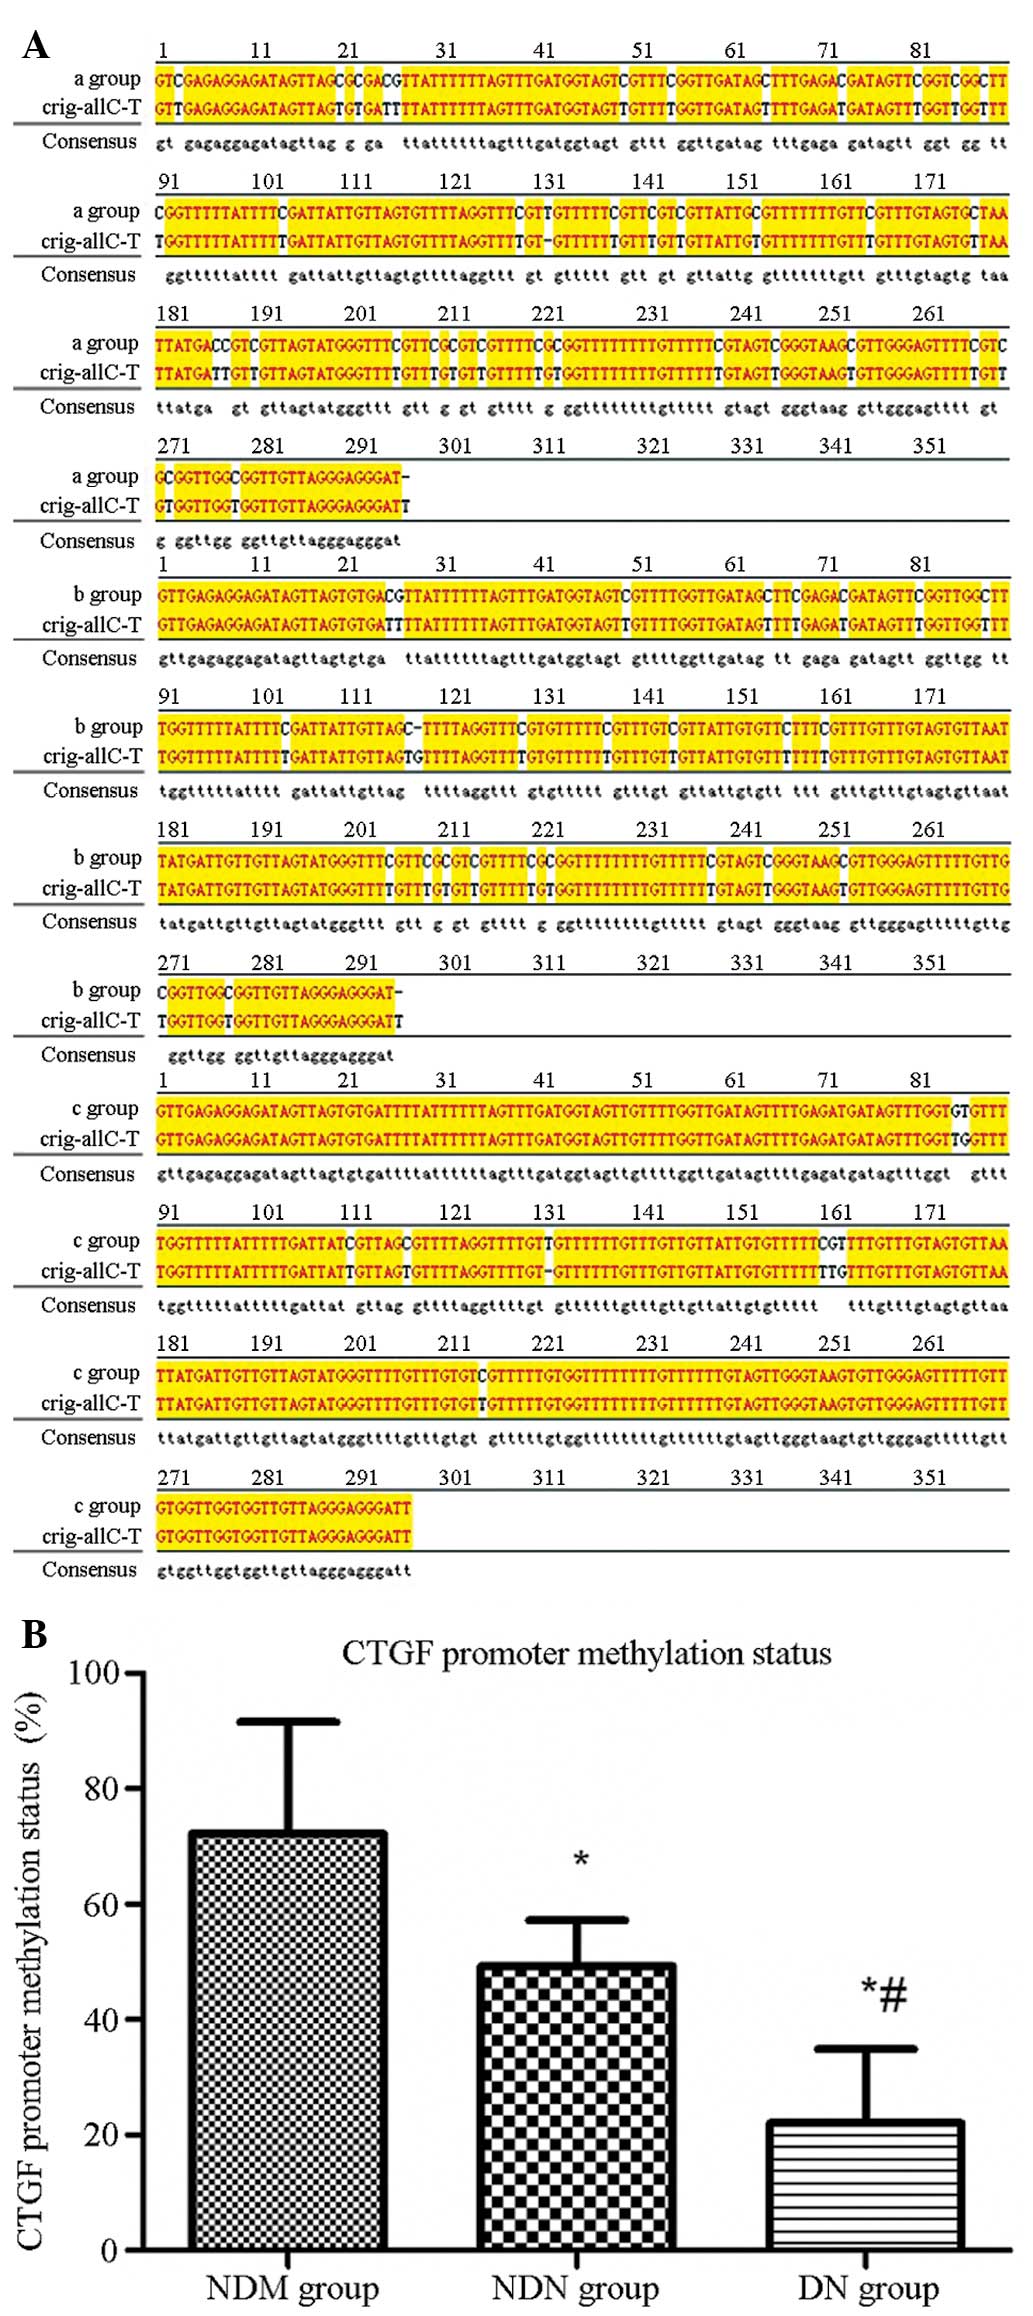 | Figure 3CTGF gene promoter methylation level
detected by sequencing. (A) CTGF gene promoter methylation sequence
mapping is shown for the (a) NDM, (b) NDN and (c) DN groups.
Orig-all C-T was the original sequence fully sulfonated by sodium
bisulfate. (B) Quantified CTGF gene promoter methylation levels in
the different groups. The CTGF promoter methylation rate was
72.2±19.3% in the NDM group, which was significantly higher than
that in the NDN group (49.2±8.0%) and the DN group (22.0±12.9%).
*P<0.05 versus NDM group; #P<0.05
versus NDN group. A, adenine; T, thymine; G, guanine; C, cytosine;
CTGF, connective tissue growth factor; NDM, non-diabetes control;
NDN, diabetes without nephropathy; DN, diabetes with
nephropathy. |
Serum CTGF protein levels
As shown in Fig. 4,
the CTGF protein levels in the DN group (median, 187.55 mg/l;
interquartile range, 137.33–254.08 mg/l) were significantly higher
than those in the NDM group (median, 98.40 mg/l; interquartile
range, 79.55–107.40 mg/l; P<0.001) and the NDN group (median,
124.0 mg/l; interquartile range, 105.10–142.15 mg/l; P<0.001).
In addition, the CTGF protein levels in the NDN group were
significantly higher than those in the NDM group (P<0.001).
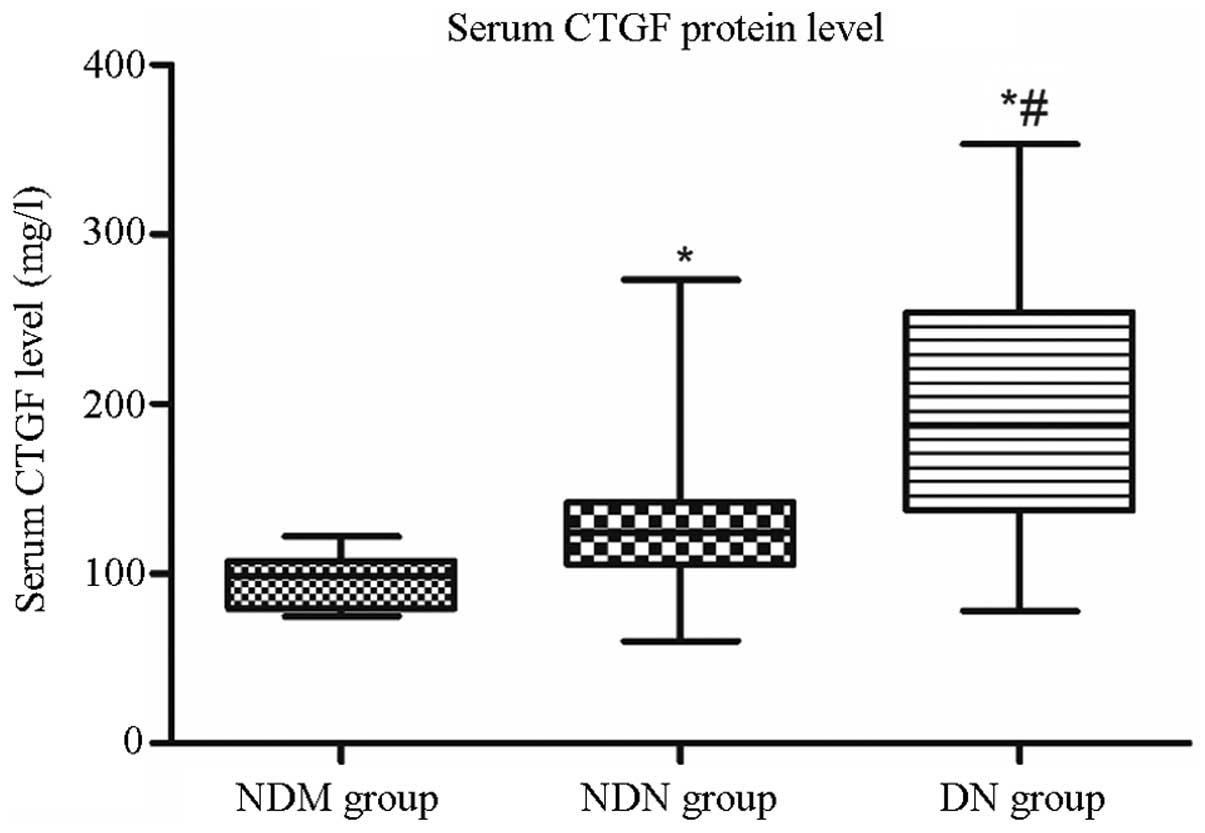 | Figure 4Serum CTGF protein levels were
detected in different groups by ELISA. CTGF protein levels in the
DN group (median, 187.55 mg/l; interquartile range, 137.33–254.08
mg/l) were significantly higher than those in the NDM group
(median, 98.40 mg/l; interquartile range, 79.55–107.40 mg/l) and
the NDN group (median, 124.0 mg/l; interquartile range,
105.10–142.15 mg/l). *P<0.05 versus NDM group;
#P<0.05 versus NDN group. CTGF, connective tissue
growth factor; NDM, non-diabetes control; NDN, diabetes without
nephropathy; DN, diabetes with nephropathy. |
Variables affecting CTGF expression
In order to exclude the confounding variables
affecting the serum CTGF levels in patients with type 2 DM and DN,
Pearson’s correlation analysis was used, and the results showed
that age (r=0.197, P<0.05), UACR (r=0.591, P<0.01), BUN
(r=0.443, P<0.01), Cr (r=0.393, P<0.01), FBS (r=0.278,
P<0.01) and PBS (r=0.399, P<0.01) were positively correlated
with CTGF expression levels, while a significant negative
correlation was detected for the eGFR (r=−0.438, P<0.01),
methylation levels (r=−0.367, P<0.01) and CTGF expression
levels. In a multiple stepwise regression analysis using CTGF as
the dependent variable and age, UACR, BUN, Cr, FBS, PBS, eGFR and
methylation levels as independent variables, only UACR (β=0.452,
P<0.001), eGFR (β=−0.181, P=0.034) and methylation levels
(β=−0.282, P<0.001) remained significantly associated with CTGF,
indicating that they are the factors influencing CTGF expression
(Table II).
| Table IISummary of multiple stepwise
regression analysis for variables affecting CTGF. |
Table II
Summary of multiple stepwise
regression analysis for variables affecting CTGF.
| Variables | B | SE | Standard β | t | P-value |
|---|
| UACR | 0.387 | 0.074 | 0.452 | 5.220 | <0.001 |
| eGFR | −0.420 | 0.195 | −0.181 | −2.150 | 0.034 |
| CTGF methylation | −35.837 | 9.879 | −0.282 | −3.628 | <0.001 |
| FBS | 2.751 | 3.735 | 0.060 | 0.737 | 0.463 |
Discussion
In the present study, the methylation levels of the
whole genomic DNA and the CTGF promoter, as well as serum CTGF
levels in patients with type 2 DM and with or without DN, were
examined. DNA methylation is the most common type of apparent
genetic modification, and plays essential roles in immune system
imbalance, oxidative stress, inflammation, insulin resistance and
fibroblast activation. In addition, DNA methylation has been
proposed to be an important mechanism in the formation of renal
fibrosis and cardiovascular complications in patients with chronic
kidney disease (CKD) (17,18). DNA methylation has also been
suggested to have a role in DM development through the silencing of
zinc finger protein genes and through the maternal low-methylation
syndrome that is directly associated with neonatal transient
diabetes (19,20). The present study showed that the
methylation levels of whole genomic DNA in peripheral blood were
higher in patients in the DN or NDN groups than those in healthy
volunteers; however, there were no significant differences among
these three groups. In accordance with the findings of the present
study, it has been previously reported that the methylation levels
of the whole genome are not significantly different among patients
with stages 2–4 CKD, and are not correlated with the GFR (21). The precise reason and mechanism for
this remain to be elucidated. It is possible that the methylation
of the overall genome reflects the sum of various degrees of gene
methylation in multiple organs, thereby limiting the feasibility of
detecting disease-specific methylation profiles. In addition, other
systemic disorders, oxidative stress and/or chronic inflammation
may complicate the methylation profile.
Although the present study shows that there is no
significant difference in the methylation levels of the whole
genomic DNA between patients with type 2 DM (with or without DN)
and healthy volunteers, it has been reported that certain genes
that are associated with type 2 DM harbor changes in methylation
levels. Kuroda et al (22)
reported that the insulin promoter of pancreatic β cells in
non-diabetic mice and humans was demethylated. Methylation of the
insulin promoter is involved in the regulation of insulin
expression, and is associated with the levels of HbA1c expression
(23). Mesangial cells are
considered to be the key target cells of the pathogenic factors of
DN. High glucose levels can activate CTGF transcription and
expression through transforming growth factor-β-dependent and
-independent pathways, thereby increasing extracellular matrix
expression and leading to glomerular sclerosis (24,25).
As a result, CTGF has been recognized as a central
matrix-associated candidate in DN. A previous in vitro study
performed by our group showed that 10 μM 5-aza-dCyd led to the
complete demethylation of the CTGF promoter methylation region and
induced the expression of CTGF, which indicates that CTGF gene
expression is regulated by the methylation status of the promoter
and is negatively correlated with the degree of methylation of the
CpG islands (13). The results
also showed that high glucose levels were able to induce CTGF
promoter demethylation, indicating that high glucose levels may be
involved in the regulation of CTGF gene expression by inducing DNA
methylation in vitro.
The present study investigated the methylation
status of the CTGF promoter in patients with type 2 DM with or
without DN. MSP analysis showed that methylation of the CTGF gene
promoter was present in 82.9% of healthy volunteers, while it was
significantly reduced in patients in the NDN (43.2%) and DN (31.6%)
groups. Sequencing results further confirmed the differences in the
methylation status of the CTGF promoter in the three groups. CTGF
serum protein expression was higher in the DN group than that in
the NDN and NDM groups and higher in the NDN group than that in the
NDM group, suggesting that CTGF expression may be negatively
correlated with promoter methylation levels in patients with DN.
Therefore, Pearson’s correlation analysis was performed to
investigate which factors affect CTGF expression. The results show
that CTGF expression levels are negatively correlated with eGFR or
methylation levels, while they are positively correlated with age,
UACR, BUN, Cr, FBS and PBS. Multiple stepwise regression analysis
demonstrated that UACR, eGFR and methylation levels are associated
with CTGF expression in the blood. In a study conducted by El
Mesallamy et al, patients with DM and microalbuminuria or
macroalbuminuria were shown to have significantly elevated serum
CTGF levels as compared with those in control and normoalbuminuric
subjects. A positive correlation was identified between the CTGF
and FBS levels as well as albumin excretion rate (AER); however,
multiple stepwise regression analysis revealed that only AER
(β=0.5398, P<0.01) remained significantly associated with CTGF
expression (26). Similarly,
urinary CTGF levels were significantly elevated in patients with
microalbuminuria and macroalbuminuria, and correlated with the
progression of microalbuminuria (27). These results are consistent with
the results of the present study.
In conclusion, the present study has demonstrated
that the CTGF gene promoter exists in a low methylation state in
patients with DM and particularly in patients with DN. Furthermore,
it was demonstrated that the methylation level of the CTGF promoter
is an independent factor of CTGF expression. These findings
indicate that DNA methylation is a regulatory mechanism of CTGF
expression, possibly contributing to DN pathogenesis. Understanding
the role of the demethylation of the CTGF promoter in the
development of DN may lead to the identification of novel
strategies and/or additional therapeutic targets for the prevention
and treatment of DN.
The present study had several limitations. DN is
normally diagnosed by renal biopsy; however, this was not feasible
in terms of clinical practice in the present study. A fundus
examination was used in this study as the screening method for
patients with DN, since it has been indicated that retinopathy
provides sufficient evidence for glomerulopathy in patients with
type 2 DM and albuminuria (15).
In addition, despite the fact that previous in vitro studies
performed by our group indicated that methylation was involved in
the regulation of CTGF expression in mesangial cells, and that the
present study revealed that patients with DN had decreased
methylation levels of CTGF, the proposed mechanism still requires
further investigation using animal models.
Acknowledgements
The present study was supported by the National
Natural Science Foundation of China (no. 81100516), the Scientific
and Technological Project of Hunan Province (no. 2011FJ3217) and
the Fundamental Research Funds for the Central Universities (no.
2011QNZT200).
References
|
1
|
Melendez-Ramirez LY, Richards RJ and
Cefalu WT: Complications of type 1 diabetes. Endocrinol Metab Clin
North Am. 39:625–640. 2010. View Article : Google Scholar
|
|
2
|
Gheissari A, Javanmard SH, Shirzadi R,
Amini M and Khalili N: The effects of blocking Angiotensin
receptors on early stages of diabetic nephropathy. Int J Prev Med.
3:477–482. 2012.PubMed/NCBI
|
|
3
|
Hirst JA, Taylor KS, Stevens RJ, et al:
The impact of renin-angiotensin-aldosterone system inhibitors on
Type 1 and Type 2 diabetic patients with and without early diabetic
nephropathy. Kidney Int. 81:674–683. 2012. View Article : Google Scholar : PubMed/NCBI
|
|
4
|
Vejakama P, Thakkinstian A, Lertrattananon
D, Ingsathit A, Ngarmukos C and Attia J: Reno-protective effects of
renin-angiotensin system blockade in type 2 diabetic patients: a
systematic review and network meta-analysis. Diabetologia.
55:566–578. 2012. View Article : Google Scholar : PubMed/NCBI
|
|
5
|
Tonna S, El-Osta A, Cooper ME and Tikellis
C: Metabolic memory and diabetic nephropathy: potential role for
epigenetic mechanisms. Nat Rev Nephrol. 6:332–341. 2010. View Article : Google Scholar : PubMed/NCBI
|
|
6
|
Reddy MA and Natarajan R: Epigenetics in
diabetic kidney disease. J Am Soc Nephrol. 22:2182–2185. 2011.
View Article : Google Scholar : PubMed/NCBI
|
|
7
|
Maier S and Olek A: Diabetes: a candidate
disease for efficient DNA methylation profiling. J Nutr. 132(Suppl
8): 2440S–2443S. 2002.PubMed/NCBI
|
|
8
|
Bell CG, Teschendorff AE, Rakyan VK,
Maxwell AP, Beck S and Savage DA: Genome-wide DNA methylation
analysis for diabetic nephropathy in type 1 diabetes mellitus. BMC
Med Genomics. 3:332010. View Article : Google Scholar : PubMed/NCBI
|
|
9
|
Guha M, Xu ZG, Tung D, Lanting L and
Natarajan R: Specific down-regulation of connective tissue growth
factor attenuates progression of nephropathy in mouse models of
type 1 and type 2 diabetes. FASEB J. 21:3355–3368. 2007. View Article : Google Scholar : PubMed/NCBI
|
|
10
|
Nguyen TQ, Tarnow L, Jorsal A, et al:
Plasma connective tissue growth factor is an independent predictor
of end-stage renal disease and mortality in type 1 diabetic
nephropathy. Diabetes Care. 31:1177–1182. 2008. View Article : Google Scholar : PubMed/NCBI
|
|
11
|
Kikuchi R, Tsuda H, Kanai Y, et al:
Promoter hypermethylation contributes to frequent inactivation of a
putative conditional tumor suppressor gene connective tissue growth
factor in ovarian cancer. Cancer Res. 67:7095–7105. 2007.
View Article : Google Scholar
|
|
12
|
Chiba T, Yokosuka O, Fukai K, et al:
Identification and investigation of methylated genes in hepatoma.
Eur J Cancer. 41:1185–1194. 2005. View Article : Google Scholar : PubMed/NCBI
|
|
13
|
Yi B, Zhang H, Zhou H, Cai X, Sun J and
Liu Y: High glucose induce the demethylation of CTGF promoter and
gene expression. Xi Bao Yu Fen Zi Mian Yi Xue Za Zhi. 27:747–750.
2011.(In Chinese).
|
|
14
|
Bennett PH: Impact of the new WHO
classification and diagnostic criteria. Diabetes Obes Metab. (Suppl
2): S1–S6. 1999. View Article : Google Scholar : PubMed/NCBI
|
|
15
|
National Kidney Foundation. KDOQI clinical
practice guideline for diabetes and CKD: 2012 update. Am J Kidney
Dis. 60:850–886. 2012. View Article : Google Scholar : PubMed/NCBI
|
|
16
|
Nichols GA, Vupputuri S and Lau H: Medical
care costs associated with progression of diabetic nephropathy.
Diabetes Care. 34:2374–2378. 2011. View Article : Google Scholar : PubMed/NCBI
|
|
17
|
Bechtel W, McGoohan S, Zeisberg EM, et al:
Methylation determines fibroblast activation and fibrogenesis in
the kidney. Nat Med. 16:544–550. 2010. View
Article : Google Scholar : PubMed/NCBI
|
|
18
|
Dwivedi RS, Herman JG, McCaffrey TA and
Raj DS: Beyond genetics: epigenetic code in chronic kidney disease.
Kidney Int. 79:23–32. 2011. View Article : Google Scholar : PubMed/NCBI
|
|
19
|
Laborie LB, Mackay DJ, Temple IK, Molven
A, Søvik O and Njølstad PR: DNA hypomethylation, transient neonatal
diabetes, and prune belly sequence in one of two identical twins.
Eur J Pediatr. 169:207–213. 2010. View Article : Google Scholar : PubMed/NCBI
|
|
20
|
Varrault A, Bilanges B, Mackay DJ, et al:
Characterization of the methylation-sensitive promoter of the
imprinted ZAC gene supports its role in transient neonatal diabetes
mellitus. J Biol Chem. 276:18653–18656. 2001. View Article : Google Scholar : PubMed/NCBI
|
|
21
|
Nanayakkara PW, Kiefte-de Jong JC,
Stehouwer CD, et al: Association between global leukocyte DNA
methylation, renal function, carotid intima-media thickness and
plasma homocysteine in patients with stage 2–4 chronic kidney
disease. Nephrol Dial Transplant. 23:2586–2592. 2008.PubMed/NCBI
|
|
22
|
Kuroda A, Rauch TA, Todorov I, et al:
Insulin gene expression is regulated by DNA methylation. PLoS One.
4:e69532009. View Article : Google Scholar : PubMed/NCBI
|
|
23
|
Yang BT, Dayeh TA, Kirkpatrick CL, et al:
Insulin promoter DNA methylation correlates negatively with insulin
gene expression and positively with HbA(1c) levels in human
pancreatic islets. Diabetologia. 54:360–367. 2011. View Article : Google Scholar : PubMed/NCBI
|
|
24
|
Du J, Wang L, Liu X, et al: Janus kinase
2/signal transducers and activators of transcription signal
inhibition regulates protective effects of probucol on mesangial
cells treated with high glucose. Biol Pharm Bull. 33:768–772. 2010.
View Article : Google Scholar : PubMed/NCBI
|
|
25
|
Li X, Liu W, Wang Q, et al: Emodin
suppresses cell proliferation and fibronectin expression via
p38MAPK pathway in rat mesangial cells cultured under high glucose.
Mol Cell Endocrinol. 307:157–162. 2009. View Article : Google Scholar : PubMed/NCBI
|
|
26
|
El Mesallamy HO, Ahmed HH, Bassyouni AA
and Ahmed AS: Clinical significance of inflammatory and fibrogenic
cytokines in diabetic nephropathy. Clin Biochem. 45:646–650.
2012.PubMed/NCBI
|
|
27
|
Tam FW, Riser BL, Meeran K, Rambow J,
Pusey CD and Frankel AH: Urinary monocyte chemoattractant protein-1
(MCP-1) and connective tissue growth factor (CCN2) as prognostic
markers for progression of diabetic nephropathy. Cytokine.
47:37–42. 2009. View Article : Google Scholar : PubMed/NCBI
|


