Introduction
Prostate cancer (PCa) is the second leading cause of
cancer-associated mortality in the United States and the first in
Mexico among men. PCa is the most commonly diagnosed cancer in
males (1,2). Most PCa-associated mortalities are
due to advanced disease, and androgen deprivation therapy is
considered the primary approach in the treatment of symptomatic
advanced prostate cancer (3). This
treatment option is palliative rather than curative and although it
can marginally improve the likelihood of survival, the majority of
all patients progress to hormone-refractory PCa. The rate of PCa is
highest among Caucasians and African-Americans. The pathogenesis of
PCa is very long and results in frequent hospital visits, which
causes a high cost of treatment (4–6).
Although the survival rates for PCa patients are
high, because of the slow and steady nature of the disease, 30–40%
of patients experience prostate-specific antigen (PSA) recurrence
within 10 years of surgery or radiation treatment (7). Furthermore, tumor cells ultimately
develop resistance to therapy; however, there are few alternative
treatments available. Consequently, the median survival of advanced
and recurring disease in patients with prostate cancer is
drastically reduced (8).
An increase in circulating PSA levels following
definitive therapy usually accurately predicts progressive disease.
PSA can have a prognostic significance prior to therapy, since
lower PSA levels indicate that the disease will not likely recur
and higher levels indicate future resistance to therapy (9). PSA, however, is a problematic
screening tool since the overall sensitivity may be too low to
effectively predict mortality/survival rates (10). Conversely, increasing the
sensitivity of PSA may result in false-positive diagnosis of the
disease, since the majority of males with PCa will die of unrelated
causes (11). Novel PCa biomarkers
are required, which should have the ability to distinguish between
a benign and a malignant disease (12,13).
Apoptosis through the activation of two predominant
pathways may be induced by the binding of ligands to specific
receptors on the cell surface, or by non-specific cellular stress
(14). Both pathways converge at
the level of the caspases, which mediate cell death via cleavage of
various cellular substrates. Death receptors (DR) 4 and 5 bind to
the tumor necrosis factor-related apoptosis-inducing ligand
(TRAIL), which results in the recruitment of the Fas-associated
death domain (FADD) to the intracellular death domain and
subsequently induces the cleavage of procaspase-8 which initiates a
cascade of events leading downstream to apoptosis (15–18).
Reported studies have demonstrated that the surface
expression of DR5 is a potentially useful prognostic marker in
various cancers (19). The
progression of melanoma has been previously associated with a
decrease in DR5 and DR4 expression (20). Furthermore, DR5, along with other
TRAIL receptors, was shown to be useful in determining the risk of
breast cancer metastasis and patient survival (21). However, other studies have shown
that DR5 was not a significant prognostic marker (22,23).
These observations suggested that the prognostic value of DR5 may
be cancer type-specific. In these cases, the role of DR5 repression
in PCa was not examined.
A previous study by our group reported that the
transcription factor Yin Yang 1 (YY1) may function in the
pathogenesis of PCa. High expression levels of YY1 were associated
with tumor progression, and patient survival was linked to lower
levels of YY1 (24). In addition,
it was previously demonstrated that YY1 may transcriptionally
repress DR5 expression in prostate cancer cell lines (25–27).
The present study investigated the expression levels
of DR5 in PCa and its clinical significance. Since it was reported
that YY1 negatively regulates DR5 expression and that YY1 is
overexpressed in PCa (24,25), it was hypothesized that DR5
expression may be inhibited in PCa and may be inversely correlated
with YY1 expression. This hypothesis was tested by
immunohistochemistry (IHC) on tissue microarray (TMA) constructs,
prepared with tumor tissues derived from patients with PCa and
PIN.
Materials and methods
Patients
The study was approved by the Ethics Committee of
the Children Hospital of Mexico ‘Federico Gomez’ (Mexico City,
Mexico; HIM/2007/061). The study cohort consisted of samples from
93 randomly selected hormone-naïve patients, who underwent radical
retropubic prostasectomy or transurethral resection between 2002
and 2007 from the Department of Pathology of Hospital General
Regional No. 25, IMSS and Speciality Hospital CMN ‘La Raza’, IMSS
(Mexico City, Mexico). The cohort consisted of 20 low grade PIN low
grade (LG PIN), 19 high grade PIN (HG PIN) and 54 PCa samples. The
54 cases of PCa were classified according to the Gleason score as
follows: 27 low-grade prostatic carcinoma [Gleason score 2–5 (LG
PCa)] and 27 high-grade prostatic carcinoma [Gleason score 6–10 (HG
PCa)].
Prostate TMA construction
Formalin-fixed, paraffin-embedded archival tumor
specimens were prepared at the Immunology and Infection Research
Unit, National Medical Center ‘La Raza’ and at the Oncology Disease
Research Unit, Children Hospital of Mexico ‘Federico Gomez’, SSa.
At least three core tissue biopsies (each 0.6 mm in diameter) were
taken from morphologically representative regions of each prostate
tumor and precisely arrayed as previously described (29–31).
Tumor samples were accompanied by matching benign (morphologically
normal or hyperplasic) and PIN lesions, where available. Tissues
were arrayed into five TMA blocks. For staining, sections (4 μm)
were transferred to glass slides using an adhesive slide system
(PSA-CS 4; Instrumedics, Inc., St. Louis, MO, USA) to support
cohesion of the array elements.
Immunohistochemical analysis
Slices cut at 4 μm for the TMA were placed on slides
and either stained with Mayer’s hematoxylin and eosin (H&E) for
histopathological examination, or used for subsequent
immunohistochemical analysis. The expression levels of DR5 and YY1
were determined using DR5 (Abcam, Cambridge, MA, USA) and YY1
(Santa Cruz Biotechnology, Inc., Santa Cruz, CA, USA) antibodies.
Antigen retrieval was performed by immersing the slides in a
solution of 0.01% sodium citrate pH 6.0 for 5 min in boiling water.
Endogenous peroxidase activity was inhibited by immersing the
slides in 3% H2O2-methanol and
background-unspecific binding was decreased by incubating the
slides in 2% bovine serum albumin (BSA; Sigma-Aldrich, St. Louis,
MO, USA) in phosphate-buffered saline (PBS) for 60 min. The slides
were incubated overnight at room temperature with predetermined
optimal concentrations of anti-DR5 polyclonal antibody (1:500) and
anti-YY1 polyclonal antibody (1:750). In order to decrease
variability, all samples were processed at the same time in a
single experiment, using a single batch of antibody diluted in
PBS-BSA. Following washing, the slides were incubated with a
biotinylated secondary antibody (Universal LSAB kit; Dako
Corporation, Carpinteria, CA, USA) for 30 min at room temperature,
followed by incubation with a streptavidin-horseradish peroxidase
conjugate (Universal LSAB kit) for 30 min at room temperature and
then with 3,3′-diaminobenzidine tetra-hydrochloride (liquid DAB,
Dako Corporation). The reaction was stopped ny adding distilled
water and the slides were counterstained with H&E. The tissue
was washed in tap water for 5 min, dehydrated using an ethanol
series (70, 90 and 100%) in xylene and mounted with E-2 mounting
medium (Shandon lab, Pittsburgh, PA, USA). The slides were then
analyzed by light microscopy (Olympus BX-40; Olympus Corporation,
Tokyo, Japan).
Scoring of immunohistochemical
staining
A semi-quantitative assessment of tissue antibody
staining was conducted by an expert pathologist on prostate
analysis, who was blinded to the pathological variables. The
stained slides were verified by a second expert to ensure
consistency in the scoring. Positive expression was scored based on
either a positive staining on the membrane (DR5) or positive
staining only in the nucleus (YY1). Data are presented as
positively stained target cells per 100 cells (range 0–100%
positive), per tissue region in the TMA (4 regions in each slide).
In addition, the integrated optical density (IOD) in ~300
μm2 regions per sample, selected randomly using the
Image Pro-plus 6.4 software (Media Cybernetics, Bethesda, MD, USA),
were analyzed.
The analysis of the expression levels on the TMAs
was performed in a blind manner. The TMA spot was a second blinded
quantitative assessment by the same pathologist. The target tissue
for scoring was the glandular prostatic epithelium and the scoring
of benign tissues did not include basal cells. The tissue spot
histology and grading were confirmed on the counterstained study
slides. Positive expression, indicated by a brown color, was
quantified using the IODs. The density of the staining intensity in
each region was analyzed using the Image Pro-plus 6.2 software
(MediaCybernetics, Rockville, MD, USA) that was obtained with the
diffusion of the light wavelength through the color density in the
cells stained brown. The target tissue for scoring was performed in
the malignant cells by considering the nuclear staining pattern for
YY1 and the membrane cytoplasmic staining pattern for DR5. YY1
nuclear expression and DR5 cytoplasmic membrane expression were
scored using two measures, negative and positive (weakly,
moderately and strongly positive) intensities, in target cells. The
data are presented as positively stained target cells per 100 cells
(range 0–100% positive), per region on each spot (four regions in
each spot), or as density, whereby four 100 μm2 regions
per spot were selected randomly to represent expression within each
case. The mean pooled integrated intensity of the tumor or control
spots was used.
Statistical analysis
The data were analyzed using Student’s t-test for
parametric data and the Mann-Whitney test for non-parametric data.
To analyze normalized data, both the analysis of variance (ANOVA)
and the Bonferroni tests were used. P<0.05 was considered to
indicate a statistically significant difference.
The optimal cut-point for dichotomized PCa
malignancy data was determined using the Gleason scoring system
(32). The YY1-IOD-expression and
DR5 expression were quantified by determining the sum of the IODs
and the mean was calculated for each pathological group (malignant
cells). For YY1 nuclear and DR-5 cytoplasmic membrane staining, the
percentage of positive malignant cells (weak to strong brown
staining) was obtained. Descriptive statistics were gathered for
all the assembled data. For differences between the pathological
groups that were used, Student’s t test and the ANOVA Pearson’s
tests were used to analyze correlations of parametric data,
respectively. Box plots to compare the various groups (central
tendency, dispersion and symmetry of the data) were generated.
P<0.05 was considered to indicate a statistically significant
difference. All statistical analyses were performed using SSPS 11
statistical analysis program for Windows (SPSS Inc., Chicago, IL,
USA) and GraphPad Prism 5.0 (GraphPad, San Diego, CA, USA).
Comparative metaprofiling of cDNA
expression data
The Oncomine Premium database (Oncomine™ Compendia
Bioscience, Ann Arbor, MI, USA) was used for analysis and
visualization of the bioinformatics analyses (www.oncomine.com). The differential expression
analysis of YY1 and DR5 in existing prostate cancer microarray
datasets was analyzed by setting a threshold value for gene rank at
10% and P<0.05.
Results
Evaluation of YY1 and DR5 protein
expression in human prostate cancer tissues
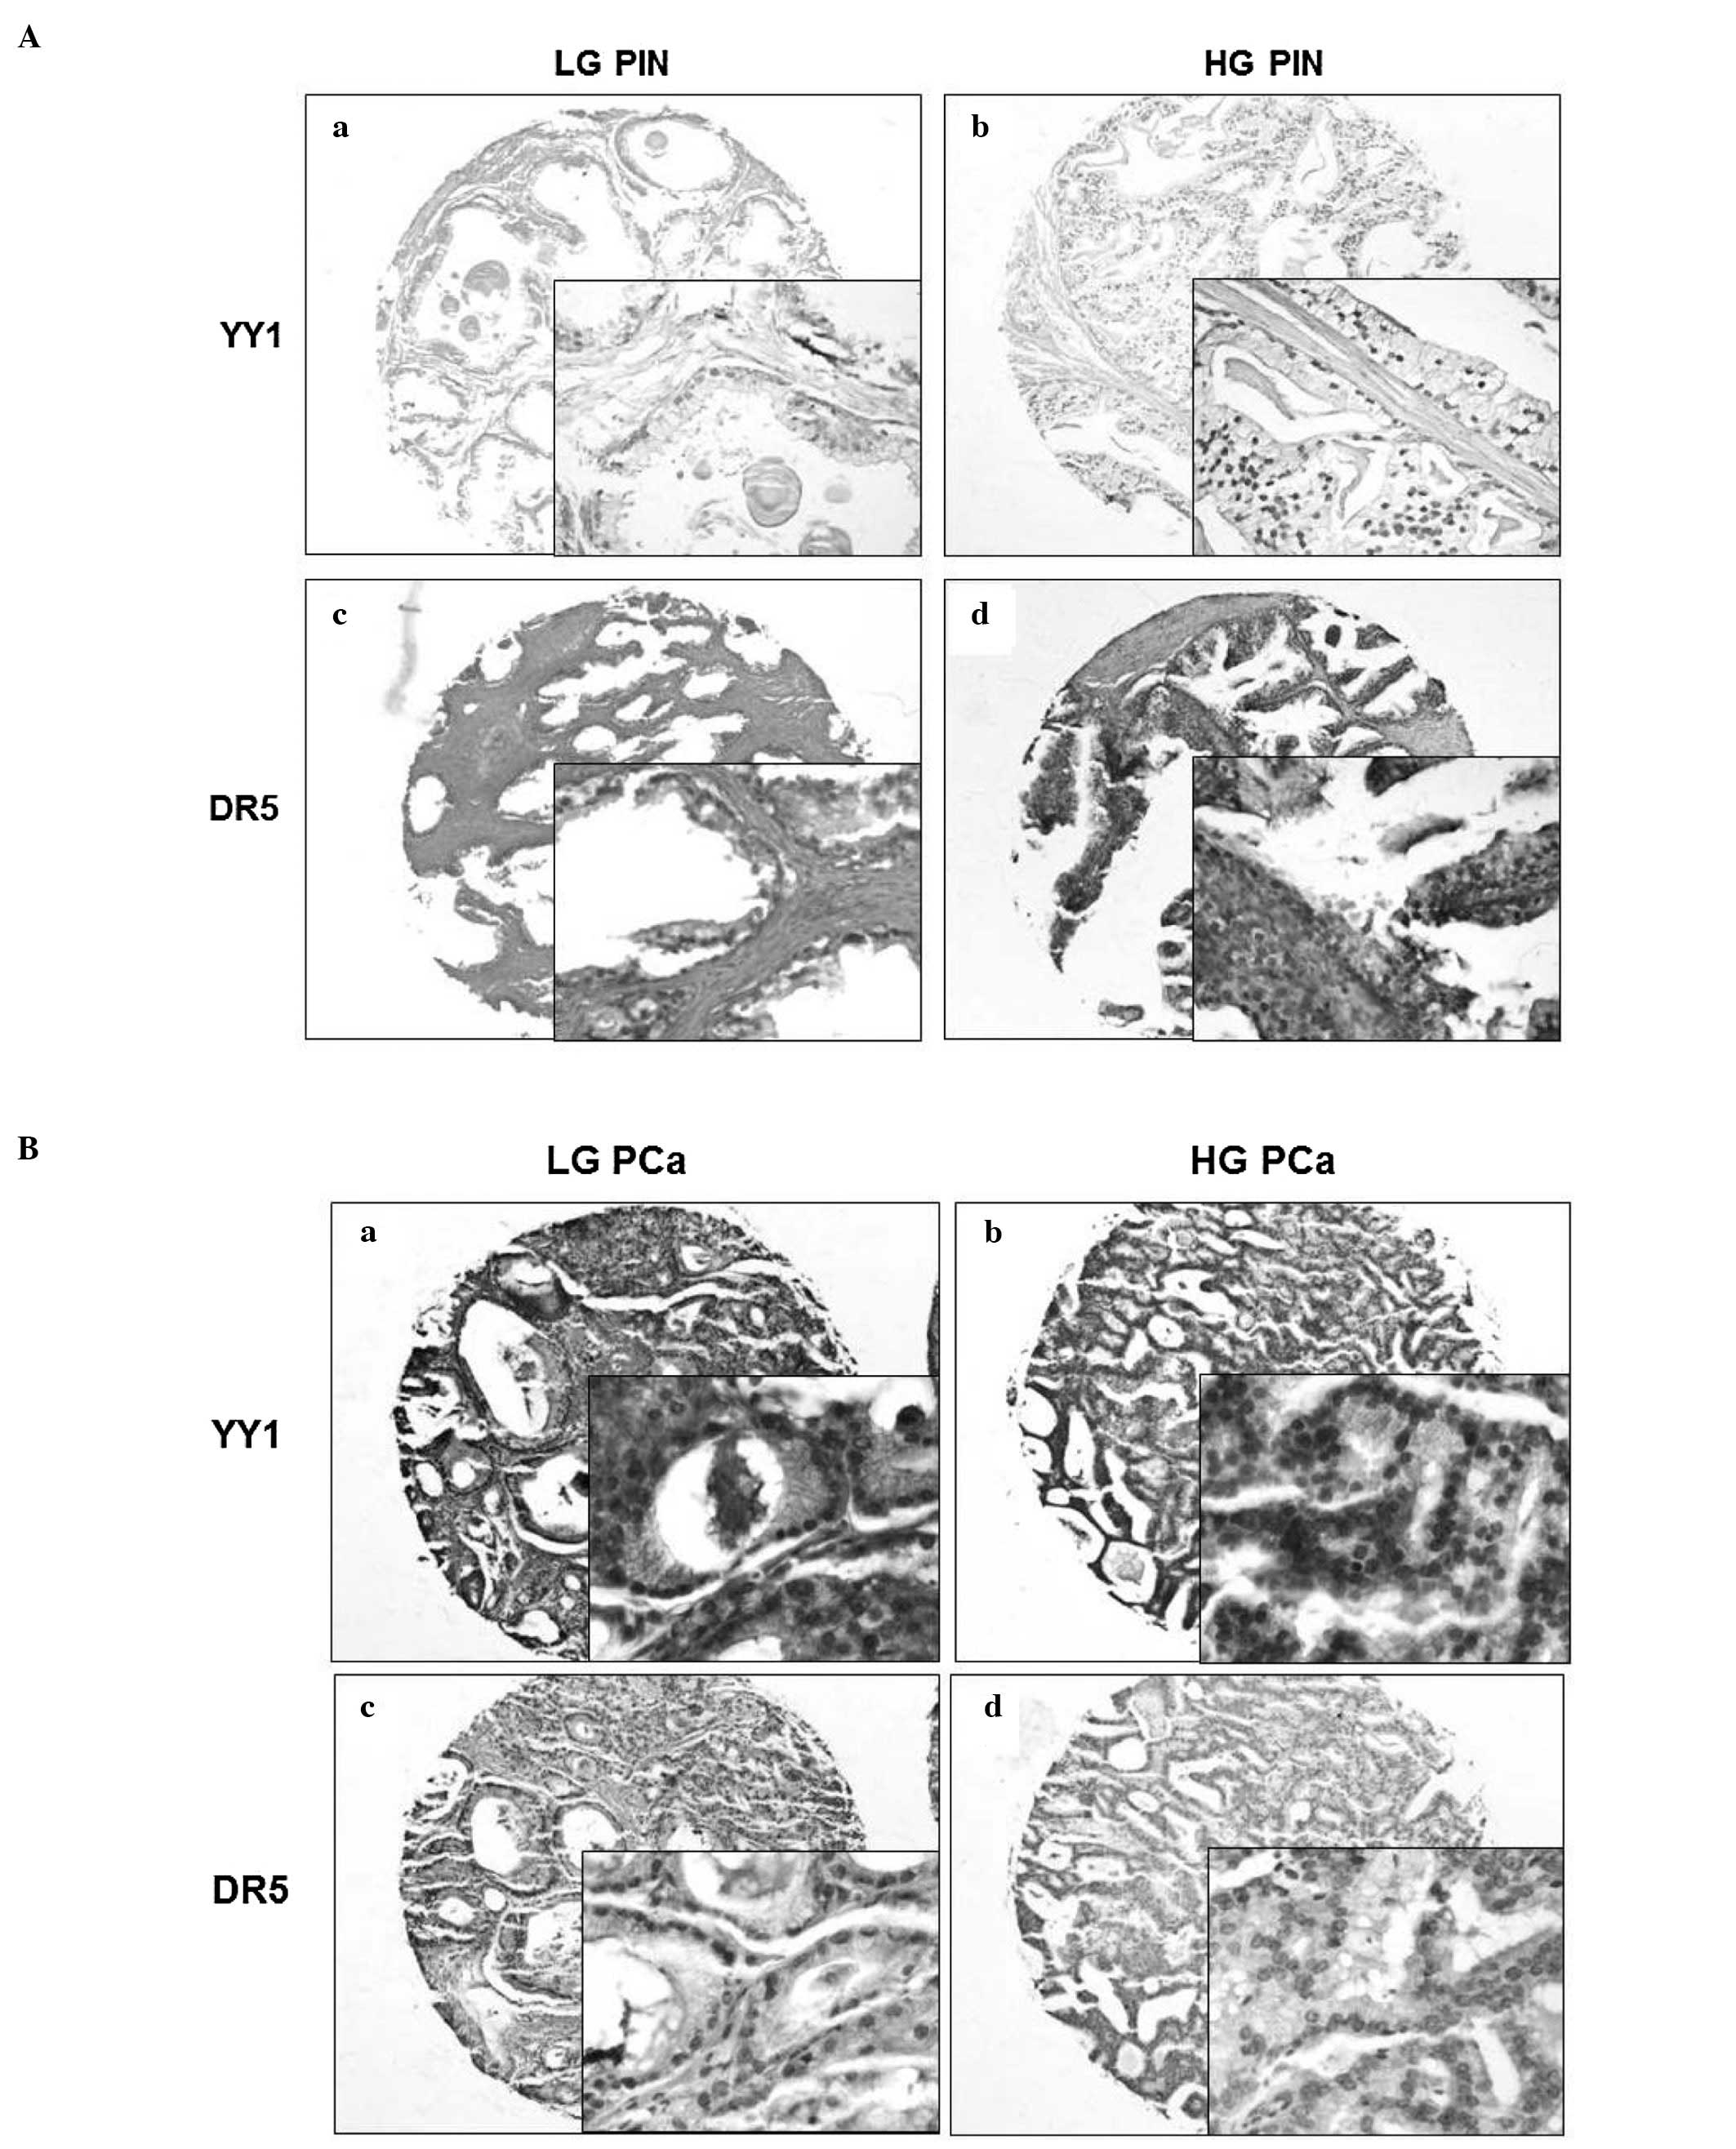
Using immunohistochemical analysis, the YY1 and DR5
expression in PCa tissue microarray samples was examined. The
expression of YY1 (Fig. 1Aa and b;
Fig. 1Ba and b) and DR5 (Fig. 1Ac and d; Fig. 1Bc and d) in human PCa tissues were
examined in the PIN and malignant glandular epithelium (Figs. 1 and 2, respectively). YY1 was expressed
predominantly in the nucleus and diffusely in the cytoplasm. DR5
was expressed on the membrane and in the cytoplasm. The expression
of YY1 in the PIN samples was weak and predominantly localized to
the cytoplasm. By contrast, the DR5 expression in the PIN samples
was detected in the membrane and in the cytoplasm. In tumor
samples, the YY1 expression was directly proportional to the
malignant grade, whereby the highest expression was observed in HG
PCa as compared with the expression in the LG PCa (Fig. 2Aa and b). By contrast, the DR5
expression was inversely proportional to the tumor grade (low in HG
PCa and high in LG PCa) (Fig. 2Ac and
d).
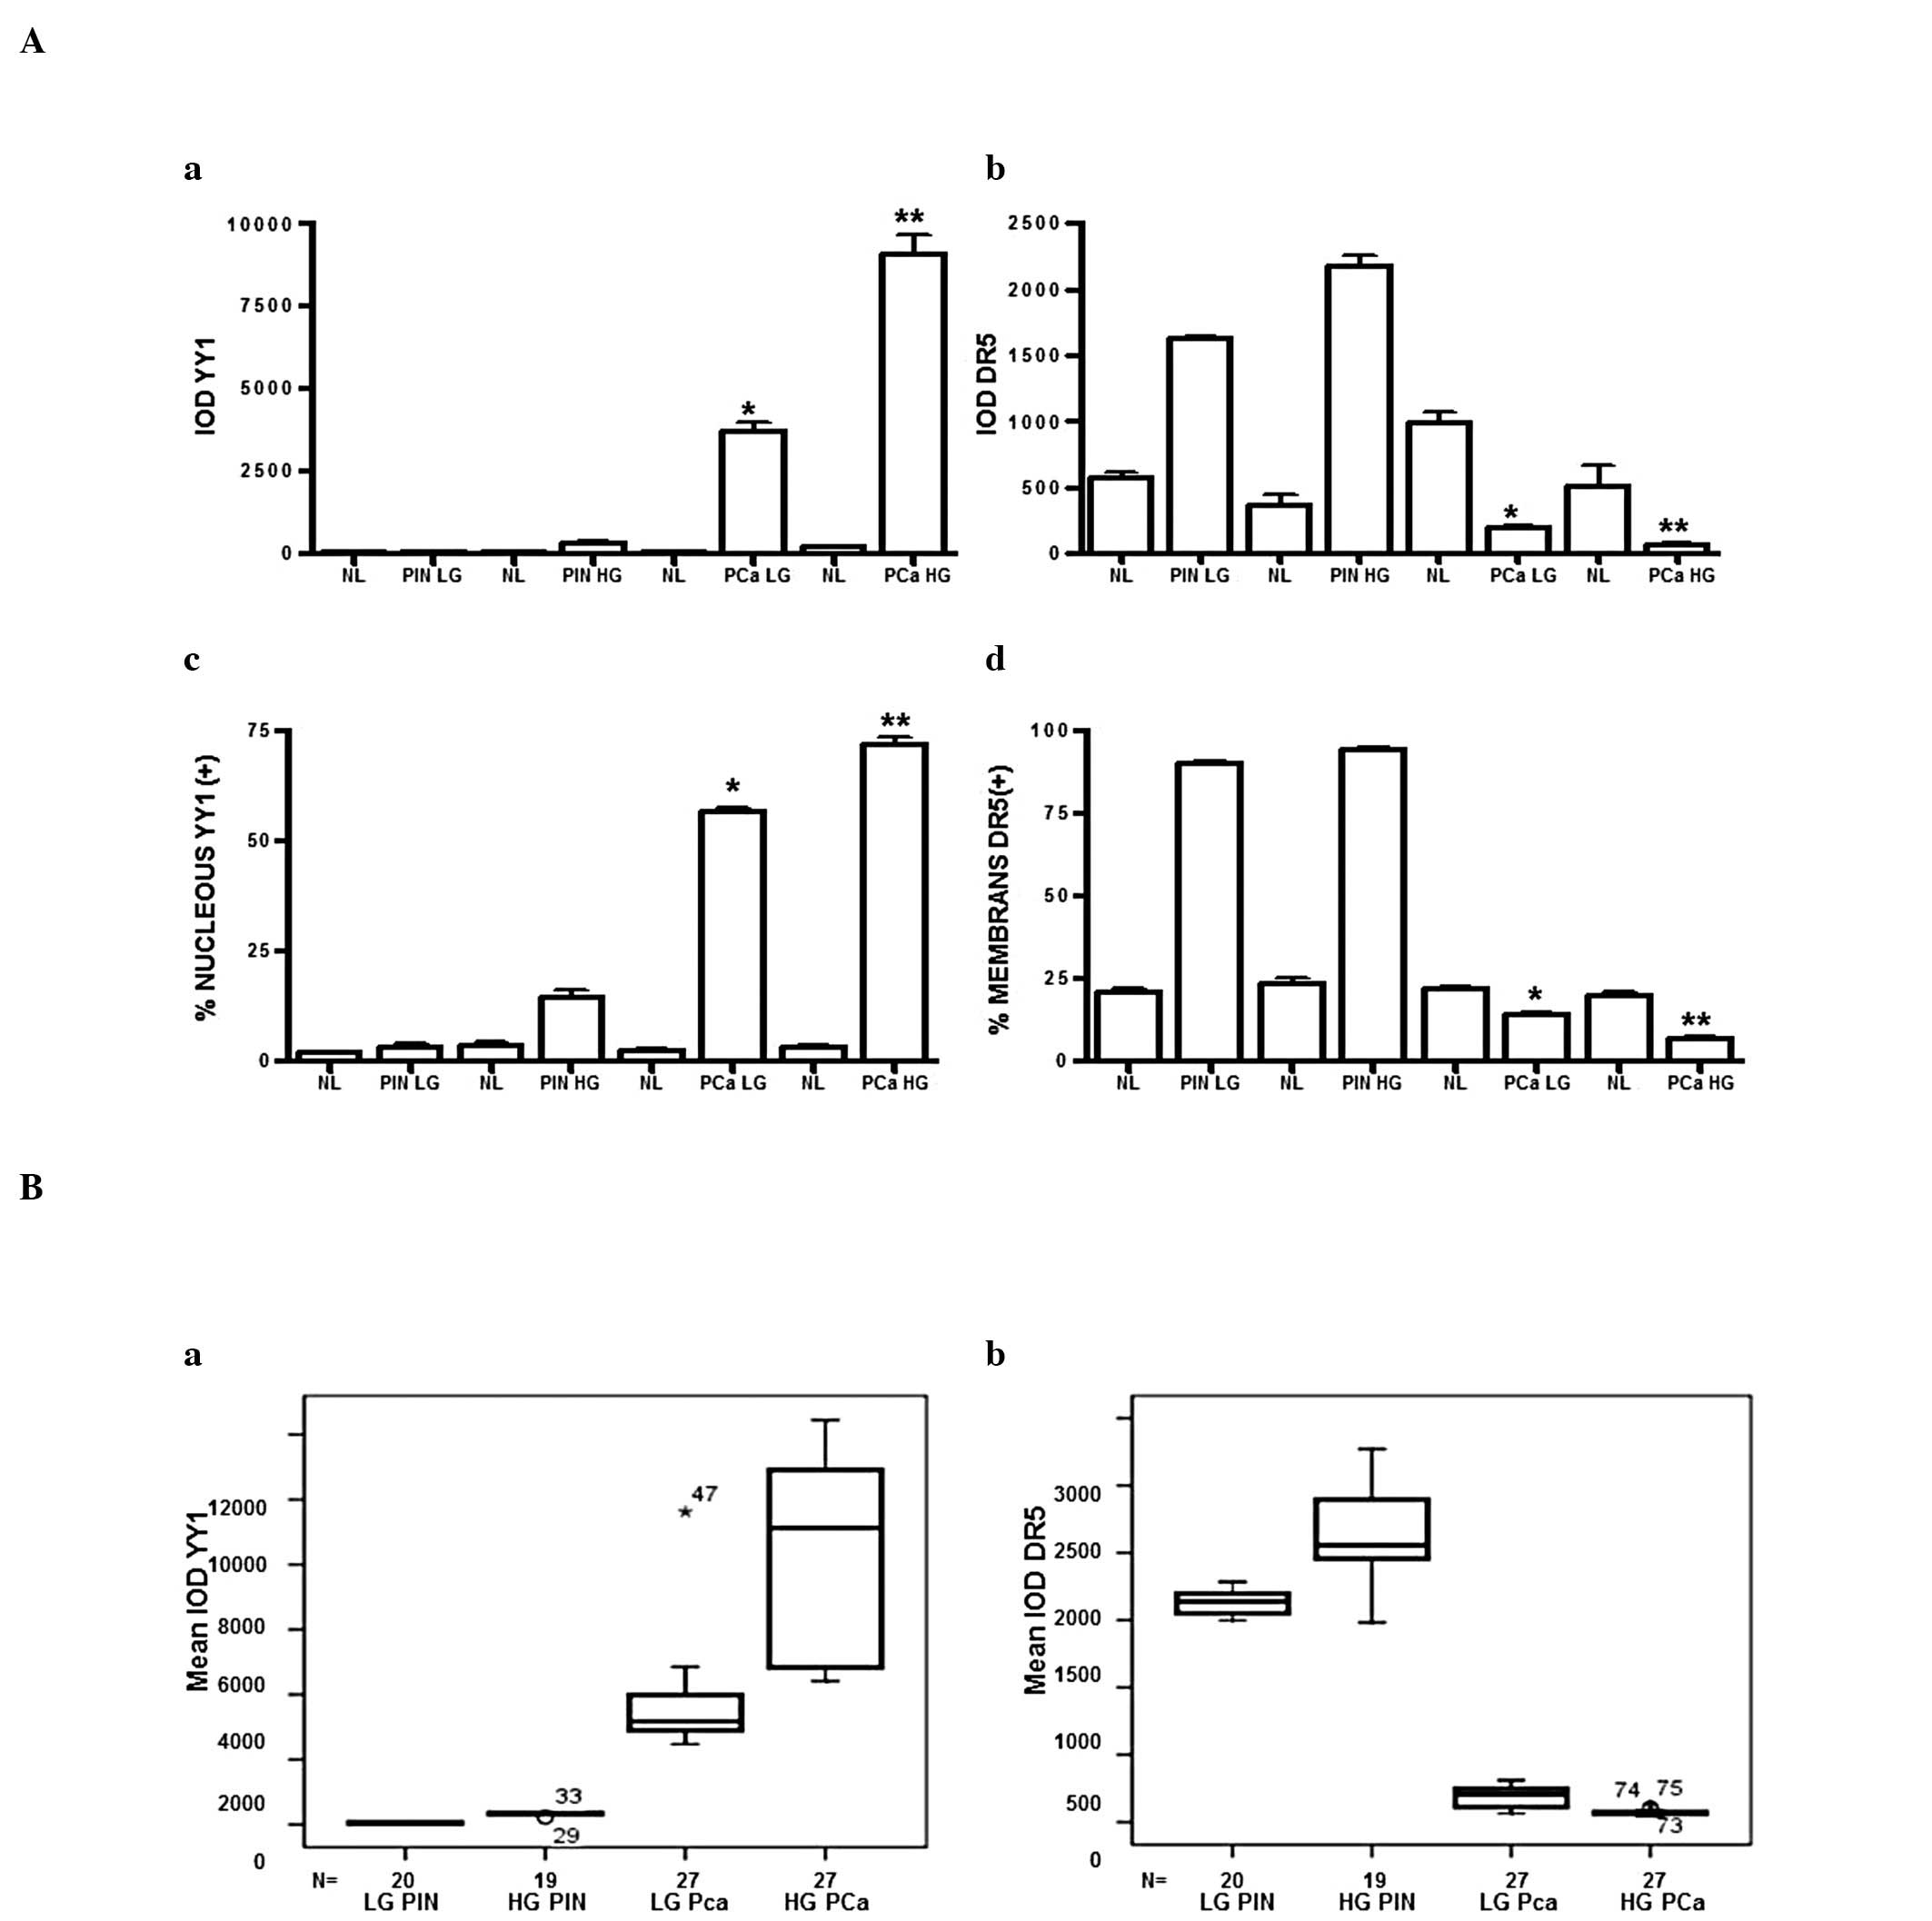 | Figure 2Expression and distribution of YY1
and DR5 in PIN and PCa in TMAs stratified by histological category.
(A) The YY1 IOD and nuclear staining expression, and the DR5 IOD
and DR5 protein expression in the cytoplasm and membrane,
determined by immunohistochemistry, are shown as means represented
as a bar graph, from the data of 270 informative tissue microarray
spots containing NL (n=54), LG PIN (n=20), HG PIN (n=19), LG PCa
(n=27), and HGPCa (n=27). (a) The mean YY1 IOD was significantly
higher in the LG PCa (IOD=3675, P<0.001) and highest in the HG
PCa (IOD=9042 P<0.001) as compared with the LG PIN (IOD=45) and
the HG PIN (IOD=332). (b) The mean DR5 IOD was significantly lower
in the LG PCa (IOD=3675 P<0.001) and significantly lower or
absent in the HG PCa (IOD=9042, P<0.001) as compared with the LG
PIN (IOD=45) and the HG PIN (IOD=332). (c) The mean YY1 expression
in nuclear staining was significantly higher in the LG PCa
(IOD=3675, P<0.001) and highest in the HGPCa (IOD=9042,
P<0.001) as compared with the LG PIN (IOD=45) and the HG PIN
(IOD=332). (d) The mean DR5 expression in the cytoplasm membrane
was significantly lower in the LG PCa (IOD=3675, P<0.001) and
significantly lower or absent in the HG PCa (IOD=9042, P<0.001)
as compared with the LG PIN (IOD=45) and the HG PIN (IOD=332). (B)
YY1 and DR5 boxplots on the PIN and the PCa of different degrees in
the TMAs, stratified by histological category. The distribution of
the study population into different groups is represented
graphically. (a) YY1 IOD distribution in the LG PIN, HG PIN, LG PCa
and HG PCa. Both the PIN box plots are short since the YY1 IOD had
a homogeneous distribution and minimal dispersion of cases. The YY1
IOD was low in both groups. The YY1 IOD expression in the PCa
groups had a box plot greater than the PIN groups. The YY1 IOD was
higher in both groups. The LG PCa box plot was less large, with a
negative asymmetrical distribution, indicating that the majority of
the measurements were lower than the HG PCa, but higher than the
PIN groups. In addition, there was a low dispersion due to the
homogeneity of the measurements. The HG PCa box plot had a positive
asymmetrical distribution, meaning that the majority of the
measurements were higher than those of the other groups. All the
differences were statistically significant with P<0.0001. (b)
DR5 IOD distribution in LG PIN, HG PIN, LG PCa and HG PCa. Both PIN
box plots were shorter than those of the YY1 IOD, most markedly in
the HG PIN group, where measures were greater. The dispersion in
both groups was minimal and although there was asymmetry, this
indicated that the measurements were homogeneous. The DR5 IOD
expression in the PCa groups was very low, with a low dispersion,
and a symmetrical and homogeneous distribution, which was due to
low or absent expression. All differences were statistically
significant with P<0.0001. *P=0.002 and
**P=0.01. YY1 Yin Yang 1; Dr5, death receptor 5; PIN,
prostatic intraepithelial neoplasia; PCa, prostate carcinoma; TMA,
tissue microarray constructions; IOD, integrated optical density;
LG PCa, low grade prostate carcinoma; HG PCa, high grade prostate
carcinoma; NL, normal prostate. |
Overexpression of YY1 and dowregulation
of DR5 in PCa tissues
The expression of YY1 and DR5 was quantified by
semiquantitative and quantitative assessments (Fig. 2B). There was a significant
difference in the expression of YY1 between the LG PIN and HG PIN
(Fig. 2Ba). In addition, there was
a significant difference in the DR5 expression between the LG PIN
and HG PIN samples (Fig. 2Bb)
(P=0.001). YY1 was significantly elevated in PCa tissues as
compared with the PIN tissues. YY1 expression was barely detectable
in PIN tissues and was significantly increased (P<0.001, ANOVA)
with an increase in tumor grade. This observation was similar in
both the density quantification (Fig.
2Aa) and positive cell counts (nuclear) (Fig. 2Bc). An opposite effect was observed
in the DR5 expression, whereby both the density of staining
(Fig. 2Ab) and the positive cell
counts (membrane) (Fig. 2Bd) were
significantly decreased (P<0.001, ANOVA) as a function of the
tumor grade. The highest levels of expression were observed in the
PIN samples (Fig. 2Ac and d).
Inverse correlation between DR5 and YY1
expressions in PCa tissues
A Pearson’s analysis was performed, based on the YY1
and DR5 expression in all of the tumor samples. The expression
levels of YY1 and DR5 were found to be inversely correlated in both
the LG PCa (P<0.036, r Pearson=−0.406) and HG PCa (P<0.0001,
r Pearson=−0.611) samples (Table
I).
 | Table IYY1 and DR5 expression and their
correlation in PCa, LG PCa and HG PCa. |
Table I
YY1 and DR5 expression and their
correlation in PCa, LG PCa and HG PCa.
| IOD | PCa
n=54 | LG PCa
n=27 | HG PCa
n=27 |
|---|
| YY1 | Median | 5857.44 | 3676 | 8038 |
| range | 2470-12446 | 2471-9622 | 3975-12446 |
| S.D. | 3253 | 1429 | 3107 |
| Median | 4570 | 3481 | 9128 |
| CI | 4969 | 3111 | 6810 |
| DR5 | Median | 132 | 193 | 60 |
| range | 38-310 | 75-310 | 38-73 |
| S.D. | 84 | 78.3 | 9 |
| Median | 89 | 205 | 61 |
| CI | 109 | 162 | 55 |
| r Pearson
YY1/DR5 | | −0.648 | −0.406 | −0.611 |
| P-value | | 0.0001 | 0.036 | 0.001 |
Bioinformatic analyses of YY1 and
TNFRSF10B (DR5) gene expression in prostate adenocarcinoma
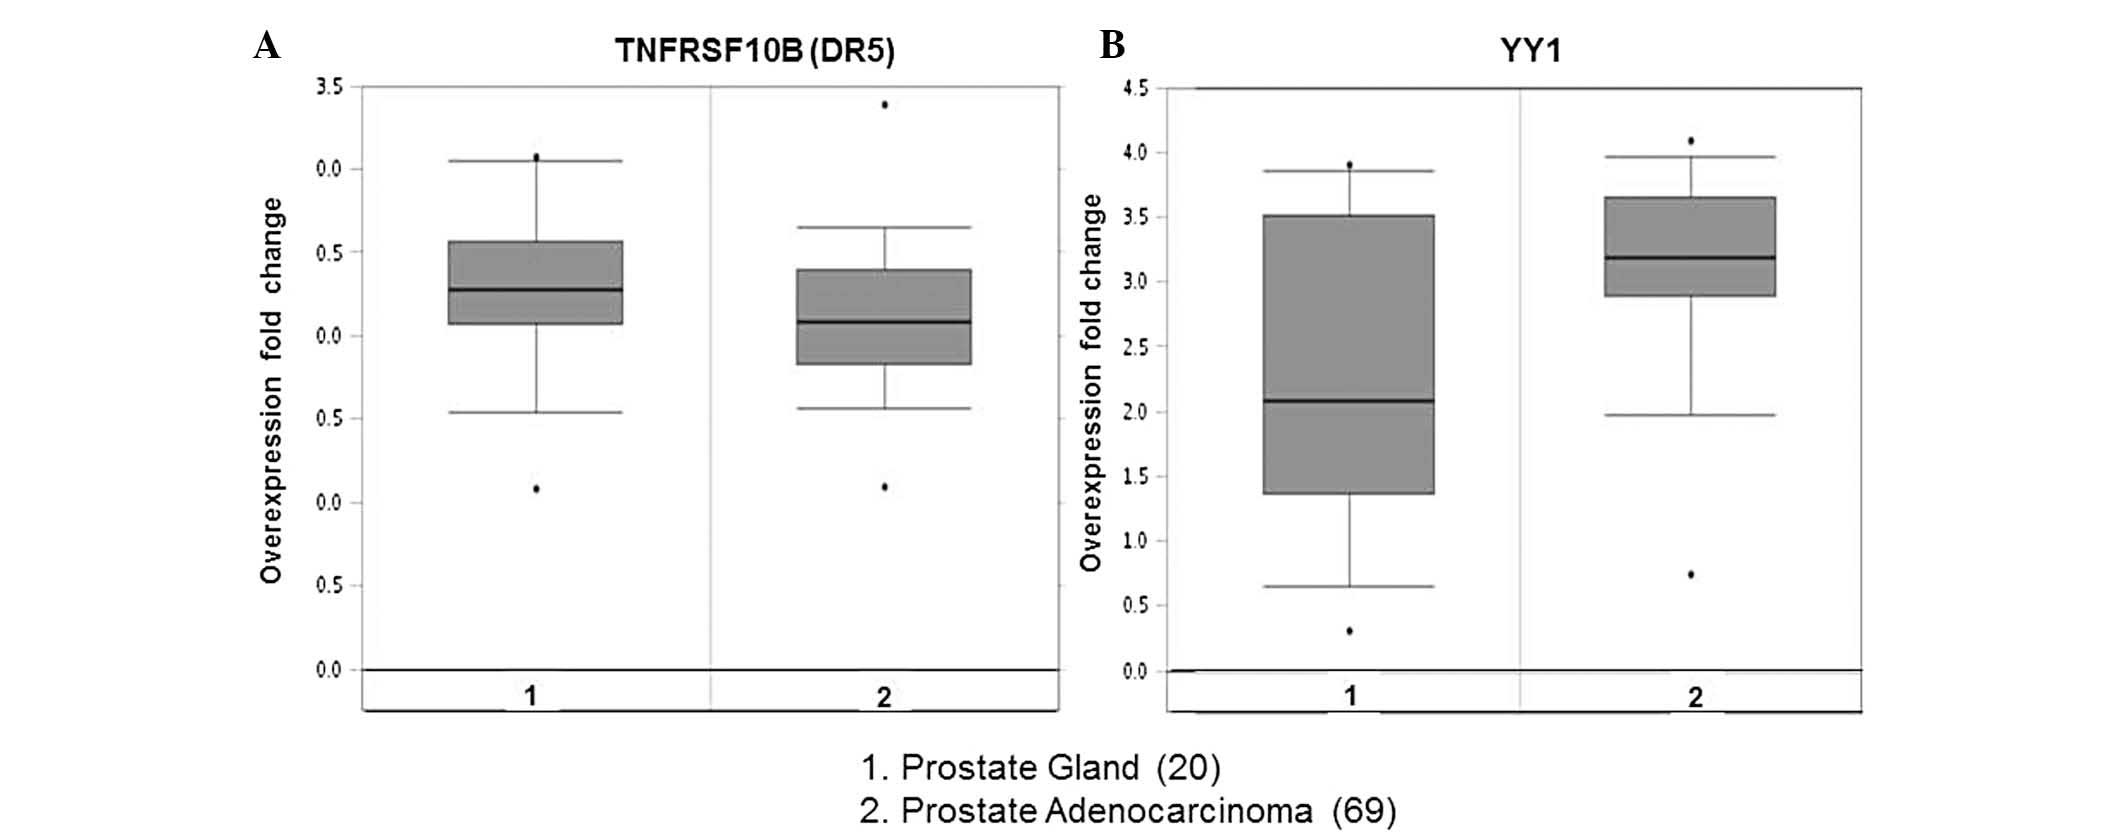
Analysis of the TNFRSF10B (DR5) expression levels in
different prostate tumors was performed using a public data set of
microarrays retrieved from the Oncomine database and gene
expression Omnibus, derived from the published analysis reported by
Vanaja et al (28) and
Wallace et al (29). The
microarray data included 69 prostate adenocarcinomas and were
compared with 20 samples from the prostate gland. In addition, YY1
and DR5 gene expression from the prostate adenocarcinoma samples
were analyzed in the same data sets and compared with the prostate
gland. The tumors showed low expression of DR5 as compared with the
normal tissues (P=0.05 or 0.02, respectively). A higher expression
of YY1 was observed in the same data sets as compared with the
normal tissues (P<0.05) (Fig.
3). An inverse correlation of expression was observed between
DR5 and YY1 in PCa. These findings were concordant with other
database and gene expression analyses (30–33).
Discussion
The present study has shown for the first time, to
the best of our knowledge, the underexpression of DR5 in prostate
cancer cell lines and patient-derived tumor tissues. The
transcriptional regulation of DR5 was previously reported to be, at
least in part, due to the repressor activity of YY1 (25). The present study therefore
hypothesized that the transcriptional regulation of DR5 in human
PCa would additionally be negatively regulated through the
overexpression of YY1. The data of the present study confirmed this
hypothesis and demonstrated an inverse correlation between the
expression of DR5 and YY1. The experimental findings were
corroborated by bioinformatic analyses. These data suggested that
the expression levels of DR5 and YY1 in PCa may be novel prognostic
factors in the progression of PCa.
The targeting of DR5 by TRAIL or anti-DR5 monoclonal
antibodies has been the focus of various clinical trials in
clinical cancers (34–36). The approach to inhibit the
repression of DR5 through targeting YY1 will result in the
upregulation of DR5 and its response to TRAIL-induced apoptosis. We
have previously demonstrated that the inhibition of YY1 by
YY1-specific siRNA in PCa cells resulted in sensitization of PCa
cells to TRAIL apoptosis (37). It
has been additionally shown that several anticancer agents overcome
resistance to Apo2L/TRAIL through the upregulation of DR5 in
malignant cells (25,38). In addition, the lower expression of
DR5 has been noted in various types of cancer, including breast
(39), lung (40), colorectal (41) and esophageal (42) cancers. Gene silencing of DR5 and
DR4 was shown to abolish TRAIL-induced apoptosis (43).
Of note, the expression levels of DR5 have been
described as a potentially useful prognostic marker in various
cancers, including melanoma, where the decrease in DR5 expression
was identified to be correlated with the progression as well as
metastasis of the disease (20).
Furthermore, DR5 expression was shown to be negatively correlated
with the overall survival of breast cancer patients (22). DR5, however, was not found to be a
significant prognostic marker in cervical or colon cancers
(22,23). These observations suggested that
the prognostic value of DR5 may be cancer type-specific. In PCa,
the significance of DR5 expression had not been previously explored
and the present findings suggested that it may be a significant
novel prognostic marker in the progression of PCa.
The transcription factor YY1 is expressed in normal
tissues and is upregulated in various types of cancer, including
PCa, with positive and negative regulatory effects on gene
expression. Elevated YY1 expression is correlated with the
development of PIN and advanced prostate cancer (44,45).
The results of the present study regarding the expression of YY1
and its correlation with the tumor grade are consistent with
previous findings, which have linked higher YY1 expression to
tumors, as compared with benign tissues.
In the present study, it was shown that YY1 was
overexpressed in tumor samples as compared with PIN. The
overexpression gradually increased with higher tumor grades
(Fig. 2A and B). By contrast, DR5
was considerably higher in PIN as compared to tumors. This
downregulation of DR5 in the tumors decreased further with
increasing tumor grade (Figs. 1
and 2). In addition, Pearson’s
analysis demonstrated an inverse correlation between the expression
of YY1 and DR5 in PCa tissues (Fig.
3). This finding is consistent with the hypothesis that YY1
negatively regulates DR5 and this inverse correlation in PCa
patient samples has an important implication in the development of
this disease.
High DR5 expression has been linked to
TRAIL-mediated apoptosis (15,25–27).
DR5 expression was shown to be low in the tumors as compared with
PIN, which suggested that the tumor cells may be resistant to
TRAIL-mediated apoptosis. This is relevant since the
TRAIL-DR5-mediated apoptotic pathway is involved in the
immune-mediated apoptosis signaling response by cytotoxic T
lymphocytes and natural killer cells (46). These results additionally suggested
a mechanism whereby patient tumors with high YY1 expression and,
therefore, low DR5 expression (repressed by YY1), would experience
higher apoptosis resistance to both immune and chemotherapeutic
drugs and, consequently, develop tumors of higher grades as a
consequence of tumor unresponsiveness to therapy.
The present findings have only examined the
expression of DR5 in PCa and several reports have demonstrated that
DR5 is the preferential receptor-inducing signal for TRAIL
apoptosis (25,27,39).
The expression of DR4 and its role in TRAIL-induced apoptosis,
however, cannot be ruled out. The expression of DR5 and DR4 is
reduced in prostate tumors in comparison with that in benign
tissues. Low expression of death receptors suggests resistance to
apoptosis and, thus, increased tumorigenesis. However, YY1 has not
been shown to regulate DR4 thus far to the best of our knowledge
(47). Additional studies are
therefore required to determine the role of DR4 in PCa and its
clinical significance.
In conclusion, the present study demonstrated the
clinical significance of DR5 downregulation in PCa and its inverse
correlation with the expression of YY1. In addition, these data
suggest a potential prognostic significance of both DR5 and YY1 in
the progression of PCa.
Acknowledgements
The present study was supported by Mexico Federal
Funds Grant HIM/2009/008 (S.H.-Y.), Doctoral scholarship degree
grant (A. H-C) CONACyT- Becaria no. 90848966 and Miembros del
Patronato del HIM (S.H.-Y). The authors would like to acknowledge
the assistance of the UCLA Jonsson Comprehensive Cancer Center and
the assistance of Miss. Kathy Nguyen, Miss. Melissa Cao and Miss.
Daphne Liang in the preparation of the manuscript.
References
|
1
|
Liang Y, Ketchum NS, Louden C, et al: The
use of the finasteride-adjusted Prostate Cancer Prevention Trial
Prostate Cancer Risk Calculator in a Mexican referral population: a
validation study. Urol Int. 89:9–16. 2012. View Article : Google Scholar
|
|
2
|
Siegel R, Naishadham D and Jemal A: Cancer
statistics, 2012. CA Cancer J Clin. 62:10–29. 2012. View Article : Google Scholar
|
|
3
|
Cooperberg MR, Broering JM and Carroll PR:
Risk assessment for prostate cancer metastasis and mortality at the
time of diagnosis. J Natl Cancer Inst. 16:878–887. 2009. View Article : Google Scholar : PubMed/NCBI
|
|
4
|
Major JM, Norman Oliver M, Doubeni CA, et
al: Socioeconomic status, healthcare density, and risk of prostate
cancer among African American and Caucasian men in a large
prospective study. Cancer Causes Control. 23:1185–1191. 2012.
View Article : Google Scholar
|
|
5
|
Lee EW, Marien T, Laze J, Agalliu I and
Lepor H: Comparison of health-related quality-of-life outcomes for
African-American and Caucasian-American men after radical
prostatectomy. BJU Int. 110:1129–1133. 2012. View Article : Google Scholar : PubMed/NCBI
|
|
6
|
Parker PM, Rice KR, Sterbis JR, et al:
Prostate cancer in men less than the age of 50: a comparison of
race and outcomes. Urology. 78:110–115. 2011. View Article : Google Scholar : PubMed/NCBI
|
|
7
|
Seligson DB, Hongo F, Huerta-Yepez S, et
al: Expression of X-linked inhibitor of apoptosis protein is a
strong predictor of human prostate cancer recurrence. Clin Cancer
Res. 15:6056–6063. 2007. View Article : Google Scholar
|
|
8
|
Chen C, Chen J and Zhao KN: Editorial:
Signalling pathways in anti-cancer drug resistance. Curr Med Chem.
21:3007–3008. 2014. View Article : Google Scholar : PubMed/NCBI
|
|
9
|
Gomella LG: Addressing the needs of the
high-risk prostate cancer patient. Rev Urol. 7:S18–S28.
2005.PubMed/NCBI
|
|
10
|
Chodak G: Prostate cancer: epidemiology,
screening, and biomarkers. Rev Urol. 8 Suppl:S3–S8. 2006.PubMed/NCBI
|
|
11
|
Shariat SF, Semjonow A, Lilja H, et al:
Tumor markers in prostate cancer I: blood-based markers. Acta
Oncol. 50 Suppl:61–75. 2011. View Article : Google Scholar : PubMed/NCBI
|
|
12
|
McGuire SE, Lee AK, Cerne JZ, et al: PSA
response to neoadjuvant androgen deprivation therapy is a strong
independent predictor of survival in high-risk prostate cancer in
the dose-escalated radiation therapy era. Int J Radiat Oncol Biol
Phys. 85:e39–e46. 2013. View Article : Google Scholar
|
|
13
|
Masieri L, Minervini A, Vittori G, et al:
The role of free to total PSA ratio in prediction of extracapsular
tumor extension and biochemical recurrence after radical
prostatectomy in patients with PSA between 4 and 10 ng/ml. Int Urol
Nephrol. 44:1031–1038. 2012. View Article : Google Scholar
|
|
14
|
Elmore S: Apoptosis: a review of
programmed cell death. Toxicol Pathol. 35:495–516. 2007. View Article : Google Scholar : PubMed/NCBI
|
|
15
|
Horak P, Pils D, Haller G, et al:
Contribution of epigenetic silencing of tumor necrosis
factor-related apoptosis inducing ligand receptor 1 (DR4) to TRAIL
resistance and ovarian cancer. Mol Cancer Res. 3:335–343. 2005.
View Article : Google Scholar : PubMed/NCBI
|
|
16
|
Thomas LR, Bender LM, Morgan MJ and
Thorburn A: Extensive regions of the FADD death domain are required
for binding to the TRAIL receptor DR5. Cell Death Differ.
13:160–162. 2006. View Article : Google Scholar : PubMed/NCBI
|
|
17
|
Ramaswamy M, Efimova EV, Martinez O, et
al: IG20 (MADD splice variant-5), a proapoptotic protein, interacts
with DR4/DR5 and enhances TRAIL-induced apoptosis by increasing
recruitment of FADD and caspase-8 to the DISC. Oncogene.
23:6083–6094. 2004. View Article : Google Scholar
|
|
18
|
Thomas LR, Henson A, Reed JC, Salsbury FR
and Thorburn A: Direct binding of Fas-associated death domain
(FADD) to the tumor necrosis factor-related apoptosis-inducing
ligand receptor DR5 is regulated by the death effector domain of
FADD. J Biol Chem. 279:32780–32785. 2004. View Article : Google Scholar
|
|
19
|
Cooper WA, Kohonen-Corish MR, Zhuang L, et
al: Role and prognostic significance of tumor necrosis
factor-related apoptosis-inducing ligand death receptor DR5 in
nonsmall-cell lung cancer and precursor lesions. Cancer.
113:135–142. 2008. View Article : Google Scholar : PubMed/NCBI
|
|
20
|
Zhuang L, Lee CS, Scolyer RA, et al:
Progression in melanoma is associated with decreased expression of
death receptors for tumor necrosis factor-related
apoptosis-inducing ligand. Hum Pathol. 37:1286–1294. 2006.
View Article : Google Scholar
|
|
21
|
Ganten TM, Sykora J, Koschny R, et al:
Prognostic significance of tumour necrosis factor-related
apoptosis-inducing ligand (TRAIL) receptor expression in patients
with breast cancer. J Mol Med (Berl). 87:995–1007. 2009. View Article : Google Scholar
|
|
22
|
Maduro JH, Noordhuis MG, ten Hoor KA, et
al: The prognostic value of TRAIL and its death receptors in
cervical cancer. Int J Radiat Oncol Biol Phys. 75:203–211. 2009.
View Article : Google Scholar : PubMed/NCBI
|
|
23
|
van Geelen CM, Westra JL, de Vries EG, et
al: Prognostic significance of tumor necrosis factor-related
apoptosis-inducing ligand and its receptors in adjuvantly treated
stage III colon cancer patients. J Clin Oncol. 24:4998–5004.
2006.
|
|
24
|
Seligson D, Horvath S, Huerta-Yepez S, et
al: Expression of transcription factor Yin Yang 1 in prostate
cancer. Int J Oncol. 27:131–141. 2005.PubMed/NCBI
|
|
25
|
Baritaki S, Huerta-Yepez S, Sakai T,
Spandidos DA and Bonavida B: Chemotherapeutic drugs sensitize
cancer cells to TRAIL-mediated apoptosis: up-regulation of DR5 and
inhibition of Yin Yang 1. Mol Cancer Ther. 6:1387–1399. 2007.
View Article : Google Scholar : PubMed/NCBI
|
|
26
|
Baritaki S, Suzuki E, Umezawa K, et al:
Inhibition of Yin Yang 1-dependent repressor activity of DR5
transcription and expression by the novel proteasome inhibitor
NPI-0052 contributes to its TRAIL-enhanced apoptosis in cancer
cells. J Immunol. 180:6199–6210. 2008. View Article : Google Scholar
|
|
27
|
Huerta-Yepez S, Vega M, Escoto-Chavez SE,
et al: Nitric oxide sensitizes tumor cells to TRAIL-induced
apoptosis via inhibition of the DR5 transcription repressor Yin
Yang 1. Nitric Oxide. 20:39–52. 2009. View Article : Google Scholar : PubMed/NCBI
|
|
28
|
Vanaja DK, Cheville JC, Iturria SJ and
Young CY: Transcriptional silencing of zinc finger protein 185
identified by expression profiling is associated with prostate
cancer progression. Cancer Res. 63:3877–3882. 2003.PubMed/NCBI
|
|
29
|
Wallace TA, Prueitt RL, Yi M, et al: Tumor
immunobiological differences in prostate cancer between
African-American and European-American men. Cancer Res. 68:927–936.
2008. View Article : Google Scholar : PubMed/NCBI
|
|
30
|
Liu P, Ramachandran S, Ali Seyed SM, et
al: Sex-determining region Y box 4 is a transforming oncogene in
human prostate cancer cells. Cancer Res. 66:4011–4019. 2006.
View Article : Google Scholar : PubMed/NCBI
|
|
31
|
Luo J, Duggan DJ, Chen Y, et al: Human
prostate cancer and benign prostatic hyperplasia: molecular
dissection by gene expression profiling. Cancer Res. 61:4683–4688.
2001.PubMed/NCBI
|
|
32
|
Han M, Snow PB, Epstein JI, Chan TY, Jones
KA, Walsh PC and Partin AW: A neural network predicts progression
for men with gleason score 3+4 versus 4+3 tumors after radical
prostatectomy. Urology. 56:994–999. 2000. View Article : Google Scholar
|
|
33
|
Yu YP, Landsittel D, Jing L, et al: Gene
expression alterations in prostate cancer predicting tumor
aggression and preceding development of malignancy. J Clin Oncol.
22:2790–2799. 2004. View Article : Google Scholar : PubMed/NCBI
|
|
34
|
Oliver PG, LoBuglio AF, Zhou T, et al:
Effect of anti-DR5 and chemotherapy on basal-like breast cancer.
Breast Cancer Res Treat. 133:417–426. 2012. View Article : Google Scholar : PubMed/NCBI
|
|
35
|
Sharma S, de Vries EG, Infante JR, et al:
Safety, pharmacokinetics, and pharmacodynamics of the DR5 antibody
LBY135 alone and in combination with capecitabine in patients with
advanced solid tumors. Invest New Drugs. 32:135–144. 2014.
View Article : Google Scholar : PubMed/NCBI
|
|
36
|
Zinonos I, Labrinidis A, Lee M, et al:
Apomab, a fully human agonistic antibody to DR5, exhibits potent
antitumor activity against primary and metastatic breast cancer.
Mol Cancer Ther. 8:2969–2980. 2009. View Article : Google Scholar : PubMed/NCBI
|
|
37
|
Baritaki S, Katsman A, Chatterjee D, et
al: Regulation of tumor cell sensitivity to TRAIL-induced apoptosis
by the metastatic suppressor Raf kinase inhibitor protein via Yin
Yang 1 inhibition and death receptor 5 up-regulation. J Immunol.
179:5441–5453. 2007. View Article : Google Scholar
|
|
38
|
Miyata Y, Watanabe S, Sagara Y, et al:
High expression of HuR in cytoplasm, but not nuclei, is associated
with malignant aggressiveness and prognosis in bladder cancer. PLoS
One. 8:e590952013. View Article : Google Scholar
|
|
39
|
Keane MM, Ettenberg SA, Nau MM, Russell EK
and Lipkowitz S: Chemotherapy augments TRAIL-induced apoptosis in
breast cell lines. Cancer Res. 59:734–741. 1999.PubMed/NCBI
|
|
40
|
Elrod HA, Fan S, Muller S, et al: Analysis
of death receptor 5 and caspase-8 expression in primary and
metastatic head and neck squamous cell carcinoma and their
prognostic impact. PLoS One. 5:e121782010. View Article : Google Scholar : PubMed/NCBI
|
|
41
|
Sung B, Ravindran J, Prasad S, Pandey MK
and Aggarwal BB: Gossypol induces death receptor-5 through
activation of the ROS-ERK-CHOP pathway and sensitizes colon cancer
cells to TRAIL. J Biol Chem. 12:35418–35427. 2010. View Article : Google Scholar : PubMed/NCBI
|
|
42
|
Chang MS, Lee HS, Lee BL, et al:
Differential protein expression between esophageal squamous cell
carcinoma and dysplasia, and prognostic significance of protein
markers. Pathol Res Pract. 201:417–425. 2005. View Article : Google Scholar
|
|
43
|
Oikonomou E and Pintzas A: The TRAIL of
oncogenes to apoptosis. Biofactors. 39:343–354. 2013. View Article : Google Scholar : PubMed/NCBI
|
|
44
|
Deng Z, Cao P, Wan MM and Sui G: Yin Yang
1: a multifaceted protein beyond a transcription factor.
Transcription. 1:81–84. 2010. View Article : Google Scholar : PubMed/NCBI
|
|
45
|
Pilarsky C, Wenzig M, Specht T, Saeger HD
and Grützmann R: Identification and validation of commonly
overexpressed genes in solid tumors by comparison of microarray
data. Neoplasia. 6:744–750. 2004. View Article : Google Scholar
|
|
46
|
Zamai L, Ahmad M, Bennett IM, et al:
Natural killer (NK) cell-mediated cytotoxicity: differential use of
TRAIL and Fas ligand by immature and mature primary human NK cells.
J Exp Med. 188:2375–2380. 1998. View Article : Google Scholar : PubMed/NCBI
|
|
47
|
Anees M, Horak P, El-Gazzar A, Susani M,
Heinze G, Perco P, Loda M, Lis R, Krainer M and Oh WK:
Recurrence-free survival in prostate cancer is related to increased
stromal TRAIL expression. Cancer. 117:1172–1182. 2011. View Article : Google Scholar : PubMed/NCBI
|