Introduction
Down syndrome (DS) is one of the principal causes of
mental retardation and congenital heart malformations, and is a
complex disorder with genetic and metabolic components. It is
attributed to the presence of three copies of chromosome 21
(1), and presents various common
clinical features. These include gastrointestinal disruptions,
immune system defects and Alzheimer’s disease-associated
pathological and neurochemical alterations (2). Bittles et al (3) established that DS affects 1/650-1,000
live births and is the most common genetic cause of intellectual
disability, cognitive impairment and congenital heart defect in the
human population (3). Previously,
DS was identified to be associated with an increased frequency of
infections, hematological malignancies and autoimmune problems, in
addition to being the leading cause of a variety of birth defects
and medical conditions (4). For
these reasons, there is a requirement for identification of novel
targets for this disease and investigation of the potential
mechanism underlying DS.
Human chromosome 21 (HC21) is the smallest human
autosome and an extra copy of it can lead to DS (5). Thus far, a number of studies have
identified an association between HC21 and DS. The presence of
three copies of HC21 has been demonstrated to induce the
overexpression of its resident genes, which may be the pathogenesis
underlying the abnormalities occurring in DS (2). Furthermore, several genes in HC21
have been detected to be associated with DS. For instance, as the
product of an HC21 gene highly expressed in brain, heart and
skeletal muscle, DSCR1 is overexpressed in fetal brains of
individuals with DS (2). In
addition, the contribution of microRNAs (miRNAs) to DS has been
investigated, and studies indicate that HC21-derived miRNAs are
overexpressed in the brains and hearts of patients with DS
(6). Although several
HC21-associated genes have been identified to be involved in the
development of DS, the whole genome has not been studied.
In the current study, the HC21 genes associated with
DS were screened based on the whole genome expression. The
differentially expressed genes (DEGs) between DS and normal
specimens were identified, and then their functions were analyzed
by gene ontology (GO). The locations of these DEGs were identified
and the HC21-associated genes that may be involved in the
development of DS were screened.
Materials and methods
Affymetrix data
The Gene Expression Omnibus (GEO) database of the
National Center for Biotechnology Information is the largest
entirely public gene expression resource, and includes 214,268
samples and 4,500 platforms (7).
The chip data GSE5390 (8) were
downloaded from the GEO database, and included 7 DS and 8 normal
samples. The platform was GPL96 [HG-U133A] Affymetrix Human Genome
U133A Array (http://www.ncbi.nlm.nih.gov/geo/query/acc.cgi?acc=GPL96).
Data preprocessing and identification of
DEGs
The original microarray data were normalized using
the mean method, which aimed to adjust the data for effects that
were due to variation in the technology, rather than biological
differences (9). Subsequently, the
LIMMA package (http://www.bioconductor.org/packages/release/bioc/html/limma)
in R language (10) was utilized
to identify DEGs and the Bonferroni correction in multtest package
(http://www.bioconductor.org/packages/release/bioc/html/multtest.html)
(11) was applied, resulting in
adjusted P-values, and identification of the false discovery rate
(FDR) (12). FDR<0.05 and
|logFC|>1 were selected as the thresholds.
Clustering analysis
Clustering algorithms are used for the task of class
identification in spatial databases. Previously, a study identified
that the same tissue can exhibit significantly different expression
levels under varied conditions (13). Therefore, clustering analysis was
conducted for the DEGs between DS and healthy normal samples
(14). The results were then
visualized using Treeview (http://www.jam-software.com/virtual-treeview/)
(15).
DEGs between the two groups
Based on the above processes, the up- and
downregulated genes between DS and normal samples were screened.
The t-test (16) was used to
detect significant differences between groups.
Functional analysis
The Database for Annotation, Visualization, and
Integrated Discovery (DAVID; http://david.abcc.ncifcrf.gov) bioinformatics resource
consists of an integrated biological knowledge base and analytic
tools. These are aimed at systematically extracting biological
meaning from large lists of genes or proteins (17). GO terms are significantly
overrepresented in a set of genes from three aspects, including the
cellular component, molecular function and biological process
(18). In the present study, GO
analysis was performed on the up- and downregulated genes based on
a hypergeometric distribution algorithm. GO terms with P<0.05
were screened for further analysis.
Location of DEGs on chromosomes
The University of California, Santa Cruz Interaction
Browser (UCSCIB) (http://sysbio.soe.ucsc.edu/nets) is an online tool for
biologists to simultaneously view high-throughput data sets in
order to analyze functional relationships between biological
entities (19). In the current
study, the locations of DEGs on chromosomes were detected based on
human genome 19 in the UCSCIB, and all DEGs on HC21 were selected
for further analysis.
Results
DEGs
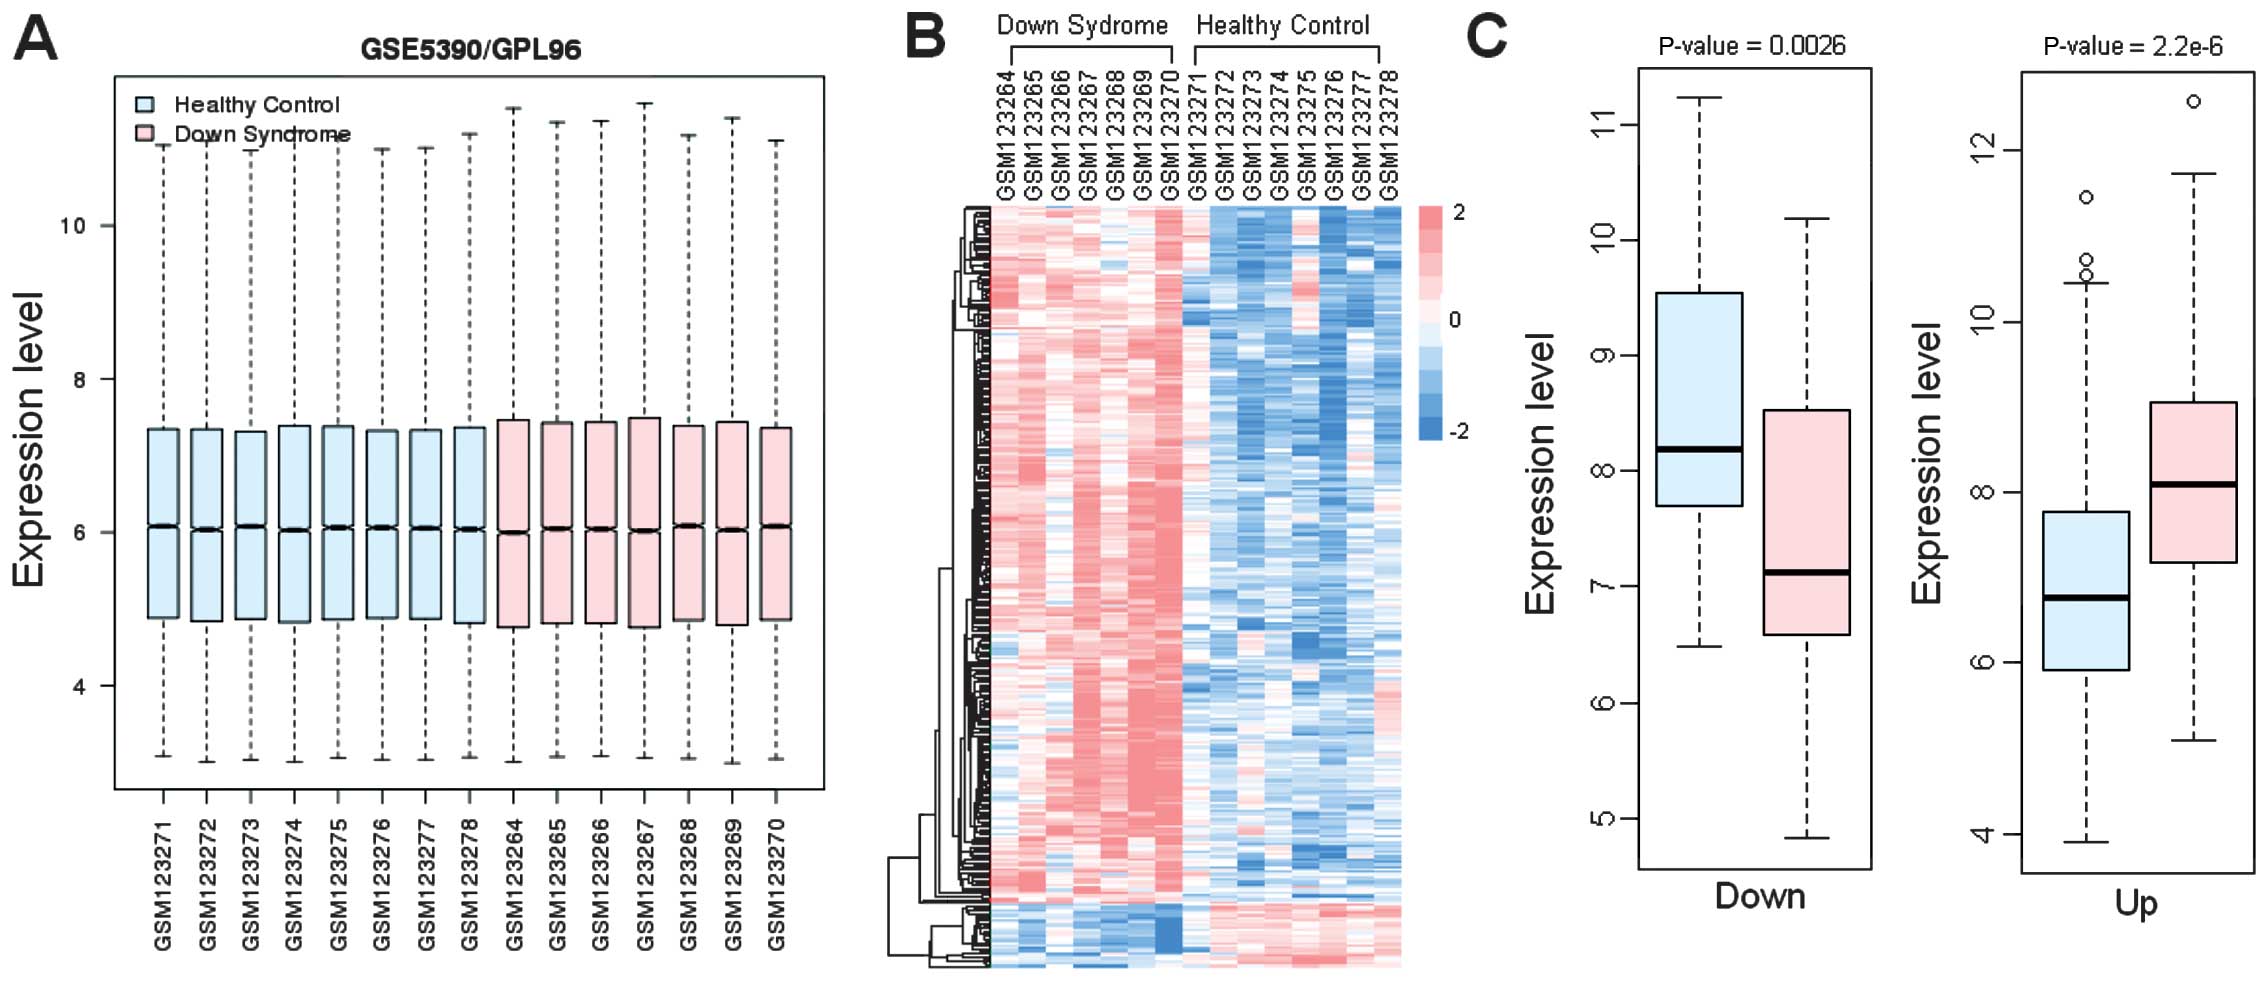
Subsequent to preprocessing of the microarray data,
the normalized data were presented as in Fig. 1A. Based on the LIMMA package, a
total of 300 DEGs were identified with an FDR<0.05 and
|logFC|>1, including 25 upregulated and 275 downregulated
genes.
Clustering analysis
The expression data were extracted and underwent
clustering analysis, the result of which is displayed in Fig. 1B. The expression of DEGs was
significantly different between DS and normal samples
(FDR<0.05). A clear difference between the colors in the two
groups can be observed.
Analysis of the DEGs
The t-test was used to compare the gene expression
in the DS and healthy groups (Fig.
1C). The results demonstrated that the differences between the
control and DS groups were significant, with the smallest P-value
in the upregulated genes (P=2.2×10⁻⁶).
GO analysis
In the present study, DAVID was used to conduct GO
enrichment analysis of up- and downregulated genes. Up- and
downregulated genes were observed to be significantly enriched in
17 and 11 biological processes, respectively (P<0.05; Table I). The downregulated genes,
including PCSK1, FGF9, NPTX2, CRH, TAC1, HOMER1 and SST were
significantly enriched in the cell-cell signaling term
(P=0.000227). By contrast, upregulated genes, including ATP6V0E1,
tetratricopeptide repeat domain 3 (TTC3), collagen type VI α2
(COL6A2) and ATP binding cassette transporter G1 (ABCG1) were
significantly associated with organic substance biological
processes (P=4.48×10⁻¹⁰).
 | Table ISignificant GO biological processes
(P<0.05). |
Table I
Significant GO biological processes
(P<0.05).
| A, Downregulated |
|---|
|
|---|
| Term | Count | P-value |
|---|
| GO:0007267~cell-cell
signaling | 7 | 0.000227495 |
| GO:0007268~synaptic
transmission | 5 | 0.001027074 |
| GO:0044057~regulation
of system process | 5 | 0.00117504 |
| GO:0031644~regulation
of neurological system process | 4 | 0.001624597 |
|
GO:0019226~transmission of nerve
impulse | 5 | 0.00185982 |
| GO:0051050~positive
regulation of transport | 4 | 0.004720422 |
|
GO:0007610~behavior | 5 | 0.005338828 |
|
GO:0050877~neurological system
process | 7 | 0.008480586 |
| GO:0008284~positive
regulation of cell proliferation | 4 | 0.025133658 |
| GO:0007186~G-protein
coupled receptor protein signaling pathway | 6 | 0.02589348 |
| GO:0042127~regulation
of cell proliferation | 5 | 0.030811136 |
|
| B, Upregulated | | |
|
| Term | Count | P-value |
|
| GO:0010033~response
to organic substance | 39 |
4.48718×10⁻¹⁰ |
| GO:0009719~response
to endogenous stimulus | 21 |
2.09852×10−05 |
| GO:0042127~regulation
of cell proliferation | 31 |
2.98752×10−05 |
| GO:0009611~response
to wounding | 23 | 0.000109109 |
| GO:0006928~cell
motion | 21 | 0.000188759 |
| GO:0007155~cell
adhesion | 25 | 0.000902959 |
| GO:0022610~biological
adhesion | 25 | 0.000920914 |
|
GO:0042592~homeostatic process | 25 | 0.002317543 |
| GO:0006468~protein
amino acid phosphorylation | 23 | 0.002397602 |
|
GO:0007242~intracellular signaling
cascade | 36 | 0.002572349 |
| GO:0042981~regulation
of apoptosis | 26 | 0.002712476 |
| GO:0043067~regulation
of programmed cell death | 26 | 0.003089182 |
| GO:0010941~regulation
of cell death | 26 | 0.003241465 |
| GO:0006955~immune
response | 23 | 0.003609231 |
|
GO:0016310~phosphorylation | 24 | 0.009991518 |
| GO:0006793~phosphorus
metabolic process | 26 | 0.026406215 |
| GO:0006796~phosphate
metabolic process | 26 | 0.026406215 |
Gene location and analysis
The chromosome locations of all DEGs were detected,
and DEGs on HC21 were collected. It was observed that all the DEGs
located on HC21 were upregulated genes in the 21q21–22 area. A
total of 17 DEGs were located on HC21, including COL6A2, DSCAM,
TTC3, ABCG1, SON, SLC5A3, ITSN1, PIGP and CSTB (Table II).
| Table IIThe differentially expressed genes on
human chromosome 21. |
Table II
The differentially expressed genes on
human chromosome 21.
| Gene symbol | logFC | Chromosome
location | Chromosome
annotation |
|---|
| BTG3 | 1.323852 | 21q21.1 | Chromosome 21,
NC_000021.8 (18965968..18985268, complement) |
| ADAMTS1 | 1.913769 | 21q21.2 | Chromosome 21,
NC_000021.8 (28208606..28217728, complement) |
| SON | 1.037352 | 21q22.11 | Chromosome 21,
NC_000021.8 (34915350..34949812) |
| OLIG2 | 1.07927 | 21q22.11 | Chromosome 21,
NC_000021.8 (34398216..34401504) |
| USP16 | 1.100422 | 21q22.11 | Chromosome 21,
NC_000021.8 (30396938..30426809) |
| TMEM50B | 1.327947 | 21q22.11 | Chromosome 21,
NC_000021.8 (34804793..34852316, complement) |
| SLC5A3 | 1.033553 | 21q22.12 | Chromosome 21,
NC_000021.8 (35445870..35478561) |
| ITSN1 | 1.067094 | 21q22.1–q22.2 | Chromosome 21,
NC_000021.8 (35014784..35261609) |
| PIGP | 1.097945 | 21q22.2 | Chromosome 21,
NC_000021.8 (38437664..38445458, complement) |
| TTC3 | 1.264465 | 21q22.2 | Chromosome 21,
NC_000021.8 (38445571..38575408) |
| CSTB | 1.118598 | 21q22.3 | Chromosome 21,
NC_000021.8 (45193546..45196256, complement) |
| S100B | 1.138102 | 21q22.3 | Chromosome 21,
NC_000021.8 (48018531..48025035, complement) |
| COL6A2 | 1.216409 | 21q22.3 | Chromosome 21,
NC_000021.8 (47518033..47552763) |
| SIK1 | 1.259082 | 21q22.3 | Chromosome 21,
NC_000021.8 (44834395..44847002, complement) |
| ABCG1 | 1.327896 | 21q22.3 | Chromosome 21,
NC_000021.8 (43619799..43717354) |
| PTTG1IP | 1.465675 | 21q22.3 | Chromosome 21,
NC_000021.8 (46269500..46293818, complement) |
| ITGB2 | 1.592721 | 21q22.3 | Chromosome 21,
NC_000021.8 (46305868..46348753, complement) |
Discussion
As the principal genetic cause of mental
retardation, DS is a genetic disorder resulting from full or
partial trisomy of HC21 (20). In
the current study, the genes on HC21 that were associated with DS
were identified. Microarray data that included DS and healthy
normal samples were collected and DEGs between these two groups
were identified. The expression levels of these genes in the two
samples were significantly different, particularly the
overexpressed genes. The functions of these genes were analyzed
using GO and the results suggested that there was a clear
enrichment of DEGs in organic substance biological processes and
cell-cell signaling. Furthermore, based on UCSCIB, 17 upregulated
genes were identified in the 21q21–22 area, which may be involved
in the development of DS.
Based on original data GSE5390, a total of 300 DEGs,
including 25 up- and 275 downregulated genes, were identified
between DS and normal samples. In addition, using clustering
analysis and comparison of the expression data between the groups,
it was observed that the expression of these DEGs was significantly
different between the DS and normal samples, with a greater
difference in upregulated genes. These results indicate that
genetic variation may induce DS and that the overexpressed genes
may be key in this process. Thus, further attention is required for
upregulated genes in the pathogenesis of DS.
The function of these DEGs was analyzed by GO. Once
the DEGs between DS and normal samples had been identified, the
function of these genes in the development of DS were predicted.
The results demonstrated that the upregulated genes were enriched
in 17 biological processes, and the most significant was in
response to organic substance biological processes
(P=4.48×10⁻¹⁰). This term represents any process that
results in a change in the state or activity of a cell or an
organism (including movement, secretion, enzyme production and gene
expression) as a result of a stimulus from an organic substance. A
total of 39 upregulated genes, including ATP6V0E1, TTC3, COL6A2 and
ABCG1, were enriched in this biological process, suggesting that by
disturbing this term, the overexpressed genes may induce DS.
Additionally, the downregulated genes, including PCSK1, FGF9,
NPTX2, CRH, TAC1, HOMER1 and SST, were significantly enriched in
cell-cell signaling (P=0.000227). This term denotes any process
that mediates the transfer of information from one cell to another.
This observation indicates that the downregulated genes affect
signaling between cells, which may result in DS.
The locations of the identified DEGs were
investigated. In the current study, the aim was to identify genes
on HC21 that may induce DS, hence these were the genes that were
focused on. The results indicated that the DEGs on HC21 were all
upregulated and were mainly in the 21q21–22 area. In detail, 17
overexpressed genes were identified on HC21, including TTC3,
COL6A2, ABCG1, SIK1 and PIGP. Notably, the overexpressed genes
(TTC3, COL6A2 and ABCG1) were enriched in response to the organic
substance biological process. This observation suggests that these
genes on HC21 may induce DS by disturbing the response to the
organic substance-associated biological process. COL6A2, on the
21q22.3 has previously been detected in several medical conditions,
including Ullrich congenital muscular dystrophy (21), congenital heart defects (22) and progressive myoclonus epilepsy
syndrome (23). ABCG1, on the
21q22.3 mediates the transport of cholesterol from cells to high
density lipoprotein (24). In
addition, this substance serves a function in the immune response
and protects against oxidative stress-induced macrophage apoptosis
during efferocytosis (25–26). TTC3, on the 21q22.3, is one of the
supernumerary genes in the DS critical region (27), and is involved in neuronal cell
differentiation (28). These genes
are notable candidates for the learning disability and cerebral
cortex dysplasia observed in DS. Furthermore, the DEGs of the same
area, such as PIGP and SIK1, may also be involved in the
development and progression of DS.
In the present study, candidates for involvement in
the initiation and progression of DS were identified on HC21.
Notably, the DEGs on HC21 were all overexpressed genes and were
significantly enriched in response to organic substance biological
process. These observations indicate that the overexpression of
ABCG1, TTC3 and COL6A2, which are located on the 21q21–22 area, may
induce DS by disturbing several biological processes. The work of
the current study may provide therapeutic targets for DS and aid in
the elucidation of its pathogenesis.
References
|
1
|
Hobbs CA, Sherman SL, Yi P, et al:
Polymorphisms in genes involved in folate metabolism as maternal
risk factors for Down syndrome. Am J Hum Genet. 67:623–630. 2000.
View Article : Google Scholar : PubMed/NCBI
|
|
2
|
Fuentes JJ, Genescà L, Kingsbury TJ, et
al: DSCR1, overexpressed in Down syndrome, is an inhibitor of
calcineurin-mediated signaling pathways. Hum Mol Genet.
9:1681–1690. 2000. View Article : Google Scholar : PubMed/NCBI
|
|
3
|
Bittles AH, Bower C, Hussain R and Glasson
EJ: The four ages of Down syndrome. Eur J Public Health.
17:221–225. 2007. View Article : Google Scholar
|
|
4
|
de Hingh YC, van der Vossen PW, Gemen EF,
et al: Intrinsic abnormalities of lymphocyte counts in children
with down syndrome. J Pediatr. 147:744–747. 2005. View Article : Google Scholar : PubMed/NCBI
|
|
5
|
Hattori M, Fujiyama A, Taylor TD, et al:
Chromosome 21 mapping and sequency consortium: The DNA sequence of
human chromosome 21. Nature. 405:311–319. 2000. View Article : Google Scholar : PubMed/NCBI
|
|
6
|
Kuhn DE, Nuovo GJ, Terry AV Jr, Martin MM,
et al: Human chromosome 21-derived miRNAs are overexpressed in down
syndrome brains and hearts. Biochem Biophys Res Commun.
370:473–477. 2008. View Article : Google Scholar : PubMed/NCBI
|
|
7
|
Barrett T, Troup DB, Wilhite SE, et al:
NCBI GEO: mining tens of millions of expression profiles - database
and tools update. Nucleic Acids Res. 35:D760–D765. 2007. View Article : Google Scholar
|
|
8
|
Lockstone HE, Harris LW, Swatton JE,
Wayland MT, Holland AJ and Bahn S: Gene expression profiling in the
adult Down syndrome brain. Genomics. 90:647–660. 2007. View Article : Google Scholar : PubMed/NCBI
|
|
9
|
Smyth GK and Speed T: Normalization of
cDNA microarray data. Methods. 31:265–273. 2003. View Article : Google Scholar : PubMed/NCBI
|
|
10
|
Smyth GK: Limma: linear models for
microarray data. Bioinformatics and Computational Biology Solutions
Using R and Bioconductor. Gentleman R, Carey V, Huber W, Irizarry R
and Dudoit S: Springer; New York: pp. 397–420. 2005, View Article : Google Scholar
|
|
11
|
Benjamini Y and Hochberg Y: Controlling
the false discovery rate: a practical and powerful approach to
multiple testing. J Roy Stat Soc B Met. 57:289–300. 1995.
|
|
12
|
Benjamini Y: Discovering the false
discovery rate. J Roy Stat Soc B. 72:405–416. 2010. View Article : Google Scholar
|
|
13
|
Ester M, Kriegel HP, Sander J and Xu X: A
density-based algorithm for discovering clusters in large spatial
databases with noise. In: Proceedings of the Second International
conference on Knowledge Discovery and Data Mining (KDD-96);
Association for the Advancement of Artificial Intelligence; Palo
Alto, CA: pp. 226–231. 1996
|
|
14
|
Eisen MB, Spellman PT, Brown PO and
Botstein D: Cluster analysis and display of genome-wide expression
patterns. Proc Natl Acad Sci USA. 95:14863–14868. 1998. View Article : Google Scholar : PubMed/NCBI
|
|
15
|
Saldanha AJ: Java Treeview - extensible
visualization of microarray data. Bioinformatics. 20:3246–3248.
2004. View Article : Google Scholar : PubMed/NCBI
|
|
16
|
Ruxton GD: The unequal variance t-test is
an underused alternative to Student’s t-test and the Mann-Whitney U
test. Behav Ecol. 17:688–690. 2006. View Article : Google Scholar
|
|
17
|
Huang da W, Sherman BT and Lempicki RA:
Systematic and integrative analysis of large gene lists using DAVID
bioinformatics resources. Nat Protoc. 4:44–57. 2009. View Article : Google Scholar : PubMed/NCBI
|
|
18
|
Ashburner M, Ball CA, Blake JA, et al:
Gene ontology: tool for the unification of biology. The Gene
Ontology Consortium. Nat Genet. 25:25–29. 2000. View Article : Google Scholar : PubMed/NCBI
|
|
19
|
Wong CK, Vaske CJ, Ng S, Sanborn JZ, Benz
SC, Haussler D and Stuart JM: The UCSC Interaction Browser:
multidimensional data views in pathway context. Nucleic Acids Res.
41:W218–W224. 2013. View Article : Google Scholar : PubMed/NCBI
|
|
20
|
Reynolds LE, Watson AR, Baker M, et al:
Tumour angiogenesis is reduced in the Tc1 mouse model of Down’s
syndrome. Nature. 465:813–817. 2010. View Article : Google Scholar : PubMed/NCBI
|
|
21
|
Zhang RZ, Sabatelli P, Pan TC, et al:
Effects on collagen VI mRNA stability and microfibrillar assembly
of three COL6A2 mutations in two families with Ullrich congenital
muscular dystrophy. J Biol Chem. 277:43557–43564. 2002. View Article : Google Scholar : PubMed/NCBI
|
|
22
|
Grossman TR, Gamliel A, Wessells RJ, et
al: Over-expression of DSCAM and COL6A2 cooperatively generates
congenital heart defects. PLoS Genet. 7:e10023442011. View Article : Google Scholar : PubMed/NCBI
|
|
23
|
Karkheiran S, Krebs CE, Makarov V, et al:
Identification of COL6A2 mutations in progressive myoclonus
epilepsy syndrome. Hum Genet. 132:275–283. 2013. View Article : Google Scholar
|
|
24
|
Vaughan AM and Oram JF: ABCG1
redistributes cell cholesterol to domains removable by high density
lipoprotein but not by lipid-depleted apolipoproteins. J Biol Chem.
280:30150–30157. 2005. View Article : Google Scholar : PubMed/NCBI
|
|
25
|
Yvan-Charvet L, Pagler TA, Seimon TA, et
al: ABCA1 and ABCG1 protect against oxidative stress-induced
macrophage apoptosis during efferocytosis. Circ Res. 106:1861–1869.
2010. View Article : Google Scholar : PubMed/NCBI
|
|
26
|
Yvan-Charvet L, Wang N and Tall AR: Role
of HDL, ABCA1, and ABCG1 transporters in cholesterol efflux and
immune responses. Arterioscler Thromb Vasc Biol. 30:139–143. 2010.
View Article : Google Scholar :
|
|
27
|
Toker A: TTC3 ubiquitination terminates
Akt-ivation. Dev Cell. 17:752–754. 2009. View Article : Google Scholar
|
|
28
|
Oegema R, de Klein A, Verkerk AJ, et al:
Distinctive phenotypic abnormalities associated with submicroscopic
21q22 deletion including DYRK1A. Mol Syndromol. 1:113–120.
2010.PubMed/NCBI
|