Introduction
Breast cancer is a common type of tumor, which
develops in the breast tissue. The majority of breast cancer cases
occur in females, which may result from gender-associated
characteristics (1) and certain
hormones (2). Additional risk
factors contributing to breast cancer development include genetics
(3), obesity (4) and environmental pollution (5). Breast cancer is one of the leading
causes of cancer-associated death amongst females, accounting for
~23% of all cancer cases diagnosed in females (6). In 2008, 458,503 deaths resulted from
breast cancer worldwide (7).
Although the survival rate (~85%) for breast cancer is higher in
Western countries, it is significantly lower in developing
countries (6). Therefore, breast
cancer is a global health concern.
Significant progress has been achieved in the
elucidation of the pathological mechanisms underlying the
development of breast cancer (8,9).
Certain genes have been identified to be involved in the
progression of breast cancer. Breast cancer-specific gene 1
(BCSG1), also known as synuclein γ, was demonstrated to be
overexpressed in breast tumor tissues and stimulated the metastasis
of breast tumor cells (10). The
elevated expression levels of nuclear receptor coactivator 3
(ncoa3; AIB1) and human epidermal growth factor receptor 2
(HER2) in breast cancer cells were demonstrated to
contribute to tamoxifen resistance (11). Furthermore, certain significant
pathways have also been found to play a crucial role in breast
cancer. The HER2 tyrosine kinase pathway promoted
hormone-independent growth and enhanced endocrine resistance in
breast cancers (12). In addition,
the activity of the Hedgehog signaling pathway in breast cancer
cells was found to result in abnormal growth of the mammary duct
and may therefore represent a candidate target for breast cancer
treatment (13). Progress has been
achieved in the elucidation of the mechanisms underlying breast
cancer development, contributing towards the development of novel
therapeutic methods. However, the present knowledge is
insufficient.
In the present study, a biological informatics
approach was used to analyze the gene expression profiles in breast
cancer cells, while a functional analysis was performed in order to
identify differentially expressed genes (DEGs) between breast tumor
cells and matched normal tissues. Additionally, a protein-protein
interaction (PPI) network was constructed. The present study aimed
to generate a systematic perspective to understanding the
underlying mechanisms and identifying novel therapeutic targets for
breast cancer.
Materials and methods
Affymetrix microarray analysis
The array data for GSE26910, were downloaded from
the Gene Expression Omnibus (GEO; http://www.ncbi.nlm.nih.gov/geo/) database, as
reported by Planche et al (14). A total of 24 samples were used in
the development of the Affymetrix microarray data. The expression
profiles analyzed in this work were derived from 12 samples,
including six samples of stroma surrounding invasive primary breast
tumors and six samples of normal stroma breast tissues. The raw CEL
data and annotation files were downloaded based on the GPL570
platform (Affymetrix Human Genome U133 Plus 2.0 Array; Affymetrix,
Inc., Santa Clara, CA, USA) for further analysis.
Data processing and DEG analysis
The raw expression data were preprocessed using the
robust multiarray average (15)
algorithm with application of the Affy package (version 1.44.0;
Fred Hutchinson Cancer Research Center, Seattle, WA, USA) in the R
statistical software (version 3.1.2; Bell Labs, Murray Hill, NJ,
USA). When multiple probes corresponded to the same gene, the mean
value was calculated as the expression value of that gene.
The DEGs between breast cancer tissues and matched
normal tissues were analyzed using the linear models for microarray
data (limma) package (version 3.22.1; Fred Hutchinson Cancer
Research Center) (16). |log of
fold change|>1 and P<0.01 were considered to be the cut-off
values for DEG screening.
Gene ontology (GO) and pathway enrichment
analysis
GO is a tool for the unification of biology which
collects structured, defined and controlled vocabulary for large
scale of gene annotation (17). In
addition, the Kyoto Encyclopedia of Genes and Genomes (KEGG;
http://www.genome.jp/kegg/) database is
used for the classification of correlating gene sets into their
respective pathways (18).
In order to analyze the DEGs at a function level, GO
annotation and KEGG pathway enrichment analyses for DEGs were
performed using the Database for Annotation, Visualization and
Integration Discovery (DAVID) software (version 6.7; http://david.abcc.ncifcrf.gov). The DEGs were
classified into three GO categories, including molecular function
(MF), biological process (BP) and cellular component (CC).
P<0.01 was set as the threshold value.
PPI network construction
Search Tool for the Retrieval of Interacting Genes
(STRING), an online database resource that collects comprehensive
information of predicted and experimental interactions of proteins
(19), was used in the present
study. The interactions of protein pairs in the STRING database
were displayed using a combined score. The DEGs were mapped into
PPI networks and a combined score of >0.5 was set as the cut-off
value for significant protein pairs. The PPI network was
established using Cytoscape software (version 1.1.1; National
Institute of General Medical Sciences, Bethesda, MA, USA) (20) and the hub node was screened
according to the degree score (number of neighbors). The
subnetworks (nodes >15) were evaluated using the Molecular
Complex Detection (MCODE) plugin of Cytoscape (21). Subsequently, the subnetwork
functions were assessed by GO and pathway enrichment analyses of
the genes involved in the subnetworks using the DAVID online
tool.
Results
Data processing and DEG analysis
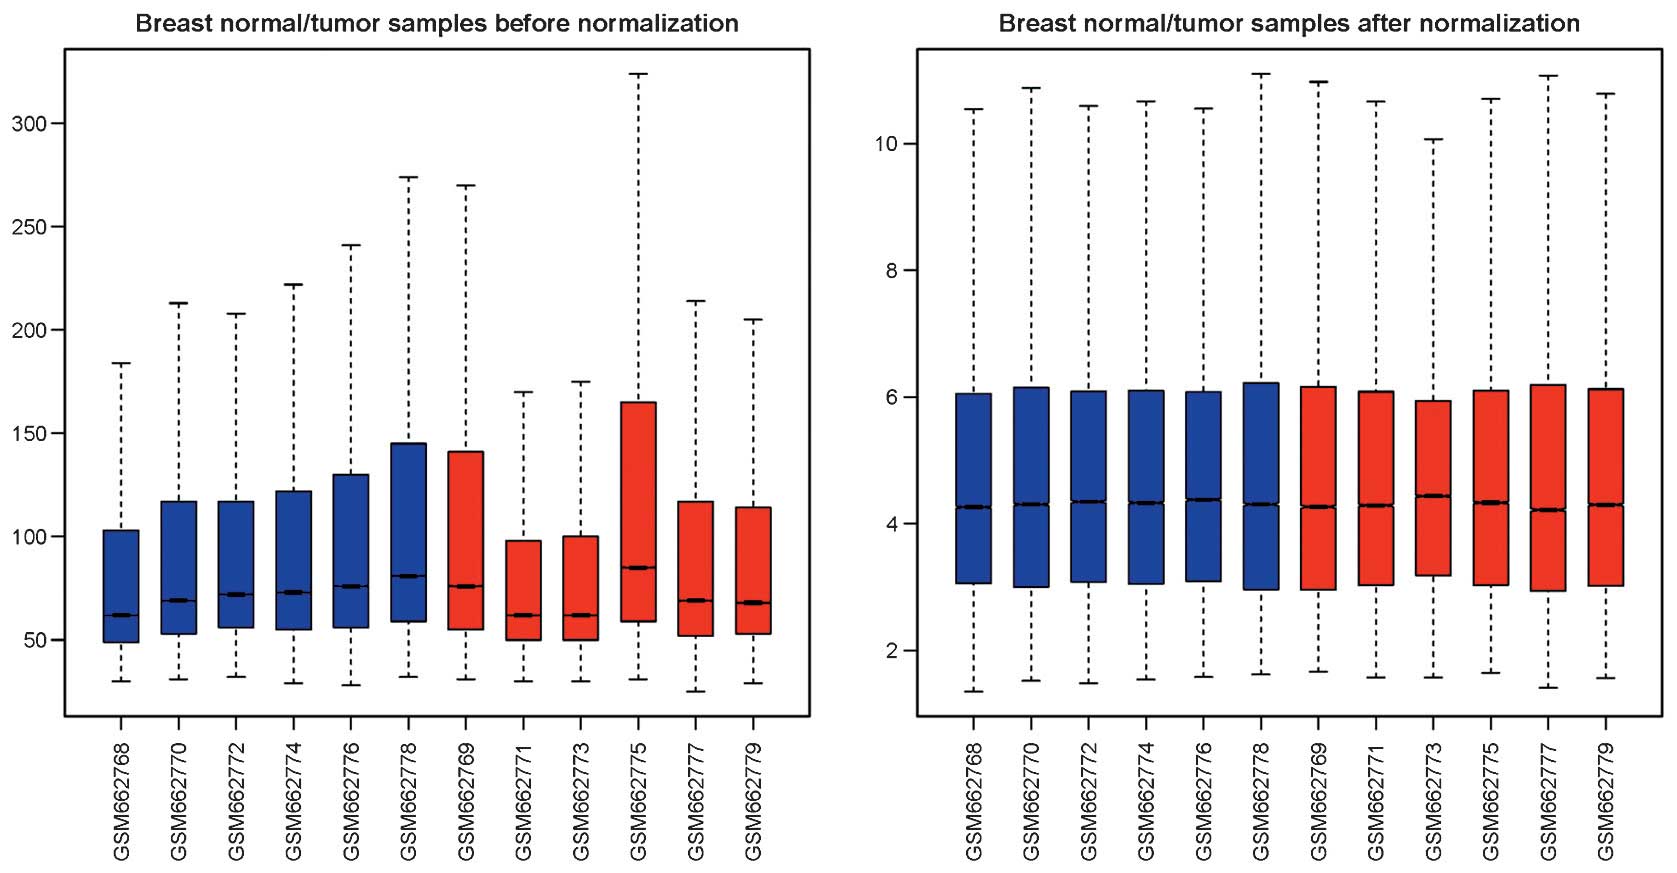
As shown in Fig. 1,
the obscuring variations in the raw expression data were normalized
following preprocessing. Subsequently, DEG analysis was performed
using the limma software package. A total of 571 genes were found
to be differentially expressed between breast cancer tissues and
normal tissues, among which 241 genes were upregulated and 330
genes were downregulated.
GO and pathway enrichment analyses
GO and pathway analyses were performed on
upregulated and downregulated DEGs, separately. The top five GO
terms identified in each of the three GO categories (BP, CC and MF)
are shown in Table I. The
overrepresented GO terms of upregulated DEGs were associated with
cell adhesion, response to wounding, immune response, extracellular
region, extracellular matrix, calcium ion binding and actin
binding. The downregulated DEGs involved in the three GO categories
were as follows: in the BP category, cell surface receptor-linked
signal transduction, response to wounding and cell adhesion; in the
CC category, plasma membrane, extracellular region and plasma
membrane region; and in the MF category, carbohydrate, lipid and
polysaccharide binding.
 | Table IGO and pathway enrichment analysis
for DEGs. |
Table I
GO and pathway enrichment analysis
for DEGs.
| Category | Term | Count | P-value |
|---|
| Upregulated
DEGs |
| GOTERM_BP_FAT | GO: 0007155 - cell
adhesion | 28 |
3.21×10⁻⁷ |
| GOTERM_BP_FAT | GO: 0022610 -
biological adhesion | 28 |
3.30×10⁻⁷ |
| GOTERM_BP_FAT | GO: 0009611 -
response to wounding | 22 |
4.93×10⁻⁶ |
| GOTERM_BP_FAT | GO: 0006955 -
immune response | 21 |
6.08×10⁻⁴ |
| GOTERM_BP_FAT | GO: 0042981 -
regulation of apoptosis | 21 |
3.74×10⁻³ |
| GOTERM_CC_FAT | GO: 0005576 -
extracellular region | 68 |
3.07×10⁻¹¹ |
| GOTERM_CC_FAT | GO: 0044421 -
extracellular region part | 40 |
7.01×10⁻⁹ |
| GOTERM_CC_FAT | GO: 0005578 -
proteinaceous extracellular matrix | 24 |
4.22×10⁻¹⁰ |
| GOTERM_CC_FAT | GO: 0031012 -
extracellular matrix | 24 |
1.83×10⁻⁹ |
| GOTERM_CC_FAT | GO: 0005615 -
extracellular space | 22 |
1.39×10⁻³ |
| GOTERM_MF_FAT | GO: 0005509 -
calcium ion binding | 24 |
1.05×10⁻³ |
| GOTERM_MF_FAT | GO: 0030246 -
carbohydrate binding | 14 |
4.94×10⁻⁴ |
| GOTERM_MF_FAT | GO: 0003779 - actin
binding | 13 |
7.97×10⁻⁴ |
| GOTERM_MF_FAT | GO: 0042277 -
peptide binding | 9 |
3.95×10⁻³ |
| GOTERM_MF_FAT | GO: 0005201 -
extracellular matrix structural constituent | 8 |
9.73×10⁻⁵ |
| KEGG_PATHWAY | hsa04060:
Cytokine-cytokine receptor interaction | 12 |
5.61×10⁻³ |
| KEGG_PATHWAY | hsa04510: Focal
adhesion | 10 |
8.09×10⁻³ |
| KEGG_PATHWAY | hsa04512:
Extracellular matrix-receptor interaction | 9 |
9.44×10⁻⁵ |
| Downregulated
DEGs |
| GOTERM_BP_FAT | GO: 0007166 - cell
surface receptor-linked signal transduction | 51 |
4.35×10⁻⁴ |
| GOTERM_BP_FAT | GO: 0009611 -
response to wounding | 28 |
2.88×10⁻⁷ |
| GOTERM_BP_FAT | GO: 0007155 - cell
adhesion | 27 |
1.29×10⁻⁴ |
| GOTERM_BP_FAT | GO: 0022610 -
biological adhesion | 27 |
1.32×10⁻⁴ |
| GOTERM_BP_FAT | GO: 0010033 -
response to organic substance | 26 |
4.93×10⁻⁴ |
| GOTERM_CC_FAT | GO: 0005886 -
plasma membrane | 101 |
3.38×10⁻⁶ |
| GOTERM_CC_FAT | GO: 0005576 -
extracellular region | 66 |
6.96×10⁻⁷ |
| GOTERM_CC_FAT | GO: 0044459 -
plasma membrane part | 66 |
1.64×10⁻⁵ |
| GOTERM_CC_FAT | GO: 0044421 -
extracellular region part | 46 |
1.76×10⁻⁹ |
| GOTERM_CC_FAT | GO: 0031226 -
intrinsic to plasma membrane | 37 |
1.76×10⁻³ |
| GOTERM_MF_FAT | GO: 0030246 -
carbohydrate binding | 18 |
1.02×10⁻⁴ |
| GOTERM_MF_FAT | GO: 0008289 - lipid
binding | 17 |
3.87×10⁻³ |
| GOTERM_MF_FAT | GO: 0030247 -
polysaccharide binding | 10 |
1.16×10⁻³ |
| GOTERM_MF_FAT | GO: 0001871 -
pattern binding | 10 |
1.16×10⁻³ |
| GOTERM_MF_FAT | GO: 0005539 -
glycosaminoglycan binding | 8 |
9.36×10⁻³ |
| KEGG_PATHWAY | hsa04360: Axon
guidance | 8 |
9.98×10⁻³ |
| KEGG_PATHWAY | hsa04610:
Complement and coagulation cascades | 7 |
1.69×10⁻³ |
The pathways significantly enriched by the
upregulated DEGs included the cytokine-cytokine receptor
interaction, focal adhesion and extracellular matrix (ECM)-receptor
interaction pathways. By contrast, the two pathways that were
enriched by the downregulated DEGs included the axon guidance and
complement and coagulation cascade pathways (Table I).
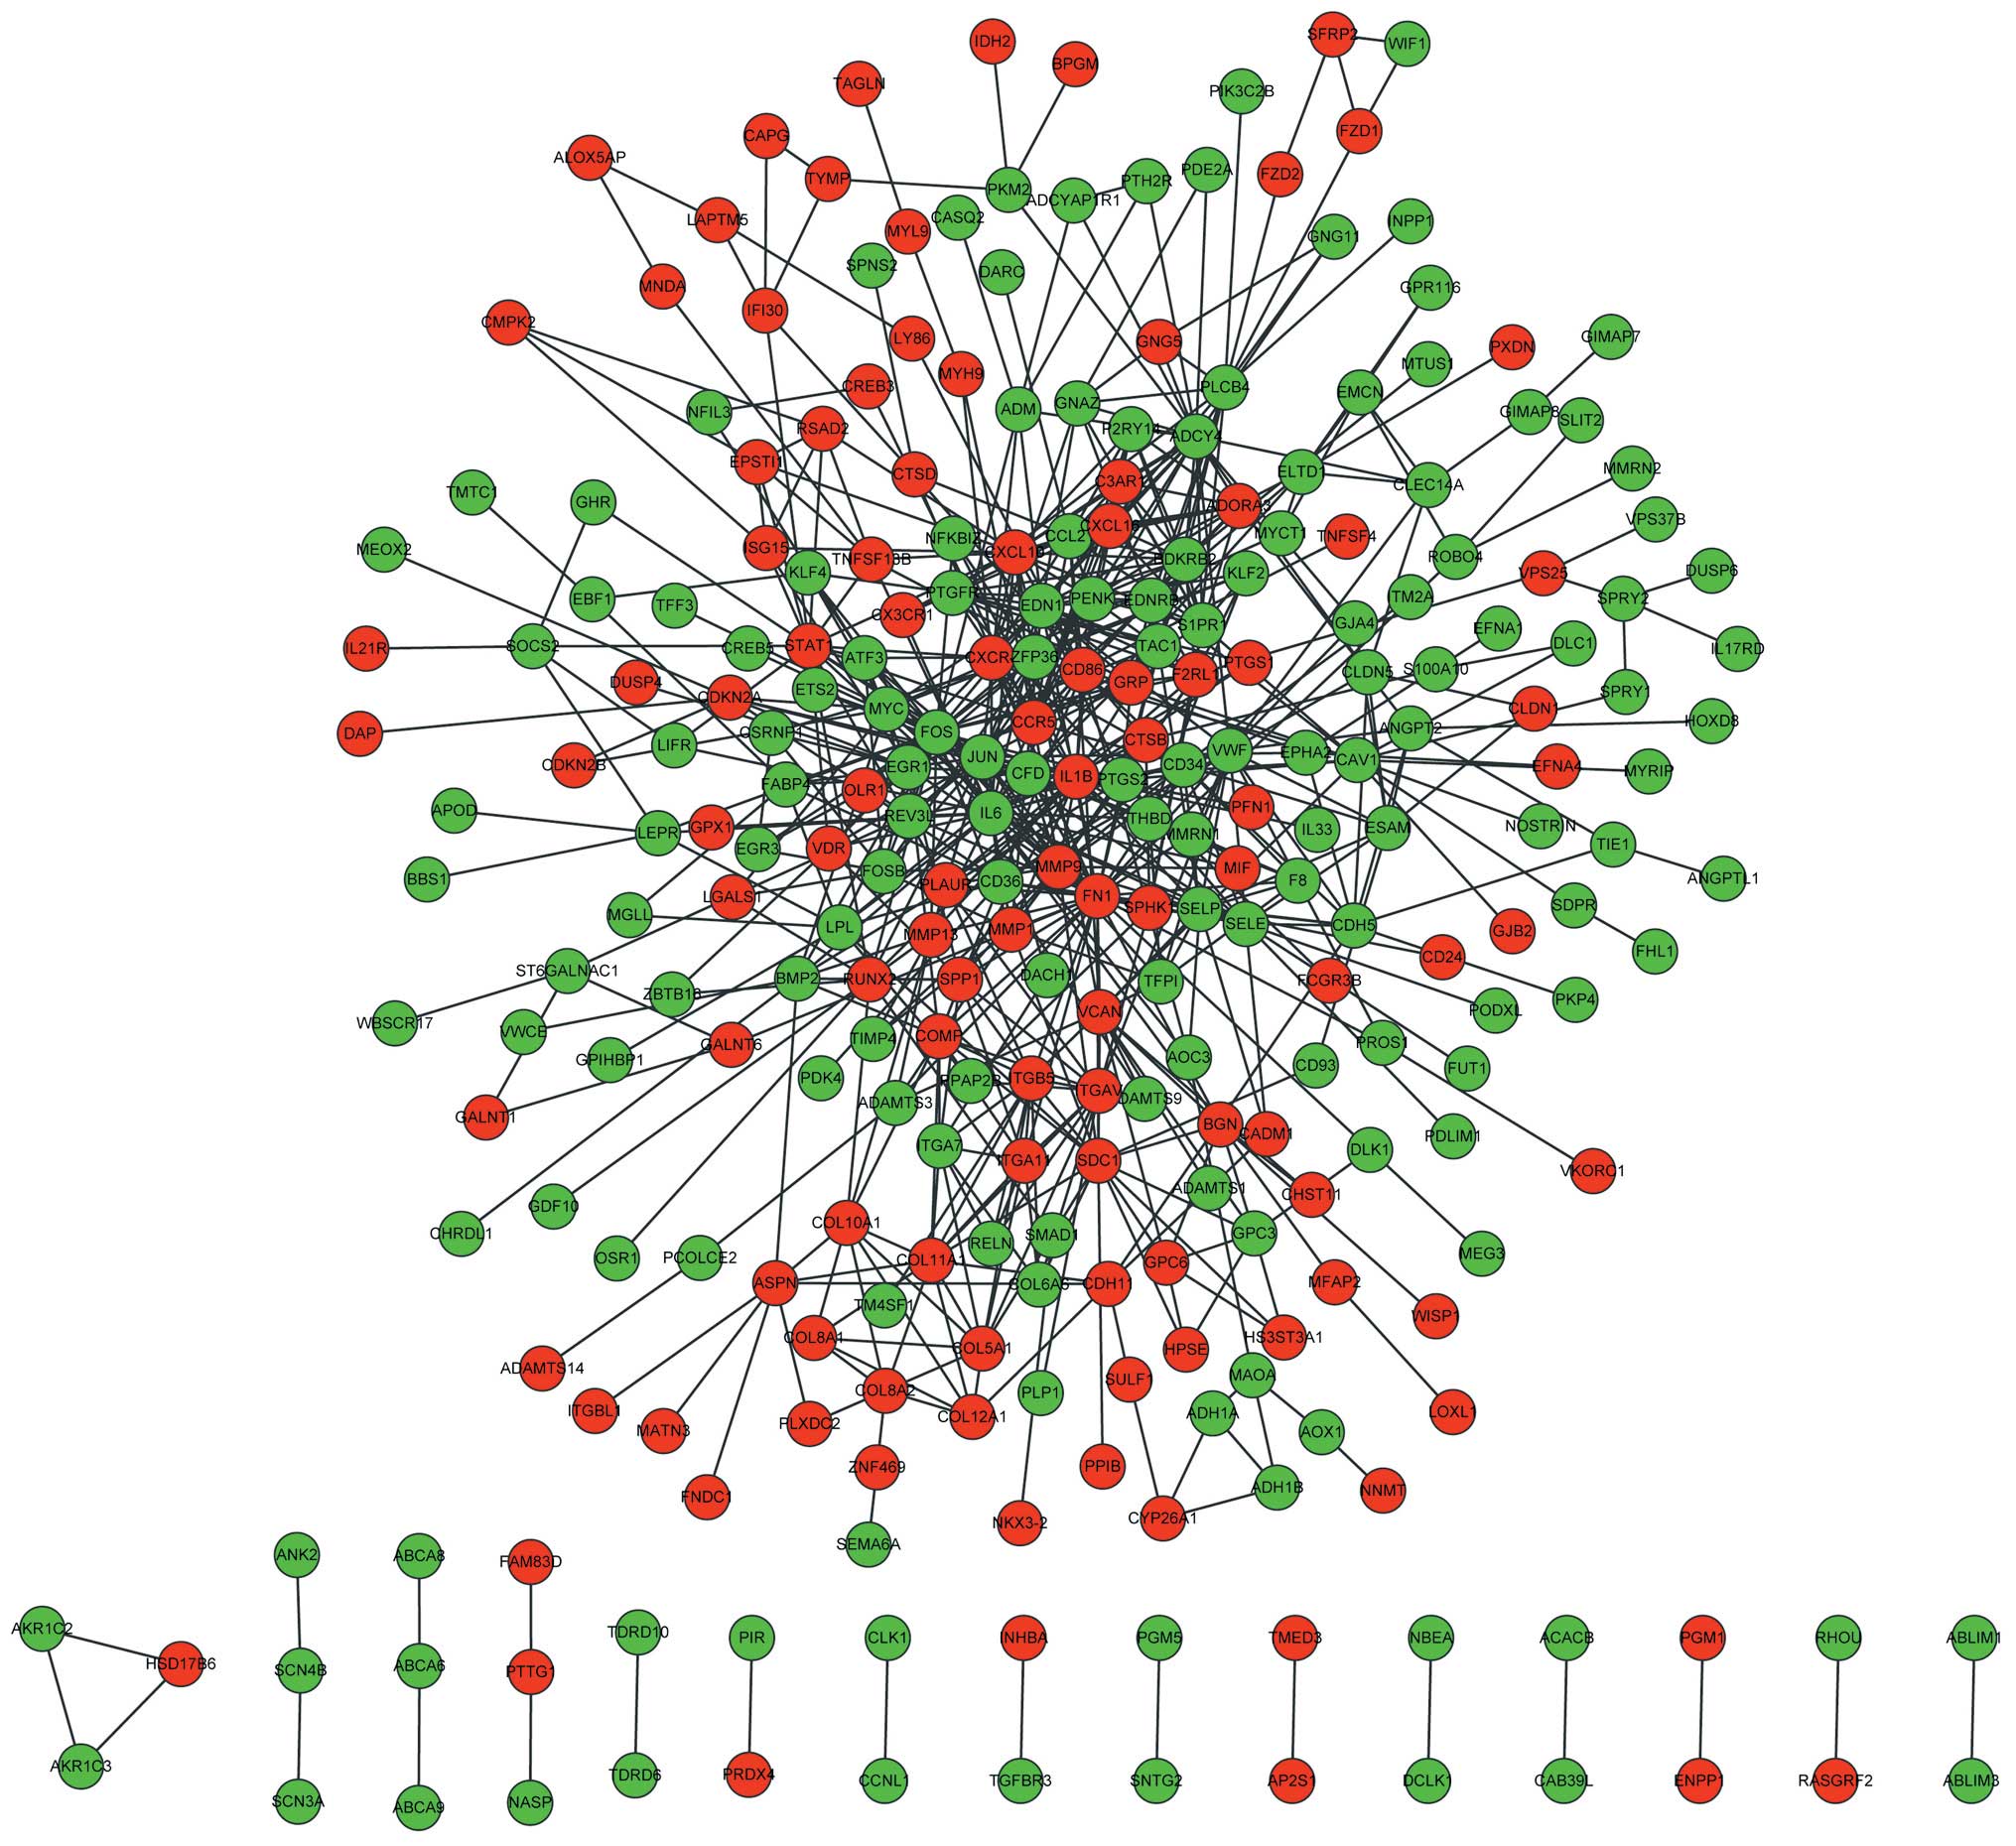
PPI network analysis
Based on STRING database analysis, a total of 718
protein pairs with combined scores of >0.5 were identified. As
demonstrated in Fig. 2, the PPI
network consisted of 273 nodes and 718 edges. The nodes of
fibronectin 1 (FN1; degree score, 39), interleukin 6 (IL6; degree
score, 96) and c-Fos protein (degree score, 32) were hub proteins
in the PPI network.
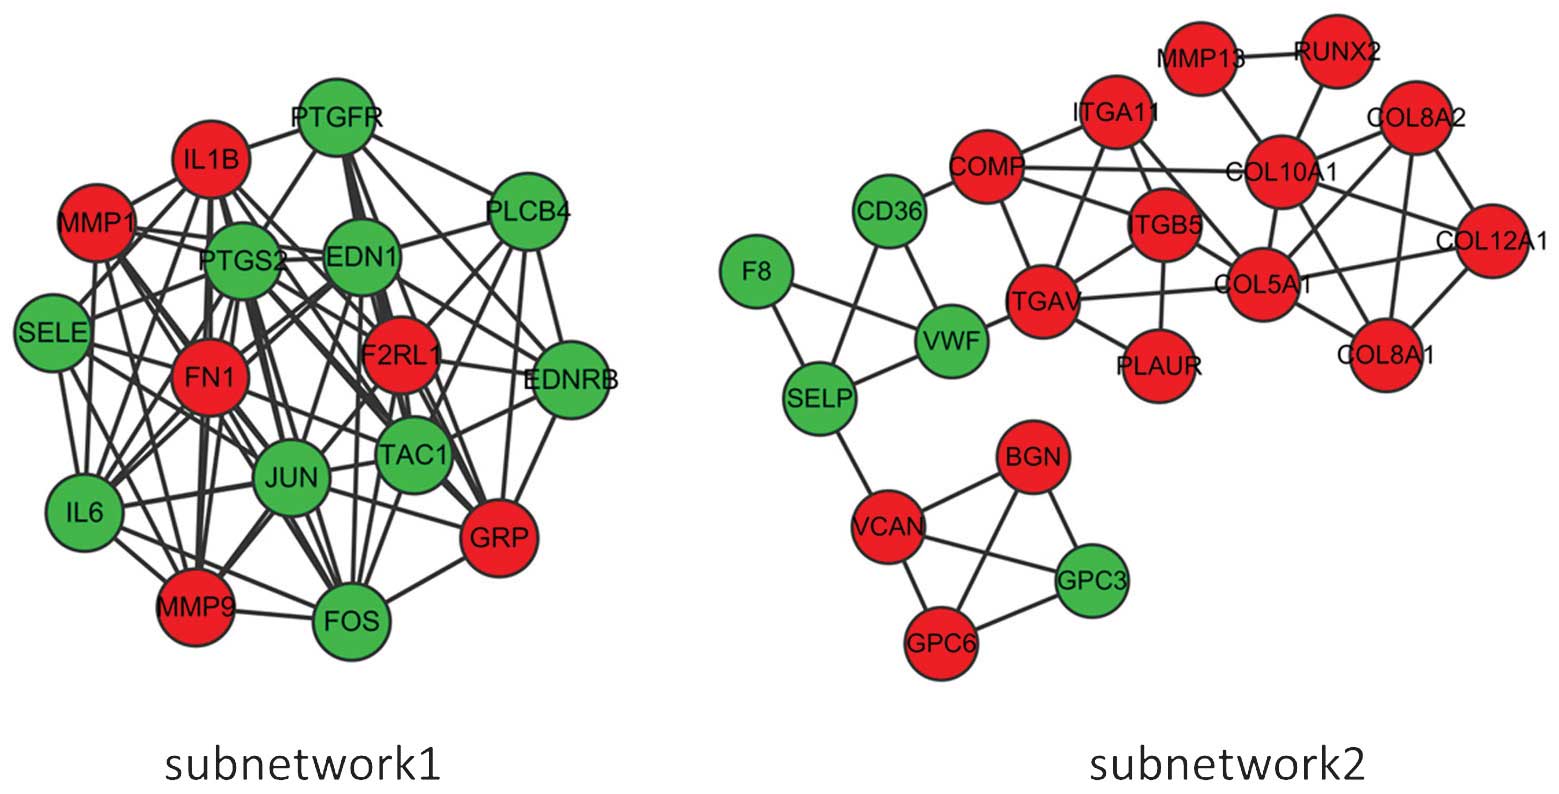
Two subnetworks (subnetworks 1 and 2) with >15
nodes were detected using the MCODE plugin (Fig. 3). The hub proteins FN1, IL6 and FOS
were demonstrated to be involved in subnetwork 1. Subnetwork 1 was
mainly associated with response to wounding and extracellular
region, while the most significant pathway was found to be the
Toll-like receptor signaling pathway (Table II). By contrast, subnetwork 2 was
associated with cell adhesion, response to wounding, wound healing,
glycoprotein binding and calcium ion binding (Table III). In addition, the significant
pathways associated with subnetwork 2 were focal adhesion,
complement and coagulation cascades and arrhythmogenic right
ventricular cardiomyopathy (Table
III).
| Table IIGO and pathway analysis for genes in
subnetwork 1. |
Table II
GO and pathway analysis for genes in
subnetwork 1.
| Category | Term | Count | P-value |
|---|
| GOTERM_BP_FAT | GO: 0007166 - cell
surface receptor linked signal transduction | 8 |
2.12×10⁻³ |
| GOTERM_BP_FAT | GO: 0002237 -
response to molecule of bacterial origin | 7 |
2.64×10⁻¹⁰ |
| GOTERM_BP_FAT | GO: 0009617 -
response to bacterium | 7 |
3.51×10⁻⁸ |
| GOTERM_BP_FAT | GO: 0007610 -
behavior | 7 |
6.45×10⁻⁶ |
| GOTERM_BP_FAT | GO: 0009611 -
response to wounding | 7 |
1.30×10⁻⁵ |
| GOTERM_CC_FAT | GO: 0044421 -
extracellular region part | 9 |
3.93×10⁻⁶ |
| GOTERM_CC_FAT | GO: 0005576 -
extracellular region | 9 |
8.38×10⁻⁴ |
| GOTERM_CC_FAT | GO: 0005615 -
extracellular space | 8 |
5.43×10⁻⁶ |
| KEGG_PATHWAY | hsa05200: Pathways
in cancer | 7 |
8.02×10⁻⁵ |
| KEGG_PATHWAY | hsa04620: Toll-like
receptor signaling pathway | 4 |
1.88×10⁻³ |
| Table IIIGO and pathway analysis for genes in
subnetwork 2. |
Table III
GO and pathway analysis for genes in
subnetwork 2.
| Category | Term | Count | P-value |
|---|
| GOTERM_BP_FAT | GO: 0007155 - cell
adhesion | 13 |
4.68×10⁻¹² |
| GOTERM_BP_FAT | GO: 0022610 -
biological adhesion | 13 |
4.76×10⁻¹² |
| GOTERM_BP_FAT | GO: 0009611 -
response to wounding | 7 |
4.36×10−05 |
| GOTERM_BP_FAT | GO: 0042060 - wound
healing | 5 |
1.01×10−04 |
| GOTERM_BP_FAT | GO: 0001501 -
skeletal system development | 5 |
7.15×10−04 |
| GOTERM_CC_FAT | GO: 0005576 -
extracellular region | 15 |
2.88×10−08 |
| GOTERM_CC_FAT | GO: 0044421 -
extracellular region part | 14 |
3.97×10⁻¹¹ |
| GOTERM_CC_FAT | GO: 0005578 -
proteinaceous extracellular matrix | 12 |
1.29×10⁻¹³ |
| GOTERM_CC_FAT | GO: 0031012 -
extracellular matrix | 12 |
2.95×10⁻¹³ |
| GOTERM_CC_FAT | GO: 0009986 - cell
surface | 8 |
3.97×10⁻⁷ |
| GOTERM_MF_FAT | GO: 0005509 -
calcium ion binding | 7 |
7.77×10⁻⁴ |
| GOTERM_MF_FAT | GO: 0001948 -
glycoprotein binding | 6 |
8.57×10⁻¹⁰ |
| GOTERM_MF_FAT | GO: 0005201 -
extracellular matrix structural constituent | 5 |
4.00×10⁻⁶ |
| GOTERM_MF_FAT | GO: 0005539 -
glycosaminoglycan binding | 5 |
2.76×10⁻⁵ |
| GOTERM_MF_FAT | GO: 0001871 -
pattern binding | 5 |
4.02×10⁻⁵ |
| KEGG_PATHWAY | hsa04512:
extracellular matrix-receptor interaction | 7 |
3.38×10⁻⁹ |
| KEGG_PATHWAY | hsa04510: Focal
adhesion | 6 |
1.97×10⁻⁵ |
| KEGG_PATHWAY | hsa04610:
Complement and coagulation cascades | 3 |
7.61×10⁻³ |
| KEGG_PATHWAY | hsa05412:
Arrhythmogenic right ventricular cardiomyopathy | 3 |
9.18×10⁻³ |
Discussion
Breast cancer is the most common type of invasive
cancer amongst females. In previous studies, gene expression
profiling has been used to predict the clinical outcomes of breast
cancer (22) and the distant
metastasis of lymph-node-negative primary breast cancer (23). In the present study, using the gene
expression patterns downloaded from the GEO database, 571 DEGs
between breast cancer and normal tissues were identified, including
241 upregulated and 330 downregulated genes. GO analysis identified
that several functional terms were statistically enriched by the
DEGs, which were associated with cell adhesion, the extracellular
region, response to wounding and immune response.
Cell adhesion is a common process in numerous
biological processes, including cell-cell and cell-matrix
interactions (24). Cell adhesion
is mediated by multiple distinct families of receptors targeting
cell adhesion to the ECM, as well as cellular growth,
differentiation and migration (25). The tumor metastasis process
initially requires the disruption of adhesion interaction between
tumor and normal cells or the extracellular matrix, resulting in
the release of neoplastic cells, followed by enhanced cell adhesion
at later time-points (26).
E-cadherin (E-cad) is a type of cell adhesion receptor, which
modulates intercellular interactions in epithelial tissues
(27). The critical role of E-cad
in the invasion and metastasis of breast cancer cells has been
previously reported (28). E-cad
has been found to be significantly accumulated in breast cancer
cells, accompanied by enhanced invasion and metastatic potential of
tumor cells (28). Recent evidence
has indicated that cellular adhesion molecules also possess
prognostic significance in patients with breast cancer (29). Therefore, the expression of E-cad,
combined with carcinoembryonic antigens, represents a powerful
biomarker for predicting the prognosis of breast cancer.
In addition, cell adhesion is considered to be
associated with the response to wounding and immune response. Cell
migration of monolayers has been found to occur in response to
wounding, surrounding the wound and facilitating wound closure
(30). The activation of the
immune response depends upon the regulation of cell-cell
interactions in the immune system and cell adhesion
receptor-regulation of the migration of lymphocytes and cell-cell
interactions (30). The present
study also demonstrated that the overrepresented pathways were
associated with cell adhesion, including focal adhesion and
ECM-receptor interactions. Therefore, cell adhesion may have a
crucial role in mediating breast cancer development.
In order to explore the interactions of the
identified DEGs, the PPI network was constructed. Three genes were
identified to be significant nodes with maximum degrees, including
FN1, IL6 and FOS. In addition, these three genes were
found to be significant nodes in subnetwork 1 (Fig. 3) and were involved in cell surface
receptor-linked signal transduction, response to wounding and the
extracellular region.
FN1, also known as encoding fibronectin 1, is
an ECM glycoprotein that binds to interleukin (31). FN1 was found to be involved
in cell adhesion and migration, wound healing and host defense
(32), which are in accordance
with the functions of subnetwork 1 identified in the present study.
The expression of FN1 is directly regulated by micro
(mi)RNA-206, which has been demonstrated to be associated with
metastatic cancer types, including breast cancer (33,34).
miRNA-206 inhibits cell growth in breast cancer by targeting
estrogen receptor 1. Furthermore, FN1 was found to be
correlated with the drug-resistance of cancer cells (35). The expression of FN1 was
reported to be significantly accumulated in vincristine-resistant
myeloma cells, while other ECM components, including type II
collagen α1, were downregulated. The results of the present study
indicated that the FN1 gene was upregulated in the
development of breast cancer and that FN1 was a hub protein with a
degree score of 39 in the established PPI network. Therefore, the
FN1 gene was found to be a key regulator in breast cancer
development.
FOS is a family of transcription factors including
c-Fos, FosB and Fra-1 (36).
c-Fos is a proto-oncogene associated with cellular functions
and has been found to be overexpressed in various types of cancer.
c-Fos functions as a nuclear transcription factor and plays
a crucial role in growth factor signaling (37). c-Fos is one of the targets
for the estrogen receptor (38),
and the expression of c-Fos is significantly enhanced by the
induction of estrogen in breast cancer cells (39). Estrogen sensitizes breast cancer
cells to growth factors, which then contribute to tumor growth
(37). In addition, previous
studies have indicated that proto-oncogenes, including
c-Fos, are involved in breast cancer cell cycle-associated
functions (40). Progestins, as
members of the estrogen family, have been shown to enhance
c-Fos expression resulting in acceleration of the cell cycle
progression (41). Furthermore,
IL6 is recognized as a pro-inflammatory cytokine that modulates the
inflammatory response (42). The
role of IL6 signaling has been widely investigated in the
development of various types of cancer, including liver (43), lung (44) and breast cancer (45). A recent study reported that the
expression levels of IL6 and IL8 in triple-negative
breast cancer (TNBC) were associated with cell survival, and that
the inhibition of IL6/IL8 signaling was a therapeutic
strategy for improving the prognosis of patients with TNBC
(45). Therefore, the key role of
FN1, IL6 and FOS in breast cancer development has
been demonstrated. These nodes may provide promising targets for
the treatment of breast cancer in the future.
In conclusion, gene expression profiles were found
to be altered during the development and progression of breast
cancer. The cell adhesion, extracellular region and immune response
were significant functions of the DEGs identified in breast cancer
progression. In addition, the FN1, IL6 and FOS genes
were found to be involved in breast cancer development. The present
study suggested that FN1, IL6 and FOS may be
potential targets in the development of treatments for breast
cancer. However, further evaluation of their potential applications
is required.
References
|
1
|
Powles TJ: Breast cancer prevention.
Oncologist. 7:60–64. 2002. View Article : Google Scholar : PubMed/NCBI
|
|
2
|
Yager JD and Davidson NE: Estrogen
carcinogenesis in breast cancer. N Engl J Med. 354:270–282. 2006.
View Article : Google Scholar : PubMed/NCBI
|
|
3
|
Nathanson KN, Wooster R and Weber BL:
Breast cancer genetics: what we know and what we need. Nat Med.
7:552–556. 2001. View
Article : Google Scholar : PubMed/NCBI
|
|
4
|
Wemer RS, McCormick B, Petrec J, et al:
Arm edema in conservatively managed breast cancer: obesity is a
major predictive factor. Radiology. 180:177–184. 1991. View Article : Google Scholar
|
|
5
|
Clapp RW, Jacobs MM and Loechler EL:
Environmental and occupational causes of cancer: new evidence
2005–2007. Rev Environ Health. 23:1–37. 2008. View Article : Google Scholar : PubMed/NCBI
|
|
6
|
Mohankumar K, Pajaniradje S, Sridharan S,
et al: Mechanism of apoptotic induction in human breast cancer
cell, MCF-7, by an analog of curcumin in comparison with curcumin -
an in vitro and in silico approach. Chem Biol Interact. 210:51–63.
2014. View Article : Google Scholar
|
|
7
|
World Health Organization: World cancer
report 2008. Boyle P and Levin B: IARC; 2008
|
|
8
|
Price JT, Tiganis T, Agarwal A, Djakiew D
and Thompson EW: Epidermal growth factor promotes MDA-MB-231 breast
cancer cell migration through a phosphatidylinositol 3′-kinase and
phospholipase C-dependent mechanism. Cancer Res. 59:5475–5478.
1999.PubMed/NCBI
|
|
9
|
Dang TT and Pearson GW: Abstract A38:
Breast cancer intrinsic subtype specific interactions with the
microenvironment dictate the mechanism of tumor invasion. Cancer
Res. 73(3 Supplement): A38. 2013. View Article : Google Scholar
|
|
10
|
Wu K, Weng Z, Tao Q, et al: Stage-specific
expression of breast cancer-specific gene γ-synuclein. Cancer
Epidemiol Biomarkers Prev. 12:920–925. 2003.PubMed/NCBI
|
|
11
|
Shou J, Massarweh S, Osborne CK, et al:
Mechanisms of tamoxifen resistance: increased estrogen
receptor-HER2/neu cross-talk in ER/HER2-positive breast cancer. J
Natl Cancer Inst. 96:926–935. 2004. View Article : Google Scholar : PubMed/NCBI
|
|
12
|
Pietras RJ, Arboleda J, Reese DM, et al:
HER-2 tyrosine kinase pathway targets estrogen receptor and
promotes hormone-independent growth in human breast cancer cells.
Oncogene. 10:2435–2446. 1995.PubMed/NCBI
|
|
13
|
Kubo M, Nakamura M, Tasaki A, et al:
Hedgehog signaling pathway is a new therapeutic target for patients
with breast cancer. Cancer Res. 64:6071–6074. 2004. View Article : Google Scholar : PubMed/NCBI
|
|
14
|
Planche A, Bacac M, Provero P, et al:
Identification of prognostic molecular features in the reactive
stroma of human breast and prostate cancer. PLoS One. 6:e186402011.
View Article : Google Scholar : PubMed/NCBI
|
|
15
|
Irizarry RA, Hobbs B, Collin F, et al:
Exploration, normalization, and summaries of high density
oligonucleotide array probe level data. Biostatistics. 4:249–264.
2003. View Article : Google Scholar : PubMed/NCBI
|
|
16
|
Smyth GK: Linear models and empirical
bayes methods for assessing differential expression in microarray
experiments. Stat Appl Genet Mol Biol. 3:Article3. 2004.
|
|
17
|
Ashburner M, Ball CA, Blake JA, et al:
Gene ontology: tool for the unification of biology. Nat Genet.
25:25–29. 2000. View
Article : Google Scholar : PubMed/NCBI
|
|
18
|
Altermann E and Klaenhammer TR:
PathwayVoyager: pathway mapping using the kyoto encyclopedia of
genes and genomes (KEGG) database. BMC Genomics. 6:602005.
View Article : Google Scholar : PubMed/NCBI
|
|
19
|
Szklarczyk D, Franceschini A, Kuhn M, et
al: The STR ING database in 2011: functional interaction networks
of proteins, globally integrated and scored. Nucleic Acids Res.
39:D561–D568. 2011. View Article : Google Scholar
|
|
20
|
Kohl M, Wiese S and Warscheid B:
Cytoscape: software for visualization and analysis of biological
networks. Methods Mol Biol. 696:291–303. 2011.
|
|
21
|
Bader GD and Hogue CW: An automated method
for finding molecular complexes in large protein interaction
networks. BMC Bioinformatics. 4:22003. View Article : Google Scholar : PubMed/NCBI
|
|
22
|
van ’t Veer LJ, Dai H, van de Vijver MJ,
et al: Gene expression profiling predicts clinical outcome of
breast cancer. Nature. 415:530–536. 2002. View Article : Google Scholar
|
|
23
|
Wang Y, Klijn JG, Zhang Y, et al:
Gene-expression profiles to predict distant metastasis of
lymph-node-negative primary breast cancer. Lancet. 365:671–679.
2005. View Article : Google Scholar : PubMed/NCBI
|
|
24
|
Gumbiner BM: Cell adhesion: The molecular
basis of tissue architecture and morphogenesis. Cell. 84:345–357.
1996. View Article : Google Scholar : PubMed/NCBI
|
|
25
|
Albelda SM and Buck CA: Integrins and
other cell adhesion molecules. FASEB J. 4:2868–2880.
1990.PubMed/NCBI
|
|
26
|
Albelda S: Role of integrins and other
cell adhesion molecules in tumor progression and metastasis. Lab
Invest. 68:4–17. 1993.PubMed/NCBI
|
|
27
|
Siitonen SM, Kononen JT, Helin HJ, Rantala
IS, Holli KA and Isola JJ: Reduced E-cadherin expression is
associated with invasiveness and unfavorable prognosis in breast
cancer. Am J Clin Pathol. 105:394–402. 1996.PubMed/NCBI
|
|
28
|
Oka H, Shiozaki H, Kobayashi K, et al:
Expression of E-cadherin cell adhesion molecules in human breast
cancer tissues and its relationship to metastasis. Cancer Res.
53:1696–1701. 1993.PubMed/NCBI
|
|
29
|
Saadatmand S, De Kruijf E, Sajet A, et al:
Expression of cell adhesion molecules and prognosis in breast
cancer. Br J Surg. 100:252–260. 2013. View
Article : Google Scholar
|
|
30
|
Springer TA: Adhesion receptors of the
immune system. Nature. 346:425–434. 1990. View Article : Google Scholar : PubMed/NCBI
|
|
31
|
Pankov R and Yamada KM: Fibronectin at a
glance. J Cell Sci. 115:3861–3863. 2002. View Article : Google Scholar : PubMed/NCBI
|
|
32
|
Steffens S, Schrader A, Vetter G, et al:
Fibronectin 1 protein expression in clear cell renal cell
carcinoma. Oncol Lett. 3:787–790. 2012.PubMed/NCBI
|
|
33
|
Kondo N, Toyama T, Sugiura H, Fujii Y and
Yamashita H: miR-206 expression is down-regulated in estrogen
receptor alpha-positive human breast cancer. Cancer Res.
68:5004–5008. 2008. View Article : Google Scholar : PubMed/NCBI
|
|
34
|
Adams BD, Claffey KP and White BA:
Argonaute-2 expression is regulated by epidermal growth factor
receptor and mitogen-activated protein kinase signaling and
correlates with a transformed phenotype in breast cancer cells.
Endocrinology. 150:14–23. 2009. View Article : Google Scholar :
|
|
35
|
Mutlu P, Ural AU and Gunduz U:
Differential gene expression analysis related to extracellular
matrix components in drug-resistant RPMI-8226 cell line. Biomed
Pharmacother. 66:228–231. 2012. View Article : Google Scholar : PubMed/NCBI
|
|
36
|
Milde-Langosch K: The Fos family of
transcription factors and their role in tumourigenesis. Eur J
Cancer. 41:2449–2461. 2005. View Article : Google Scholar : PubMed/NCBI
|
|
37
|
Lee AV, Cui X and Oesterreich S:
Cross-talk among estrogen receptor, epidermal growth factor, and
insulin-like growth factor signaling in breast cancer. Clin Cancer
Res. 7:4429s–4435s. 2001.
|
|
38
|
Hanstein B, Djahansouzi S, Dall P,
Beckmann M and Bender H: Insights into the molecular biology of the
estrogen receptor define novel therapeutic targets for breast
cancer. Eur J Endocrinol. 150:243–255. 2004. View Article : Google Scholar : PubMed/NCBI
|
|
39
|
Morishita S, Niwa K, Ichigo S, et al:
Overexpressions of c-fos/jun mRNA and their oncoproteins (Fos/Jun)
in the mouse uterus treated with three natural estrogens. Cancer
Lett. 97:225–231. 1995. View Article : Google Scholar : PubMed/NCBI
|
|
40
|
Musgrove EA, Lee C and Sutherland RL:
Progestins both stimulate and inhibit breast cancer cell cycle
progression while increasing expression of transforming growth
factor alpha, epidermal growth factor receptor, c-fos, and c-myc
genes. Mol Cell Biol. 11:5032–5043. 1991.PubMed/NCBI
|
|
41
|
Sutherland RL, Prall OW, Watts CK and
Musgrove EA: Estrogen and progestin regulation of cell cycle
progression. J Mammary Gland Biol Neoplasia. 3:63–72. 1998.
View Article : Google Scholar
|
|
42
|
Xing Z, Gauldie J, Cox G, Baumann H,
Jordana M, Lei XF and Achong MK: IL-6 is an antiinflammatory
cytokine required for controlling local or systemic acute
infammatory responses. J Clin Invest. 101:311–320. 1998. View Article : Google Scholar : PubMed/NCBI
|
|
43
|
He G, Dhar D, Nakagawa H, et al:
Identification of liver cancer progenitors whose malignant
progression depends on autocrine IL-6 signaling. Cell. 155:384–396.
2013. View Article : Google Scholar : PubMed/NCBI
|
|
44
|
Seifart C, Plagens A, Dempfle A, et al:
TNF-α, TNF-β, IL-6, and IL-10 polymorphisms in patients with lung
cancer. Dis Markers. 21:157–165. 2013. View Article : Google Scholar
|
|
45
|
Hartman ZC, Poage GM, Den Hollander P, et
al: Growth of triple-negative breast cancer cells relies upon
coordinate autocrine expression of the proinflammatory cytokines
IL-6 and IL-8. Cancer Res. 73:3470–3480. 2013. View Article : Google Scholar : PubMed/NCBI
|