Introduction
Gliomas are the most common type of intracranial
tumor, with malignant gliomas considered to be among the most
severe, not only due to their poor prognosis, but also due to their
direct repercussions on patient cognitive function and quality of
life (1,2). In the United States, the annual
incidence of malignant glioma is 6.04 per 100,000 people (3), and in Europe, the annual incidence is
3–5 per 100,000 people (4).
Despite modern diagnostics and marked advances in surgical
techniques, as well as systemic chemotherapy treatments, the
prognosis for patients with malignant glioma remains poor, with a
median survival rate of <15 months (5). Therefore, the study of the mechanisms
underlying tumorigenesis and glioma progression is paramount to the
development of novel chemotherapeutics, and for the identification
of novel therapeutic targets for malignant glioma treatment.
The metastasis-associated in colon cancer 1 (MACC1)
gene was initially identified in a genome-wide search for
differentially expressed genes in human colon cancer primary tissue
samples, metastatic tissue samples, and normal tissue samples
(6). Previous studies have
suggested that MACC1 is expressed not only in colon cancer, but
also in various other human cancers, including lung cancer
(7,8), hepatocellular carcinoma (9), ovarian carcinoma (10) and gastric carcinoma (11). In addition, further studies have
demonstrated that MACC1 is associated with the proliferation,
invasion, metastasis, and survival of tumor cells in these cancer
types (12). Furthermore,
overexpression of MACC1 serves as an independent indicator of
patient prognosis, by predicting the rates of recurrence and
disease-free survival (13). Yang
et al (14) previously
reported that MACC1 protein was overexpressed in glioma (14). In addition, Hagemann et al
(15) hypothesized that MACC1 may
be involved in the progression of human malignant glioma, as its
overexpression is associated with poor patient prognosis. However,
the mechanisms underlying the role of MACC1 in glioma remain
unclear, and the impact of MACC1 on proliferation, invasion,
metastasis and survival has yet to be fully understood.
The present study aimed to investigate the effects
of MACC1 on cell inhibition, proliferation, apoptosis, invasion,
and metastasis in human U251 glioma cells, following transfection
with MACC1-specific short hairpin RNA (shRNA) expression
plasmids.
Materials and methods
Cell lines
The U373, U251, A172, U87-MG and SHG4 human
malignant glioma cell lines used in the present study were
purchased from the American Type Culture Collection (Manassas, VA,
USA). All of the cell lines were cultured in Dulbecco's modified
Eagle's medium (DMEM; Gibco Life Technologies, Carlsbad, CA, USA)
supplemented with 100 units/ml penicillin, 100 µg/ml
streptomycin, and 10% (v/v) heat-inactivated fetal bovine serum
(FBS; GE Healthcare Life Sciences, Logan, UT, USA) at 37°C. The
medium was renewed every 2–3 days.
Cell transfection
The confluent cells (80–90% confluent) were
harvested for transfection. Lipofectamine® 2000
Transfection reagent, and nonsense and MACC1-specific shRNA
(InvitrogenLife Technologies, Carlsbad, CA, USA) were diluted in
Opti-MEM® medium (Life Technologies, Grand Island, NY,
USA). The shRNA sequences were as follows: MACC1-specific shRNA,
atggcttggttaagtcaac; and nonsense shRNA, ttctccgaacgtgtcacgt. The
shRNA was added to the Lipofectamine® 2000 Transfection
Reagent at a 1:1 ratio, prior to being incubated for 5 min at room
temperature. The shRNA-lipid complex was then added to the cells,
and further incubated for 1 day at 37°C. The transfected cells were
cultured in DMEM supplemented with Geneticin® (Gibco
Life Technologies) for 1–2 weeks. Transfection efficiency was
assessed by fluorescence microscopy (DP73; Olympus Corporation,
Tokyo, Japan).
Reverse transcription-quantitative
polymerase chain reaction (RT-qPCR)
RNA was extracted from the experimental cells using
the RNA Simple Total RNA kit (Tiangen Biotech Co., Ltd., Beijing,
China), according to the manufacturer's instructions. Briefly, in
order to synthesize the cDNA, total RNA (1 µg) was reverse
transcribed in 20 µl 2X Power Taq PCR MasterMix (BioTeke
Corporation, Beijing, China) according to the manufacturer's
instructions. The RT products were subsequently amplified using
RT-qPCR. The primers used for RT-qPCR were as follows: MACC1 sense,
5′-CACAACTTGCGGAGGTCAC-3′; antisense, 5′-TTCCAACAACGGGCTCACAG-3′;
and β-actin sense, 5′-CTTAGTTGCGTTACACCCTTTCTTG-3′; antisense,
5′-CTGTCACCTTCACCGTTCCAG TTT-3′ (Sangon Biotech Co., Ltd.,
Shanghai, China). The RT was performed using the Exicycler 96
Research system (Bioneer Corporation, Daejeon, Korea), and the
reaction conditions for the RT were as follows: 25°C for 10 min,
42°C for 50 min, and 95°C for 5 min. The results of the PCR were
analyzed using the 2−ΔΔCt method (16).
The PCR amplification conditions were as follows:
95°C for 10 min, followed by 40 cycles of 95°C for 10 sec, 60°C for
20 sec and 72°C for 30 sec, and 4°C for 5 min. The results of the
PCR were verified by varying the number of PCR cycles for each
cDNA, and for each set of primers. The RT-qPCR was performed in
triplicate.
Western blot analysis
The cells were harvested and lysed using
radioimmunoprecipitation buffer (Beyotime Institute of
Biotechnology, Haimen, China) and phenylmethylsulfonyl fluoride
(Beyotime Institute of Biotechnology) for 30 min on ice. The
protein extracts were subsequently centrifuged at 24,148 × g for 10
min at 4°C, and the protein concentration was determined using a
bicinchoninic acid protein assay kit (Beyotime Institute of
Biotechnology). The protein extracts (40 µg) were
subsequently separated by 8%–12% SDS-PAGE prior to being
transferred onto polyvinylidene fluoride membranes (EMD Millipore,
Billerica, MA, USA). The membranes were then stained with 0.2%
Ponceau S Red (Beyotime Institute of Biotechnology) to ensure equal
loading of the proteins. The membranes were then blocked with 5%
nonfat milk, and were incubated with antibodies targeting MACC1
(1:100; cat. no. bs-4293R; BIOSS, Beijing, China), and cyclin D1
(1:1,000; cat. no. WL0205), cyclin E (1:1,000; cat. no. WL0055),
cyclin B (1:1,000; cat. no. WL0023), cleaved caspase-3 (1:200; cat.
no. WL0146), B cell lymphoma 2 (Bcl-2; 1:500; cat. no. WL0104),
Bcl-2-associated X protein (Bax; 1:500; cat. no. WL0101), matrix
metalloproteinase 2 (MMP-2; 1:500; cat. no. WL0657), MMP-9 (1:500;
cat. no. WL0884) and β-actin (1:1,000; cat. no. WL0001a; all
Wanleibio Ltd., Shenyang, China) overnight at 4°C. The membranes
were subsequently incubated with horseradish peroxidase-conjugated
goat anti-rabbit immunoglobulin G secondary antibody at 1:5,000
dilution, at room temperature for 1 h (cat. no. A0208; Beyotime
Institute of Biotechnology). β-actin was used as the internal
positive control. The immunocomplexes were visualized using
enhanced chemiluminescence western blotting detection reagents
(7seabiotech, Shanghai, China). The relative amounts of transferred
protein were quantified by scanning the autoradiographic films
using UN-SCAN-IT Gel Analysis software (Silk Scientific Inc., Orem,
UT, USA) prior to being normalized to the corresponding β-actin
level. The quantitative analysis of the western blot was carried
out using the Gel-Pro Analyzer software (Media Cybernetics, Inc.,
Rockville, MD, USA).
Apoptosis and cell cycle assays
In order to conduct the apoptosis assay, the
comparative levels of apoptotic cells were determined by
fluorescence-activated cell sorting (FACS), following staining with
propidium iodide (PI) and Annexin V. Briefly, the cells were
harvested and washed twice in cold phosphate buffered saline (PBS;
Hyclone, Logan, UT, USA) prior to being stained with PI, and
subsequently detected using the Annexin V-Fluorescein
Isothiocyanate Apoptosis Detection kit (Nanjing KeyGen Biotech Co.,
Ltd, Nanjing, China), according to the manufacturer's instructions.
Flow cytometry was performed using the BD FACSCalibur (BD
Biosciences, San Jose, CA, USA), and the data were analyzed using
FCS Express software version 3 (BD Biosciences).
For the cell cycle assay, the cells were fixed with
ice-cold 70% ethanol at a density of 1×10⁵ cells/ml, and
treated with 200 µg/ml ribonuclease (Beyotime Institute of
Biotechnology) for 30 min at 37°C. PI (Beyotime Institute of
Biotechnology) was subsequently added to the solution in order to
produce a final concentration of 50 µg/ml. The DNA content
was then quantitated by flow cytometry (FACSCalibur; BD
Biosciences) with an excitation wavelength of 488 nm, and an
emission wavelength of 625 nm. The data were analyzed using
CellQuest (BD Biosciences) software on 10,000 events.
Colony forming assay
The cells were seeded onto 35 mm cell culture dishes
(200/plate; Corning Life Sciences, Manassas, VA, USA) and cultured
in DMEM supplemented with 10% FBS. The medium was changed every 3
days, and following a 14 day incubation the cells were fixed with
4% paraformaldehyde for 5–8 min prior to being stained with
Wright-Giemsa (Nanjing Jiancheng Bioengineering Institute, Nanjing,
China). The stained cells were observed, and images were captured
using a stereomicroscope (AE31; Motic Microscopes, Xiamen, China).
The experiment was repeated three times, and aggregates with >50
cells were scored as a colony. Colony forming efficiency was
determined using the following formula: Colony forming efficiency =
(colony number in sh(MACC1)/cell population) x 100%.
MTT colorimetric assay
The cells were seeded onto 96-well plates at a
density of 2×10³ cells/well and incubated in DMEM
supplemented with 10% serum for 24, 48, 72, and 96 h, prior to
being analyzed for cell growth. Five duplicate wells were set up
for each group. At each time point, 0.2 mg/ml MTT (Sigma-Aldrich,
St. Louis, MO, USA) was added to each well and incubated for 4 h,
following which 200 µl dimethyl sulfoxide (Sigma-Aldrich)
was added to each well. Following the complete solubilization of
the dye, the absorbance levels of the wells were measured using a
microplate spectrophotometer (ELx-800; BioTek Instruments, Inc.,
Winooski, VT, USA) at 490 nm.
Hoechst staining assay
The cells were seeded onto 12-well plates at a
density of 1×10⁵ cells/well and incubated in DMEM
containing 10% FBS for ~24 h. Once the cells grew to occupy 80% of
the well, they were fixed with a stain-fixative (Beyotime Institute
of Biotechnology) for 20 min. The fixed cells were subsequently
washed twice in cold PBS for 3 min prior to being stained with
Hoechst (Beyotime Institute of Biotechnology) for a further 5 min.
Morphological changes of the cellular cytoskeleton were observed
using a fluorescence microscope (Olympus Corporation).
Transwell assay
Transwell chambers were used to measure cell
migration. A total of 200 µl cells in serum-free DMEM were
seeded into each upper chamber (Corning Life Sciences, Manassas,
VA, USA) of the transwell at a concentration of 2×10⁴
cells/ml, whereas 800 µl cells were seeded into each lower
chamber in DMEM supplemented with 15% FBS, which acted as a
chemoattractant. Three duplicate wells were set up for each group.
The cells were subsequently removed from the upper surface of the
filter following a 24 h culture. The cells that penetrated through
the filter were fixed with 4% paraformaldehyde for 20 min, prior to
being stained with 0.5% crystal violet (Amresco LLC, Solon, OH,
USA). Five non-overlapping random visual fields were selected in
order to count the cells on the lower membrane under a high powered
lens (x200) (AE31; Motic Microscopes).
Wound healing assay
The cells were seeded onto 6-well plates and
cultured until confluent (80–90%) in DMEM supplemented with 10%
FBS. The medium was discarded and a straight scratch was
subsequently placed across the culture, using a 200 µl
pipette tip, in order to simulate a wound. The plates were then
washed twice with serum-free DMEM. The cells were observed and
images were captured using a microscope (AE31; Motic Microscopes),
in order to ensure enough cells were present at the leading edge of
the wound. The cells were subsequently cultured in serum-free DMEM
for a further 12–24 h prior to image capture. The migration rate of
the cells was calculated by measuring the distance travelled by the
cells towards the center of the wound at 12 and 24 h.
Gelatin zymography assay
Gelatin zymography was performed in order to
determine the activity of MMP-2 and MMP-9. Briefly, the protein
samples (40 µg) were separated by 10% SDS-PAGE containing 1
mg/ml gelatin (Sigma-Aldrich) at 4°C. Following electrophoresis,
the gel was incubated with 2.5% Triton X-10 0 (Amresco LLC) in
distilled water with gentle agitation for 40 min at room
temperature. Subsequently, the gel was further incubated in
developing buffer (50 mM Tris-HCl, 0.2 M NaCl, 5 mM
CaCl2, 1 µM ZnCl2 and 0.02% Brij35)
overnight with gentle agitation. The gel was then stained with
Coomassie blue R-250 (Amresco LLC) for 30 min. Following incubation
with the staining solution, the gel was washed with a destaining
solution (2.5% Triton X-100, 50 mmol/l Tris-HCl, 5 mmol/l
CaCl2, 1 µmol/l ZnCl2; pH 7.6) until
the bands became visible against the blue background. The
incubation time was optimized depending on the enzyme activity. The
quantitative analysis of the gelatin zymography was carried out
using the Gel Documentation & Analysis system (Beijing Liuyi
Instrument Factory, Beijing, China).
Statistical analysis
The data from a minimum of three experiments were
presented as the mean ± standard deviation. Statistical comparisons
were subsequently made using the Bonferroni multiple comparison
test, or with a one-way analysis of variance. SPSS version 20.0
(IBM SPSS, Armonk, NY, USA) was used to conduct statistical
analyses. P<0.05 was considered to indicate a statistically
significant difference.
Results
Screening of MACC1 expression levels in
various glioma cell lines, and the establishment of glioma cell
lines with silenced MACC1 expression
The expression levels of MACC1 were detected in
various glioma cell lines by western blotting. As demonstrated in
Fig. 1A, the protein expression
levels of MACC1 were highest in U251 glioma cells. Quantitative
analysis of the gray intensity revealed that the relative intensity
of MACC1 in the U251 cells was 1.60±0.21, almost twice the relative
intensity of MACC1 in A172 cells (0.83±0.10). The relative
intensity of MACC1 expression in the glioma cell lines was as
follows: U251 (1.60±0.21), SHG44 (1.31±0.17), U373 (1.00±0.00),
U87-MG (0.87±0.09), and A172 (0.83±0.10) (Fig. 1B; P<0.01). These results suggest
that the expression levels of MACC1 were markedly higher in U251
cells, as compared with other glioma cell lines such as A172 and
U87-MG (P<0.01). Therefore, the U251 cell line was selected to
investigate the effects of MACC1 silencing on the proliferation and
metastasis of malignant glioma cells.
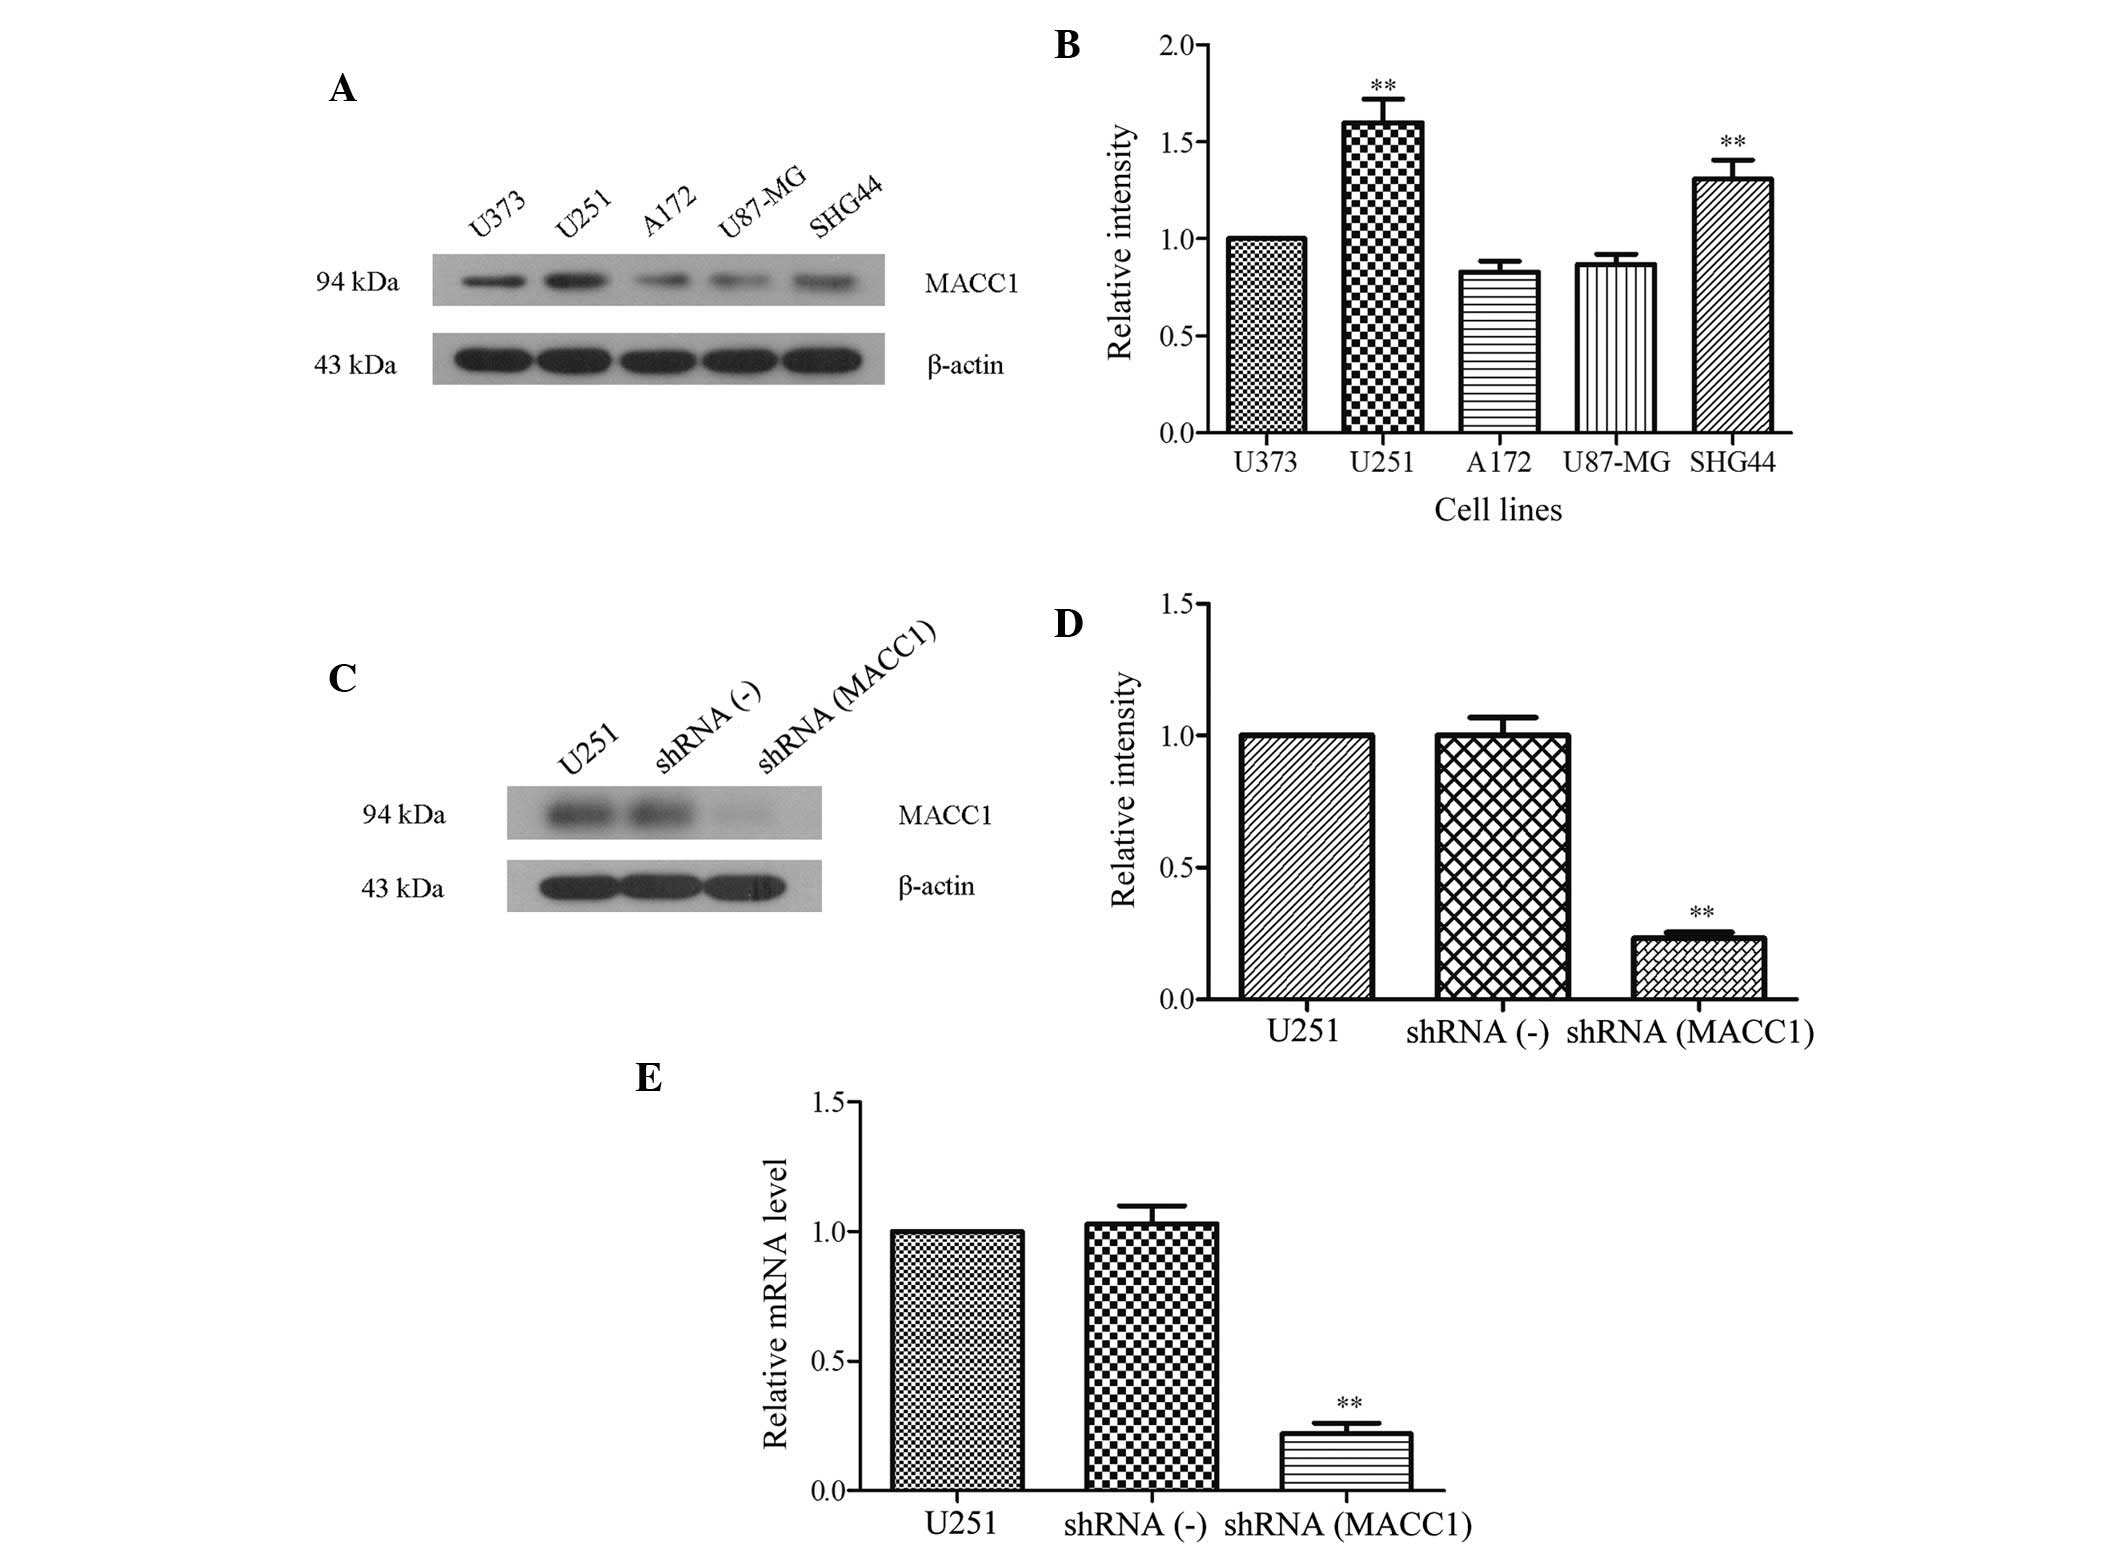 | Figure 1Screening of the
metastasis-associated in colon cancer 1 (MACC1) expression levels
in various glioma cell lines, and establishment of glioma cell
lines containing silenced MACC1. (A) Protein expression levels of
MACC1 were highest in the U251 cells, as compared with the other
glioma cell lines. The expression levels of MACC1 in the U373,
U251, A172, U87-MG and SHG44 cells were determined using western
blot analysis during the cellular growth phase, and (B) the
quantitative analysis of gray intensity was determined.
**P<0.01, vs. A172 group. (C) MACC1 silencing in the
U251 cells was established using RNA interference (RNAi). The
relative protein expression levels of MACC1 in the U251, small
hairpin (sh)RNA(-), and shRNA(MACC1) cells were determined by
western blot analysis, and (D) the quantitative analysis of gray
intensity was calculated for each cell line. No marked differences
were observed between the U251 and shRNA(-) cells.
**P<0.01, vs. shRNA(-) group. (E) Relative mRNA
expression levels of MACC1 were determined by reverse
transcription-quantitative polymerase chain reaction in the U251,
shRNA(-), and shRNA(MACC1) cells. **P<0.01, vs.
shRNA(-) group. Data are presented as the mean ± standard
deviation. U251, U251 cells without RNAi; shRNA(-), U251 cells
transfected with negative control shRNA; shRNA(MACC1), U251 cells
transfected with silenced MACC1 shRNA. |
The interference fragments of the MACC1 gene group
and the nonsense oligodeoxynucleotide group were designed and
synthesized, prior to being ligated into pGCsi-H1 plasmids. The
pGCsi-H1 plasmid constructs were subsequently transfected into the
U251 cell lines, in order to generate shRNA(-), and shRNA(MACC1)
U251 cells. To examine stable transfection efficiency, a western
blot analysis was used to determine the expression levels of MACC1
in the U251, shRNA(-) U251, and shRNA(MACC1) U251 cells. As shown
in Fig. 1C, there was little MACC1
expression in the shRNA(MACC1) U251 cells. Although there was no
marked difference between the expression levels of MACC1 in the
shRNA(-) U251 and the U251 cells, the quantitative analysis of gray
intensity revealed that MACC1 expression levels were 4-fold lower
in the shRNA (0.23±0.04) cells, as compared with the U251
(1.00±0.00) and shRNA(-) (1.00±0.12) cells (Fig. 1D; P<0.01). In addition, RT-qPCR
was used to determine the mRNA expression levels of MACC1 in the
three cell lines. The results of the RT-qPCR demonstrated a similar
trend to those of the western blot analysis. The mRNA expression
levels of MACC1 were also 4-fold lower in the shRNA cells
(0.22±0.07), as compared with the U251 (1.0±0.00) and shRNA(-)
(1.03±0.12) cells (Fig. 1E,
P<0.01). These data suggest that successful subclones of the
MACC1 silenced U251 cells [shRNA (MACC1)], and the negative
shRNA(-) cells were generated in the present study.
Silencing of MACC1 expression inhibits
cell proliferation and induces cell cycle arrest in U251 cells
In order to determine the effects of MACC1 silencing
on U251 cell proliferation and cycle, a colony forming assay was
used to determine the proliferation of shRNA(MACC1) cells, as
compared with the proliferation of shRNA(-) and U251 cells. As
shown in Fig. 2A, following a 14
day incubation the number of shRNA(MACC1) cell aggregates was much
lower, as compared with the shRNA(-) and U251 cells (Fig. 2A). In addition, a colony forming
efficiency assay revealed that the efficiency of the shRNA(MACC1)
cells was half that of the shRNA(-) or U251 cells (23.20±4.37, vs.
45.80±5.37% or 23.20±4.37, vs. 46.20±4.70%; P<0.01; Fig. 2A, lower panel).
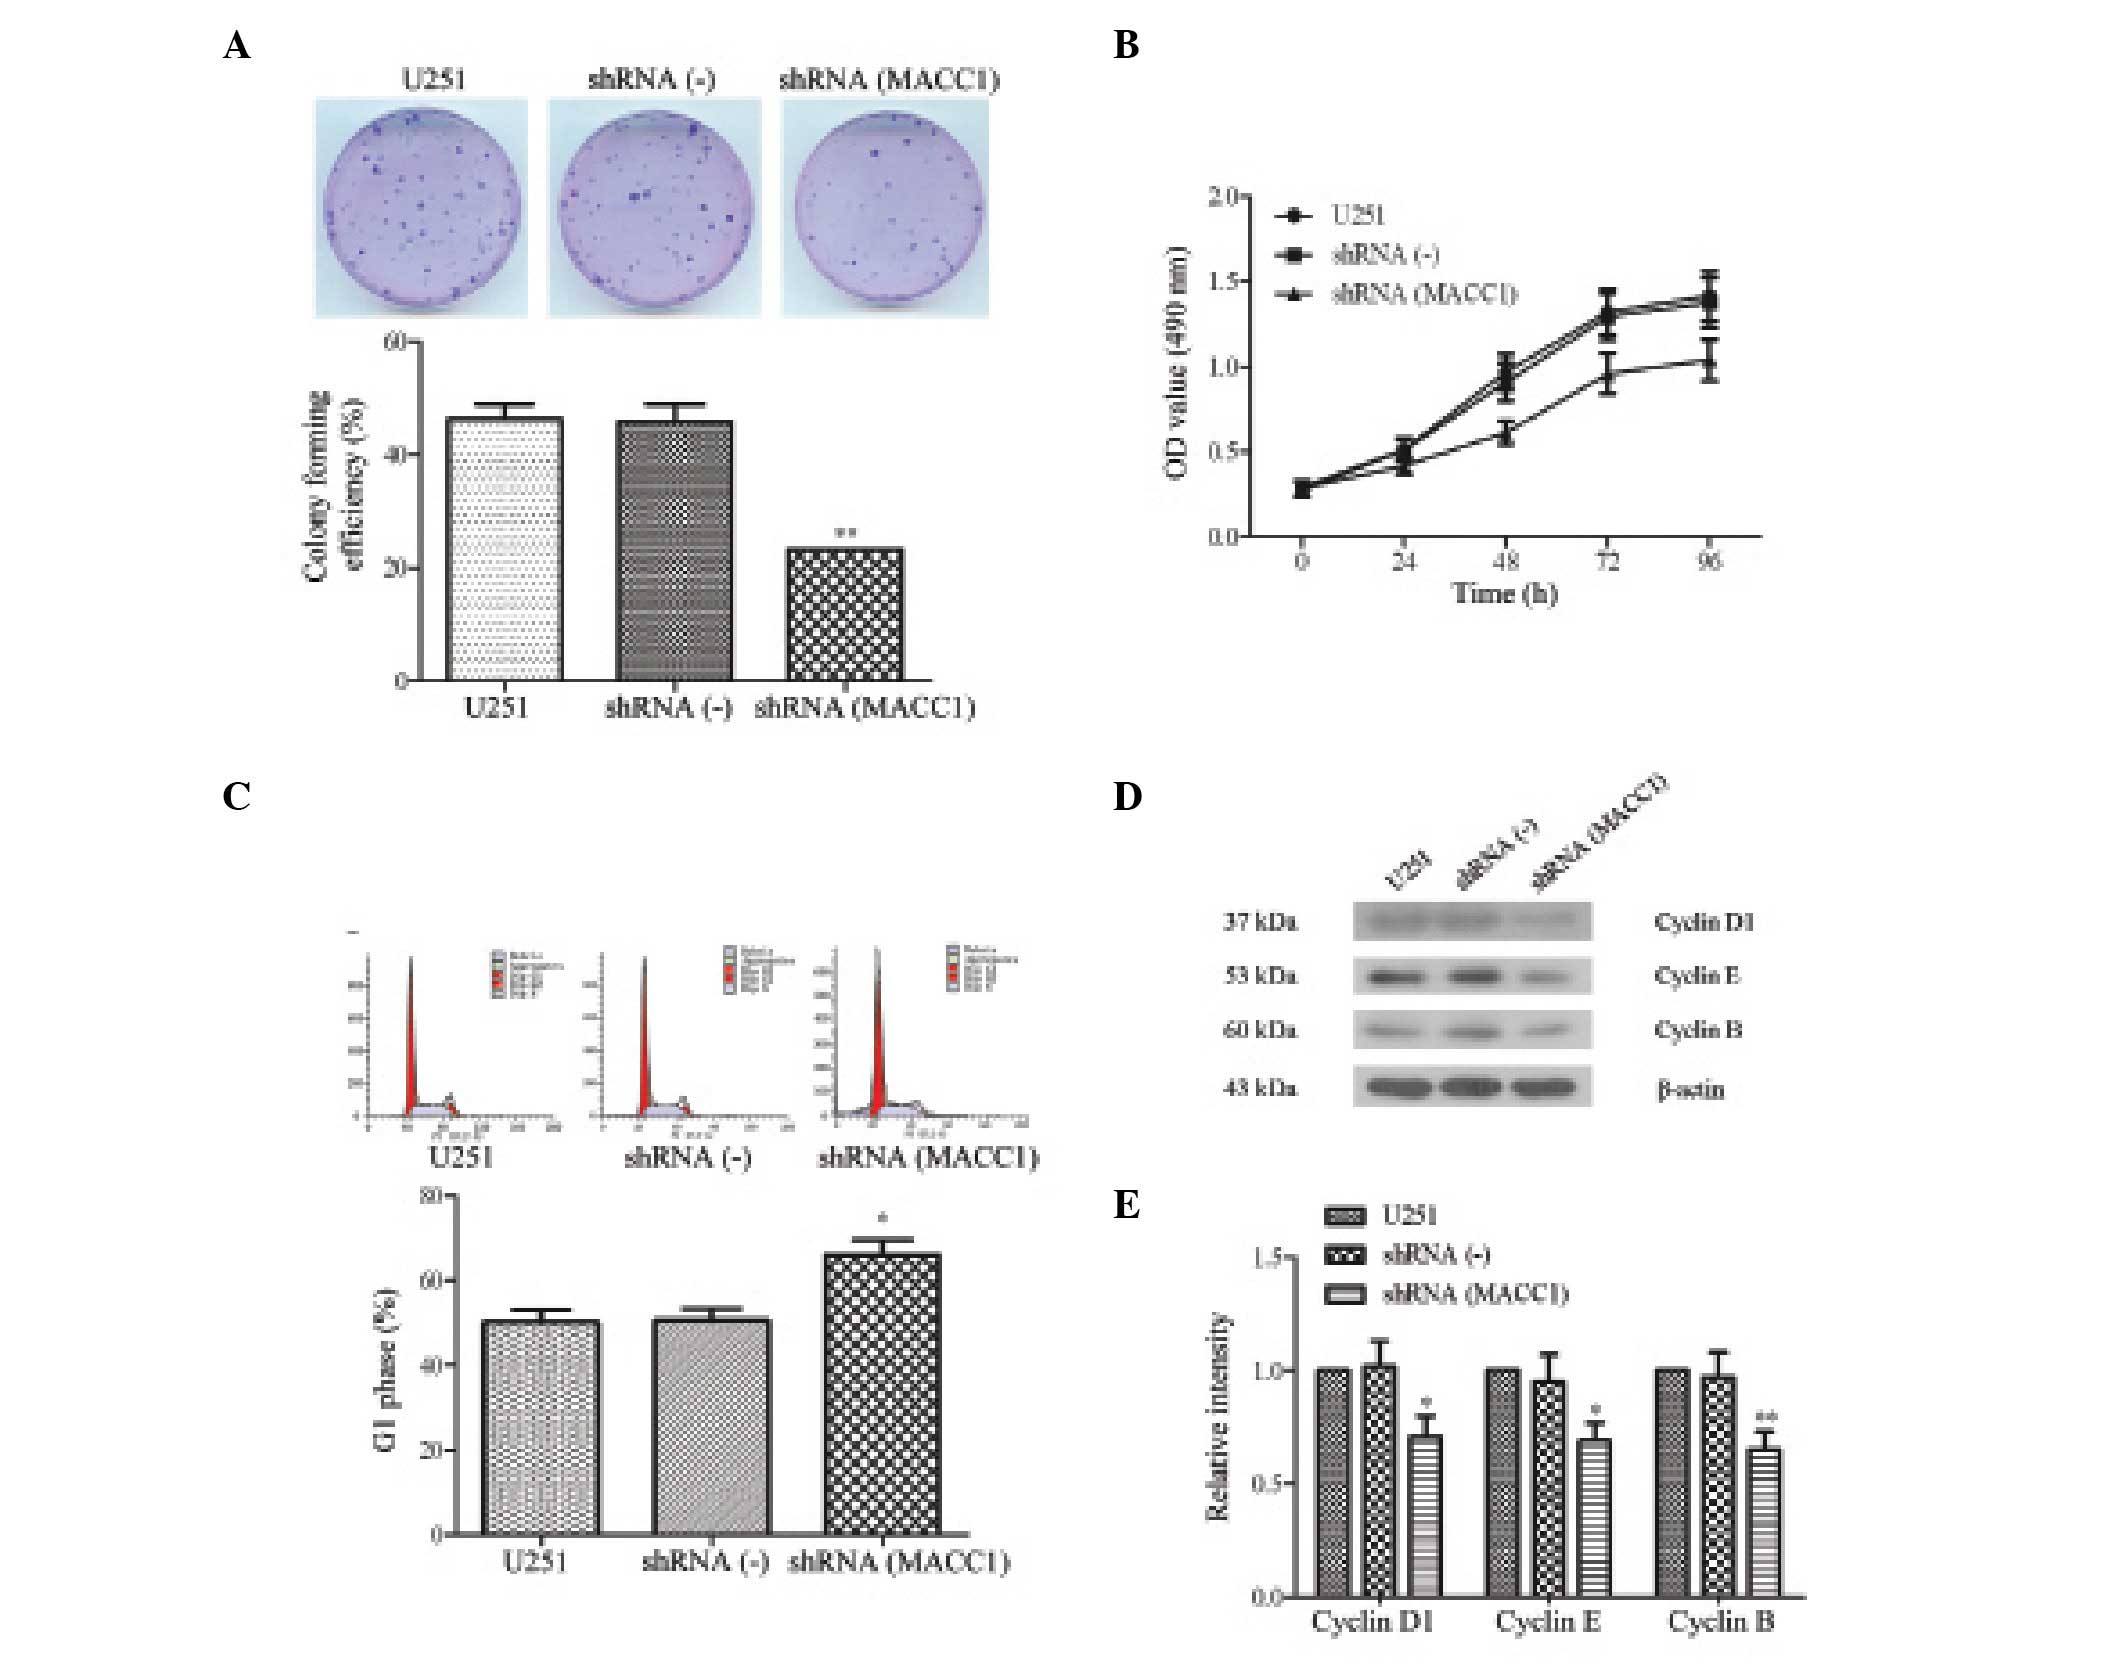 | Figure 2Silencing of metastasis associated in
colon cancer 1 (MACC1) expression inhibited cell proliferation, and
induced cell cycle arrest in U251 human glioma cells. (A) Colony
formation rate was decreased by MACC1 silencing in small hairpin
(sh)RNA(MACC1) U251 cells. (A, upper panel) The number of colonies
in the shRNA(MACC1) cells was much lower, as compared with the
number of colonies in the U251 and shRNA(-) cells. (A, lower panel)
Colony forming efficiency was calculated. **P<0.01,
vs. shRNA(-) group. (B) Suppression of cell proliferation by MACC1
shRNA in the U251 cells was measured using an MTT assay. The
proliferation of U251 cells was significantly inhibited in a
time-dependent manner following MACC1 silencing.
**P<0.01, vs. shRNA(-) group. (C) Cell cycle arrest
in the U251 cells was induced by MACC1 shRNA. Changes in the U251
cell cycle induced by MACC1 shRNA were examined using
fluorescence-activated cell sorting. (C, upper panel) There was an
increase in shRNA(MACC1) cells at G0/G1
phase; (C, lower panel) The ratio of U251, shRNA(-) and
shRNA(MACC1) cells in G0/G1 phase was
calculated. *P<0.05, vs. shRNA(-) group. (D)
Expression levels of cell cycle arrest-associated proteins cyclin
D1, cyclin E and cyclin B were examined and compared by western
blot analysis, and (E) the quantitative analysis of gray intensity
was calculated. *P<0.05, **P<0.01, vs.
shRNA(-) group. Data are presented as the mean ± standard
deviation. U251, U251 cells without RNA interference; shRNA(-),
U251 cells transfected with negative control MACC1 shRNA;
shRNA(MACC1), U251 cells transfected with silenced MACC1 shRNA. |
Furthermore, an MTT assay demonstrated that the
proliferation of the shRNA(MACC1) cells was inhibited in a
time-dependent manner, as compared with the shRNA(-) and the U251
cells (Fig. 2B). These results
suggest that the knockdown of MACC1 expression by shRNA may inhibit
the growth of U251 cells.
To investigate the signaling pathway of growth
inhibition induced by MACC1 silencing, the cell cycle was examined
using FACS analysis following PI staining in the shRNA(MACC1),
shRNA(-) and U251 cells. The results of the experiment indicated
that the G0/G1 phase ratio increased from
50.18±4.97 to 66.07±6.07% (P<0.05) in the U251 cells following
transfection with MACC1 shRNA (Fig.
2C). These results suggest that MACC1 shRNA may inhibit cell
proliferation by interfering with cell mitosis and inducing cell
cycle arrest.
To further investigate the mechanism underlying
MACC1 shRNA-induced cell cycle arrest, cell cycle-associated
proteins: Cyclin D1, cyclin E and cyclin B, were analyzed using
western blotting. The results demonstrated that the protein
expression levels of cyclin D1, cyclin E and cyclin B were
downregulated in the shRNA(MACC1) cells as compared with the
shRNA(-)or U251 cells (Fig. 2D).
No marked difference existed between the shRNA(-) and the U251
cells. The quantitative value of gray intensity of cyclin D1,
cyclin E and cyclin B, between the shRNA(MACC1) and the shRNA(-)
cells was determined to be 0.71±0.09, vs. 1.02±0.11, 0.69±0.08, vs.
0.95±0.12, and 0.65±0.08, vs. 0.97±0.11, respectively (P<0.05
and P<0.01, Fig. 2E). These
results indicate that MACC1 shRNA was able to inhibit cell
proliferation by inducing cell cycle arrest, and by downregulating
cyclin D1, cyclin E and cyclin B expression.
MACC1 silencing induces apoptosis in U251
cells
The present study evaluated the correlation between
MACC1 silencing and apoptosis in U251 cells. The number of
apoptotic cells was determined by morphologic observation following
Hoechst staining, and the morphological changes were observed by
fluorescence microscopy. The results indicated that apoptosis
occurred in the shRNA(MACC1) cells following a 24 h incubation
(Fig. 3A). Subsequently, the
apoptotic cells were quantified by FACS analysis, using the Annexin
V-FITC Apoptosis Detection kit (Fig.
3B). The apoptotic index of the shRNA(MACC1) cells
(23.90±2.64%) was markedly higher as compared with the shRNA(-)
cells (6.31±0.88%) and the U251 (5.84±0.81%) cells (P<0.01,
Fig. 3B). These results indicate
that MACC1 shRNA was able to induce apoptosis in U251 cells.
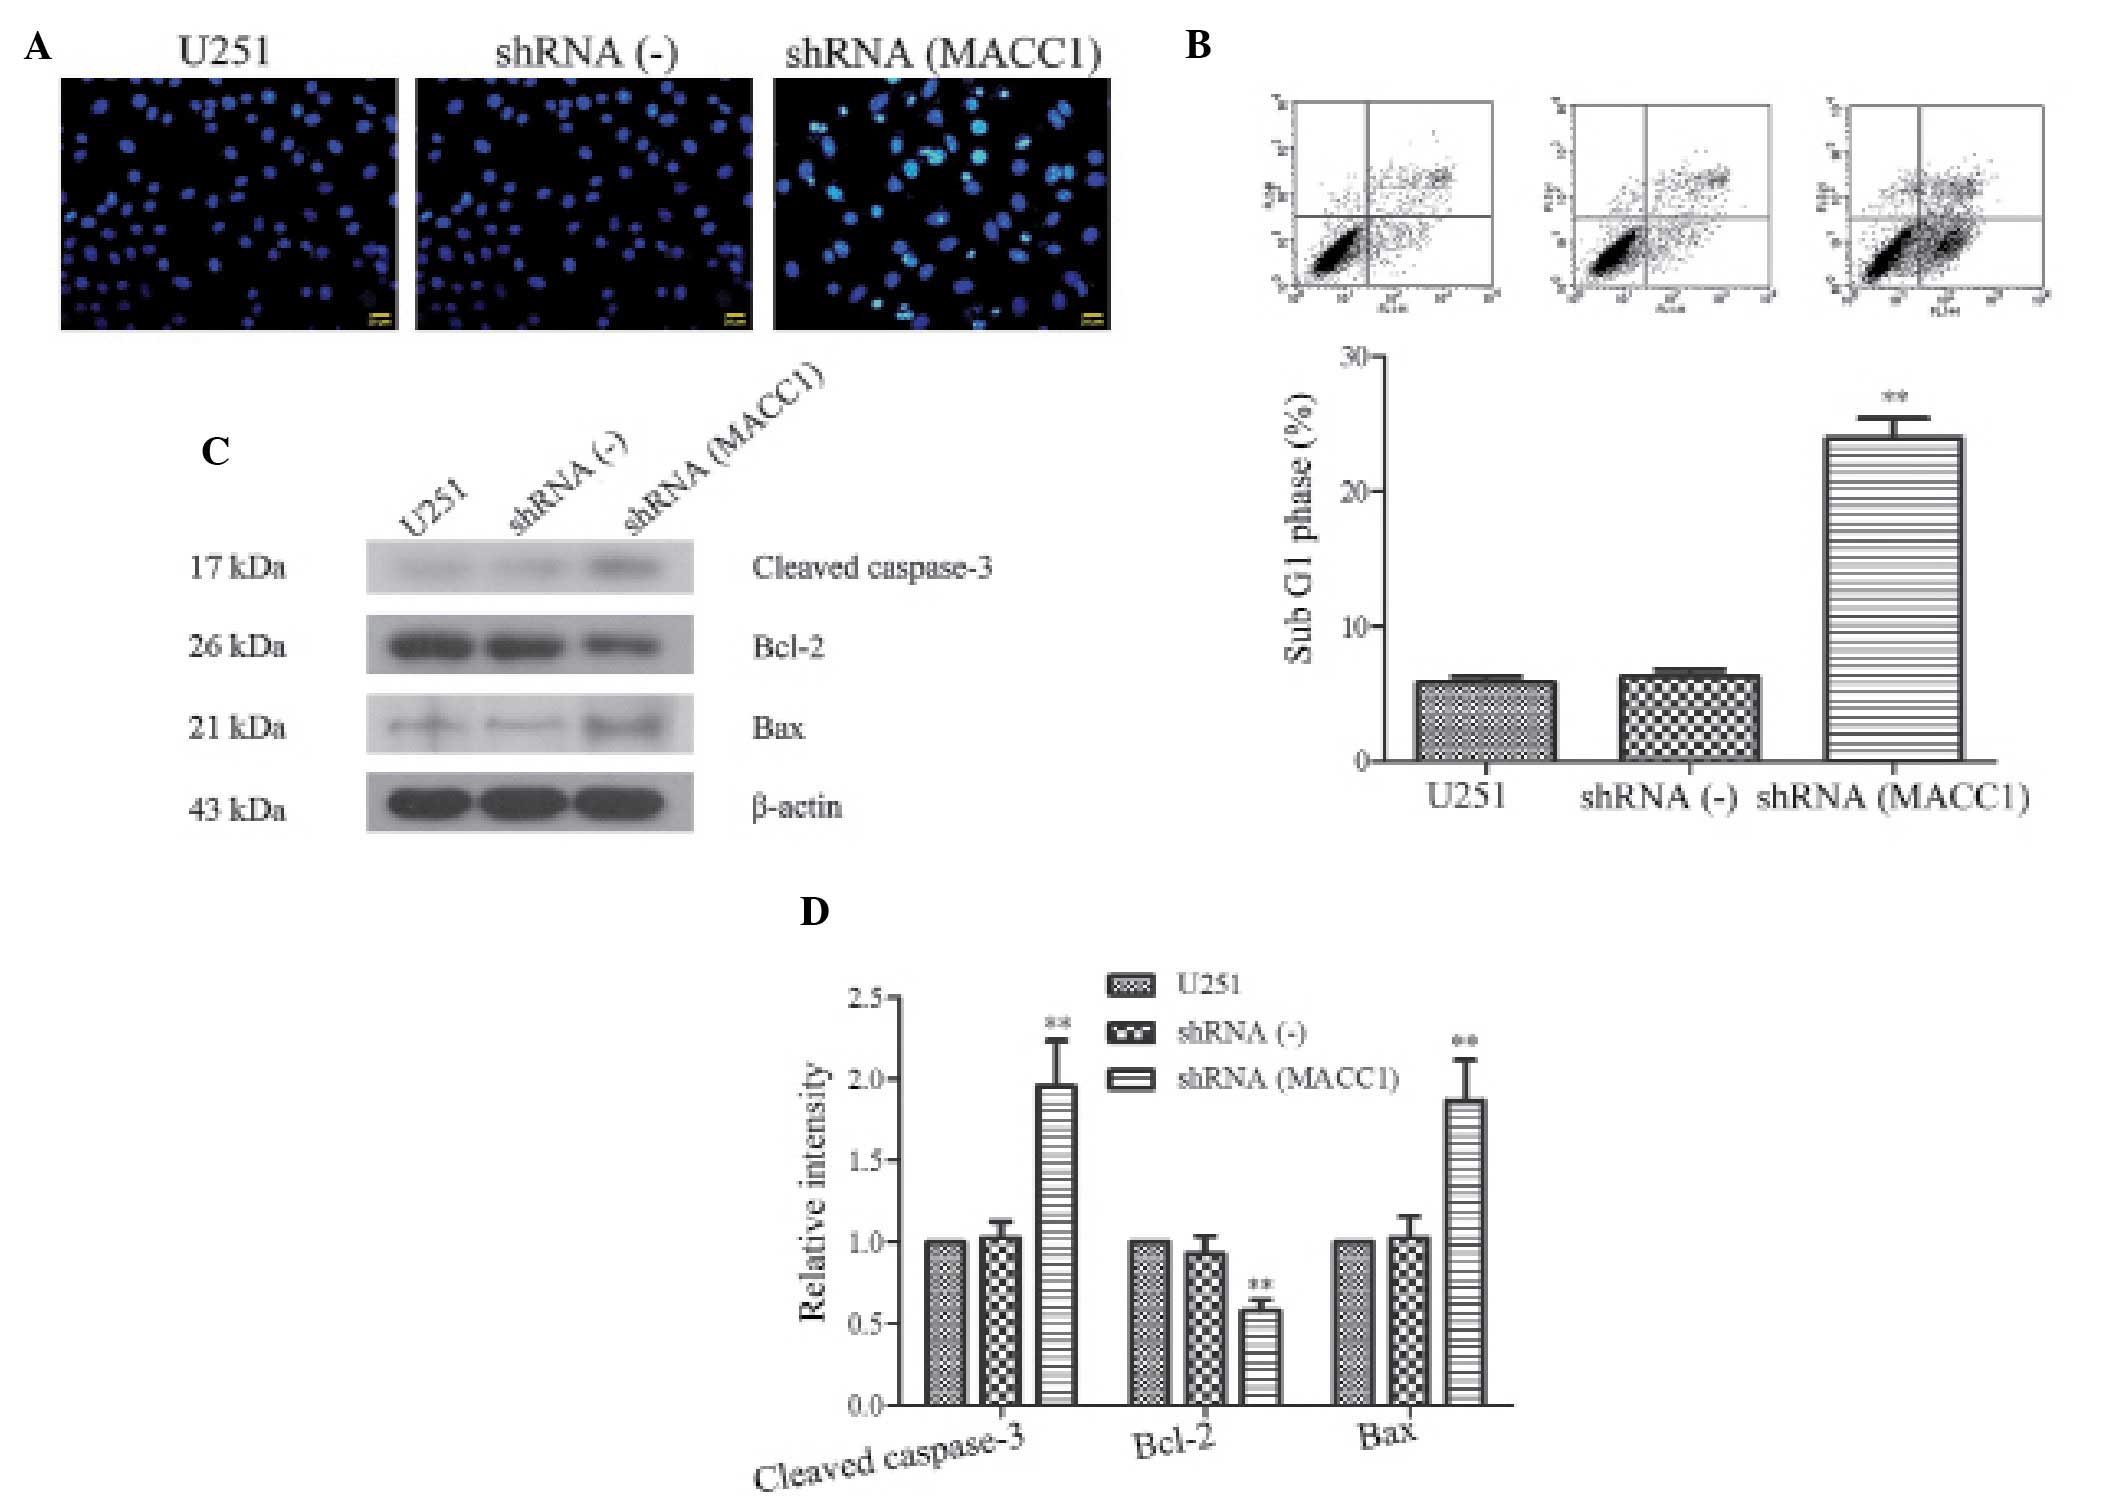 | Figure 3Silencing of metastasis associated in
colon cancer 1 (MACC1) expression induced apoptosis in U251 human
glioma cells. (A) Apoptosis was induced by transfection with MACC1
small hairpin (sh)RNA. The apoptotic shRNA(MACC1) cells were
observed using Hoechst staining following 24 h incubation (scale
bar=20 µm). (B) The number of apoptotic cells was determined
by fluorescence activated cell sorting following staining with
Annexin V-fluorescein isothiocyanate. (B, upper panel) Apoptotic
cells were more numerous in the shRNA(MACC1) cells, as compared
with the U251 and shRNA(-) cells, and (B, lower panel) the
apoptotic index was calculated. **P<0.01, vs.
shRNA(-) group. (C) The expression levels of apoptosis-associated
proteins. The expression levels of cleaved caspase-3, B cell
lymphoma 2 (Bcl-2), and Bcl-2 associated X protein (Bax) in the
U251, shRNA(-) and shRNA(MACC1) cells were examined using western
blot analysis; (D) the quantitative analysis of gray intensity was
calculated. **P<0.01, vs. shRNA (-) group. Data are
presented as the mean ± standard deviation. U251, U251 cells
without RNA inteference; shRNA(-), U251 cells transfected with
negative control MACC1 shRNA; shRNA(MACC1), U251 cells transfected
with silenced MACC1 shRNA. |
In order to determine the underlying mechanisms of
MACC1 shRNA-induced apoptosis, the levels of apoptosis-associated
proteins were detected in the U251, shRNA(-) and shRNA(MACC1) cells
by western blot analysis. The detection of high expression levels
of cleaved caspase-3 suggested the existence of a caspase-mediated
pathway that may lead to apoptosis. Apoptotic pathway activation is
regulated by the balance between pro-survival proteins, such as
Bcl-2, and pro-apoptotic proteins, such as Bax. Therefore, the
protein expression levels of Bcl-2 and Bax were investigated in the
three cell lines. The results demonstrated that the levels of the
anti-apoptotic protein Bcl-2 were downregulated in the shRNA(MACC1)
cells, whereas the levels of pro-apoptotic protein Bax were
upregulated (Fig. 3C). There were
no marked differences between the shRNA(-) and U251 cells. The
quantitative value of gray intensity of cleaved caspase-3, Bcl-2,
and Bax, between the shRNA(MACC1) and shRNA(-) cells was determined
as 1.96±0.28, vs. 1.03±0.10, 0.58±0.07, vs. 0.93±0.11, and
1.87±0.25, vs. 1.03±0.13, respectively (P<0.01; Fig. 3D). These results suggest that the
upregulation of Bax and the downregulation of Bcl-2 are responsible
for activation of the apoptotic pathway, following RNAi-mediated
silencing of MACC1 expression.
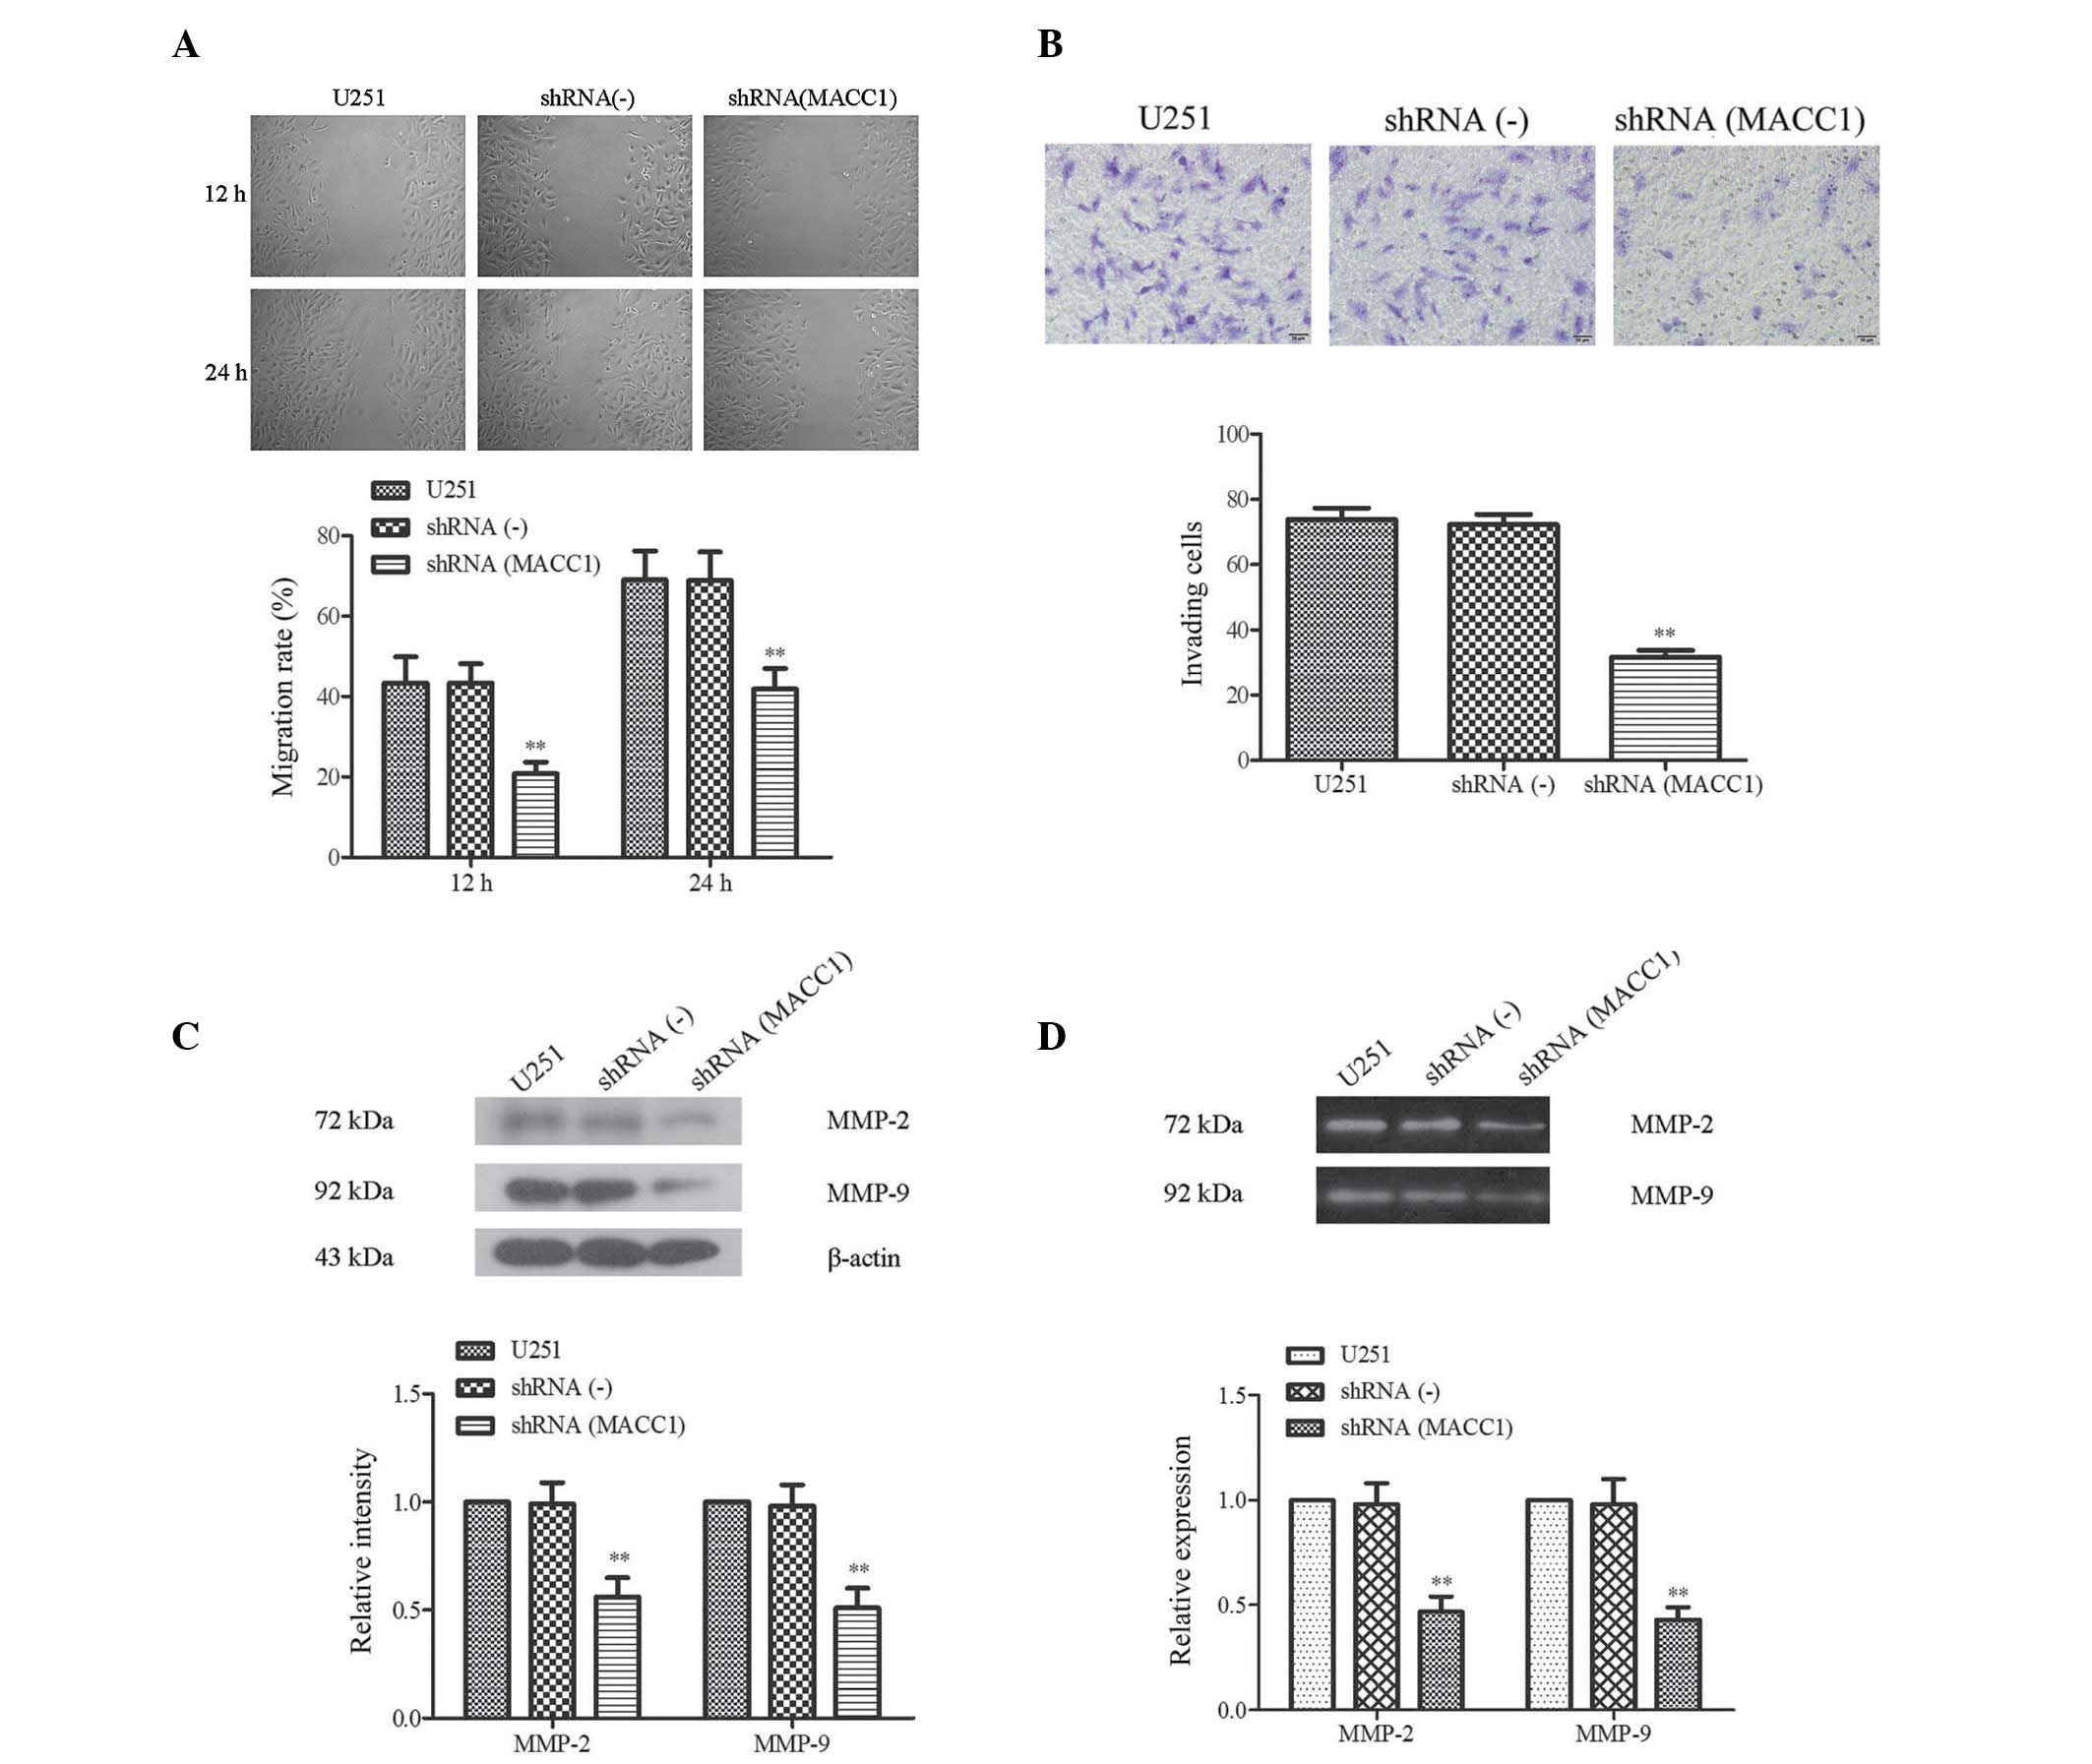
MACC1 shRNA suppresses the invasion and
migration of U251 cells
The results of the present study demonstrated that
the suppression of cell invasion and migration was induced by MACC1
shRNA. In addition, a previous study reported that the expression
of MACC1 is associated with the invasion and metastasis of various
human cancers (17). Therefore, in
order to determine whether MACC1 was necessary for cell migration,
a wound healing assay was conducted to examine the migratory
ability of the U251 cells following MACC1 silencing. The cells
transfected with MACC1 shRNA exhibited decreased migratory ability
following a 12–24 h incubation period (Fig. 4A). Notably, the distance of
shRNA(MACC1) cell migration was markedly decreased. There were no
marked differences between the shRNA(-) and U251 cells. The
migration rate of the shRNA(MACC1) cells, vs. the shRNA(-) cells
was determined to be 20.83±2.88%, vs. 43.37±7.44% for 12 h, and
41.93±5.12%, vs. 68.8±7.15% for 24 h, respectively (P<0.01;
Fig. 4A).
 | Figure 4Suppression of cell invasion and
migration induced by metastasis associated in colon cancer 1
(MACC1) short hairpin (sh)RNA. (A) Wound healing assay was
conducted after silencing of MACC1 expression. (A, upper panel;
scale bar=200 µm) Migration rate was significantly inhibited
in the shRNA(MACC1) cells, as determined by a wound healing assay,
and (A, lower panel) the migration rate was quantified.
**P<0.01, vs. shRNA(-) group. (B, upper panel; scale
bar=100 µm) Transwell assay following silencing of MACC1
expression (B, lower panel) and the comparison of invasion capacity
in the U251, shRNA(-) and shRNA(MACC1) cells.
**P<0.01, vs. shRNA(-) group. (C) Expression levels
of invasion and migration-associated proteins. (C, upper panel)
Protein expression levels of matrix metalloproteinase (MMP)-2 and
MMP-9 in the U251, shRNA(-), and shRNA(MACC1) cells were tested and
compared by western blot analysis; (C, lower panel) the
quantitative analysis of gray intensity was calculated.
**P<0.01, vs. shRNA (-) group. (D) The activities of
MMP-2 and MMP-9 were decreased by MACC1 shRNA. (D, upper panel) The
activities of MMP-2 and MMP-9 were tested by gelatin zymography
assay; and (D, lower panel) the relative activities of MMP-2 and
MMP-9 were calculated. **P<0.01, vs. shRNA(-) group.
Data are presented as the mean ± standard deviation. U251, U251
cells without RNA interference; shRNA(-), U251 cells transfected
with negative control MACC1 shRNA; shRNA(MACC1), U251 cells
transfected with silenced MACC1 shRNA. |
A transwell assay was used to investigate the
suppression of invasion by MACC1 shRNA. As compared with the
control group, the shRNA(MACC1) cells demonstrated a suppressed
capacity for invasion (Fig. 4B).
Furthermore, the number of cells adhering to the lower membranes of
the transwell chamber was markedly decreased in the shRNA(MACC1)
group, which exhibited half the invasive capacity of the shRNA(-)
and U251 groups (31.60±4.77, vs. 72.20±7.33 and 31.60±477, vs.
73.80±799, P<0.05) (Fig. 4B).
These results suggest that MACC1 RNAi may suppress invasion and
migration of malignant glioma cells.
Increased MMP-2 and MMP-9 activity levels are
considered an important mechanism for the increased capacity of
cancer cells to traverse the membrane, mimicking invasion and
metastasis (18). Therefore, the
present study analyzed the effects of MACC1 shRNA on the expression
levels of MMP-2 and MMP-9 in the shRNA(MACC1), shRNA(-) and U251
cells using a western blot analysis. As shown in Fig. 4C, the expression levels of MMP-2
and MMP-9 were significantly decreased in the shRNA(MACC1) cells. A
quantitative value of gray intensity analysis demonstrated that the
gray intensity value of MMP-2/-9 in the shRNA(MACC1) cells was only
half that of the shRNA(-) cells (P<0.01, Fig. 4C). In addition, the MMP-2 and MMP-9
activity levels were examined using a gelatin zymography assay. The
results of the assay demonstrated that the enzymatic activities of
MMP-2 and MMP-9 were inhibited in the shRNA(MACC1) group (Fig. 4D, upper panel). Further
quantification analysis indicated that the MMP-2 and MMP-9 activity
levels were reduced to 0.47±0.07, and 0.43±0.06 as compared with
the shRNA(-) group where their activity levels were determined as
0.98±0.01, and 0.98±0.12, respectively (P<0.01; Fig. 4D, lower panel). These results
indicate that MACC1 shRNA was able to markedly inhibit the activity
of MMP-2 and MMP-9.
Discussion
Numerous studies have previously shown that MACC1 is
abnormally expressed in various human malignances, and that it acts
as a metastatic pacemaker in colorectal, gastric and various other
cancer cells (11,19,20).
Chai et al (16)
demonstrated that in HeLa cervical cancer cells, the downregulation
of MACC1 resulted in the inhibition of cell proliferation,
migration and invasion, and the enhancement of apoptosis.
Furthermore, Meng et al (21) reported that MACC1 has an important
role in the carcinogenesis of nasopharyngeal carcinoma cells
through the activation of the Akt/β-catenin signaling pathway.
However, the role of MACC1 in glioma cancer initiation and
progression remains to be elucidated. In the present study, the
expression levels of MACC1 were compared in various types of glioma
cells. In addition, a MACC1-specific shRNA was designed and
synthesized in order to investigate the effects of MACC1 inhibition
on malignant glioma U251 cells. Following the stable transfection
of the MACC1 shRNA into U251 cells, RT-qPCR and western blotting
revealed that the MACC1 shRNA could effectively inhibit the
expression of MACC1 in shRNA(MACC1) cells. As a consequence of the
MACC1 knockdown, U251 cell proliferation, migration and invasion
were markedly inhibited, whereas cellular apoptosis was markedly
increased. The effects of MACC1 shRNA on cell proliferation
inhibition were associated with a downregulation of cyclin D1 and
cyclin E; in addition, the observed increase in apoptosis was
controlled by the upregulation of cleaved caspase-3 and Bax
expression, and the downregulation of Bcl-2 expression. Cell
invasion and migration was shown to be suppressed and regulated by
the inhibition of MMP-2/-9 activity and expression. These results
suggested that inhibition of MACC1 may suppress the growth and
metastatic potential of malignant glioma cells, which in turn
suggests that MACC1 may be involved in the proliferation, cell
cycle arrest, apoptosis, invasion and migration of malignant glioma
cells.
Cyclins are positive regulators of cell cycle
progression in the cell cycle pathway (22); notably, cyclin E and cyclin D1 are
the primary regulators of late G1 phase, and contribute
to G1 phase progression (23) and chromosomal instability (24). It is likely that the cyclins are
also involved in tumor initiation and proliferation. A recent study
reported that both cyclin E and cyclin D1 may have a key
role in promoting the growth of glioma cells, as well as their
transformation into malignant cells (25). In addition, Zhang et al
(10) demonstrated that MACC1
shRNA induced G0/G1 phase cell cycle arrest
through cyclin D1 in OVCAR-3 ovarian carcinoma cells. Notably, in
the present study, the expression levels of cyclin D1
and cyclin E were shown to be downregulated following inhibition of
MACC1. Furthermore, the expression levels of cyclin B, which
regulates the cell-cycle progression of G2/M phase
(26), were also downregulated in
the shRNA(MACC1) cells. Cell cycle assays using FACS demonstrated
that MACC1 shRNA induced U251 cell cycle arrest at G1
phase, but not at G2/M phase. These results account for
the fact that the main regulatory targets of MACC1 in U251 cells
were cyclin D1 and cyclin E, rather than cyclin B. MACC1
may have either a direct or indirect effect on cyclin D1
and cyclin E in order to arrest the cell cycle at the G1
phase. Although cyclin B was downregulated by MACC1 shRNA, this
alone is not sufficient to arrest the cell cycle at G2/M
phase.
Apoptosis is mediated through a caspase cascade
(27), and the ability of cells to
undergo apoptosis is determined by the interaction between
pro-survival proteins, such as Bcl-2, and pro-apoptotic proteins,
such as Bax (28). Numerous
studies have also demonstrated that Bcl-2 overexpression is
associated with resistance to conventional radiation and
chemotherapeutic agents in the majority of tumor cells, including
malignant glioma cells (29–31).
This is achieved as Bcl-2 binds to Bax, inhibiting Bax activation
(32). In the present study, the
expression levels of both cleaved caspase-3 and Bax were shown to
be upregulated following MACC1 silencing in U251 cells. Conversely,
the expression levels of Bcl-2 were downregulated; thus suggesting
that MACC1 shRNA targets Bcl-2 in order to suppress the inhibition
of Bax by promoting the release of pro-apoptotic Bax from a
Bax/Bcl-2 heterodimeric complex. The released Bax promotes the
formation of outer-mitochondrial membrane spanning pores, which
triggers the activation of the caspase cascade orchestrated by
caspase-3, ultimately inducing apoptosis (33). However, the precise mechanisms by
which the knockdown of MACC1 causes cancer cell cycle arrest and
apoptosis requires further elucidation.
In addition to controlling the important events of
cell proliferation and apoptosis, MACC1 is also involved in tumor
cell invasion and metastasis (34). Increased MMP activity has been
detected in virtually every type of human cancer, and correlates
with advanced stage, invasive and metastatic properties, and poor
general prognosis (35). In the
present study, the properties of invasion and metastasis were
examined using wound healing and transwell assays in the
shRNA(MACC1) and shRNA(-) U251 cells. The results demonstrated that
the capacity for migration and invasion were markedly decreased in
the shRNA(MACC1) cells. In addition, western blotting revealed that
the expression levels of MMP-2 and MMP-9 were downregulated.
Consistent with these findings, the enzymatic activities of MMP-2
and MMP-9 were inhibited in the shRNA(MACC1) group, as determined
by the gelatin zymography assay. The results of the present study
suggested that MACC1 is involved in MMP-2/-9-mediated invasion and
metastasis. The inhibition of MACC1 expression suppressed the
activity of MMP-2 as well as MMP-9, leading to a decreased capacity
for invasion and metastasis in malignant glioma cells (35). Furthermore, numerous studies have
suggested that MACC1 induces tumor metastasis through the
regulation of the hepatocyte growth factor (HGF)/MET signaling
pathway (12,36,37).
In addition, the MET gene encoding the HGF receptor is a
transcriptional target of MACC1 (19). It therefore appears plausible that
the downregulation of MMP-2 and MMP-9 by MACC1 shRNA may be also be
mediated via the HGF/MET signaling pathway. However, this
assumption requires further investigation.
In conclusion, the results of the present study
demonstrated that human glioblastomas exhibit increased expression
of MACC1. The silencing of MACC1 by shRNA significantly inhibited
proliferation, migration and invasion, and promoted apoptosis in
U251 human glioma cells. Thus suggesting that MACC1 is a key
regulator of these upstream signaling pathways, and may be a
potential therapeutic target for malignant gliomas.
References
|
1
|
Demuth T and Berens ME: Molecular
mechanisms of glioma cell migration and invasion. J Neurooncol.
70:217–228. 2004. View Article : Google Scholar
|
|
2
|
Omuro A and DeAngelis LM: Glioblastoma and
other malignant gliomas: A clinical review. JAMA. 310:1842–1850.
2013. View Article : Google Scholar : PubMed/NCBI
|
|
3
|
Kohler BA, Ward E, McCarthy BJ, et al:
Annual report to the nation on the status of cancer, 1975–2007,
featuring tumors of the brain and other nervous system. J Natl
Cancer Inst. 103:714–736. 2011. View Article : Google Scholar : PubMed/NCBI
|
|
4
|
Crocetti E, Trama A, Stiller C, et al:
RARECARE working group: Epidemiology of glial and non-glial brain
tumours in Europe. Eur J Cancer. 48:1532–1542. 2012. View Article : Google Scholar : PubMed/NCBI
|
|
5
|
Stupp R, Mason WP, van den Bent MJ, et al
European Organisation for Research and Treatment of Cancer Brain
Tumour and Radiotherapy Groups: National Cancer Institute of Canada
Clinical Trials Group: Radiotherapy plus concomitant and adjuvant
temozolomide for glioblastoma. N Engl J Med. 352:987–996. 2005.
View Article : Google Scholar : PubMed/NCBI
|
|
6
|
Stein U, Walther W, Arlt F, et al: MACC1,
a newly identified key regulator of HGF-MET signaling, predicts
colon cancer metastasis. Nat Med. 15:59–67. 2009. View Article : Google Scholar
|
|
7
|
Chundong G, Uramoto H, Onitsuka T, et al:
Molecular diagnosis of MACC1 status in lung adenocarcinoma by
immunohistochemical analysis. Anticancer Res. 31:1141–1145.
2011.PubMed/NCBI
|
|
8
|
Shimokawa H, Uramoto H, Onitsuka T, et al:
Overexpression of MACC1 mRNA in lung adenocarcinoma is associated
with postoperative recurrence. J Thorac Cardiovasc Surg.
141:895–898. 2011. View Article : Google Scholar
|
|
9
|
Shirahata A, Fan W, Sakuraba K, et al:
MACC 1 as a marker for vascular invasive hepatocellular carcinoma.
Anticancer Res. 31:777–780. 2011.PubMed/NCBI
|
|
10
|
Zhang R, Shi H, Chen Z, Wu Q, Ren F and
Huang H: Effects of metastasis-associated in colon cancer 1
inhibition by small hairpin RNA on ovarian carcinoma OVCAR-3 cells.
J Exp Clin Cancer Res. 30:832011. View Article : Google Scholar : PubMed/NCBI
|
|
11
|
Shirahata A, Sakata M, Kitamura Y, et al:
MACC 1 as a marker for peritoneal-disseminated gastric carcinoma.
Anticancer Res. 30:3441–3444. 2010.PubMed/NCBI
|
|
12
|
Stein U, Smith J, Walther W and Arlt F:
MACC1 controls Met: What a difference an Sp1 site makes. Cell
Cycle. 8:2467–2469. 2009. View Article : Google Scholar : PubMed/NCBI
|
|
13
|
Sheng XJ, Li Z, Sun M, et al: MACC1
induces metastasis in ovarian carcinoma by upregulating hepatocyte
growth factor receptor c-MET. Oncol Lett. 8:891–897.
2014.PubMed/NCBI
|
|
14
|
Yang T, Kong B, Kuang YQ, et al:
Overexpression of MACC1 protein and its clinical implications in
patients with glioma. Tumour Biol. 35:815–819. 2014. View Article : Google Scholar
|
|
15
|
Hagemann C, Fuchs S, Monoranu CM, et al:
Impact of MACC1 on human malignant glioma progression and patients'
unfavorable prognosis. Neuro Oncol. 15:1696–1709. 2013. View Article : Google Scholar : PubMed/NCBI
|
|
16
|
Chai H and Yang Y: Effects of MACC1 siRNA
on biological behaviors of HeLa. Arch Gynecol Obstet.
289:1271–1280. 2014. View Article : Google Scholar
|
|
17
|
Gao J, Ding F, Liu Q and Yao Y: Knockdown
of MACC1 expression suppressed hepatocellular carcinoma cell
migration and invasion and inhibited expression of MMP2 and MMP9.
Mol Cell Biochem. 376:21–32. 2013. View Article : Google Scholar
|
|
18
|
Chen D, Wang Y, Zhang K, Jiao X, Yan B and
Liang J: Antisense oligonucleotide against clusterin regulates
human hepatocellular carcinoma invasion through transcriptional
regulation of matrix metalloproteinase-2 and e-cadherin. Int J Mol
Sci. 13:10594–10607. 2012. View Article : Google Scholar : PubMed/NCBI
|
|
19
|
Arlt F and Stein U: Colon cancer
metastasis: MACC1 and Met as metastatic pacemakers. Int J Biochem
Cell Biol. 41:2356–2359. 2009. View Article : Google Scholar : PubMed/NCBI
|
|
20
|
Shirahata A, Shinmura K, Kitamura Y, et
al: MACC1 as a marker for advanced colorectal carcinoma. Anticancer
Res. 30:2689–2692. 2010.PubMed/NCBI
|
|
21
|
Meng F, Li H, Shi H, et al: MACC1
down-regulation inhibits proliferation and tumourigenicity of
nasopharyngeal carcinoma cells through Akt/β-catenin signaling
pathway. PloS One. 8:e608212013. View Article : Google Scholar
|
|
22
|
Hunt T: Maturation promoting factor,
cyclin and the control of M-phase. Curr Opin Cell Biol. 1:268–274.
1989. View Article : Google Scholar : PubMed/NCBI
|
|
23
|
Resnitzky D and Reed SI: Different roles
for cyclins D1 and E in regulation of the G1-to-S transition.
Molecular and Cellular Biol. 15:3463–3469. 1995.
|
|
24
|
Spruck CH, Won KA and Reed SI: Deregulated
cyclin E induces chromosome instability. Nature. 401:297–300. 1999.
View Article : Google Scholar : PubMed/NCBI
|
|
25
|
Velpula KK, Dasari VR, Tsung AJ, et al:
Regulation of glioblastoma progression by cord blood stem cells is
mediated by downregulation of cyclin D1. PloS One. 6:e180172011.
View Article : Google Scholar : PubMed/NCBI
|
|
26
|
Wang Z, Fan M, Candas D, et al: Cyclin
B1/Cdk1 coordinates mitochondrial respiration for cell-cycle G2/M
progression. Dev Cell. 29:217–232. 2014. View Article : Google Scholar : PubMed/NCBI
|
|
27
|
Adams JM: Ways of dying: Multiple pathways
to apoptosis. Genes Dev. 17:2481–2495. 2003. View Article : Google Scholar : PubMed/NCBI
|
|
28
|
Adams JM and Cory S: The Bcl-2 apoptotic
switch in cancer development and therapy. Oncogene. 26:1324–1337.
2007. View Article : Google Scholar : PubMed/NCBI
|
|
29
|
Reed JC: Drug insight: Cancer therapy
strategies based on restoration of endogenous cell death
mechanisms. Nat Clin Pract Oncol. 3:388–398. 2006. View Article : Google Scholar : PubMed/NCBI
|
|
30
|
Kouri FM, Jensen SA and Stegh AH: The role
of Bcl-2 family proteins in therapy responses of malignant
astrocytic gliomas: Bcl2L12 and beyond. ScientificWorldJournal.
2012:8389162012. View Article : Google Scholar : PubMed/NCBI
|
|
31
|
Renault TT, Teijido O, Antonsson B, Dejean
LM and Manon S: Regulation of Bax mitochondrial localization by
Bcl-2 and Bcl-x(L): Keep your friends close but your enemies
closer. Int J Biochem Cell Biol. 45:64–67. 2013. View Article : Google Scholar
|
|
32
|
Ju H, Li X, Li H, et al: Mediation of
multiple pathways regulating cell proliferation, migration, and
apoptosis in the human malignant glioma cell line U87MG via
unphosphorylated STAT1: Laboratory investigation. J Neurosurg.
118:1239–1247. PubMed/NCBI
|
|
33
|
Ley R, Ewings KE, Hadfield K and Cook SJ:
Regulatory phosphorylation of Bim: Sorting out the ERK from the
JNK. Cell Death Differ. 12:1008–1014. 2005. View Article : Google Scholar : PubMed/NCBI
|
|
34
|
Wang G, Kang MX, Lu WJ, Chen Y, Zhang B
and Wu YL: MACC1: A potential molecule associated with pancreatic
cancer metastasis and chemoresistance. Oncol Lett. 4:783–791.
2012.PubMed/NCBI
|
|
35
|
Price JT and Thompson EW: Mechanisms of
tumour invasion and metastasis: Emerging targets for therapy.
Expert J Opin Ther Targets. 6:217–233. 2002. View Article : Google Scholar
|
|
36
|
Boardman LA: Overexpression of MACC1 leads
to downstream activation of HGF/MET and potentiates metastasis and
recurrence of colorectal cancer. Genome Med. 1:362009. View Article : Google Scholar : PubMed/NCBI
|
|
37
|
Kokoszyńska K, Kryński J, Rychlewski L and
Wyrwicz LS: Unexpected domain composition of MACC1 links MET
signaling and apoptosis. Acta Biochim Pol. 56:317–323. 2009.
|


