Introduction
MicroRNAs (miRNAs) are a small (18–21 bp)
evolutionarily conserved subclass of RNA molecules that have
important roles in development, immunity, stem cell
differentiation, and cancer (1,2).
Exosomes are 40–100 nm membrane microvesicles of endocytic origin,
which are released from various cell types under both normal and
pathological conditions (3,4). To
date, exosomes have been identified in body fluids, including
urine, amniotic fluid, malignant ascites, saliva, and blood
(5–7).
Valadi et al (8) demonstrated that exosomes contain both
mRNA and miRNA. A previous study also demonstrated that
extracellular miRNA from exosomes has a role in cell-to-cell
communication in hepatocellular carcinoma (HCC) cells (9). Taylor et al (10) reported that human tumor-derived
epithelial cell adhesion molecule-positive exosomes could be
detected in the blood by targeted miRNA expression profiling.
Exosomes have been suggested as promising biomarkers of both
ovarian (10) and lung cancer
(11). These results suggested
that exosomal miRNAs may serve as biomarkers for disease. Bala
et al (12) demonstrated
that the expression levels of circulating miRNAs were significantly
upregulated in the plasma exosomes of patients with liver injuries,
suggesting that circulating miRNAs may serve as biomarkers to
differentiate between hepatocyte injury and inflammation. In
addition, Murakami et al (13) demonstrated that the miRNA
expression pattern in exosome-rich fractionated serum may serve as
a biomarker for diagnosing the grade and stage of liver
disease.
HCC is a major histological subtype of liver cancer,
which presents as an aggressive tumor with poor prognosis (14). It is critical that the diagnosis of
HCC be made at an early stage if effective therapeutic treatment is
to be carried out. In circulating exosomes, the difference between
miRNA expression levels pre- and post-resection of liver carcinoma
allows for the identification of molecular markers for the
diagnosis and predicted outcome of HCC. The first requirement for
the detection of a reliable biomarker is the accurate measurement
of the quantity of miRNA present in circulating exosomes.
Currently, the stem-loop reverse transcription-quantitative
polymerase chain reaction (RT-qPCR) is widely used to
quantitatively analyze the levels of circulating miRNAs (15). Notably, the normalization of
RT-qPCR data to stable reference genes (RGs) is critical for
accurate miRNA quantification, due to variations that are not a
direct consequence of the disease itself, including sample
procurement, stabilization, RNA extraction, and target
quantification (16). Therefore,
the identification of optimal RGs that are stably expressed
irrespective of treatment is necessary for the accurate
normalization of exosomal miRNA quantification data.
In the present study, various RGs were used to
normalize the circulating miRNA levels in patients of primary HCC
with hepatitis B infection (HBV) following surgical treatment. The
expression levels of 10 RGs were then examined, in accordance with
the available literature (16–20).
The most appropriate combination of RGs determined by each
algorithm was subsequently used to assess the expression levels of
miR-122, a known non-invasive biomarker of HCC (21). The results of the present study are
the first, to best of our knowledge, to identify a set of RGs
suitable for serum exosomal gene expression studies in liver
carcinoma resection.
Materials and methods
Ethics statement
The present study was approved by the Medical Ethics
Committee of the Second Affiliated Hospital of the Third Military
Medical University (Chongqing, China), in accordance with the
Helsinki Declaration. All patients provided written informed
consent.
Serum preparation
Pre- and post-operative blood samples from patients
with HCC were donated by the Second Affiliated Hospital of the
Third Military Medical University (Table I). A tissue biopsy was performed
prior to blood donation in order to diagnose HCC. All patients
underwent complete resection without major morbidity or
mortality.
 | Table IDemographic and clinical features of
patients used for microRNA expression analysis. |
Table I
Demographic and clinical features of
patients used for microRNA expression analysis.
| Variable | Paired sample set 1
(n=33)
| P-value | Paired sample set 2
(n=20)
| P-value |
|---|
| Pre-operative
patients | Post-operative
patients | Pre-operative
patients | Post-operative
patients |
|---|
| Average age (mean ±
SD) | 47.7±11.6 | | | 46.1±12.1 | | 0.675a |
| Age (years), n
(%) | | | | | | 0.966b |
| <40 | 6 (18.2) | | | 4 (20.0) | | |
| 40–60 | 21 (63.6) | | | 12 (60.0) | | |
| >60 | 6 (18.2) | | | 4 (20.0) | | |
| Gender, n (%) | | | | | | 0.871b |
| Male | 31 (93.9) | | | 19 (95.0) | | |
| Female | 2 (6.1) | | | 1 (5.0) | | |
| Tumor number, n
(%) | | | | | | 0.723b |
| Single | 23 (69.7) | | | 13 (65.0) | | |
| Multiple | 10 (30.3) | | | 7 (35.0) | | |
| Tumor grade, n
(%)* | | | | | | 0.805b |
| I and II | 16 (48.5) | | | 9 (45.0) | | |
| III and IV | 17 (51.5) | | | 11 (55.0) | | |
| Average ALT (mean ±
SD) | 55.0±55.7 | 110.7±86.6 | 0.008c | 60.9±51.8 | 108.1±85.0 | 0.072c |
| ALT (U/l), n
(%) | | | 0.001b | | | 0.027b |
| <40 | 16 (48.5) | 4 (12.1) | | 8 (40.0) | 2 (10.0) | |
| 40–100 | 14 (42.4) | 17 (51.5) | | 10 (50.0) | 10 (50.0) | |
| ≥100 | 3 (9.1) | 12 (36.4) | | 2 (10.0) | 8 (40.0) | |
The peripheral blood samples were collected in 5 ml
Vacutainer SST Plus Blood Collection Tubes (BD Biosciences,
Franklin Lakes, NJ, USA). The samples were incubated at room
temperature between 30 min and 2 h. The tubes containing the
samples were subsequently centrifuged at 1,500 × g for 10 min, and
the sera were aliquoted and centrifuged again at 2,000 × g, in
order to completely remove any remaining cells. The sera were
stored at -80°C until further processing for exosome isolation.
Exosome preparation
A total of 250 µl serum was mixed with 66
µl ExoQuick Exosome Precipitation Solution (SBI System
Biosciences, Mountain View, CA, USA). The exosome isolation was
performed in accordance with the manufacturer's instructions.
Briefly, the samples were incubated at 4°C for 30 min, followed by
centrifugation at 17,760 × g for 2 min. The protein-rich
supernatant was then removed, and the exosome-rich pellet was
retained for RNA extraction, electron microscopy and western blot
analysis.
Transmission electron microscopy
Electron microscopy was performed on the serum
exosome samples at the Biomedical Analysis Center, Third Military
Medical University. The samples were prepared as described by Théry
et al (22). Briefly, the
exosomal fraction was mixed 1:1 with 4% paraformalde-hyde in
phosphate-buffered saline (PBS). The solution was subsequently
placed onto formvar-carbon coated copper grids (Beijing
Zhongjingkeyi Technology Co., Ltd., Beijing, China), and left to
dry at room temperature for 20 min. Following washing, the grids
were fixed with 1% w/v glutaraldehyde in PBS, prior to being washed
numerous times with distilled water. The samples were then
contrasted using 4% w/v uranyl acetate and UA-Methylcellulose mix
solution for 10 min on ice (22).
The grid was dried at room temperature, and observed using a Tecnai
10 transmission electron microscope (FEI, Eindhoven, The
Netherlands).
Western blot analysis
The exosome-rich pellet was resuspended in 1X
radioimmunoprecipitation assay buffer (Beyotime Institute of
Biotechnology, Shanghai, China), and protein concentration was
quantified using a Bicinchoninic Acid assay (Beyotime Institute of
Biotechnology, according to the manufacturer's instructions. The
proteins (5 mg) were denatured by boiling in Laemmli sample buffer
and separated by 12% SDS-PAGE, prior to being transferred onto a
polyvinylidene fluoride membrane (Merck Millipore, Billerica, MA,
USA). The blotting membrane was blocked with bovine serum albumin
(Sigma-Aldrich, St. Louis, MO, USA) and incubated with CD63 and CD9
antibodies (1:1,000 dilution; cat. no. EXOAB-KIT-1; SBI System
Biosciences) for 1 h at room temperature, followed by incubation
with goat anti-rabbit horseradish peroxidase-conjugated secondary
antibody (1:20,000 dilution; cat. no. EXOAB-KIT-1; SBI System
Biosciences) for 1 h at room temperature. The blots were visualized
using enhanced chemiluminescence (Thermo Fisher Scientific, Inc.,
Waltham, MA, USA).
Candidate RGs and primer design
A total of 10 candidate endogenous RGs were selected
based on previous reports of their suitability for RT-qPCR
associated with hepatopathy in tissues, serum, or plasma (16,17–20).
Four of these genes were previously described as RGs for serum
miRNA analysis: miR-26a, miR-221, miR-181c, and miR-451 (17,19,20).
The remaining genes: miR-16, miR-103, miR-191, let-7a, 5S, and U6,
were obtained from liver tissue studies.
The primer sequences of the candidate RGs, along
with their corresponding bibliographic reference and amplicon
parameters, are listed in Table
II. The primers for 5S and U6 were purchased from Guangzhou
RiboBio Co., Ltd. (Guangzhou, China). The NCBI (http://www.ncbi.nlm.nih.gov) and miRBase (http://www.mirbase.org/) databases were used to search
for available gene sequences, and Primer 5 software (Premier
Biosoft, Palo Alto, CA, USA) was used to design the primers.
Primers were synthesized by Shanghai Bioengineering Co., Ltd.
(Shanghai, China). The reaction conditions were optimized by
determining the optimal annealing temperature and primer
concentration.
| Table IICandidate reference gene and target
gene primer sequences, and their various parameters, as determined
by quantitative PCR. |
Table II
Candidate reference gene and target
gene primer sequences, and their various parameters, as determined
by quantitative PCR.
| Accession
number | Gene name | Primer sequence
(5′-3′) | PCR E(%) | R2 | Average Cq
value | Reference |
|---|
| Candidate reference
miRNAs |
| MIMAT0000069 | miR-16 |
RT-GTCGTATCCAGTGCAGGGTCCGAGGTATTCGCACTGGATACGACCGCCAA | 98.2 | 0.998 | 23.5±2.1 | (20) |
| |
F-GCCCGTAGCAGCACGTAAATATT | | | | |
| MIMAT0000101 | miR-103 |
RT-GTCGTATCCAGTGCAGGGTCCGAGGTATTCGCACTGGATACGACTCATAG | 96.3 | 0.999 | 26.9±1.9 | (16,20) |
| |
F-GGTATAGCAGCATTGTACAGGGC | | | | |
| MIMAT0001631 | miR-451 |
RT-GTCGTATCCAGTGCAGGGTCCGAGGTATTCGCACTGGATACGACAACTCA | 98.5 | 0.995 | 28.7±1.2 | (22) |
| |
F-GCCTAAGCTACATTGTCTGCTGG | | | | |
| MIMAT0000082 | miR-26a |
RT-GTCGTATCCAGTGCAGGGTCCGAGGTATTCGCACTGGATACGACAGCCTA | 91.9 | 0.993 | 29.6±0.6 | (19) |
| |
F-GCCGCTTCAAGTAATCCAGGATA | | | | |
| MIMAT0000062 | let-7a |
RT-GTCGTATCCAGTGCAGGGTCCGAGGTATTCGCACTGGATACGACAACTAT | 94.4 | 0.997 | 29.7±1.1 | (20) |
| |
F-GCCGCTGAGGTAGTAGGTTGTAT | | | | |
| MIMAT0000440 | miR-191 |
RT-GTCGTATCCAGTGCAGGGTCCGAGGTATTCGCACTGGATACGACCAGCTG | 96.8 | 0.999 | 30.1±0.6 | (16,20) |
| |
F-GGTAACAACGGAATCCCAAAAGC | | | | |
| MIMAT0000256 | miR-181a |
RT-GTCGTATCCAGTGCAGGGTCCGAGGTATTCGCACTGGATACGACACTCAC | 95.8 | 0.998 | 30.3±2.5 | (21) |
| |
F-CGTGCTAACATTCAACGCTGTC | | | | |
| Gene of
interest |
| MIMAT0000421 | miR-122 |
RT-GTCGTATCCAGTGCAGGGTCCGAGGTATTCGCACTGGATACGACCAAACA | 98.0 | 0.996 | 30.4±2.0 | (17) |
| |
F-GCTACTGGAGTGTGACAATGGTG | | | | |
| miRNA
universal |
R-GTGCAGGGTCCGAGGT | | | | |
RNA extraction and reverse
transcription
Exosome-rich pellets were resuspended in 200
µl PBS and lysed with 1 ml QIAzole® (Qiagen GmbH,
Hilden, Germany). The RNA was isolated using the miRNeasy
Serum/Plasma kit (Qiagen GmbH), according to the manufacturer's
instructions for liquid samples. Each RNA sample was then eluted in
the same volume (normalization by volume) from a given volume of
starting serum (250 µl), and reverse transcribed to cDNA
using the GoScript™ Reverse Transcription system
(Promega Corporation, Madison, WI, USA).
RT-qPCR reaction
The RT-qPCR reactions were performed in 96-well
reaction plates using a StepOne Plus Real-Time PCR system (Applied
Biosystems Life Technologies, Foster City, CA, USA). The final
reaction volume was 20 µl, including 10 µl
SYBR® Select Master Mix (Applied Biosystems Life
Technologies), 250 nM of each primer, and 2 µl cDNA at a 1:4
dilution. The thermal cycling conditions included one cycle at 50°C
for 2 min, one cycle at 95°C for 2 min, followed by 40 cycles of
amplification at 95°C for 15 sec and 60°C for 1 min. The threshold
cycle (Cq) was calculated using SDS software 2.1 (Applied
Biosystems Life Technologies), at a threshold value of 0.38. Since
the Cq values of all gene RT-negative controls >36, Cq values
<36 were accepted for further experimentation.
PCR efficiency (E)
In order to calculate the efficiency of the RT-qPCR,
standard curves were generated using 10-fold serial dilutions from
a pool of cDNA (23). Duplicate
standard curves were included in all RT-qPCR assays. The obtained
individual Cq values were then plotted against the logarithm of the
dilution factor, and both the Pearson's correlation coefficient
(R), and PCR efficiency (E) for each assay were determined from the
respective plots. Regression correlation coefficients
(R2) and efficiency (E) values were obtained from the
GenEx 5 Standard software (BioMCC, Freising, Germany). In the
present study, the Minimum Information for Publication of
Quantitative Real-Time PCR Experiments guidelines (24) were followed, which promoted the
effort for experimental consistency and transparency, and increased
the reliability of the obtained results.
Statistical analysis
The expression stability of the candidate RGs was
calculated using four widely used algorithms: geNorm (25), NormFinder (26), BestKeeper (27), and the comparative ΔCt method
(28). These four methods were
implemented using an online tool for evaluating reference gene
expression (http://www.leonxie.com/referencegene.php) (29). The ranking of the RGs according to
their stability was generated by each algorithm, and a series of
continuous integers starting from 1 was assigned to each RG. The
geomean of each gene weight across the four algorithms was
subsequently calculated, following which the RGs were re-ranked
according to geomean. The gene with the lowest geomean was
considered to be the most stable RG (29). Statistical analyses were performed
using SPSS 19.0 software (IBM SPSS, Armonk, NY, USA) followed by a
paired t-test. P<0.05 was considered to indicate a statistically
significant difference. For the evaluation of statistical
equivalence, a Student-Newman-Keuls test was used.
Results
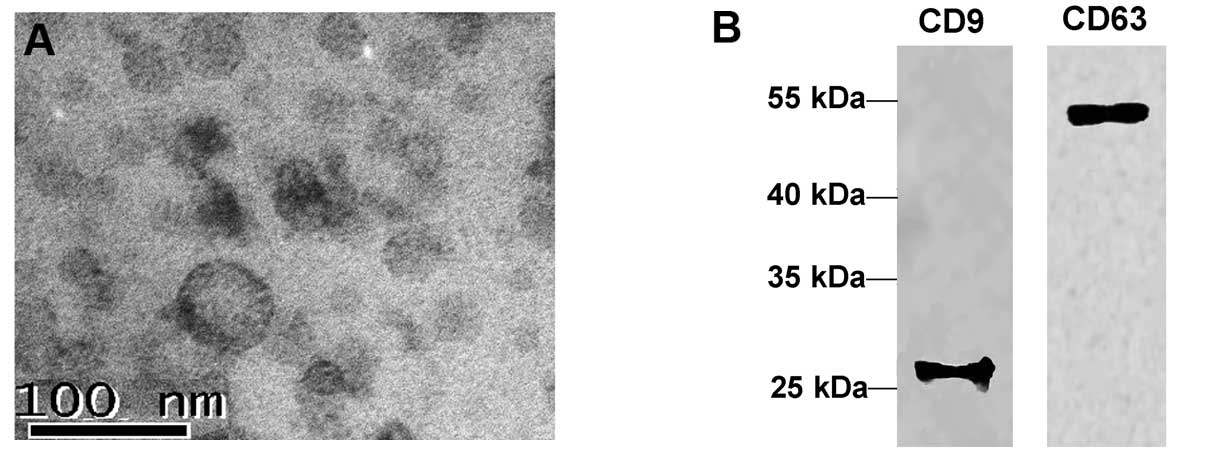
Characterization of serum exosomes
Previous studies indicated that serum exosomes may
enrich miRNAs, and thus more accurate and reproducible data may be
obtained from exosome miRNA quantitative analysis (5,13).
The successful isolation of exosomes from serum is necessary for
miRNA quantitative evaluation. In the present study, serum exosomes
were obtained using an ExoQuick exosome precipitation solution.
Electron microscopy indicated the presence of 30–100 nm spherical
structures (Fig. 1A), consistent
with previously reported exosome characteristics (30). These results were further confirmed
with western blot analyses, using antibodies targeting two common
exosomal markers, tetraspanin molecules CD63 and CD9, the results
of which supported the endocytic origin of the vesicles (31–33)
(Fig. 1B).
RT-qPCR assay validation
All PCR assays produced a single amplicon, as shown
by the presence of a single marked increase on the melting curve.
The negative controls did not contain template (“no-template
control” (NTC)). The NTCs of 5S, miR-181c, and miR-191 were
successfully detected, and their Cq values were <36. The PCRs
displayed efficiency between 91.9 and 98.5% (Table II). PCR E values between 90 and
110% were also considered acceptable. The R2 values
ranged between 0.993 and 0.999 (Table
II).
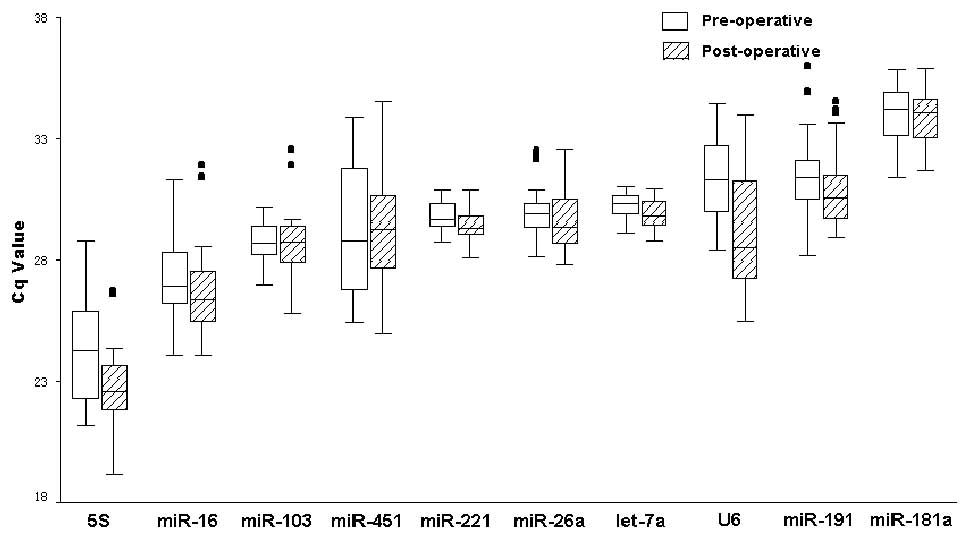
Transcript profiles of RGs
The expression profiles of the 10 candidate RGs were
assessed in paired sample set 1 (Fig.
2). The Cq values are represented for each transcript amplified
from each biological replicate. The Cq values ranged between 19.25
(5S) and 35.75 (miR-181a). The Cq values for 5S and U6 were
significantly different in the pre- and post-operative serum,
P<0.001, whereas no significant difference was detected for
miR-16, miR-103, miR-451, miR-26a, miR-191, and miR-181a
(P>0.05).
Gene expression stability analysis
In order to rank the stability of the tested genes,
four algorithms: geNorm, NormFinder, BestKeeper, and the
comparative ΔCt method, were used. These four methods evaluated the
expression stability of the RGs, according to different variables.
GeNorm provides an M-value based on the average pairwise expression
ratio. The most stable transcript has the lowest M-value, and RGs
with M≤1.5 were deemed to be stably expressed (25). According to this method, the
M-values of the candidate RGs in 33 pairs of samples were <1.5,
except for 5S, miR-451, and U6, suggesting that these were not
reliable RGs. miR-221 and let-7a were the most stable genes, with
an average expression stability of M=0.67 (Table III),
| Table IIIExpression levels of candidate
reference genes. |
Table III
Expression levels of candidate
reference genes.
| Gene name | geNorm M-value | NormFinder
Stability value | BestKeeper SD ±
CP | ΔCt Mean ± SD | Comprehensive gene
stability | Ranking
ordera |
|---|
| miR-221 | 0.67 (1) | 0.67 (2) | 0.52 (2) | 1.50 (2) | 1.68 | 1 |
| let-7a | 0.67 (1) | 0.73 (3) | 0.46 (1) | 1.56 (3) | 1.73 | 2 |
| miR-26a | 0.84 (3) | 0.27 (1) | 0.88 (4) | 1.43 (1) | 1.86 | 3 |
| miR-103 | 1.13 (5) | 1.22 (6) | 0.85 (3) | 1.81 (6) | 4.82 | 4 |
| miR-191 | 1.23 (6) | 0.87 (4) | 1.22 (6) | 1.63 (4) | 4.90 | 5 |
| miR-181a | 1.03 (4) | 1.46 (7) | 0.92 (5) | 1.92 (7) | 5.60 | 6 |
| miR-16 | 1.35 (7) | 1.20 (5) | 1.45 (7) | 1.79 (5) | 5.92 | 7 |
| 5S | 1.52 (8) | 1.71 (8) | 1.71 (8) | 2.16 (8) | 8.00 | 8 |
| miR-451 | 1.69 (9) | 2.16 (9) | 1.99 (9) | 2.46 (9) | 9.00 | 9 |
| U6 | 1.9 (10) | 2.44 (10) | 2.11 (10) | 2.71 (10) | 10.00 | 10 |
NormFinder analyzes the expression stability of the
RGs using linear scale quantitative data, and provides a stability
value for each investigated gene. A higher stability value
indicates a lower stability (26).
In the present study, the NormFinder analysis identified miR-26a as
the most stably expressed RG, with a stability value of 0.27,
followed by miR-221 (0.67) and let-7a (0.73) (Table III). The NormFinder algorithm was
used to calculate the Accumulated Standard Deviation (Acc. SD) of
the candidate RGs using the GenEx Standard software, according to
equation A. The lowest Acc. SD
value indicates the optimal number of control genes. Based on the
ranking of gene stability, the lowest Acc. SD value was determined
to correspond to one optimal gene: miR-26a (Table IV).
| Table IVGene expression stability values and
accumulated standard deviation (Acc. SD) analysis as determined by
NormFinder. |
Table IV
Gene expression stability values and
accumulated standard deviation (Acc. SD) analysis as determined by
NormFinder.
| Gene name | Stability
value | NormFinder Acc. SD
valuea | Optimal RGs
(n) |
|---|
| miR-26a | 0.27 | 0.27 | 1 |
| miR-221 | 0.67 | 0.36 | 2 |
| let-7a | 0.73 | 0.34 | 3 |
| miR-191 | 0.87 | 0.34 | 4 |
| miR-16 | 1.20 | 0.36 | 5 |
| miR-103 | 1.22 | 0.36 | 6 |
| miR-181a | 1.46 | 0.37 | 7 |
| 5S | 1.71 | 0.39 | 8 |
| miR-451 | 2.16 | 0.42 | 9 |
| U6 | 2.44 | 0.45 | 10 |
In the present study, the Acc. SD based on any given
RG (n) was calculated as the geometric average of raw RG
quantities, for any given gene (i).
BestKeeper determines gene stability according to
SD, with a lower SD indicating a more stably expressed gene
(27). The results of the
BestKeeper analysis showed a high SD variation for miR-103, miR-16,
5S, miR-451 and U6. In the present study, let-7a was shown to be
the most stable RG with SD=0.46, followed by miR-221 with SD=0.52
(Table III).
The comparative ΔCt method was also used to estimate
the most stable RGs. The results of the ΔCt method were the same as
those of the NormFinder analysis, with the three most stable RGs
being miR-26a, miR-221, and let-7a (Table III).
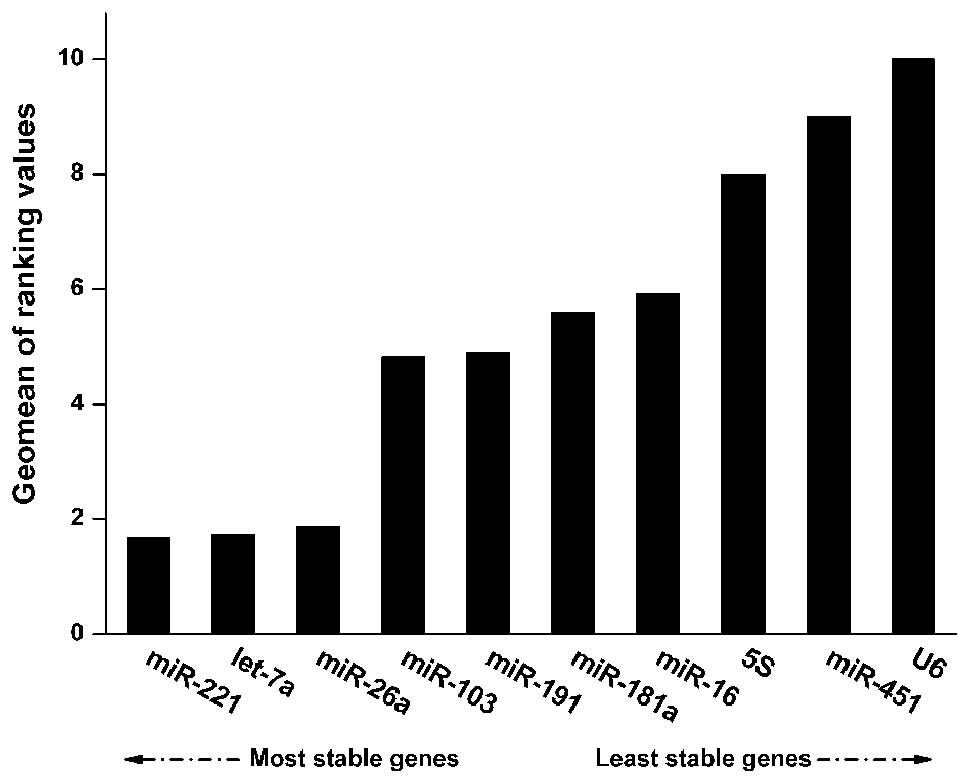
Since there were differences in the results
generated from the various software programs, normalization and
integration of the data was necessary. RefFinder (http://www.leonxie.com/referencegene.php) is a
web-based tool used to generate an overall ranking of candidate RGs
(29). According to the output of
RefFinder, the least stable RGs were U6, miR-451, and 5S. The three
most stable RGs were miR-221, let-7a, and miR-26a (Fig. 3). Notably, the three algorithms
also ranked miR-221, let-7a, and miR-26a as the most stable RGs,
except in the case of miR-26a, which was ranked fourth most stable
by BestKeeper (Table III). These
results indicate the possible use of miR-221, let-7a, and miR-26a
as stable RGs in liver carcinoma resection studies.
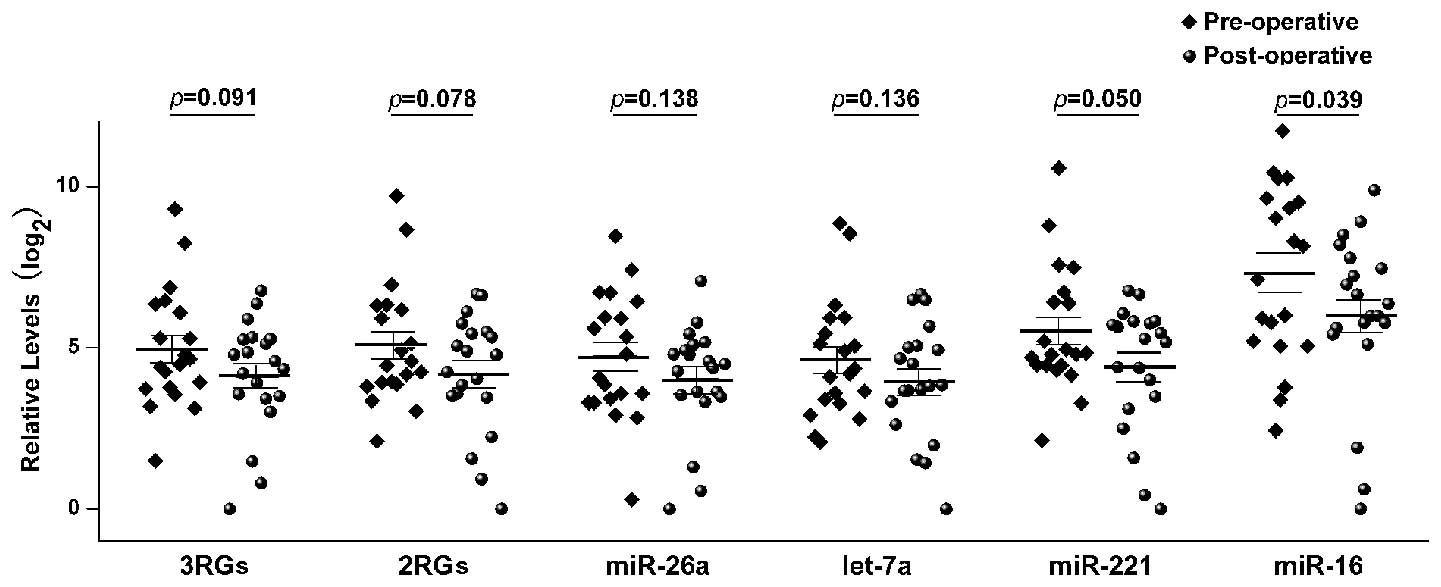
Impact of RGs on the expression levels of
target genes
RT-qPCR assays were performed in order to further
evaluate the expression patterns of the selected candidate RGs in
the paired sample set 2. Liver-specific miR-122 was chosen for
analysis, due to its higher expression levels in the sera of
patients with HCC following surgery (21). The miR-122 expression level data
were normalized (Fig. 4) using the
RefFinder recommended combination of miR-221, let-7a, and miR-26a
(3RGs), and using the geNorm recommended combination of miR-221 and
let-7a (2RGs). miR-26a was recommended by NormFinder according to
the lowest Acc. SD value. In addition, the data was further
normalized using a single gene; let-7a, miR-221, or miR-16.
Although BestKeeper and geNorm did not recommend miR-16 as a
suitable RG, it is nevertheless frequently used in expression
studies (34,35). The fold changes in serum exosomal
miR-122 between the various groups were calculated using the GenEx
software. In the present study, normalization with miR-16 indicated
that serum exosomal miR-122 was downregulated following liver
cancer surgery, whereas normalization using other RGs, except for
miR-221, did not indicate differential expression of the target
miRNA. In addition, normalization of miR-122 expression by miR-221,
a statistically significant value of P<0.05 was generated. These
results suggest that the reliability of miR-221 as a RG needs to be
confirmed in further studies with larger sample sizes. In
conclusion, the use of miR-16 for data normalization generated
identical results to that of Qi et al (21). A previous study demonstrated that
the expression levels of miR-122 were significantly reduced in
post-operative serum samples, as compared with pre-operative
samples (21). However, other
normalization approaches used based on the recommendations of the
present study indicated that hepatic surgery did not change the
expression levels of miR-122 in serum exosomes.
Discussion
Selecting an appropriate RG is important for gene
expression analysis, as the use of an inappropriate RG may lead to
false experimental conclusions (36,37).
Therefore, one or more appropriate RGs need to be selected
depending on the experimental conditions.
The evaluation of the expression stability of
candidate RGs in serum exosomes from individuals with liver
carcinoma has yet to be reported. The use of optimal RGs would
contribute significantly to the accurate identification of
biomarkers and predictive factors used to diagnose HCC, and to
predict early post-operative relapse in patients with HCC. Based on
previous studies, 10 commonly used RGs were selected for gene
stability analysis (16–20). In order to evaluate the average
expression stability of the RGs, four algorithms (geNorm,
NormFinder, BestKeeper and the comparative ΔCt method), were
used.
A conventional statistical test was initially
conducted in order to evaluate the expression dispersion of each
gene in pre- and post-operative patients with HCC (Fig. 2). The stability of the candidate
RGs in the various sample sets were subsequently analyzed using the
four algorithms. The pair-wise comparison approach methods (geNorm
and BestKeeper) selected the most suitable RGs based on the
variation of expression ratios between the genes across the sample
sets. Both methods generated similar rankings, and both considered
miR-221 and let-7a to be the most suitable RGs for normalization
(Table III). However, the
rankings differed significantly for miR-26a, miR-103, and miR-181a.
This may be due to the fact that geNorm excludes genes with
differences in expression in the subgroups, but includes pairs of
co-regulated genes based on their similar expression profiles
(26). Therefore, NormFinder and
the comparative ΔCt method were used in order to eliminate the
effects of co-regulation, and to evaluate the RGs from all aspects.
These two algorithms generated the same RG rankings based on the
calculation of gene stability. miR-26a was considered the most
suitable RG for serum exosomal miRNA expression studies in patients
with HCC following surgery. Finally, using the web-based
comprehensive tool RefFinder, miR-221, let-7a, and miR-26a were
determined to be the most stable RGs. Furthermore, the results of
the present study demonstrated that 5S, miR-451, and U6 were not
suitable as housekeeping genes for the present experimental setup.
With regards to miR-16, geNorm and BestKeeper indicated that its
stability value exceeded that required for a stable RG, making it
unreliable for miRNA expression analysis.
The effects of the normalization strategies were
further illustrated by the accuracy of the RT-qPCR results. miR-122
serum expression levels have previously been shown to be
downregulated in the serum of post-operative patients with HCC
(21). The results of the present
study revealed that circulating miR-122 was significantly reduced
in the post-operative serum samples when miR-16 was used as an RG,
in a similar manner to that of Qi et al (21). However, when the data were
normalized to miR-221, let-7a, and miR-26a combined, miR-221 and
let-7a combined, or miR-26a alone, as recommended by the results of
the present study, a statistically significant difference in
miR-122 expression was not detected. Therefore, rigorous validation
of RG suitability is required, as different normalization controls
were shown to significantly influence serum expression levels of
miR-122, despite the fact that the miRNA samples were donated by
patients of the same descent with the same disease. A previous
study reported that normalization with miR-16 resulted in
significantly higher miR-122 expression levels detected in patients
with HCC, as compared with HBV-infected individuals (21). In addition, when miR-181a,
miR-181c, and miR-122 were used as RGs, miR-122 expression was
higher in patients with HCC, as compared with HBV-infected controls
(19). However, Qu et al
(38) demonstrated that the serum
expression levels of miR-16 were significantly lower in patients
with HCC, suggesting that miR-16 itself may act as a novel
biomarker for HCC. Therefore, the use of miR-16 as a normalizer of
target miRNA expression levels may result in erroneous results,
confirming the results of the present study that miR-16 is not a
suitable RG candidate. The present study also demonstrated that
systematically selected RGs should offer more appropriate
normalization than miR-221.
The results of the present study indicated that the
accurate selection of reliable RGs is a prerequisite for the
correct measurement of serum exosomal miRNA expression levels by
RT-qPCR. The following RGs: miR-221, let-7a, and miR-26a, were the
most stably expressed genes of the present study. Furthermore, due
to the technical and economic advantages of using a smaller number
of RGs, miR-221 and let-7a combined, or miR-26a alone may be used
as optimal RGs in order to detect a single target miRNA.
Acknowledgments
The present study was supported by a grant from the
National Natural Science Foundation of China (grant no. 81201356).
The authors of the present study are thankful for the valuable
comments from members of the Department of Clinical Laboratory
(Chongqing, China).
References
|
1
|
Ambros V: The functions of animal
microRNAs. Nature. 431:350–355. 2004. View Article : Google Scholar : PubMed/NCBI
|
|
2
|
Li W, Chen YQ, Shen YB, et al: HIF-1α
knockdown by miRNA decreases survivin expression and inhibits A549
cell growth in vitro and in vivo. Int J Mol Med. 32:271–280.
2013.PubMed/NCBI
|
|
3
|
Vlassov AV, Magdaleno S, Setterquist R and
Conrad R: Exosomes: Current knowledge of their composition,
biological functions, and diagnostic and therapeutic potentials.
Biochim Biophys Acta. 1820:940–948. 2012. View Article : Google Scholar : PubMed/NCBI
|
|
4
|
Giusti I, D'Ascenzo S and Dolo V:
Microvesicles as potential ovarian cancer biomarkers. BioMed Res
Int. 2013:7030482013. View Article : Google Scholar : PubMed/NCBI
|
|
5
|
Gallo A, Tandon M, Alevizos I and Illei
GG: The majority of microRNAs detectable in serum and saliva is
concentrated in exosomes. PLoS One. 7:e306792012. View Article : Google Scholar : PubMed/NCBI
|
|
6
|
Michael A, Bajracharya SD, Yuen PS, et al:
Exosomes from human saliva as a source of microRNA biomarkers. Oral
Dis. 16:34–38. 2010. View Article : Google Scholar :
|
|
7
|
Keller S, Ridinger J, Rupp AK, Janssen JW
and Altevogt P: Body fluid derived exosomes as a novel template for
clinical diagnostics. J Transl Med. 9:862011. View Article : Google Scholar : PubMed/NCBI
|
|
8
|
Valadi H, Ekström K, Bossios A, Sjöstrand
M, Lee JJ and Lötvall JO: Exosome-mediated transfer of mRNAs and
microRNAs is a novel mechanism of genetic exchange between cells.
Nat Cell Biol. 9:654–659. 2007. View
Article : Google Scholar : PubMed/NCBI
|
|
9
|
Wahlgren J, De L, Karlson T, Brisslert M,
et al: Plasma exosomes can deliver exogenous short interfering RNA
to monocytes and lymphocytes. Nucleic Acids Res. 40:e1302012.
View Article : Google Scholar : PubMed/NCBI
|
|
10
|
Taylor DD and Gercel-Taylor C: MicroRNA
signatures of tumor-derived exosomes as diagnostic biomarkers of
ovarian cancer. Gynecol Oncol. 110:13–21. 2008. View Article : Google Scholar : PubMed/NCBI
|
|
11
|
Rabinowits G, Gerçel-Taylor C, Day JM,
Taylor DD and Kloecker GH: Exosomal microRNA: A diagnostic marker
for lung cancer. Clin Lung Cancer. 10:42–46. 2009. View Article : Google Scholar : PubMed/NCBI
|
|
12
|
Bala S, Petrasek J, Mundkur S, et al:
Circulating microRNAs in exosomes indicate hepatocyte injury and
inflammation in alcoholic, drug-induced, and inflammatory liver
diseases. Hepatology. 56:1946–1957. 2012. View Article : Google Scholar : PubMed/NCBI
|
|
13
|
Murakami Y, Toyoda H, Tanahashi T, et al:
Comprehensive miRNA expression analysis in peripheral blood can
diagnose liver disease. PLoS One. 7:e483662012. View Article : Google Scholar : PubMed/NCBI
|
|
14
|
Tang ZY, Ye SL, Liu YK, et al: A decade's
studies on metastasis of hepatocellular carcinoma. J Cancer Res
Clin Oncol. 130:187–196. 2004. View Article : Google Scholar
|
|
15
|
Lin Q, Mao W, Shu Y, et al: A cluster of
specified microRNAs in peripheral blood as biomarkers for
metastatic non-small-cell lung cancer by stem-loop RT-PCR. J Cancer
Res Clin Oncol. 138:85–93. 2012. View Article : Google Scholar :
|
|
16
|
Peltier HJ and Latham GJ: Normalization of
microRNA expression levels in quantitative RT-PCR assays:
Identification of suitable reference RNA targets in normal and
cancerous human solid tissues. RNA. 14:844–852. 2008. View Article : Google Scholar : PubMed/NCBI
|
|
17
|
Zhu HT, Dong QZ, Wang G, et al:
Identification of suitable reference genes for qRT-PCR analysis of
circulating microRNAs in hepatitis B virus-infected patients. Mol
Biotechnol. 50:49–56. 2012. View Article : Google Scholar
|
|
18
|
Lardizábal MN, Nocito AL, Daniele SM,
Ornella LA, Palatnik JF and Veggi LM: Reference genes for real-time
PCR quantification of microRNAs and messenger RNAs in rat models of
hepato-toxicity. PLoS One. 7:e363232012. View Article : Google Scholar
|
|
19
|
Xu J, Wu C, Che X, et al: Circulating
microRNAs, miR-21, miR-122, and miR-223, in patients with
hepatocellular carcinoma or chronic hepatitis. Mol Carcinog.
50:136–142. 2011. View
Article : Google Scholar : PubMed/NCBI
|
|
20
|
Blondal T, Jensby Nielsen S, Baker A, et
al: Assessing sample and miRNA profile quality in serum and plasma
or other biofluids. Methods. 59:S1–S6. 2013. View Article : Google Scholar
|
|
21
|
Qi P, Cheng SQ, Wang H, Li N, Chen YF and
Gao CF: Serum microRNAs as biomarkers for hepatocellular carcinoma
in Chinese patients with chronic hepatitis B virus infection. PLoS
One. 6:e284862011. View Article : Google Scholar : PubMed/NCBI
|
|
22
|
Théry C, Amigorena S, Raposo G and Clayton
A: Isolation and characterization of exosomes from cell culture
super-natants and biological fluids. Curr Protoc Cell Biol Chapter
3. Unit 3.22. 2006. View Article : Google Scholar
|
|
23
|
Pfaffl MW: A new mathematical model for
relative quantification in real-time RT-PCR. Nucleic Acids Res.
29:e452001. View Article : Google Scholar : PubMed/NCBI
|
|
24
|
Bustin SA, Benes V, Garson JA, et al: The
MIQE guidelines: Minimum information for publication of
quantitative real-time PCR experiments. Clin Chem. 55:611–622.
2009. View Article : Google Scholar : PubMed/NCBI
|
|
25
|
Vandesompele J, De Preter K, Pattyn F, et
al: Accurate normalization of real-time quantitative RT-PCR data by
geometric averaging of multiple internal control genes. Genome
Biol. 3:RESEARCH0034. 2002. View Article : Google Scholar : PubMed/NCBI
|
|
26
|
Andersen CL, Jensen JL and Ørntoft TF:
Normalization of real-time quantitative reverse transcription-PCR
data: A model-based variance estimation approach to identify genes
suited for normalization, applied to bladder and colon cancer data
sets. Cancer Res. 64:5245–5250. 2004. View Article : Google Scholar : PubMed/NCBI
|
|
27
|
Pfaffl MW, Tichopad A, Prgomet C and
Neuvians TP: Determination of stable housekeeping genes,
differentially regulated target genes and sample integrity:
BestKeeper - Excel-based tool using pair-wise correlations.
Biotechnol Lett. 26:509–515. 2004. View Article : Google Scholar : PubMed/NCBI
|
|
28
|
Silver N, Best S, Jiang J and Thein SL:
Selection of housekeeping genes for gene expression studies in
human reticulocytes using real-time PCR. BMC Mol Biol. 7:332006.
View Article : Google Scholar : PubMed/NCBI
|
|
29
|
Xie F, Xiao P, Chen D, Xu L and Zhang B:
miRDeepFinder: A miRNA analysis tool for deep sequencing of plant
small RNAs. Plant Mol Biol. 80:75–84. 2012. View Article : Google Scholar
|
|
30
|
Silverman JM and Reiner NE: Exosomes and
other microvesicles in infection biology: Organelles with
unanticipated phenotypes. Cell Microbiol. 13:1–9. 2011. View Article : Google Scholar
|
|
31
|
Pols MS and Klumperman J: Trafficking and
function of the tetraspanin CD63. Exp Cell Res. 315:1584–1592.
2009. View Article : Google Scholar
|
|
32
|
Mathivanan S and Simpson RJ: ExoCarta: A
compendium of exosomal proteins and RNA. Proteomics. 9:4997–5000.
2009. View Article : Google Scholar : PubMed/NCBI
|
|
33
|
Mathivanan S, Ji H and Simpson RJ:
Exosomes: Extracellular organelles important in intercellular
communication. J Proteomics. 73:1907–1920. 2010. View Article : Google Scholar : PubMed/NCBI
|
|
34
|
Song J, Bai Z, Han W, et al:
Identification of suitable reference genes for qPCR analysis of
serum microRNA in gastric cancer patients. Dig Dis Sci. 57:897–904.
2012. View Article : Google Scholar
|
|
35
|
Li J, Wei H, Li Y, Li Q and Li N:
Identification of a suitable endogenous control gene in porcine
blastocysts for use in quantitative PCR analysis of microRNAs. Sci
China Life Sci. 55:126–131. 2012. View Article : Google Scholar : PubMed/NCBI
|
|
36
|
Bustin SA and Nolan T: Pitfalls of
quantitative real-time reverse-transcription polymerase chain
reaction. J Biomol Tech. 15:155–166. 2004.PubMed/NCBI
|
|
37
|
Dheda K, Huggett JF, Chang JS, et al: The
implications of using an inappropriate reference gene for real-time
reverse transcription PCR data normalization. Anal Biochem.
344:141–143. 2005. View Article : Google Scholar : PubMed/NCBI
|
|
38
|
Qu KZ, Zhang K, Li HR, Afdhal NH and
Albitar M: Circulating microRNAs as biomarkers for hepatocellular
carcinoma. J Clin Gastroenterol. 45:355–360. 2011. View Article : Google Scholar : PubMed/NCBI
|