Introduction
Autoimmune thyroid disease (AITD) encompasses a
range of thyroid conditions, including hyperthyroidism (Graves'
disease), Hashimoto's disease (Hashimoto's thyroiditis), idiopathic
myxedema and primary hypothyroidism. Genetic factors have an
important role in the occurrence of AITD (1). Genetic screening has shown that
susceptibility genes for AITD include human leukocyte antigen and
the cytotoxic T-lymphocyte-associated antigen-4 (2). Although AITD has been associated with
immunomodulatory genes, this does not fully explain the specific
autoimmune attack directed towards the thyroid. Therefore,
disease-associated antigen-specific genes, including those encoding
thyroid peroxidase, thyroid-stimulating hormone receptor and
thyroglobulin (Tg) comprise another group of candidate genes which
are potentially associated with AITD (2). To date, only few studies on Tg and
genes associated with the susceptibility to AITD have been
performed, and the findings from different population are not
consistent (3–5), possibly due to a range of different
detection methods used. Commonly used methods for analyzing
differences in gene sequences include single-strand conformation
polymorphism (6), denaturing
gradient gel electrophoresis (7),
denaturing high-performance liquid chromatography (8), temperature gradient capillary
electrophoresis (9) and mass
spectrometry (10). These methods
require separate samples, enzymatic reactions and chemical
reactions; these methods are complex, comprise multiple steps, and
are time-consuming and challenging to perform. However, the
high-resolution melting curve analysis (HRMA) method is relatively
simple, fast, accurate, economical and suitable for high-throughput
analysis (11–14). HRMA can effectively distinguish
between different alleles and genotypes at single nucleotide
polymorphism (SNP) loci (13,15,16).
To date, three novel methods have been developed for HRMA: The
small-fragment amplification method (17), the non-labeled probe method
(18) and the snapback probe
primer method (19). A recent
study showed that the method of genomic DNA extraction influences
the polymerase chain reaction (PCR)-HRMA product (20). HRMA has previously been used to
detect variable-number tandem repeats and displayed consistency
with traditional gel electrophoresis (21), a technique which is widely used in
genetic testing. To utilize this technique, the present study
adopted a protocol for the preparation and use of reagents to
extract DNA (22). In the present
study, HRMA amplification of small fragments was employed to study
Tg gene polymorphisms of a Han Chinese population from the Northern
regions of Henan province and examined the correlation between Tg
gene polymorphisms and AITD.
Materials and methods
Clinical data
A total of 270 AITD patients (180 females, 90 males)
were enrolled at the Department of Nuclear Medicine, Anyang
Regional Hospital (Anyang, China) between February 2013 and January
2014. The average age of female and male AITD patients was
37.72±14.30 and 38.04±12.77 years, respectively. A control group
comprising 135 healthy individuals (90 females and 45 males) was
recruited at Anyang Regional Hospital Medical Center (Anyang,
China). The average age of female and male control subjects was
35.68±11.67 and 38.16±11.75 years, respectively. The inclusion
criteria were as follows: The diagnosis of AITD was based on
typical clinical symptoms, and was confirmed by laboratory tests
(90 cases of primary hypothyroidism, 90 cases of Graves' disease
and 90 cases of Hashimoto disease) (23). The control group was age- and
gender-matched with the AITD group. The study was approved by the
Ethics Committee of Anyang Regional Hospital of Puyang (Puyang,
China). Written informed consent was obtained from the patient.
Genomic DNA extraction from blood
Genomic DNA extraction was performed according to
the method of Wang et al (22). First, 0.6 ml extraction buffer
(guanidine thiocyanate, Tris-HCl, EDTA. Triton X-100) was placed in
a 1.5-ml centrifuge tube and 200 μl blood sample was added;
the mixture was incubated for 5–10 min at room temperature with
continuous gentle mixing to avoid shock and DNA shearing. The
mixture was then centrifuged at 13,000 × g for 10 min at room
temperature. The supernatant (0.7 ml) was loaded onto a
pre-prepared adsorption column (Beijing Solarbio Science &
Technology Co., Ltd., Beijing, China), which was placed in a 1.5-ml
collection tube. The column was then centrifuged at 12,000 × g for
30 sec at room temperature and the eluate was discarded.
Subsequently 500 μl binding buffer was added to the
adsorption column, followed by centrifugation at 12,000 × g for 30
sec at room temperature. The eluent was discarded and 600 μl
wash buffer (70% ethanol supplemented with 10 mM NaCl) was added to
the adsorption column, followed by centrifugation at 12,000 × g for
1 min at room temperature and discarding of the eluent. This
washing step was repeated once and the adsorption column was
transferred to a fresh 1.5-ml microcentrifuge tube. 50 μl
Tris-EDTA buffer was added to the column followed by incubation for
1 min at room tempera-ture. The column was then centrifuged at
12,000 × g for 1 min at room temperature, and the eluate containing
the DNA was collected and stored at −20°C.
Primer design
As opposed to ordinary PCR primers, HRMA requires
the design of primers for the synthesis of PCR products of <150
bp. PCR products were sequenced using separate sequencing primers;
the amplified product of PCR using the sequencing primers was
>300 bp. Primers were designed according to the published
National center for Biotechnology Information (http://www.ncbi.nlm.nih.gov/) gene sequence for the Tg
gene. HRMA primers and sequencing primers for the Tg gene are
listed in Table I. Primers were
synthesized by Sangon Biotech (Shanghai, China).
 | Table IPCR primers used in the present
study. |
Table I
PCR primers used in the present
study.
| Name | Sequence | PCR product length
(bp) |
|---|
| HRM | | |
| E10SNP24 | F:
5′-CACCTGCTCATTGTTCCTCC-3′ | 80 |
| R:
5′-GGCCTGCACCGTCCTGAG-3′ | |
| E10SNP158 | F:
5′-CTACATCCCACAGTGCAGC-3′ | 87 |
| R:
5′-CGTTGGTACAACTCGAAGAC-3′ | |
| E12SNP | F:
5′-CGACTCGGCTGGAGCATC-3′ | 93 |
| R:
5′-GCGTGGCACTGCACAGGC-3′ | |
| E33SNP | F:
5′-ACCTTCAGGCCTGCTCTTTC-3′ | 80 |
| R:
5′-AGTGCAGCATGGGTCCGC-3′ | |
| Sequencing | | |
| E10SNP | F:
5′-GCTGATCACCAACTGATGTC-3′ | 481 |
| R:
5′-CTGAAGTTTCCGGAAGCTGC-3′ | |
| E12SNP | F:
5′-CATACGTGGTTGTTCTCAGC-3′ | 389 |
| R:
5′-GCTCCTGTTACACAAGTGAG-3′ | |
| E33SNP | F:
5′-GGACAGTATTCCTGAGAGGAG-3′ | 403 |
| R:
5′-GAACGAGGATAGGAGATGCTG-3′ | |
Quantitative PCR conditions and HRMA
analysis
Each 20-μl reaction mixture contained 1
μl template, 1 μl forward primer, 1 μl reverse
primer, 10 μl 10X HS TaqE mix (KangWei Century Biotechnology
Company, Beijing, China), 1 μl 20X EvaGreen (Biotium,
Hayward, CA, USA), and 6 μl sterile distilled water. Once
mixed, the PCR was performed using a LightCycler 480 RT-PCR machine
(Roche Diagnostics, Basel, Switzerland) for fluorescence
quantitation. The reaction procedure was performed using the
following thermocycling conditions: 95°C for 10 min, followed by 40
cycles of 95°C for 10 sec and 60°C for 15 sec, during which
fluorescence measurements were collected; then 95°C for 10 sec and
65°C for 15 sec; and finally, the temperature was increased from 60
to 95°C in 1°C-steps. A total of 50 fluorescence measurements were
collected to obtain the melting curve. After the PCR and
high-resolution melting curves were completed, GeneScanning
software (Roche Diagnostics) on the LightCycler instrument was used
for analysis of high-resolution melting curves. Through software
analysis, DNA samples were assigned to three categories: Mutant
homozygous, wild-type homozygous or heterozygous. In each category,
the PCR products of selected samples were completely sequenced by
Sangon Biotech. The gel electrophoresis was performed on 1% agarose
gels (Biowest Agarose; Gene Tech Company, Hong Kong, China). The
marker DL2000 (Takara Bio, Inc., Otsu, Japan) was used as the
molecular standard.
Statistical analysis
After data from individual samples had been
recorded, genotype, allele and haplotype frequencies were
calculated. SPSS 16.0 software (SPSS, Chicago, IL, USA) was used
for statistical analysis. P-values, odds ratios (OR) and 95%
confidence intervals (95% CI) were calculated using the
χ2 test.
Results
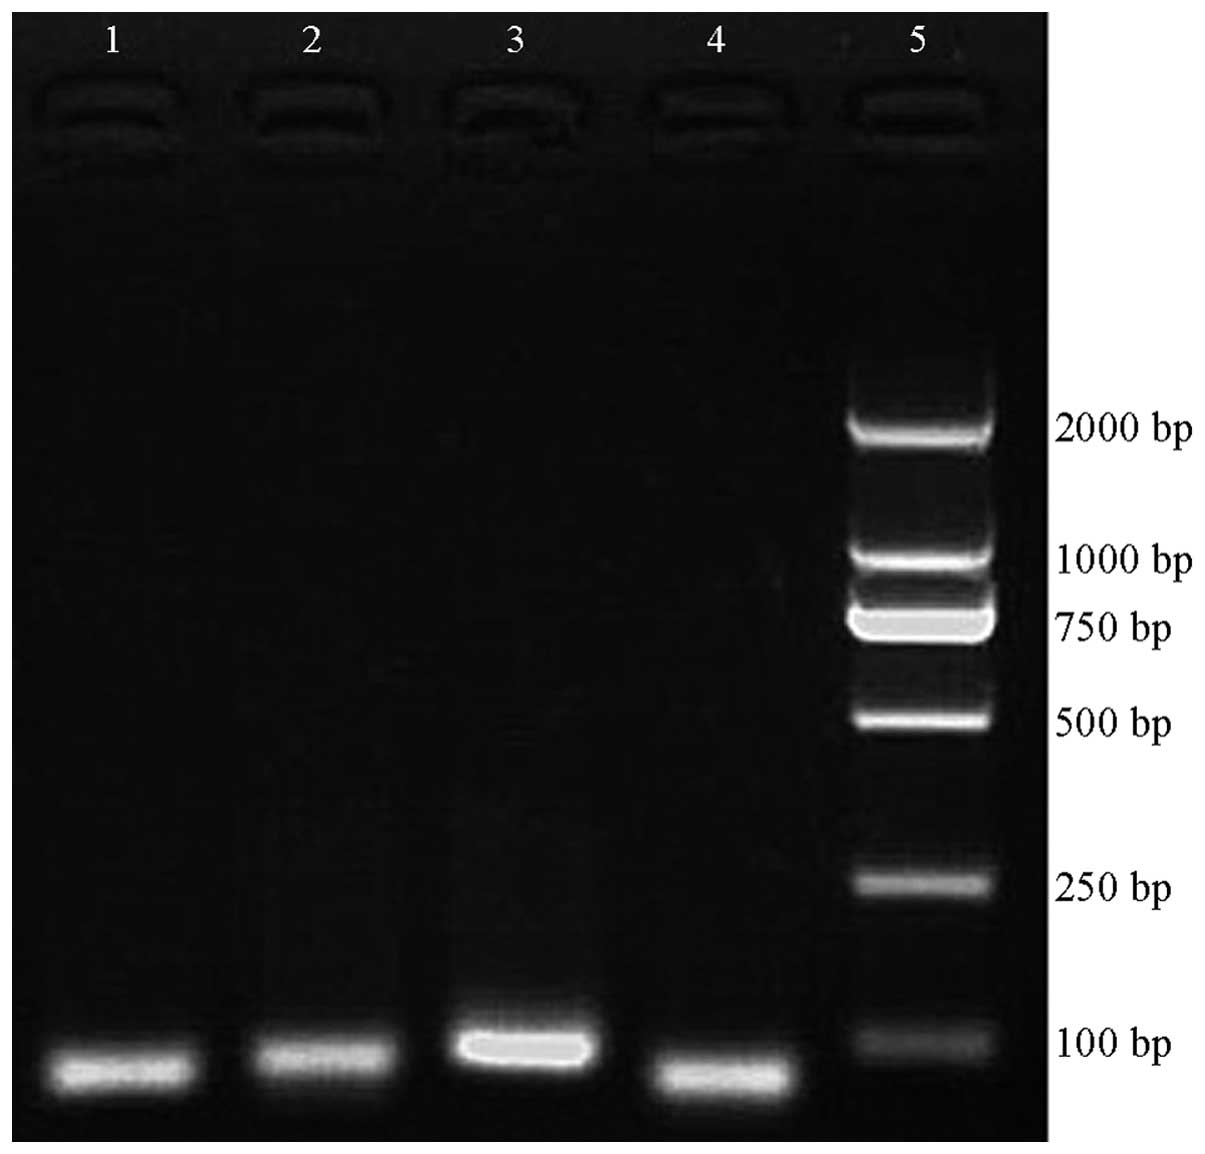
PCR products
Following PCR, the amplified PCR products were
analyzed by gel electrophoresis. The PCR product of E10SNP24 was 80
bp in length, the PCR product of E10SNP158 was 87 bp, the PCR
product of E12SNP was 93 bp and the PCR product of E33SNP was 80 bp
in length. The electrophoresis results showed bands of the expected
sizes (Fig. 1).
HRMA
After the PCR was completed, PCR products were
analyzed using HRMA. The EvaGreen fluorescent conjugate only labels
double-stranded DNA; therefore, as the temperature increased and
the DNA gradually unraveled into single strands during the
recording of the melting curve, the fluorescence intensity of the
mixture was gradually reduced. The DNA sequences of the different
genotypes contained different combinations of nucleotide bases,
generating PCR products with different melting points and melting
curves. The melting curves from different genotypes, which were
homozygous for the wild-type allele, while being heterozygous or
homozygous for the mutant allele, are represented in graphical form
by different colors (Fig. 2).
Therefore, the HRMA was able to distinguish between different
genotypes; these genotypes were confirmed by DNA sequencing. As an
example, the HRMA results for the exon 10 polymorphism, (E10SNP158
T/C), are shown in Fig. 2; other
exon genotype maps were similar to that of the exon 10 SNP158
T/C.
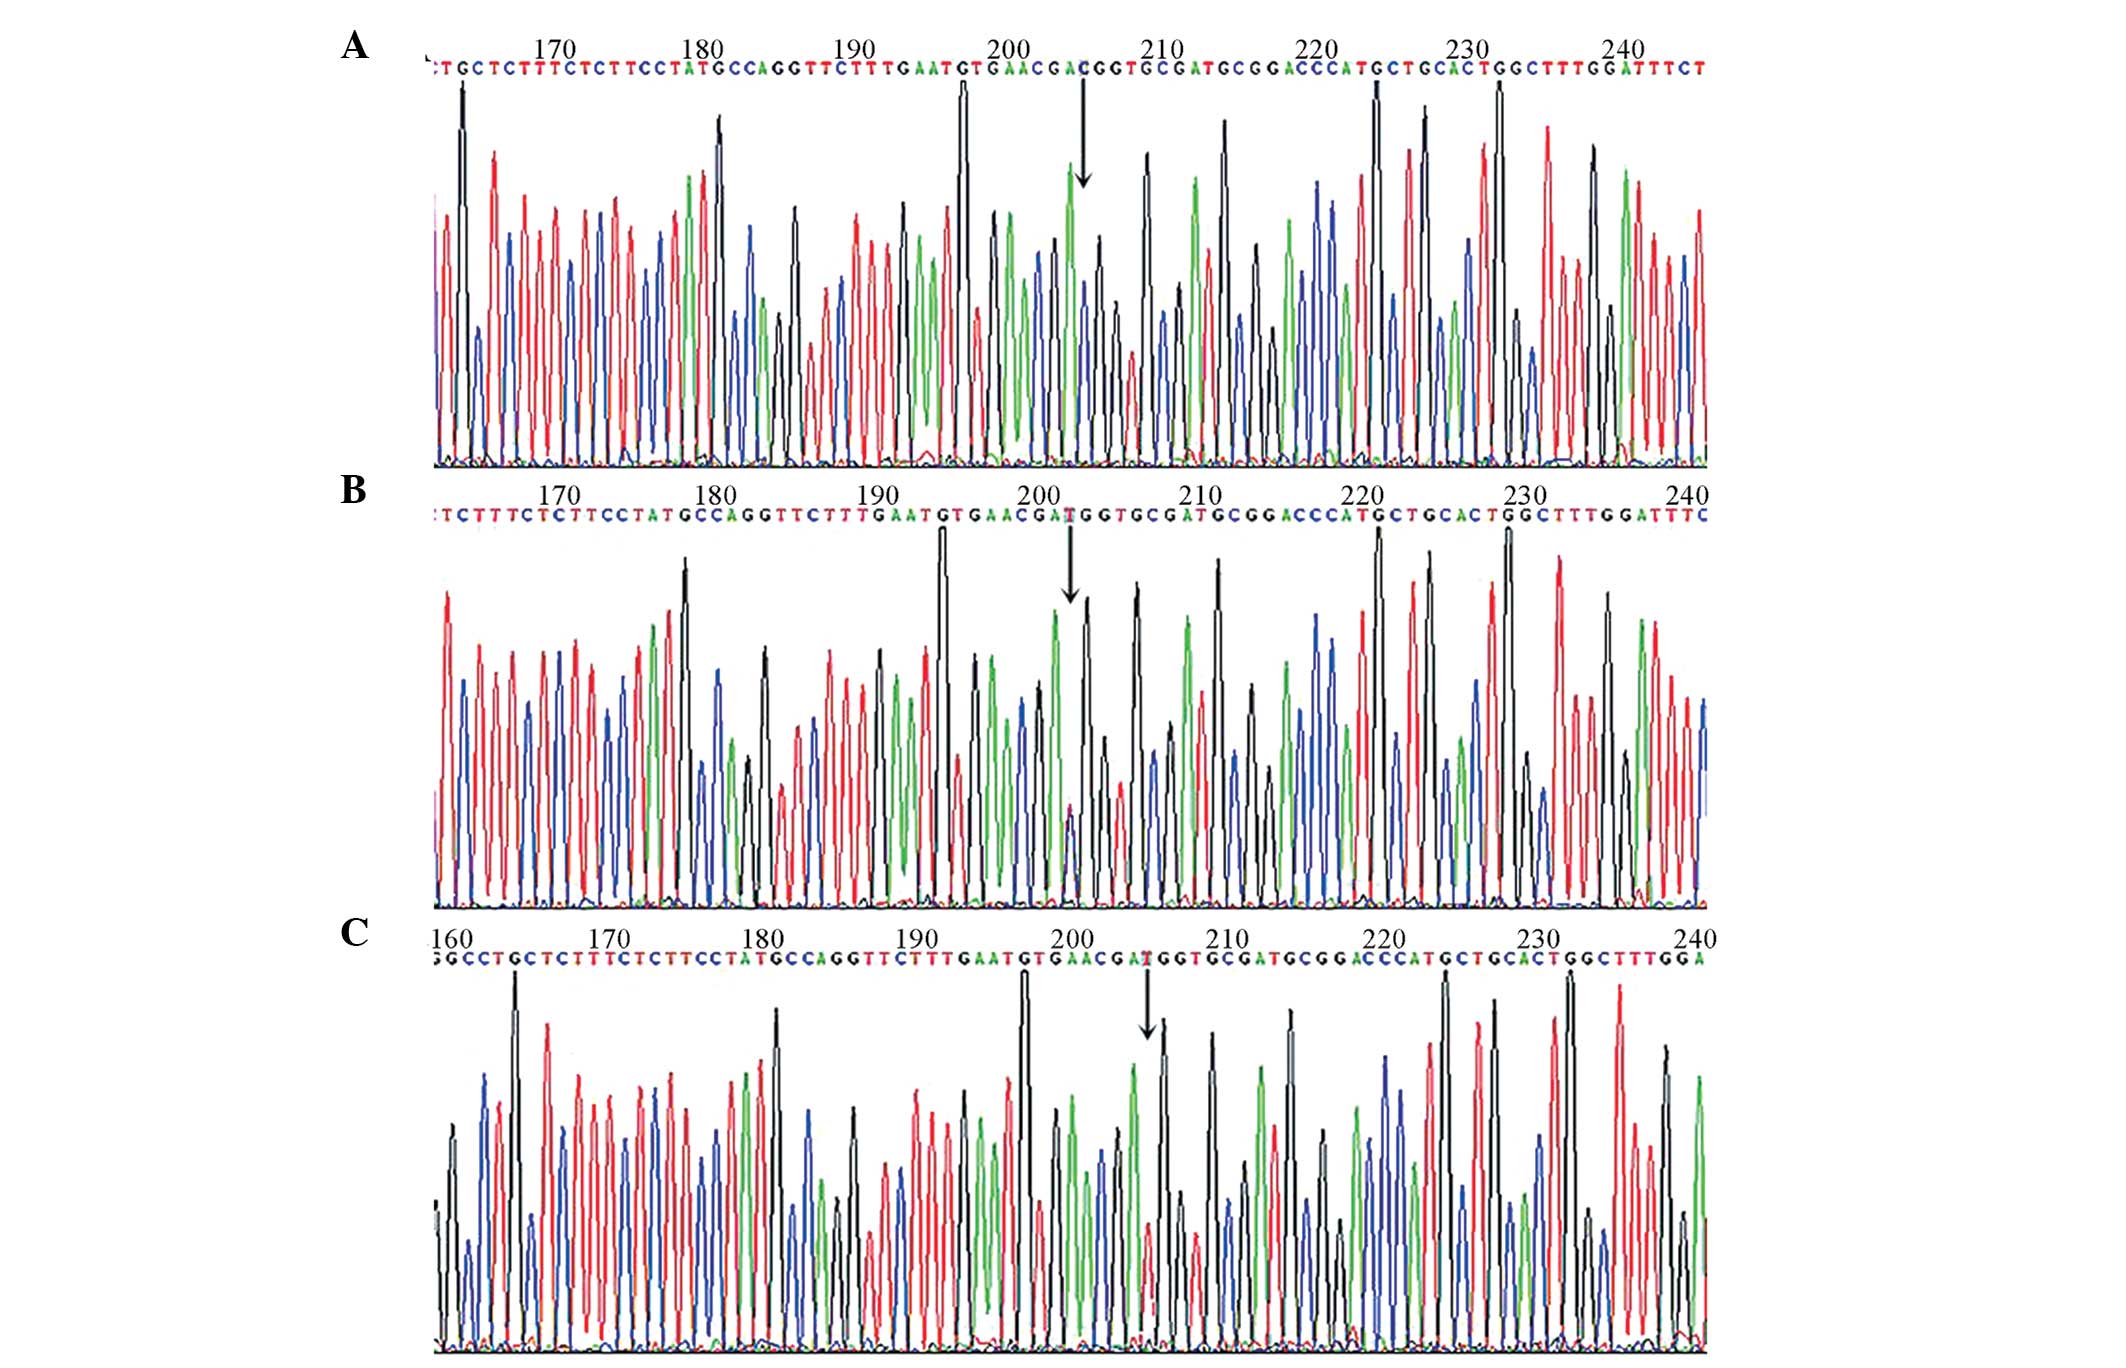
Sequencing results
The HRMA graphs were evaluated via their colored
curves displayed in red, blue and green, with each color
representing a class of sample genotype. One genotype from each
category of samples was selected to be sequenced. Every polymorphic
locus of four polymorphic loci had three color curves, and 12
sample curve charts were produced. The PCR products of 12
representative samples were randomly selected to be sequenced,
encompassing three exons and four polymorphism loci. The sequencing
results provided information regarding the 12 genotypes, consisting
of four polymorphic loci which each containing wild-type
homozygotes, mutant homozygotes and heterozygotes. Through Tg
sequencing, four SNPs were identified: In exon 10, the E10SNP24 T/G
allele (GG, TG, and TT genotypes) and the E10SNP158 T/C allele (CC,
TC and TT genotypes); in exon 12, the E12SNP A/G allele (AA, AG and
GG genotypes); and in exon 33, the E33SNP C/T allele (CC, CT and TT
genotypes). Representative sequence diagrams for the E33SNP
polymorphism (CC, CT or TT) sequenced diagram are shown in Fig. 3A–C.
Statistical results
The frequency distribution of the E10SNP24 (allele
T/G, TG and GG genotypes) and the E12SNP (allele A/G, AG and GG
genotypes), was significantly different between patients with AITD
and healthy controls (P<0.05). The OR values of these genotypes
showed a strong correlation with the disease. The E10SNP24 GG and
TG genotypes, with OR=0.14 for the GG genotype and OR=11.5 for the
TG genotype, and the E12SNP GG and AG genotypes, with OR=4.22 for
the GG genotype and OR=0.23 for the AG genotype, were highly
correlated with the disease. There were no statistically
significant differences in the frequency of E10SNP158 and E33SNP
polymorphisms when comparing healthy controls with AITD patients
(P>0.05) (Table II).
Furthermore, a haplotype analysis of the four Tg polymorphic loci,
E10SNP24, E10SNP158, E12SNP and E33SNP, was performed. There were
seven haplotype combinations of gene polymorphisms that occurred
more frequently in AITD patients than in healthy controls, and
among these, five haplotype combinations were significantly
different (Table III).
| Table IIFrequency distribution of each Tg
allele and Tg genotype in subjects with AITD compared with healthy
controls [n (%)]. |
Table II
Frequency distribution of each Tg
allele and Tg genotype in subjects with AITD compared with healthy
controls [n (%)].
| SNP | Allele/genotype | AITD | Healthy control | χ2 | P-value | OR | 95%CI |
|---|
| E10SNP24 | T | 120 (22.2) | 18 (6.3) | 34.50 | <0.01 | 4.29 | 2.55–7.20 |
| G | 420 (77.8) | 270 (93.7) | 34.50 | <0.01 | 4.29 | 2.55–7.20 |
| TT | 15 (5.6) | 6 (4.2) | 0.38 | 0.54 | 1.35 | 0.51–3.57 |
| TG | 90 (33.3) | 6 (4.2) | 44.85 | <0.01 | 11.50 | 4.89–27.06 |
| GG | 165 (61.1) | 132 (91.6) | 43.24 | <0.01 | 0.14 | 0.08–0.27 |
| E10SNP158 | T | 117 (21.7) | 63 (21.9) | 0.01 | 0.95 | 0.99 | 0.70–1.40 |
| C | 423 (78.3) | 225 (78.1) | 0.01 | 0.95 | 0.99 | 0.70–1.40 |
| TT | 12 (4.5) | 6 (4.2) | 0.02 | 0.90 | 1.07 | 0.39–2.91 |
| TC | 93 (34.4) | 51 (35.4) | 0.04 | 0.84 | 0.96 | 0.63–1.46 |
| CC | 165 (61.1) | 87 (60.4) | 0.02 | 0.89 | 1.03 | 0.68–1.56 |
| E12SNP | A | 54 (10.0) | 75 (26.0) | 36.61 | <0.01 | 0.32 | 0.22–0.47 |
| G | 486 (90.0) | 213 (74.0) | 36.61 | <0.01 | 0.32 | 0.22–0.47 |
| AA | 12 (4.4) | 12 (8.3) | 2.60 | 0.11 | 0.51 | 0.22–1.17 |
| AG | 30 (11.1) | 51 (35.4) | 35.25 | <0.01 | 0.23 | 0.14–0.38 |
| GG | 228 (84.4) | 81 (56.3) | 39.44 | <0.01 | 4.22 | 2.65–6.73 |
| E33SNP | C | 489 (90.6) | 258 (89.6) | 0.20 | 0.65 | 1.12 | 0.69–1.79 |
| T | 51 (9.4) | 30 (10.4) | 0.20 | 0.65 | 1.12 | 0.69–1.79 |
| CC | 234 (86.7) | 123 (85.4) | 0.12 | 0.73 | 1.11 | 0.62–1.98 |
| CT | 21 (7.8) | 12 (8.3) | 0.04 | 0.84 | 0.93 | 0.44–1.94 |
| TT | 15 (5.5) | 9 (6.3) | 0.08 | 0.77 | 0.88 | 0.38–2.07 |
| Table IIITg haplotype gene SNP portfolio
analysis of the frequency between the disease and healthy control
groups [n (%)]. |
Table III
Tg haplotype gene SNP portfolio
analysis of the frequency between the disease and healthy control
groups [n (%)].
| E10 SNP 24 | ENP SNP 158 | E12SNP | E33SNP | Hypothyroidism
(n=81) | Graves' disease
(n=78) | HT (n=111) | Healthy control
(n=144) |
|---|
| G | C | G | C | 27 (33.3) | 30 (38.5) | 36 (32.4)a | 66 (45.8) |
| G | C | A | C | 6 (7.4) | 6 (7.7) | 6 (5.4) | 9 (6.3) |
| G | T | A | C | 6 (7.4)b | 6 (7.7)b | 9 (8.1)b | 39 (27.1) |
| G | T | G | C | 9 (11.1) | 15 (19.2)b | 21 (18.9)b | 9 (6.3) |
| T | T | G | C | 12 (14.9)b | 6 (7.7) | 15 (13.5) | 6 (4.2) |
| T | C | A | C | 6 (7.4) | 6 (7.7) | 6 (5.4) | 9 (6.3) |
| T | C | G | C | 15 (18.5)b | 9 (11.5)a | 18 (16.2)b | 6 (4.2) |
The haplotype combination of gene polymorphisms was
not significantly different between the different disease
sub-groups (P>0.05). Certain gene polymorphism combinations were
most likely to occur more frequently amongst AITD patient groups:
Disease-linked haplotypes (denoted as E10SNP24 - E10SNP158 - E12SNP
- E33SNP) were present in the primary hypothyroidism group
(G-T-A-C, T-T-G-C and T-C-G-C), the hyperthyroidism group (G-T-A-C,
G-T-G-C and T-C-G-C) and the Hashimoto's disease group (G-C-G-C,
G-T-A-C, G-T-G-C and T-C-G-C); compared with those in the healthy
controls, these haplotypes were significantly different
(P<0.05). The odds ratios for these haplotypes showed various
degrees of association with the disease (Table III).
The present study also compared the E33SNP of the Tg
gene between the healthy Han population from the Northern regions
of Henan province with those from a population from the Xi'an
region of Shaanxi province. Results of the statistical analysis of
these two Han populations are shown in Table IV. Xi'an data were published
previously The present study used HRMA to assess the Tg gene E33SNP
in a Han population from Northern Henan, showing that the C allele
frequency in the Tg exon 33 SNP was 89.6%, and the locus was
dominated by the CC genotype with a frequency of 85.4%.
| Table IVComparison of the frequency of the
thyroglobulin exon 33 single-nucleotide polymorphism between
healthy Han people in North Henan with those in the Xi'an region of
Shaanxi [n (%)]. |
Table IV
Comparison of the frequency of the
thyroglobulin exon 33 single-nucleotide polymorphism between
healthy Han people in North Henan with those in the Xi'an region of
Shaanxi [n (%)].
|
Allele/genotype | North Henan
(HRMA) | Xi'an (RFLP) | X2 | P-value |
|---|
| C | 258 (89.6) | 163 (76.9) | 14.797 | <0.001 |
| T | 30 (10.4) | 49 (23.1) | 14.797 | <0.001 |
| CC | 123 (85.4) | 65 (61.3) | 19.008 | <0.001 |
| CT | 12 (8.3) | 33 (31.1) | 21.501 | <0.001 |
| TT | 9 (6.3) | 8 (7.5) | 0.162 | 0.687 |
Discussion
Thyroglobulin is not only a major protein component
of thyroid tissue, but also one of the major AITD autoantigens. Tg
has an important role in the pathogenesis of AITD (24,25).
The Tg gene is a susceptibility gene for AITD (3–5), and
SNPs in the Tg gene were correlated with AITD in animals and humans
(3–5). The present study used the HRMA method
to detect Tg SNPs; the HRMA method is simple, accurate, economical,
rapid, high-throughput, and can be widely used for the detection of
disease-associated gene SNPs and mutations. The HRMA method uses
fluorescent probes to examine the differing dissolution profiles of
PCR products of different genotypes, based on the different base
pairing in homozygous and heterozygous sequences, leading to
different melting curves from low to high temperatures, thereby
easily distinguishing alleles by detecting a change in the
fluorescence signal (15).
The present study found four alleles in the Tg gene
in a Han Chinese population, as well as twelve associated
genotypes; the distribution frequencies of E10SNP24 (TG and GG
genotypes) and E12SNP (AG and GG genotypes) were significantly
different between patients with AITD and healthy controls.
Haplotype allele combinations in the primary hypothyroidism group
(including G-T-A-C, T-T-G-C and T-C-G-C), hyperthyroidism group
(including G-T-A-C, G-T-G-C and T-C-G-C) and Hashimoto's disease
group (including G-C-G-C, G-T-A-C, G-T-G-C and T-C-G-C) were
significantly correlated with the disease. These alleles, genotypes
and haplotype combinations of alleles showed a strong correlation
with AITD. However, combinations of haploid genes between disease
groups were not significantly different.
The results of the present study are not in line
with the results of a study by Zhang et al (26), who found that the differences in
distribution of allele frequencies between AITD cases and healthy
controls were not statistically significant, and that the only
haplotype correlation was between the G-C-A-C haplotype and
Hashimoto's disease. By contrast, the present study identified nine
haplotypes to be correlated with various forms of AITD. The results
of the present study may differ from those of Zhang et al
(26), who used the
PCR-restriction fragment length polymorphism (RFLP) method, due to
a different experimental approach, or the existence of regional
differences in the population; the specific reasons require to be
confirmed in further studies. The present study utilized the HRMA
method for detecting Tg gene SNPs and studied Tg exon SNPs in a Han
Chinese population from the Northern region of Henan. In this
population, the presence of E10SNP24 T/G, E10SNP158 T/C, E12SNP A/G
and E33SNP C/T was confirmed, consistent with the study by Zhang
et al (26). The present
study showed that the C-allele frequency in the Tg exon 33 SNP was
89.6% in the study population, and the locus was dominated by the
CC genotype with a frequency of 85.4%. The CC and CT genotypes in
the E33SNP showed statistically significant differences in the
distribution of frequencies (P<0.05), the TT genotype was not
significantly different between groups (P>0.05). By contrast, a
C-allele frequency of 76.9% and a CC-genotype frequency of 61.3%
were reported by Zhang et al (26). Prior to the present study, a
preliminary study performed by our group confirmed the existing
regional distribution of SNP frequencies in the Tg gene of a
Chinese Han population. The frequency of the TG exon 33 SNP C
allele was reported to be 53.9% in Caucasians, with a TC genotype
frequency of >45% (5); these
data further confirm the differing gene polymorphism frequencies in
different regions and ethnic groups.
In conclusion, the present study provided molecular
evidence at the DNA level to link Tg polymorphisms with AITD.
Acknowledgments
The present study was supported by a grant from the
National Natural Science Foundation of China (grant no.
31371332).
References
|
1
|
Zhang MX and Wu YQ: The Diagnosis and
Treatment of Thyroid Disease. 1st. Pharmaceutical Science and
Technology Publishing House; Beijing: pp. 38–42. 2006, In
Chinese.
|
|
2
|
Tomer Y and Davies TF: Searching for the
autoimmune thyroid disease susceptibility genes: From gene mapping
to gene function. Endocr Rev. 24:694–717. 2003. View Article : Google Scholar : PubMed/NCBI
|
|
3
|
Ban Y, Greenberg DA, Concepcion E,
Skrabanek L, Villanueva R and Tomer Y: Amino acid substitutions in
the thyroglobulin gene are associated with susceptibility to human
and murine autoimmune thyroid disease. Proc Natl Acad Sci USA.
100:15119–15124. 2003. View Article : Google Scholar : PubMed/NCBI
|
|
4
|
Ban Y, Tozaki T, Taniyama M, Tomita M and
Ban Y: Association of a thyroglobulin gene polymorphism with
Hashimoto's thyroiditis in the Japanese population. Clin Endocrinol
(Oxf). 61:263–268. 2004. View Article : Google Scholar
|
|
5
|
Collins JE, Heward JM, Howson JM, Foxall
H, Carr-Smith J, Franklyn JA and Gough SC: Common allelic variants
of exons 10,12 and 33 of the thyroglobulin gene are not associated
with autoimmune thyroid disease in the United Kingdom. J Clin
Endocrinol Metab. 89:6336–6339. 2004. View Article : Google Scholar : PubMed/NCBI
|
|
6
|
Orita M, lwahana H, Kanazawa H, Hayashi K
and Sekiya T: Detection of polymorphisms of human DNA by gel
electrophoresis as single-strand conformation polymorphisms. Proc
Natl Acad Sci USA. 86:2766–2770. 1989. View Article : Google Scholar : PubMed/NCBI
|
|
7
|
Lerman LS and Silverstein K: Computational
simulation of DNA melting and its application to denaturing
gradient gel electrophoresis. Methods Enzymol. 155:482–501. 1987.
View Article : Google Scholar : PubMed/NCBI
|
|
8
|
Xiao W and Oefner PJ: Denaturing
high-performance liquid chromatography: A review. Hum Mutat.
17:439–474. 2001. View Article : Google Scholar : PubMed/NCBI
|
|
9
|
Li Q, Liu Z, Monroe H and Culiat CT:
Integrated platform for detection of DNA sequence variants using
capillary array electrophoresis. Electrophoresis. 23:1499–1511.
2002. View Article : Google Scholar : PubMed/NCBI
|
|
10
|
Böcker S: Simulating multiplexed SNP
discovery rates using base-specific cleavage and mass spectrometry.
Bioinformatics. 23:e5–e12. 2007. View Article : Google Scholar : PubMed/NCBI
|
|
11
|
Liao Y, Wang X, Sha C, Xia Z, Huang Q and
Li Q: Combination of fluorescence color and melting temperature as
a two-dimensional label for homogeneous multiplex PCR detection.
Nucleic Acids Res. 41:e762013. View Article : Google Scholar : PubMed/NCBI
|
|
12
|
Wang CZ, Lin J, Qian J, Shao R, Xue D,
Qian W, Xiao GF, Deng ZQ, Yang J, Li Y, et al: Development of
high-resolution melting analysis for the detection of the MYD88
L265P mutation. Clin Biochem. 46:385–387. 2013. View Article : Google Scholar
|
|
13
|
Tindall EA, Petersen DC, Woodbridge P,
Schipany K and Hayes VM: Assessing high-resolution melt curve
analysis for accurate detection of gene variants in complex DNA
fragments. Hum Mutat. 30:876–883. 2009. View Article : Google Scholar : PubMed/NCBI
|
|
14
|
Pang Y, Zhou Y, Wang S, Lu J, Lu B, He G,
Wang L and Zhao Y: A novel method based on high resolution melting
(HRM) analysis for MIRU-VNTR genotyping of Mycobacterium
tuberculosis. J Microbiol Methods. 86:291–297. 2011. View Article : Google Scholar : PubMed/NCBI
|
|
15
|
Vossen RH, Aten E, Roos A and den Dunnen
JT: High-resolution melting analysis (HRMA): More than just
sequence variant screening. Hum Mutat. 30:860–866. 2009. View Article : Google Scholar : PubMed/NCBI
|
|
16
|
de Juan Jiménez I, Cardeñosa EE, Suela SP,
González EB, Trejo DS, Lluch OF and Gilabert PB: Advantage of
high-resolution melting curve analysis over conformation-sensitive
gel electrophoresis for mutational screening of BRCA1 and BRCA2
genes. Clin Chim Acta. 412:578–582. 2011. View Article : Google Scholar
|
|
17
|
Minucci A, Canu G, Gentile L, Zuppi C,
Giardina B and Capoluongo E: Small amplicons high resolution
melting analysis (SA-HRMA) allows successful genotyping of acid
phosphatase 1 (ACP1) polymorphisms in the Italian population. Clin
Chim Acta. 416:86–91. 2013. View Article : Google Scholar
|
|
18
|
Liu SM, Xu FX, Shen F and Xie Y: Rapid
genotyping of APOA5-1131T>C polymorphism using high resolution
melting analysis with unlabeled probes. Gene. 498:276–279. 2012.
View Article : Google Scholar : PubMed/NCBI
|
|
19
|
Zhou L, Errigo RJ, Lu H, Poritz MA, Seipp
MT and Wittwer CT: Snapback primer genotyping with saturating DNA
dye and melting analysis. Clin Chem. 54:1648–1656. 2008. View Article : Google Scholar : PubMed/NCBI
|
|
20
|
Martín-Núñez GM, Gómez-Zumaquero JM,
Soriguer F and Morcillo S: High resolution melting curve analysis
of DNA samples isolated by different DNA extraction methods. Clin
Chem Acta. 413:331–333. 2012. View Article : Google Scholar
|
|
21
|
Rajaei M, Saadat I and Saadat M: High
resolution melting analysis for detection of variable number of
tandem repeats polymorphism of XRCC5. Biochem Biophys Res Commun.
425:398–400. 2012. View Article : Google Scholar : PubMed/NCBI
|
|
22
|
Wang TY, Wang L, Zhang JH and Dong WH: A
simplified universal genomic DNA extraction protocol suitable for
PCR. Genet Mol Res. 10:519–525. 2011. View Article : Google Scholar : PubMed/NCBI
|
|
23
|
Orgiazzi J: Autoimmune thyroid diseases,
an overview. Rev Prat. 64:822–824. 2014.In French. PubMed/NCBI
|
|
24
|
Okosieme OE, Parkes AB, Premawardhana LD,
Evans C and Lazarus JH: Thyroglobulin: Current aspects of its role
in autoimmune thyroid disease and thyroid cancer. Minerva Med.
94:319–330. 2003.
|
|
25
|
Okosieme OE, Premawardhana LD, Jayasinghe
A, Kaluarachi WN, Parkes AB, Smyth PP, Lejeune PJ, Ruf J and
Lazarus JH: Thyroglobulin autoantibodies in iodized subjects:
relationship between epitope specificities and longitudinal
antibody activity. Thyroid. 15:1067–1072. 2005. View Article : Google Scholar : PubMed/NCBI
|
|
26
|
Zhang JA, Maier-Haba, Yu ZY, Xiao WX and
Wang Y: Association of thyroglobulin gene polymorphisms with
auto-immune thyroid diseases. J Fouth Mil Med Univ. 27:17482006.In
Chinese.
|