Introduction
Metabolic syndrome (MS) is considered to be a
clustering of metabolic alterations conferring a high risk of
developing type-2 diabetes (T2D) and cardiovascular disease (CVD)
(1,2). The prevalence of MS has markedly
increased worldwide due to modern lifestyles and an increased
consumption of high-sugar diets, in particular fructose (3). Previous data suggests that fructose
consumption in humans results in increased visceral adiposity,
lipid dysregulation and reduced insulin sensitivity, all of which
have been associated with increased risk for CVD and T2D (4). Fructose has become an important
causative factor in the development of MS (4,5). The
fructose-fed rat is therefore used as an animal model for insulin
resistance, and is considered to mirror MS observed in humans
(6). Animal studies have
demonstrated that rats fed a high-fructose (HF) diet exhibit
hepatic oxidative damage and an altered lipid metabolism due to
hepatic stress as a result of the burden on the fructose metabolism
(7).
Previous studies have focused upon types of seafood
that may be beneficial in preventing MS and possibly reducing the
risk of various diseases (8,9). The
reduced incidence of CVD among populations consuming fish-rich
diets has been attributed to a greater proportion of omega 3
polyunsaturated fatty acids in fish oil (10–12).
There is evidence that the type of protein in the diet may serve an
important role in the secretion of insulin by the pancreas
(13) and in the regulation of
hepatic lipogenesis mediated by sterol regulatory element binding
protein-1 (14). In previous
animal studies regarding the health effects of fish protein, fish
proteins have been demonstrated to prevent insulin resistance in
high-fat fed obese rats (15,16),
and diminish the development of high blood pressure and
hypercholesterolemia (17,18). Furthermore, in insulin resistant
males and females the consumption of a cod protein diet for 4 weeks
improved insulin sensitivity compared with a diet of lean beef,
pork, veal, eggs, milk and milk products (19).
The objective of the current study was to
investigate the specific effect of the type of dietary protein on
insulin resistance, plasma glucagon-like peptide-1 (GLP-1), in
addition to oxidative stress in the tissues of HF-fed rats.
Materials and methods
Preparation of sardine protein
Fish protein was isolated from sardine fillets
obtained from a fishery (Oran, Algeria). The heads, internal organs
and bones of the sardines were removed. The proteins of the muscle
tissue were then solubilized in 10 volumes of water with NaOH
(Sigma-Aldrich, St. Louis, MO, USA) added to obtain pH 10.5
according to the method outlined by Undeland et al (20). The mixture was centrifuged (18,000
x g, 20 min, 4°C), causing the light oil fraction to rise to the
top of the suspension, then the muscle proteins were precipitated
and collected. The crude protein content was determined by the
Kjeldahl method (21). The crude
fat content was measured by the Soxhlet method (22). The moisture content was calculated
as the loss in weight following drying at 105°C for 24 h. The ash
amount was analyzed by direct ignition at 550°C for 24 h. The amino
acid composition of the sardine protein, as determined through
analysis by a commercial service (Institute of Chemistry, Center
for Technical and Scientific Research in Physical-Chemical
Analysis, Algiers, Algeria), is presented in Table I.
 | Table IAmino acid composition of dietary
proteins (g/100 g protein). |
Table I
Amino acid composition of dietary
proteins (g/100 g protein).
| Amino acids | Casein | Sardine
protein |
|---|
| Alanine | 2.9 | 6.8 |
| Arginine | 3.5 | 5.5 |
| Cystine (eine) | 0.4 | 1.2 |
| Glycine | 1.7 | 4.3 |
| Histidine | 2.9 | 2.0 |
| Methionine | 2.8 | 2.9 |
| Leucine | 8.9 | 9.2 |
| Serine | 4.9 | 3.4 |
| Tyrosine | 5.3 | 4.2 |
| Valine | 6.4 | 4.4 |
| Isoleucine | 5.2 | 4.2 |
| Lysine | 7.6 | 9.4 |
| Phenylalanine | 4.8 | 3.6 |
| Glutamic acid | 20.2 | 17.2 |
| Aspartic acid | 6.7 | 10.4 |
| Tryptophan | 1.2 | 1.2 |
| Proline | 10.6 | 4.1 |
| Threonine | 3.9 | 4.3 |
|
Lysine/arginine | 2.17 | 1.70 |
Animals and diets
A total of 24 male Wistar rats obtained from
Iffa-Credo (l'Arbresle, France) weighing 190–200 g at the beginning
of the experiment were used for the current study. The rats were
kept in a laboratory animal house with a 12 h light:dark cycle
(07:00–19:00). Throughout the experiment, the temperature of the
animal room was maintained at 24°C and humidity at 60%. Rats were
assigned to four equal-weight groups and fed the following diets
for 2 months: Group 1 (C-HF), diet containing 20% casein (C) and
64% fructose (Prolabo, Paris, France); group 2 (S-HF), 20% sardine
protein and 64% fructose; group 3 (C), 20% casein; group 4 (S), 20%
sardine protein. The compositions of the experimental diets are
presented in Table II. Diets were
isoenergetic (16.28 MJ/kg) and contained identical amounts of
lipids, vitamins (UAR 200; UAR, Villemoisson-sur-Orge, France),
minerals (UAR 205 B; UAR) and fiber. Food and water were provided
ad libitum. The body weights of the animals were recorded
every week and food intake was measured daily. The food efficiency
ratio was calculated as follows: Weight gain (g) / food intake (g),
where weight gain was calculated as the difference between the
final weight and the initial weight of each rat during the 60-day
experiment and food intake was determined as the difference between
the rest amount of food and the amount of food administered for
each rat during the 60-day experiment. The glycemia was measured
weekly using a handheld glucometer (Accu-Chek Aviva; Roche
Diagnostics, Basel, Switzerland) with blood obtained from the
caudal vein. The general guidelines for the Care and Use of
Laboratory Animals as set forth by the Council of European
Communities were followed (23).
| Table IIComposition of the experimental
diets. |
Table II
Composition of the experimental
diets.
| Ingredient | C (g/kg diet) | S (g/kg diet) | C-HF (g/kg
diet) | S-HF (g/kg
diet) |
|---|
| C | 200 | – | 200 | – |
| S | – | 200 | – | 200 |
| Fructose | – | – | 640 | 640 |
| Corn starch | 590 | 590 | – | – |
| Sucrose | 50 | 50 | – | – |
| Sunflower oil | 50 | 50 | 50 | 50 |
| Cellulose | 50 | 50 | 50 | 50 |
| Vitamin (UAR
200) | 20 | 20 | 20 | 20 |
| Mineral (UAR 205
B) | 40 | 40 | 40 | 40 |
Blood, urine and tissue samples
At the end of the experimental period, the rats were
sacrificed by anesthesia using intraperitoneal injection of sodium
pentobarbital (60 mg/kg body weight; Abbott Laboratories, North
Chicago, IL, USA) following overnight starvation. Blood samples
were collected from the abdominal aorta in citric acid tubes, and
the plasma was separated by centrifugation (3,000 × g, 15 min, 4°C)
and stored at -70°C until required for chemical analysis. Liver,
kidney, heart and gastrocnemius muscle tissues were harvested,
washed with ice-cold 150 mmol/l NaCl (Sigma-Aldrich), weighed and
immediately frozen at -70°C until required for analysis. Urine
samples were collected on day 59 of the experiment in the four
groups.
Analytical procedures
Plasma glucose was analyzed by the method previously
described by Bergmeyer et al (24). Insulin in plasma was measured by
radioimmunoassay according to Leclercq-Meyer et al (25). These measurements were used to
calculate the homeostasis model assessment (HOMA) index
(mmol/l/22.5): [The product of the plasma insulin concentration
(mmol/l) × plasma D-glucose concentration (mmol/l)]. GLP-1 level
was measured in plasma using a GLP-1 (Active) ELISA kit (BioVendor
Research and Diagnostic Products, Karasek, Czech Republic). Plasma
fructose levels were determined enzymatically using a BioSentec
Glucose/Fructose/Sucrose kit (BioSentec, Toulouse, France). Protein
concentrations were measured according to the method of Lowry et
al (26) using bovine serum
albumin (Sigma-Aldrich) as a standard. Plasma and urine creatinine,
uric acid and albumin levels were determined using an enzymatic
Spinreact Colorimetric Kinetic Jaffé kit (cat. no. 1001110), a
Uricase-POD Spinreact Enzymatic Colorimetric kit (cat. no.
1001011), and a Bromocresol Green Spinreact Colorimetric kit (cat.
no. 1001020; Spinreact, Girona, Spain).
Tissue analysis
The level of lipid peroxidation in the liver,
kidney, heart and muscle tissues was studied by measuring
thiobarbituric acid reactive substances (TBARS) in tissue
homogenates using the method of Quintanilha et al (27). For TBARS measurement, the tissue
homogenates were deproteinized with 10% trichloroacetic acid (TCA)
(Sigma-Aldrich) and the precipitate was treated with thiobarbituric
acid (Sigma-Aldrich) at 90°C for 1 h. The pink color formed gave a
measure of the TBARS. The concentration was expressed as
µmol/g tissue. Additionally, liver, kidney, heart and muscle
hydroperoxides were assayed using the method described by Eymard
& Genot (28). The color
developed was read at 560 nm using a Beckman Coulter DU 640
spectrophotometer (Beckman Coulter, Inc., Cridersville, OH, USA).
The concentration was expressed as µmol/g tissue. The level
of protein carbonyl was measured by the method of Levine et
al (29). The tissue was
homogenized in 10 mM HEPES buffer (Sigma-Aldrich) containing 137 mM
NaCl, 4.0 mM potassium chloride, 1.0 mM potassium dihydrogen
phosphate and 0.6 mM magnesium sulfate (Sigma-Aldrich). The
homogenate was centrifuged at 40,000 × g for 20 min at 25°C. The
supernatant was mixed with dinitrophenyl hydrazine in 2M
hydrochloric acid and allowed to stand at room tempera ture for 1
h. The protein hydrazone derivative was precipitated with TCA and
the precipitate was washed three times with ethanol ethylacetate
(1:1) (Sigma-Aldrich). The color in the supernatant was read at 390
nm using a Beckman Coulter DU 640 spectrophotometer. The
concentrations were expressed as nmol/g tissue. Tissue nitric oxide
(NO) was assessed using the Griess reagent (sulfanilamide and
N-naphthyl ethylenediamine) (30).
Tissue homogenates were clarified by zinc sulfate solution
(Sigma-Aldrich), NO3 (Sigma-Aldrich) was then reduced to
NO2 by cadmium (Sigma-Aldrich) overnight at 20°C under
agitation. Samples were added to the Griess reagent and incubated
for 20 min at room temperature. The absorbance of these solutions
was measured at 540 nm using a Beckman Coulter DU 640
spectrophotometer. Sodium nitrite (Sigma-Aldrich) was used for the
standard curve. The data were expressed as µmol/g
tissue.
Antioxidant enzyme activity
Liver, kidney, heart and muscle tissue homogenates
prepared on ice at a ratio of 1 g wet tissue to 9 ml 150 mmol/l KCl
using a POLYTRON® PT 2100 homogenizer (Kinematica AG,
Lucerne, Switzerland), were used for superoxide dismutase (SOD; EC
1.15.1.1), glutathione peroxidase (GSH-Px; EC 1.11.1.9) and
catalase (CAT; EC 1.11.1.6) determinations. Tissue SOD activity was
determined using a SOD and GSH-Px Reagent Assay Cayman Chemical kit
(Cayman Chemical Company, Ann Arbor, MI, USA). Briefly, the method
uses xanthine and xanthine oxidase to generate superoxide radicals,
which react with 2-(4-iodophenyl)-3-(4-nitrophenyl)-5-phenyl
tetrazolium chloride to form a formazan dye. The SOD activity was
measured by the degree of inhibition of the reaction, using a
spectrophotometer. The results were expressed as U/mg of protein.
CAT activity was determined according to the method described by
Aebi (31) and the results were
expressed as nmol/mg of protein. Tissue GPH-Px activity was
measured using an enzymatic method with a kit from Cayman Chemical
Company. The data were expressed in nmol/min/mg of protein.
Liver α-tocopherol and ascorbic acid
levels
Liver α-tocopherol levels were determined by the
method as described by Baker et al (32). The level of α-tocopherol was
estimated by the reduction of ferric ions to ferrous ions by
α-tocopherol and the formation of a red-colored complex with
2,2-dipyridyl was measured at 520 nm using a Beckman Coulter DU 640
spectrophotometer. Ascorbic acid concentrations were measured using
a LiChrospher 100 RP18 high performance liquid chromatography
instrument (EMD Millipore, Billerica, MA, USA).
Statistical analysis
Values are presented as the mean ± standard
deviation of six rats per group. Statistical analysis of the data
was conducted with Statistica software, version 6 (Dell Software,
Aliso Viejo, CA, USA). Data were analyzed using two way analysis of
variance with the type of protein and fructose as independent
variables. When the interaction was significant, Fisher's protected
least significant difference test was performed. P<0.05 was
considered to indicate a statisti cally significant difference.
Results
Energy intake and tissues weights
Following 8 weeks of feeding, the HF-fed rats were
significantly heavier than the control rats, despite a low
cumulative energy intake over the 8 weeks of study (P<0.05;
Table III). Consequently, food
efficiency was significantly higher (P<0.05) in HF-fed animals
as compared with control animals. Consistent with this, the weights
of the liver, kidney and heart were greater in rats on the HF diets
compared with control rats. The constituents (g/100 g) of the
protein obtained by these operations were 93 g protein, 0.9 g
lipids, 2.5 g ash and 3.6 g moisture. Rats on sardine protein diets
gained less weight and had reduced food and energy intakes than
those fed casein diets. The liver weight was significantly reduced
with S and S-HF diets, while heart, kidney and skeletal muscle
weights were not significantly different among HF rats with any of
the protein sources.
| Table IIIGrowth parameters of experimental and
control rats. |
Table III
Growth parameters of experimental and
control rats.
| Variables | Diets
| Analysis of
variance (P values)
|
|---|
| C | S | C-HF | S-HF | Prot | Fru | Prot x Fru |
|---|
| Energy intake
(kJ/day) | 392.34±36.52 |
320.62±20.16a | 294.26±3.05b |
269.95±16.40ab | P<0.05 | P<0.05 | P<0.05 |
| Body weight gain
(g/8 weeks) | 144.90±10.16 |
119.97±16.49a | 160.12±9.17b | 133.00±9.45ab | P<0.05 | P<0.05 | P<0.05 |
| Food
efficiency | 0.10±0.005 | 0.10±0.009 | 0.14±0.008b | 0.14±0.01b | NS | P<0.05 | NS |
| Tissue absolute
weight (g) | | | | | | | |
| Liver | 9.67±1.23 | 7.60±0.73a | 10.73±0.62b | 9.89±0.49ab | P<0.05 | P<0.05 | P<0.05 |
| Kidney | 1.82±0.24 | 1.58±0.20 | 2.22±0.21b | 2.26±0.07b | NS | P<0.05 | NS |
| Heart | 0.76±0.04 | 0.70±0.05 | 0.92±0.10b | 0.88±0.16b | NS | P<0.05 | NS |
| Muscle | 1.50±0.06 | 1.63±0.13 | 1.78±0.15b | 1.55± 0.08a | NS | P<0.05 | P<0.05 |
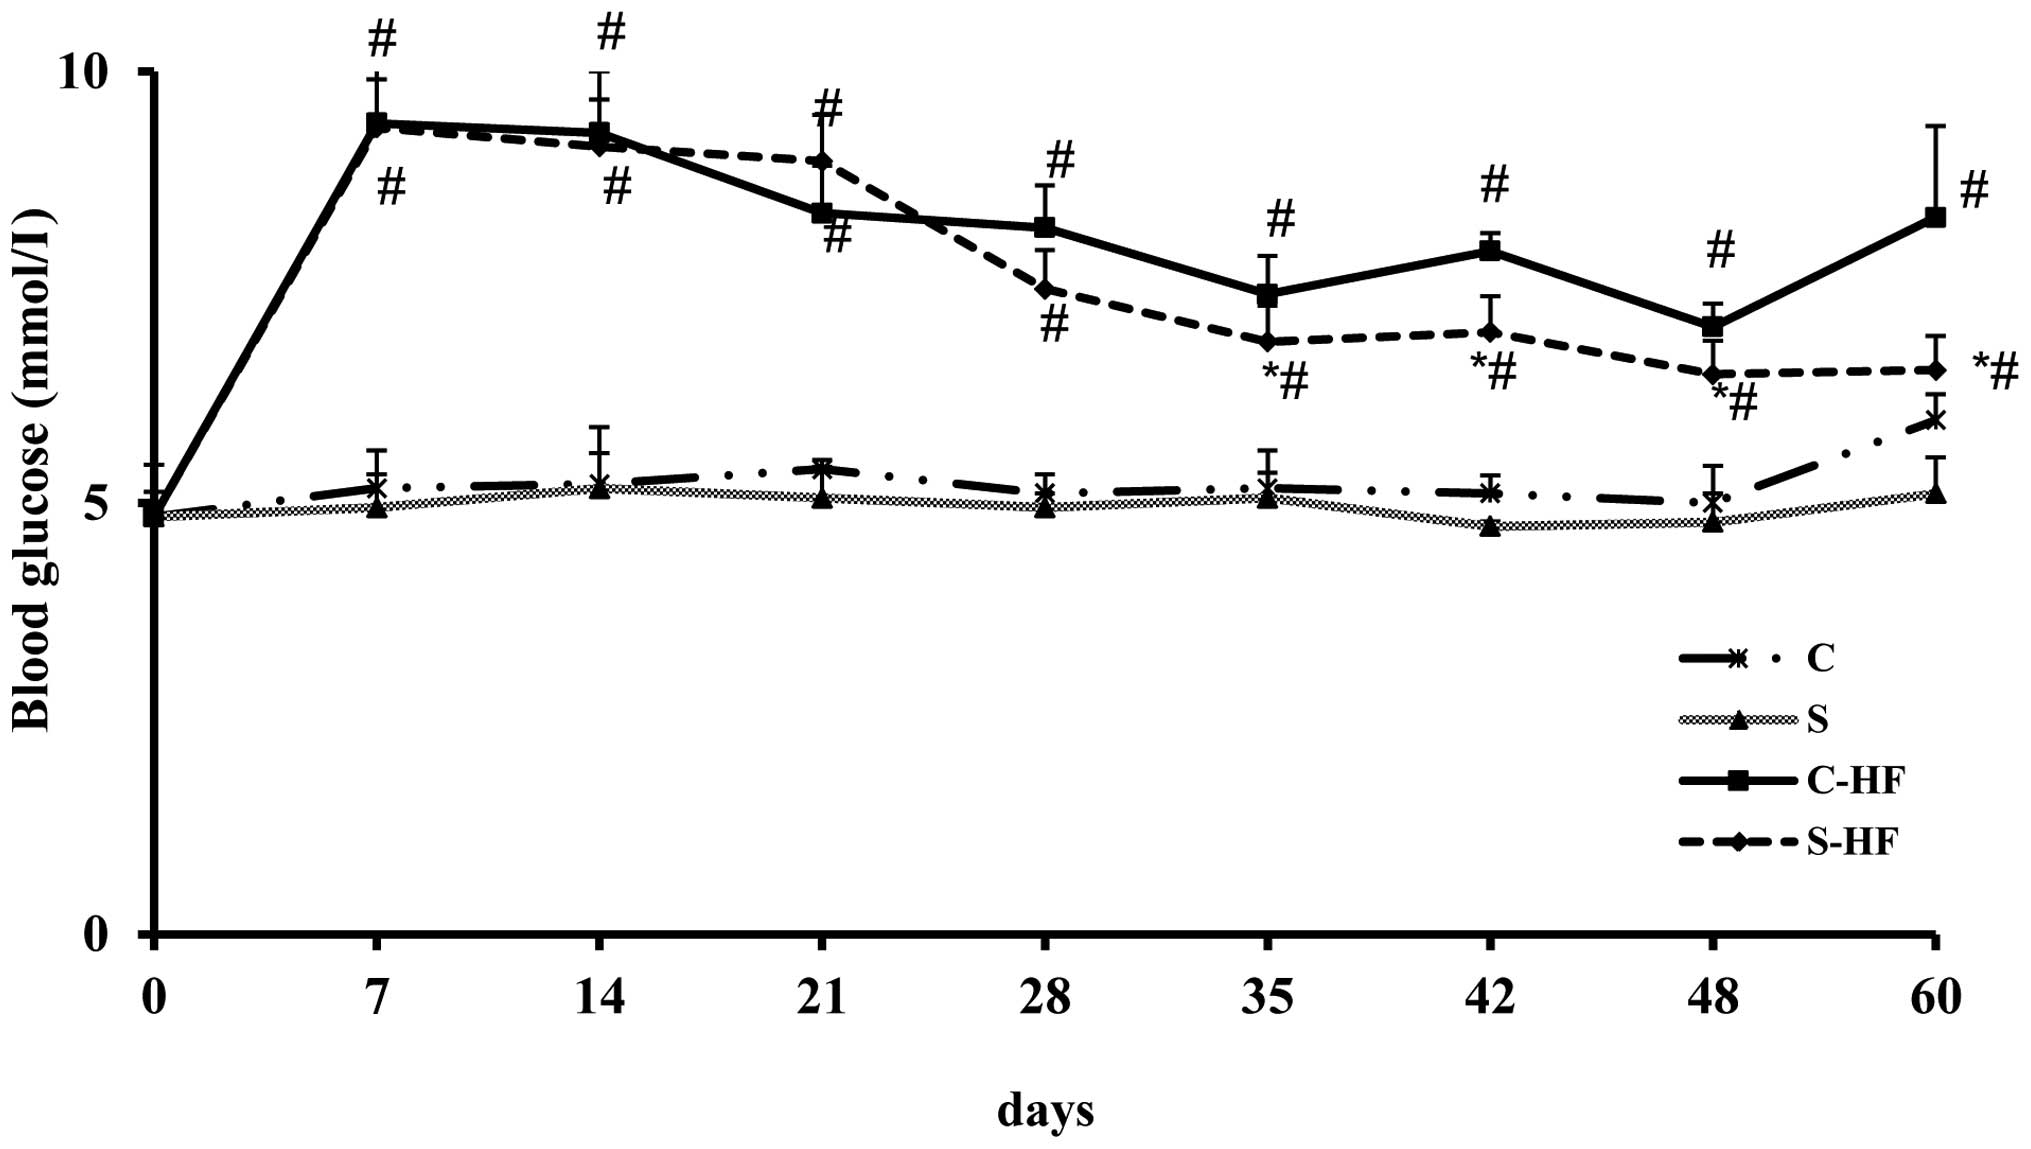
Time course of blooD-glucose
The results of the time course of glycemia assessed
in the rats is presented in Fig.
1. Rats receiving HF diets exhibited significantly higher
blooD-glucose levels at 7, 14, 21, 28, 35, 42, 48 and 60-days
compared with control diets. In S-HF rats, the glycemia was
significantly reduced at 35, 42, 48 and 60-days of the experiment
compared with C-HF rats. In addition, the values recorded in the S
group were significantly reduced at days 48 and 60 compared with
the C group. However, the results of blooD-glucose were closely
comparable between the two protein groups on days 7, 14, 21 and 28
of the experimental period.
Metabolic alterations
Following 8 weeks on the HF diet, it was observed
that plasma glucose was significantly increased as demonstrated by
the data presented in Table IV.
Plasma insulin levels were increased only in S-HF-fed rats as
compared with S fed rats. The HOMA-insulin resistance (HOMA-IR)
index was observed to be higher in the HF groups compared with the
control groups. Likewise, plasma GLP-1 levels were significantly
reduced in the HF group compared with control rats. In addition,
rats on HF diets had higher plasma fructose levels than those fed
control diets. Plasma and urine creatinine and uric acid, and
urinary albumin concentration were significantly higher (P<0.05)
in rats fed the HF diet than in those on the C-diet. In the rats
fed the HF diet, it was observed that the S-HF diet, compared with
the C-HF diet, attenuated the rise in plasma glucose (21%), insulin
(35%), HOMA-IR (42%) and fructose (17%), and increased the GLP-1
(29%) level. Consumption of the S diet significantly reduced plasma
insulin, fructose and HOMA-IR compared with the C-diet. Rats fed
the S-HF diet exhibited reduced plasma levels of creatinine (37%)
and uric acid (22%), and urine levels of creatinine (34%) and
albumin concentration (16%) compared with rats fed the C-HF diet.
In addition, the S diet reduced plasma levels of creatinine (25%)
and uric acid (21%), and urinary levels of uric acid (29%) and
albumin concentration (29%) compared with the C-diet.
| Table IVMetabolic and hormonal data of
experimental and control rats. |
Table IV
Metabolic and hormonal data of
experimental and control rats.
| Variables | Diets
| Analysis of
variance (P values)
|
|---|
| C | S | C-HF | S-HF | Prot | Fru | Prot x Fru |
|---|
| Plasma D Glucose
(mmol/l) | 5.96±0.30 | 5.11±0.42 | 8.31±1.06a | 6.54±0.47ab | NS | P<0.05 | P<0.05 |
| Plasma insulin
(µU/ml) | 53.59±2.62 | 32.98±8.33a | 66.65±5.97 | 43.22±12.25ab | P<0.05 | P<0.05 | P<0.05 |
| HOMA IR | 14.88±7.51 | 7.74±2.31a | 21.94±5.43b | 12.70±4.46ab | P<0.05 | P<0.05 | P<0.05 |
| Plasma fructose
(mmol/l) | 0.80±0.12 | 0.49±0.09a | 1.00±0.17b | 0.83±0.14ab | P<0.05 | P<0.05 | P<0.05 |
| Plasma GLP 1
(pg/ml) | 13.64±2.44 | 14.03±3.30a | 8.26±2.54b | 10.63±2.48ab | P<0.05 | P<0.05 | P<0.05 |
| Plasma creatinine
(mg/dl) | 0.44±0.05 | 0.33±0.07a | 0.68±0.18b | 0.43±0.06ab | P<0.05 | P<0.05 | P<0.05 |
| Plasma uric acid
(mg/dl) | 3.72±1.10 | 2.94±0.75a | 9.24±1.94b | 7.21±2.19ab | P<0.05 | P<0.05 | P<0.05 |
| Urinary albumin
(g/dl) | 109.22±15.18 | 78.09±16.24a |
178.60±14.21b | 149.43±5.60ab | P<0.05 | P<0.05 | P<0.05 |
| Urinary creatinine
(mg/dl) | 12.34±1.43 | 10.23±2.13 | 21.17±0.63b | 14.04±2.52ab | NS | P<0.05 | P<0.05 |
| Urinary uric acid
(mg/dl) | 23.02±2.80 | 16.45±1.33a | 33.03±5.71b | 29.10±5.37b | P<0.05 | P<0.05 | NS |
Tissues lipid and protein oxidation and
nitric oxide levels
Table V presents
the status of oxidative stress parameters in the tissues of
experimental and control rats. Addition of fructose to the protein
diets resulted in oxidative stress that was demonstrated by the
increase in TBARS in the heart and liver tissues compared with
control diets. In the kidneys, the concentration of TBARS was
significantly increased in rats fed the C-HF diet compared with
rats fed the C-diet. Higher hydroperoxide and protein carbonyl
levels, however reduced NO contents in all tissues were observed in
all HF-fed rats compared with control rats. Additionally, following
the treatment with sardine protein (S-HF group), hydroperoxide
concentrations in the liver (31%), heart (16%), kidney (11%) and
muscle (19%) tissues were significantly reduced compared with the
C-HF group. In addition, the S group rats presented with low
hydroperoxide (25%) levels in the liver tissue. Protein carbonyl
and NO contents were significantly reduced in the liver, kidney and
heart tissues of S-HF-fed rats compared with C-HF-fed rats. Feeding
rats the S diet led to reduced carbonyls in the heart and reduced
NO concentrations in the kidney and heart compared with the
C-diet.
| Table VOxidative stress markers and nitric
oxide levels in tissues of experimental and control rats. |
Table V
Oxidative stress markers and nitric
oxide levels in tissues of experimental and control rats.
| Variables | Diets
| Analysis of
variance (P values)
|
|---|
| C | S | C-HF | S-HF | Prot | Fru | Prot x Fru |
|---|
| Liver | | | | | | | |
| TBARS
(µmol/g) | 0.88±0.03 | 0.81±0.09 | 0.92±0.08b | 0.91±0.09b | NS | P<0.05 | NS |
| LHP (µmol/g) | 1.78±0.25 | 1.34±0.06a | 2.24±0.03b | 1.96±0.02ab | P<0.05 | P<0.05 | P<0.05 |
| Carbonyls
(nmol/g) | 78.02±6.01 | 67.30±1.35 | 237.92±7.80b |
200.43±11.84ab | NS | P<0.05 | P<0.05 |
| NO (µmol/g) | 606.00±73.99 | 452.75±92.47 |
358.14±29.87b |
295.81±34.04ab | NS | P<0.05 | P<0.05 |
| Kidney | | | | | | | |
| TBARS
(µmol/g) | 0.57±0.05 | 0.60±0.09 | 0.75±0.04b | 0.69±0.07 | NS | P<0.05 | NS |
| LHP (µmol/g) | 1.63±0.11 | 1.46±0.08 | 1.78±0.39b | 1.59±0.12ab | NS | P<0.05 | P<0.05 |
| Carbonyls
(nmol/g) | 56.00±28.21 | 40.50±15.15 |
117.56±21.74b | 94.71±28.55ab | NS | P<0.05 | P<0.05 |
| NO (µmol/g) | 260.49±8.41 |
225.39±49.80a | 116.27±5.18b | 90.21±10.60ab | P<0.05 | P<0.05 | P<0.05 |
| Heart | | | | | | | |
| TBARS
(µmol/g) | 0.33±0.02 | 0.32±0.02 | 0.63±0.02b | 0.51±0.01b | NS | P<0.05 | NS |
| LHP (µmol/g) | 1.40±0.22 | 1.37±0.32 | 2.19±0.45b | 1.84±0.25ab | NS | P<0.05 | P<0.05 |
| Carbonyls
(nmol/g) | 88.84±14.51 | 67.91±16.82a |
148.90±29.67b |
126.69±12.96ab | P<0.05 | P<0.05 | P<0.05 |
| NO (µmol/g) | 192.95±15.14 |
131.62±12.66a | 81.57±8.87b | 74.90±11.62ab | P<0.05 | P<0.05 | P<0.05 |
| Muscle | | | | | | | |
| TBARS
(µmol/g) | 0.18±0.04 | 0.18±0.02 | 0.22±0.01 | 0.21±0.03 | NS | NS | NS |
| LHP (µmol/g) | 0.33±0.02 | 0.32±0.02 | 0.63±0.02b | 0.51±0.01ab | NS | P<0.05 | P<0.05 |
| Carbonyls
(nmol/g) | 127.21±6.28 | 123.58±5.66 | 187.04±6.55b |
166.23±15.01b | NS | P<0.05 | NS |
| NO (µmolg) | 123.96±4.80 | 116.14±4.87 | 85.59±9.72b | 75.55±12.05b | NS | P<0.05 | NS |
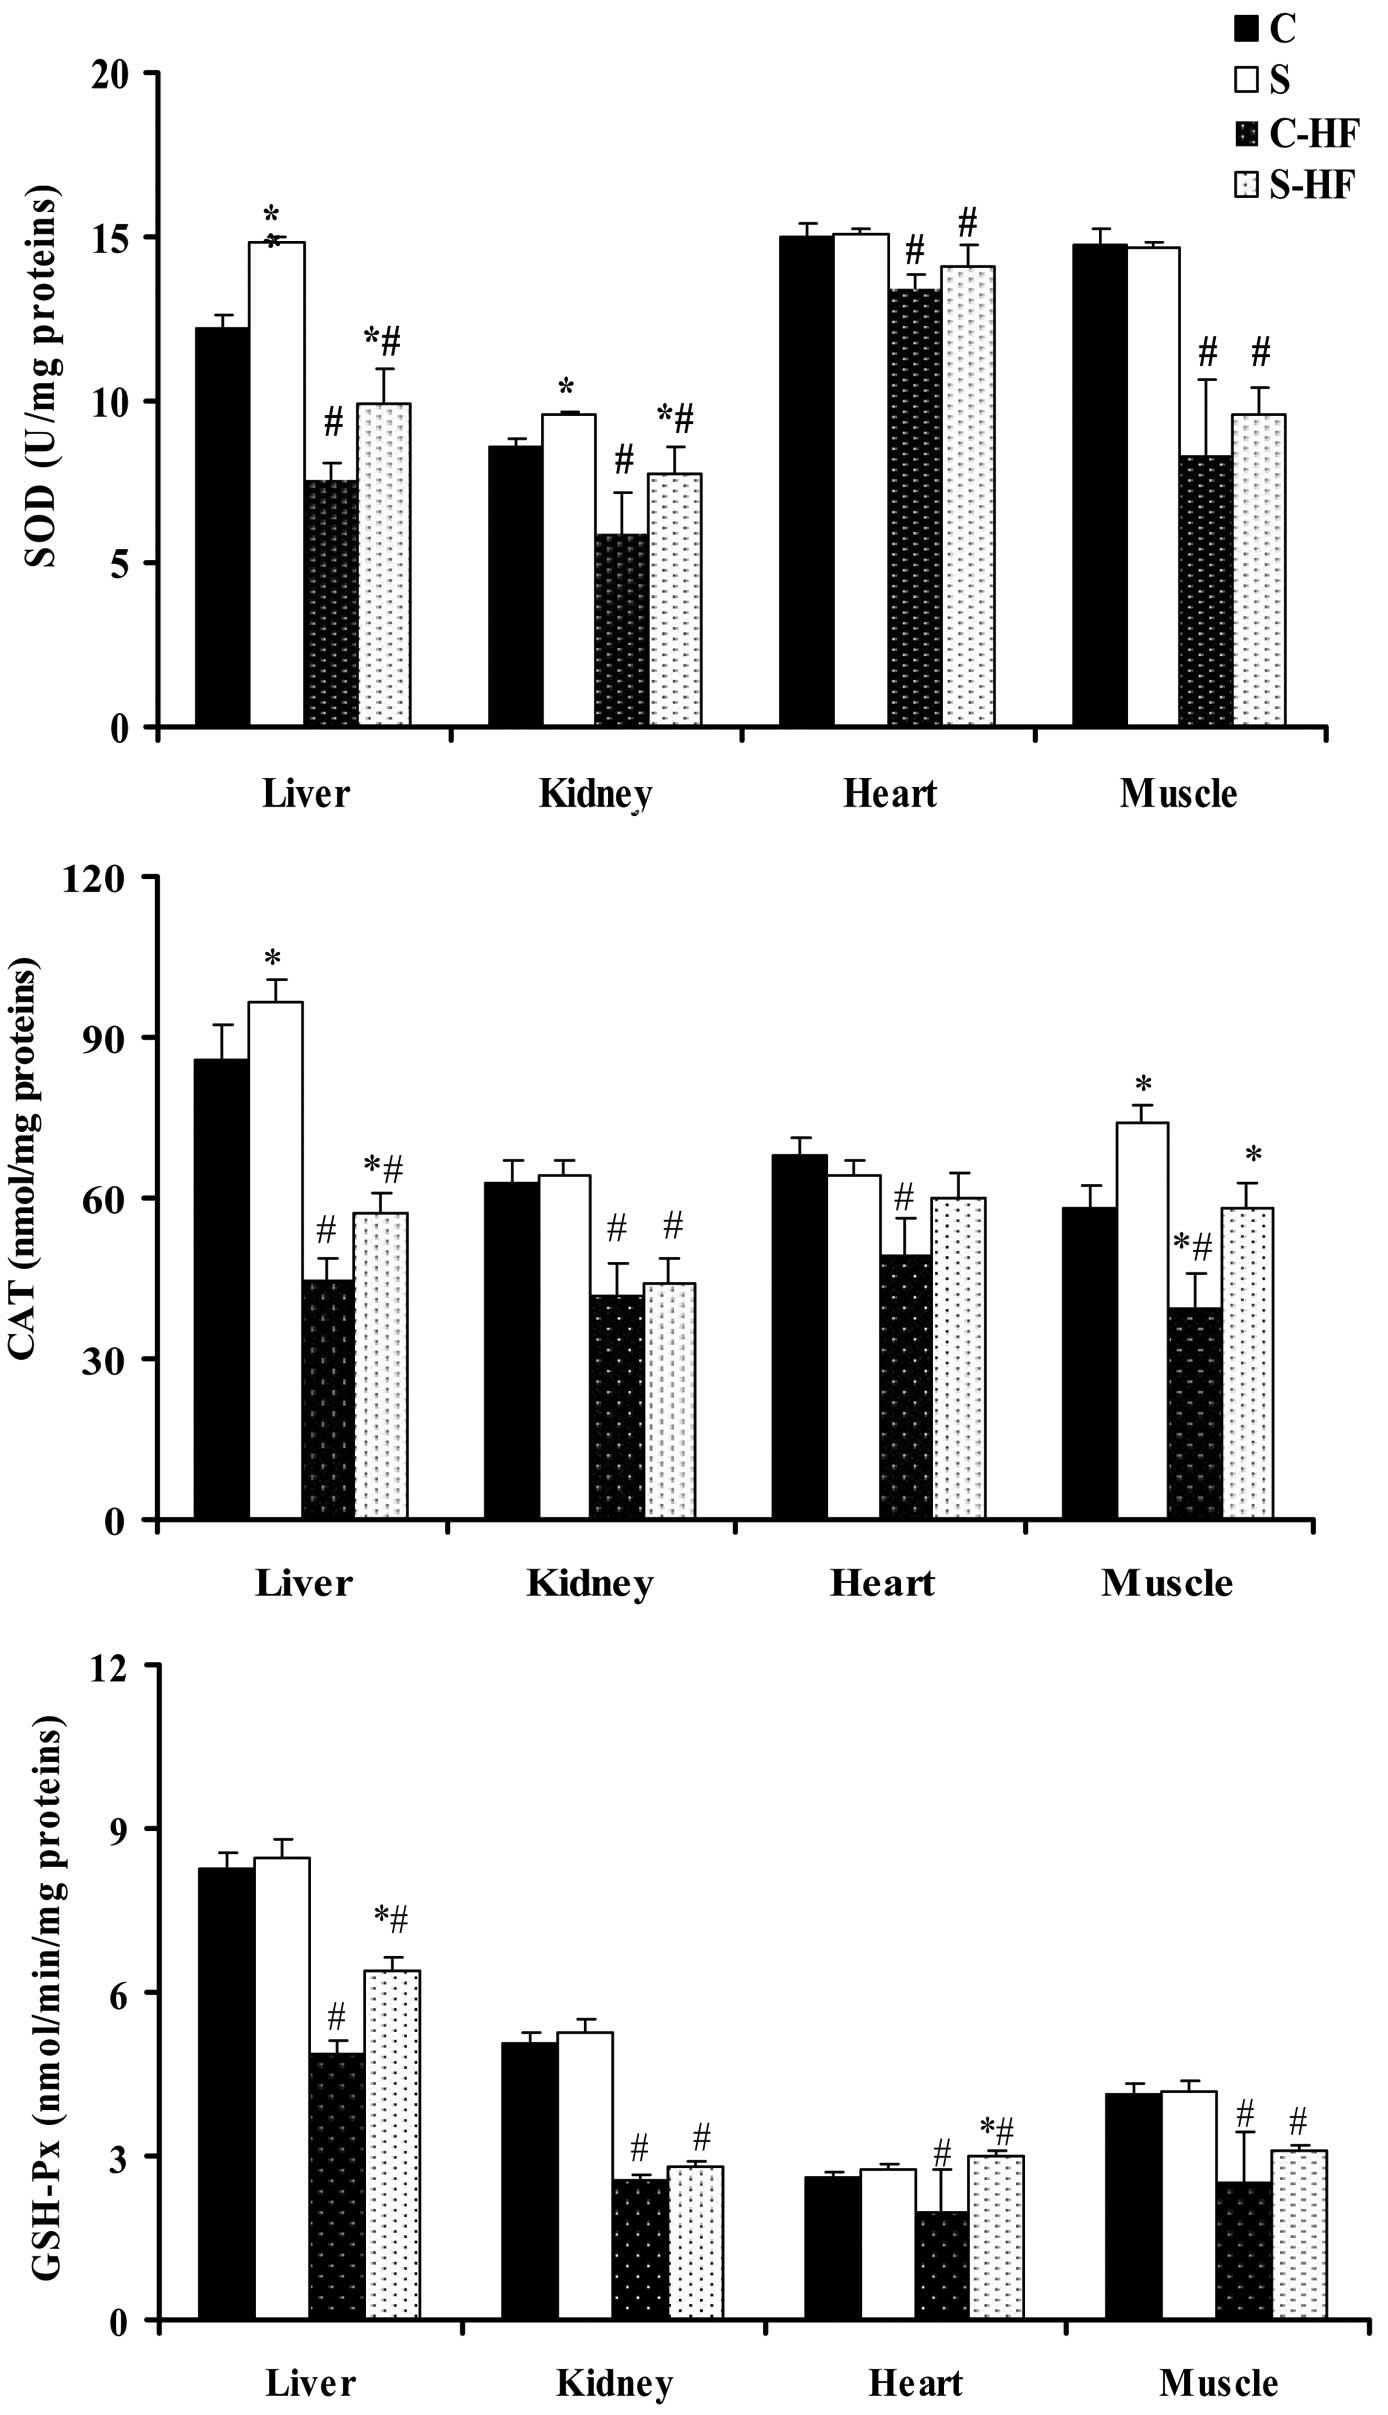
Antioxidant enzymatic activities in the
tissues
Following 8 weeks of feeding, the diets supplemented
with high dietary fructose induced a significant reduction in the
activity of SOD, CAT and GSH-Px in all tissues in comparison with
the control diets (Fig. 2)
(33). Feeding rats the S diet
resulted in an increase in liver SOD activity (21%) and in the CAT
activity of the liver (13%) and muscle (28%) compared with the
C-diet. The administration of the S-HF diet to rats increased SOD
activity in liver (31%) and kidney (14%) tissues compared with the
C-HF diet. Furthermore, liver and muscle CAT activity was increased
in S-HF-fed rats by 28 and 48%, respectively, when compared with
the C-HF-fed rats. The activity of GSH-Px, which serves a role in
peroxide removal, was significantly higher in the liver (31%),
heart (51%) and muscle (24%) homogenates of S-HF-fed rats than
C-HF-fed rats.
Liver ascorbic acid and α-tocopherol
levels
A reduction in liver ascorbic acid and α-tocopherol
levels was observed in the HF-fed rats compared with the control
diets (Table VI). Administration
of sardine protein to rats with or without fructose significantly
increased levels of liver ascorbic acid relative to casein fed
rats. In addition, the levels of liver α-tocopherol were higher in
the S group than in the C group.
| Table VILiver ascorbic acid and α-tocopherol
levels of experimental and control rats. |
Table VI
Liver ascorbic acid and α-tocopherol
levels of experimental and control rats.
| Variables | Diets
| Analysis of
variance (P values)
|
|---|
| C | S | C-HF | S-HF | Prot | Fru | Prot × Fru |
|---|
| Ascorbic acid
(mg/g) | 1.09±0.05 | 1.2±0.08 | 0.67±0.07b | 0.81±0.08ab | NS | P<0.05 | P<0.05 |
| α-tocopherol
(mg/g) | 0.63±0.010 | 0.70±0.03a | 0.40±0.04b | 0.45±0.06b | P<0.05 | P<0.05 | NS |
Discussion
An HF diet favors the development of several
metabolic alterations in the rat (3,34–36).
The results from the current study indicate that the weight gain
and liver, kidney, heart and muscle weights in the HF group were
significantly greater than those of control groups, despite reduced
energy intake, suggesting a low energy expenditure. These results
are in line with a previous study (37). Intake of sardine protein suppressed
HF-diet-mediated body, liver and muscle weight gain compared with
casein, which is attributable in part to the satietogenic effects
of sardine protein. According to Borzoei et al (38), fish protein may have a stronger
satiating effect compared with beef and chicken protein.
Alternatively, the reduced levels of essential amino acids
including isoleucine, phenylalanine, tyrosine, valine and
histidine, in sardine protein (Table
I), may have been responsible for this low rate of growth.
These results are consistent with those obtained in salmon protein
fed insulin resistant rats (39)
and in spontaneously hypertensive rats fed with fish protein
compared with those fed with casein (17).
In addition, these data imply that the reduction in
weight gain, liver weight and muscle weight as a result of the
sardine protein diet may be responsible for improving insulin
sensitivity in HF-fed rats. Rats assigned to an HF diet developed
hyperglycemia, hyperinsulinemia and insulin resistance.
Furthermore, this animal model exhibited significant elevations in
blooD-glucose levels at all time points, compared with the control
rats. The beneficial effect of sardine protein consumption in the
HF group was demonstrated by a reduction in glycemia at all time
points, a reduction in plasma D-glucose and insulin concentrations
following overnight starvation, and a reduced HOMA index and plasma
fructose. These observations are in agreement with previous studies
on fish protein (15,40). It is widely recognized that certain
bioactive agents (hormones) produced by the gastrointestinal system
are able to modulate the secretory activities of the islets of
Langerhans (41,42). The current study demonstrated that
the GLP-1 response in the HF group was significantly reduced
compared with the controls. Treatment with sardine protein
attenuated the reduction in GLP-1 levels resulting from the HF
diet, coinciding with reduced plasma glucose, insulin
concentrations and reduced weight gain. Consequently, previous
studies have identified GLP-1 to be highly effective in reducing
blood glucose levels in patients with T2D (43–45),
and GLP-1 has been reported to serve an important role in
normalizing fasting hyperglycemia (46). Furthermore, GLP-1 acts as an
incretin to reduce blood glucose, via stimulation of insulin
secretion from islet β cells, and in addition is able to inhibit
gastric emptying and acid secretion, reducing food ingestion and
glucagon secretion (47).
Alternatively, this protein-dependent difference in insulin
resistance may be attributed to the difference in the amino acid
composition. Different amino acids appear to affect insulin
secretion in different ways, with the branched-chain amino acids
leucine, isoleucine and valine observed to increase insulin
secretion more than other amino acids (48). In the sardine protein used in the
present study and in cod and soy proteins, these amino acids are
present in reduced amounts compared with casein (49). Increased levels of glycine, alanine
and glutamic acid in sardine proteins may have a positive effect on
glycemia, due to the fact that reduced glycemia in patients with
T2D supplemented with alanine, glycine, aspartic and glutamine
acids was observed by Natarajan Sulochana et al (50).
The current study also demonstrated that excess
fructose consumption is closely associated with the increased
levels of creatinine and uric acid in plasma and urine, and
albuminuria as compared with control diets. In rats fed with the
S-HF diet, reduced plasma creatinine (37%) and uric acid (22%)
levels, and urine albumin (16%) and creatinine (34%) levels were
observed compared with rats fed with the C-HF diet. This suggests
that the sardine protein may slow or reverse the progression of
established kidney disease and may protect against the development
of kidney disease in fructose induced MS in rats. In addition, the
S diet group exhibited reduced plasma creatinine and uric acid
levels, and urinary uric acid and albumin levels compared with the
C-diet group. Similar observations were reported in streptozotocin
induced type 1 diabetes rats fed sardine protein compared with
those fed casein (16).
Fructose-induced hyperglycemia is able to increase
reactive oxygen species (ROS), resulting in lipid peroxidation and
the depletion of the antioxidant defense status in various tissues
(51). In the present study, the
tissue levels of TBARS, hydroperoxides and carbonyls were increased
in HF rats, whilst the activity of antioxidants including SOD, CAT
and GSH-Px were reduced in HF rats. These data demonstrate that HF
treatment exhibited detrimental effects on antioxidant production
and subsequently increased oxidative stress in rats. This accounts
for the excessive production of superoxide anions and organic
peroxides, and the increased utilization of scavenging free
radicals. In addition, fructose itself enhances the formation of
ROS in vitro (52). These
observations are in agreement with previous studies (51,53).
Taken together, these alterations reduced the cellular capacity to
cope with oxidative stress and are responsible for the increase in
biomarkers of oxidative damage. The increase in protein carbonyl
content is indicative of oxidative damage in addition to chemical
modification. The protein oxidation observations provide additional
evidence for carbonyl stress, which arises from oxidative and/or
non oxidative reactions and leads to increased chemical
modification of proteins (54).
Exposure to the sardine protein diet counteracted the increase in
oxidative stress in HF rats and maintained the activity of SOD, CAT
and GSH-Px. This implies that fish protein is able to act as a
protective agent against potential fructose induced alterations in
rats by attenuating lipid and protein oxidation, and enhancing the
antioxidant capacity of tissues. Similar results were observed in
spontaneously hypertensive streptozotocin induced diabetic rats fed
with fish protein compared with those fed casein (55). In the liver, low levels of lipid
peroxides were associated with increased activity of SOD, CAT and
GSH-Px in S-HF-fed rats. This suggests that the livers of S-HF rats
exhibit an enhanced protective response to oxidative stress. The
possible reduced accumulation of H2O2 in the
liver as a result of increased activity of CAT in rats fed the S-HF
diet is suggested to be explained by the increased glutathione
levels stimulating the GSH-Px mediated reduction of
H2O2 and organic hydroperoxides. In addition,
an increase in the levels of ascorbic acid in the liver of S-HF-fed
rats may be responsible for the reduced lipid peroxides. The lack
of a difference in the CAT activity in the heart and kidney in the
current study may imply that these organs are less vulnerable to
diet-induced oxidative stress. The reduction in lipid peroxide
levels in these organs may have resulted from an increase in SOD
activity in the kidney and GSH-Px activity in the heart. These data
suggest a reduced susceptibility to oxidative stress in
fructose-fed rats. In muscles, however, the reduced lipid
peroxidation in rats fed the S-HF diet compared with those fed the
C-HF diet may be due to the enhancement of CAT and GSH-Px
activities, which may be accounted for by the reduced accumulation
of H2O2. The current study demonstrates that
the fructose-enriched diets reduced NO levels in tissues compared
with control rats, suggesting endothelial dysfunction. These
observations may be explained by reduced NO production,
inactivation of NO by superoxide radicals, or to increased
formation of peroxynitrite (ONOO-) leading to aggravation of
cellular injury via membrane damage. This is in agreement with the
studies by Sun et al (56)
and Simão et al (57) in
patients with MS. NO, which serves a critical role in maintaining
normal endothelial function by causing vasodilatation (58), was reduced on treatment with
sardine protein. The NO-reducing effect of sardine protein did not
result from a reduced relative amount of the NO precursor,
arginine, in the amino acid profile of sardine protein. However it
may be associated with the reduction in blood pressure, as
Ait-Yahia et al (17)
reported low blood pressure in spontaneously hypertensive rats fed
fish protein compared with those fed casein.
In conclusion, chronic fructose consumption leads to
detrimental effects, including insulin resistance, metabolic
disorder and oxidative stress. Administration of sardine protein
was able to prevent and reverse the insulin resistance and
oxidative stress induced by the HF diet. Overall, the current study
may provide novel insights regarding future human and clinical
nutritional approaches aimed at preventing or treating MS.
References
|
1
|
Wong ND: Metabolic syndrome:
Cardiovascular risk assessment and management. Am J Cardiovasc
Drugs. 7:259–272. 2007. View Article : Google Scholar : PubMed/NCBI
|
|
2
|
Després JP, Lemieux I, Bergeron J, Pibarot
Ph, Mathieu P, Larose E, Rodés Cabau J, Bertrand OF and Poirier P:
Abdominal obesity and the metabolic syndrome: Contribution to
global cardiometabolic risk. Arterioscler Thromb Vasc Biol.
28:1039–1049. 2008. View Article : Google Scholar : PubMed/NCBI
|
|
3
|
Misra A and Khurana L: Obesity and the
metabolic syndrome in developing countries. J Clin Endocrinol
Metab. 93(Suppl 1): S9–S30. 2008. View Article : Google Scholar : PubMed/NCBI
|
|
4
|
Tappy L and Lê KA: Metabolic effects of
fructose and the worldwide increase in obesity. Physiol Rev.
90:23–46. 2010. View Article : Google Scholar : PubMed/NCBI
|
|
5
|
Lê KA and Tappy L: Metabolic effects of
fructose. Curr Opin Clin Nutr Metab Care. 9:469–475. 2006.
View Article : Google Scholar : PubMed/NCBI
|
|
6
|
Yokozawa T, Kim HJ and Cho EJ: Gravinol
ameliorates high fructose induced metabolic syndrome through
regulation of lipid metabolism and proinflammatory state in rats. J
Agric Food Chem. 56:5026–5032. 2008. View Article : Google Scholar : PubMed/NCBI
|
|
7
|
Kelley GL, Allan G and Azhar S: High
dietary fructose induces a hepatic stress response resulting in
cholesterol and lipid dysregulation. Endocrinology. 145:548–555.
2004.http://dx.doi.org/10.1210/en.2003-1167.
View Article : Google Scholar
|
|
8
|
Nkondjock A and Receveur O: Fish seafood
consumption, obesity, and risk of type 2 diabetes: An ecological
study. Diabetes Metab. 29:635–642. 2003. View Article : Google Scholar
|
|
9
|
Ramel A, Martinèz A, Kiely M, Morais G,
Bandarra NM and Thorsdottir I: Beneficial effects of long chain n-3
fatty acids included in an energy restricted diet on insulin
resistance in overweight and obese European young adults.
Diabetologia. 51:1261–1268. 2008. View Article : Google Scholar : PubMed/NCBI
|
|
10
|
Delarue J, LeFoll C, Corporeau C and Lucas
D: N-3 long chain polyunsaturated fatty acids: A nutritional tool
to prevent insulin resistance associated to type 2 diabetes and
obesity. Reprod Nutr Dev. 44:289–299. 2004. View Article : Google Scholar : PubMed/NCBI
|
|
11
|
Ebbesson SO, Ebbesson LO, Swenson M,
Kennish JM and Robbins DC: A successful diabetes prevention study
in Eskimos: The Alaska Siberia project. Int J Circumpolar Health.
64:409–424. 2005. View Article : Google Scholar : PubMed/NCBI
|
|
12
|
Lombardo YB, Hein G and Chicco A:
Metabolic syndrome: Effects of n-3 PUFAs on a model of
dyslipidemia, insulin resistance and adiposity. Lipids. 42:427–437.
2007. View Article : Google Scholar : PubMed/NCBI
|
|
13
|
Noriega López L, Tovar AR, Gonzalez
Granillo M, Hernández Pando R, Escalante B, Santillán Doherty P and
Torres N: Pancreatic insulin secretion in rats fed a soy protein
high fat diet depends on the interaction between the amino acid
pattern and isoflavones. J Biol Chem. 282:20657–20666. 2007.
View Article : Google Scholar : PubMed/NCBI
|
|
14
|
Ascencio C, Torres N, Isoard Acosta F,
Gómez Pérez FJ, Hernández Pando R and Tovar AR: Soy protein affects
serum insulin and hepatic SREBP 1 mRNA and reduces fatty liver in
rats. J Nutr. 134:522–529. 2004.PubMed/NCBI
|
|
15
|
Lavigne C, Tremblay F, Asselin G, Jacques
H and Marette A: Prevention of skeletal muscle insulin resistance
by dietary cod protein in high fat fed rats. Am J Physiol
Endocrinol Metab. 281:E62–E71. 2001.PubMed/NCBI
|
|
16
|
Mellouk Z, Ait Yahia D, Boukortt FO,
Benaicha N, Madani Z and Bouchenak M: Dietary sardine (Sardina
pilchardus) protein attenuates hyperglycemia and hyperlipidemia and
ameliorates tissue morphology changes in streptozotocin induced
diabetic rats. Metab Funct Res Diab. 2:45–54. 2009.
|
|
17
|
Ait Yahia D, Madani S, Prost E, Prost J,
Bouchenak M and Belleville J: Tissue antioxidant status differs in
spontaneously hypertensive rats fed fish protein or casein. J Nutr.
133:479–482. 2003.
|
|
18
|
Tremblay F, Lavigne C, Jacques H and
Marette A: Dietary cod protein restores insulin induced activation
of phosphatidylinositol 3 kinase/Akt and GLUT4 translocation to the
T tubules in skeletal muscle of high fat fed obese rats. Diabetes.
52:29–37. 2003. View Article : Google Scholar
|
|
19
|
Ouellet V, Weisnagel SJ, Marois J,
Bergeron J, Julien P, Gougeon R, Tchernof A, Holub BJ and Jacques
H: Dietary cod protein reduces plasma C reactive protein in insulin
resistant men and women. J Nutr. 138:2386–2391. 2008. View Article : Google Scholar : PubMed/NCBI
|
|
20
|
Undeland I, Kelleher SD and Hultin HO:
Recovery of functional proteins from herring (Clupea harengus)
light muscle by an acid or alkaline solubilization process. J Agric
Food Chem. 50:7371–7379. 2002. View Article : Google Scholar : PubMed/NCBI
|
|
21
|
Kjeldahl JZ: A new method for the
determination of nitrogen in organic bodies. Analytical Chemistry.
22:3661883. View Article : Google Scholar
|
|
22
|
Soxhlet FRV: The gravimetric determination
of milk fat. Dingler's Polytechnic J. 232:461–465. 1879.In
German.
|
|
23
|
Council of European Communities: Council
instructions about the protection of living animals used in
scientific investigations. Official J. L358:18–12;1986.
Corrigendum. Official J. L
117:05–05;1987.
|
|
24
|
Bergmeyer HU, Berndt E, Schmidt F and
Stork H: D-glucose determination with hexokinase and glucose
6-phosphate dehydrogenase. Methods of Enzymatic Analysis. HU
Bergmeyer: 3. Academic Press; New York: pp. 1190–1201. 1974
|
|
25
|
Leclercq Meyer V, Marchand J,
Woussen-Colle MC, Giroix MH and Malaisse WJ: Multiple effects of
leucine on glucagon, insulin, and somatostatin secretion from the
perfused rat pancreas. Endocrinology. 116:1168–1174. 1985.
View Article : Google Scholar : PubMed/NCBI
|
|
26
|
Lowry OH, Rosebrough NJ, Farr AL and
Randall RJ: Protein measurement with the Folin phenol reagent. J
Biol Chem. 193:265–275. 1951.PubMed/NCBI
|
|
27
|
Quintanilha AT, Packer L, Davies JM,
Racanelli TL and Davies KJA: Membrane effects of vitamin E
deficiency: Bioenergetic and surface charge density studies of
skeletal muscle and liver mitochondria. Ann NY Acad Sci. 393(1
Vitamin E): pp. 32–47. 1982, View Article : Google Scholar
|
|
28
|
Eymard S and Genot C: A modified xylenol
orange method to evaluate formation of lipid hydroperoxides during
storage and processing of small pelagic fish. Eur J Lipid Sci
Technol. 105:497–501. 2003. View Article : Google Scholar
|
|
29
|
Levine RL, Garland D, Oliver CN, Amici A,
Climent I, Lenz AG, Ahn BW, Shaltiel S and Stadtman ER:
Determination of carbonyl content in oxidatively modified proteins.
Methods Enzymol. 186:464–478. 1990. View Article : Google Scholar : PubMed/NCBI
|
|
30
|
Cortas NK and Wakid NW: Determination of
inorganic nitrate in serum and urine by a kinetic cadmium reduction
method. Clin Chem. 36:1440–1443. 1990.PubMed/NCBI
|
|
31
|
Aebi H: Catalase. Methods of Enzymatic
Analysis. HU Bergmeyer: 2nd edition. Verlag Chemie; Weinheim: pp.
673–684. 1974, View Article : Google Scholar
|
|
32
|
Baker H, Frank O, Angelis B and Feingold
S: Plasma tocopherol in man at various times after ingesting free
or acetylated tocopherol. Nutr Rep Int. 21:531–536. 1980.
|
|
33
|
Liddell JR, Dringen R, Crack PJ and
Robinson SR: Glutathione peroxidase 1 and a high cellular
glutathione concentration are essential for effective organic
hydroperoxide detoxification in astrocytes. Glia. 54:873–879. 2006.
View Article : Google Scholar : PubMed/NCBI
|
|
34
|
Stanhope KL and Havel PJ: Fructose
consumption: Potential mechanisms for its effects to increase
visceral adiposity and induce dyslipidemia and insulin resistance.
Curr Opin Lipidol. 19:16–24. 2008. View Article : Google Scholar : PubMed/NCBI
|
|
35
|
Lim JS, Mietus Snyder M, Valente A,
Schwarz JM and Lustig RH: The role of fructose in the pathogenesis
of NAFLD and the metabolic syndrome. Nat Rev Gastroenterol Hepatol.
7:251–264. 2010. View Article : Google Scholar : PubMed/NCBI
|
|
36
|
Ahangarpour A, Mohammadian M and Dianat M:
Antidiabetic effect of hydroalcholic urticadioica leaf extract in
male rats with fructose induced insulin resistance. Iran J Med Sci.
37:181–186. 2012.PubMed/NCBI
|
|
37
|
Hsieh FC, Lee CL, Chai CY, Chen WT, Lu YC
and Wu CS: Oral administration of Lactobacillus reuteri GMNL 263
improves insulin resistance and ameliorates hepatic steatosis in
high fructose fed rats. Nutr Metab (Lond). 10:352013. View Article : Google Scholar
|
|
38
|
Borzoei S, Neovius M, Barkeling B,
Teixeira Pinto A and Rössner S: A comparison of effects of fish and
beef protein on satiety in normal weight men. Eur J Clin Nutr.
60:897–902. 2006. View Article : Google Scholar : PubMed/NCBI
|
|
39
|
Pilon G, Ruzzin J, Rioux LE, Lavigne C,
White PJ, Frøyland L, Jacques H, Bryl P, Beaulieu L and Marette A:
Differential effects of various fish proteins in altering body
weight, adiposity, inflammatory status, and insulin sensitivity in
high-fat-fed rats. Metabolism. 60:1122–1130. 2011. View Article : Google Scholar : PubMed/NCBI
|
|
40
|
Ouellet V, Marois J, Weisnagel SJ and
Jacques H: Dietary cod protein improves insulin sensitivity in
insulin resistant men and women: A randomized controlled trial.
Diabetes Care. 30:2816–2821. 2007. View Article : Google Scholar : PubMed/NCBI
|
|
41
|
Creutzfeldt W and Ebert R: New
developments in the incretin concept. Diabetologia. 28:565–573.
1985. View Article : Google Scholar : PubMed/NCBI
|
|
42
|
Kieffer TJ and Habener JF: The
glucagon-like peptides. Endocr Rev. 20:876–913. 1999. View Article : Google Scholar : PubMed/NCBI
|
|
43
|
Larsen J, Hylleberg B, Ng K and Damsbo P:
Glucagon-like peptide-1 infusion must be maintained for 24 h/day to
obtain acceptable glycemia in type 2 diabetic patients who are
poorly controlled on sulphonylurea treatment. Diabetes Care.
24:1416–1421. 2001. View Article : Google Scholar : PubMed/NCBI
|
|
44
|
Nauck MA, Heimesaat MM, Orskov C, Holst
JJ, Ebert R and Creutzfeldt W: Preserved incretin activity of
glucagon-like peptide 1 [7-36amide] but not of synthetic human
gastric inhibitory polypeptide in patients with type-2 diabetes
mellitus. J Clin Invest. 91:301–307. 1993. View Article : Google Scholar : PubMed/NCBI
|
|
45
|
Elahi D, McAloon Dyke M, Fukagawa NK,
Meneilly GS, Sclater AL, Minaker KL, Habener JF and Andersen DK:
The insulinotropic actions of glucosedependent insulinotropic poly
peptide (GIP) and glucagon-like peptide 1 (7 37) in normal and
diabetic subjects. Regul Pept. 51:63–74. 1994. View Article : Google Scholar : PubMed/NCBI
|
|
46
|
Kjems LL, Holst JJ, Vølund A and Madsbad
S: The influence of GLP-1 on glucose-stimulated insulin secretion:
Effects on beta-cell sensitivity in type 2 and nondiabetic
subjects. Diabetes. 52:380–386. 2003. View Article : Google Scholar : PubMed/NCBI
|
|
47
|
Holst JJ: The physiology of glucagon-like
peptide-1. Physiol Rev. 87:1409–1439. 2007. View Article : Google Scholar : PubMed/NCBI
|
|
48
|
Lynch CJ, Hutson SM, Patson BJ, Vaval A
and Vary TC: Tissue-specific effects of chroniC-dietary leucine and
norleucine supplementation on protein synthesis in rats. Am J
Physiol Endocrinol Metab. 283:E824–E835. 2002. View Article : Google Scholar : PubMed/NCBI
|
|
49
|
Lavigne C, Marette A and Jacques H: Cod
and soy proteins compared with casein improve glucose tolerance and
insulin sensitivity in rats. Am J Physiol Endocrinol Metab.
278:E491–E500. 2000.PubMed/NCBI
|
|
50
|
Natarajan Sulochana K, Lakshmi S, Punitham
R, Arokiasamy T, Sukumar B and Ramakrishnan S: Effect of oral
supplementation of free amino acids in type 2 diabetic patients-a
pilot clinical trial. Med Sci Monit. 8:CR131–CR137. 2002.PubMed/NCBI
|
|
51
|
Reddy SS, Ramatholisamma P, Karuna R and
Saralakumari D: Preventive effect of Tinospora cordifolia against
high fructose diet-induced insulin resistance and oxidative stress
in male Wistar rats. Food Chem Toxicol. 47:2224–2229. 2009.
View Article : Google Scholar : PubMed/NCBI
|
|
52
|
Sakai M, Oimomi M and Kasuga M:
Experimental studies on the role of fructose in the development of
diabetic complications. Kobe J Med Sci. 48:125–136. 2002.
|
|
53
|
Nandhini AT, Thirunavukkarasu V,
Ravichandran MK and Anuradha CV: Effect of taurine on biomarkers of
oxidative stress in tissues of fructose fed insulin resistant rats.
Singapore Med J. 46:82–87. 2005.PubMed/NCBI
|
|
54
|
Chevion M, Berenshtein E and Stadtman ER:
Human studies related to protein oxidation: Protein carbonyl
content as a marker of damage. Free Rad Res. 33(Suppl): S99–S108.
2000.
|
|
55
|
Boukortt FO, Girard A, Prost JL, Ait-Yahia
D, Bouchenak M and Belleville J: Fish protein improves the total
antioxidant status of streptozotocin induced diabetes in
spontaneously hypertensive rat. Med Sci Monit. 10:BR397–BR404.
2004.PubMed/NCBI
|
|
56
|
Sun YX, Hu SJ, Zhang XH, Sun J, Zhu CH and
Zhang ZJ: Plasma levels of vWF and NO in patients with metabolic
syndrome and their relationship with metabolic disorders. Zhejiang
Da Xue Xue Bao Yi Xue Ban. 35:315–318. 2006.In Chinese. PubMed/NCBI
|
|
57
|
Simão ANC, Lozovoy MAB, Simão TNC, Dichi
JB, Matsuo T and Dichi I: Nitric oxide enhancement and blood
pressure decrease in patients with metabolic syndrome using soy
protein or fish oil. Arq Bras Endocrinol Metabol. 54:540–545. 2010.
View Article : Google Scholar : PubMed/NCBI
|
|
58
|
Bai Y, Sun L, Yang T, Sun K, Chen J and
Hui R: Increase in fasting vascular endothelial function after
short-term oral L-arginine is effective when baseline flow-mediated
dilation is low: A meta-analysis of randomized controlled trials.
Am J Clin Nutr. 89:77–84. 2009. View Article : Google Scholar
|