Introduction
Abdominal aortic aneurysm (AAA) is characterized by
permanent, localized dilations of the abdominal aorta, which are
defined as having diameters 1.5 times greater than normal (or which
measure >3 cm) (1). Aortic
rupture is the most serious clinical condition resulting from the
progression of AAA (2). Almost 80%
of patients who experience aortic rupture succumb to mortality
(3). Since the majority of
aneurysms are usually asymptomatic until rupture occurs, diagnosis
is therefore problematic, and no preventative therapies are
currently available for patients to effectively limit the
progression of AAA (2,4). Therefore, it is important to
investigate the mechanisms of AAA initiation and progression in
order to assist diagnostic applications and to develop therapeutic
options.
AAA is considered to be a particular, localized form
of atherothrombosis (5). It shares
the usual risk factors with occlusive atherothrombosis, including
an increasing age, male gender, smoking, possible genetic
susceptibility and low high density lipoprotein-to-cholesterol
levels (6). The pathogenesis of
AAA is complicated and multifactorial. Unique hemodynamic forces,
which particularly impact on the infrarenal area, and variations in
the content of elastin and collagen in different parts of the aorta
rendered the infrarenal part of the abdominal aorta highly
susceptible to AAA development (2). Numerous animal models and clinical
studies reported that the initiation of AAA involves an
inflammatory response, which is often enforced by the upregulation
of adhesion molecules (7–9). The degradation of the extracellular
matrix, which is caused by an increased activity of matrix
metalloproteinases (MMPs) and serine proteases, and smooth muscle
cell apoptosis are the predominant features associated with the
progression of AAA (10,11). Previous-genome wide studies using
microarrays have investigated the pathogenesis of AAA (12–14).
The involvement of the immune system in AAA formation and
progression was also reported in previous studies (15,16),
however, the molecular mechanisms leading to the development and
progression of AAA remain to be fully elucidated.
Using the identical gene expression profile, Biros
et al (17) demonstrated
that immune pathways are upregulated within the undilated aorta
proximal to an AAA. In the present study, the differentially
expressed genes (DEGs) featured in the gene expression profile in
AAA necks were analyzed. Furthermore, a function and
pathway-enrichment analysis was performed on the DEGs, and a
protein-protein interaction network (PPI) was constructed to
identify those DEGs which have a central role in AAA. The present
study also aimed to gain further insights into the molecular
mechanisms underlying the development of AAA. Understanding these
molecular mechanisms may assist in developing the understanding of
the pathogenesis of AAA, and to translate these pathogenic
activities into therapeutic applications.
Materials and methods
Microarray data and data
pre-processing
The gene expression profile of GSE47472 was
downloaded from the Gene Expression Omnibus (GEO) (17) in the National Centre for
Biotechnology Information (http://www.ncbi.nlm.nih.gov/geo/) based on the
platform of GPL10558 (or the Illumina HumanHT-12 V4.0 expression
beadchip). A total of 22 data biopsies were obtained from the AAA
neck samples, comprising 14 AAA samples from patients undergoing
open AAA repair and eight normal samples from beating heart organ
donors following brain mortality. The original data were
pre-processed using the beadarray package in R language (version
2.18.0; http://bioconductor.org/packages/release/bioc/html/beadarray.html)
(18), and normalized using the
quantile method (19). Boxplots of
the raw and normalized data were produced.
Screening of DEGs
Multi-dimensional scaling (MDS), which was
constructed with the poltMDS (20)
function in the linear models for microarray data (Limma) (21) package (version 3.24.15; http://www.bioconductor.org/packages/release/bioc/html/limma.html)
was used to investigate the association of the samples as a measure
of quality control. From the results of the MDS procedure, the AAA
samples were separated into types A and B. The DEGs in the AAA
sample types A and B were identified using the Limma package and
were compared with the controls. The common DEGs, which featured
consistent changes in their expression levels, were selected as the
targets for further analysis. The false discovery rate (FDR) was
calculated for multiple testing correction using the Benjamini and
Hochberg method (22). The
threshold for the DEGs was set as the log fold change (FC)>1 and
FDR≤0.01. Pearson's correlation coefficient was used to examine the
associations between these DEGs (23).
Enrichment analysis of the DEGs
The probe sets, which featured differential
expression between the controls and the AAA samples, were annotated
to Ensembl gene identifiers (IDs) for ID mapping using the database
for annotation, visualization and integrated discovery (DAVID) tool
(version 6.7; http://david.abcc.Ncifcrf.gov/ (24,25).
Gene ontology (GO; http://www.geneontology.org/) (26) and Kyoto Encyclopedia of Genes and
Genomes (KEGG; http://www.genome.jp/kegg/pathway.html) analyses were
performed on the selected lists of genes. The threshold was set as
P≤0.05.
Constructing an interaction network and
functional analysis
Following ID mapping, all selected genes were
exported into Cytoscape plugin (27) using the BisoGenet module (28) to create network visualizations. The
source of the interaction network database was the Biomolecular
Interaction Network Database (BIND) (29). Subsequently, a cluster analysis on
the resulting network was performed with the Plugin, ClusterONE
(http://apps.cytoscape.org/apps/clusterone) (30) program, using a P<0.05 as a
cut-off. The significant GO categories of the DEGs in the
subnetworks were analyzed using the DAVID tool.
Results
Data pre-processing
The raw data downloaded from the GEO databases were
normalized (Fig. 1A). The median
values of each sample were almost at the identical level,
suggesting that the data were eligible for further analysis. An MDS
plot was constructed as a means of visualizing the data. This was
performed for all the probes available. The AAA samples were
observed to cluster into two groups, types A and B (Fig. 1B).
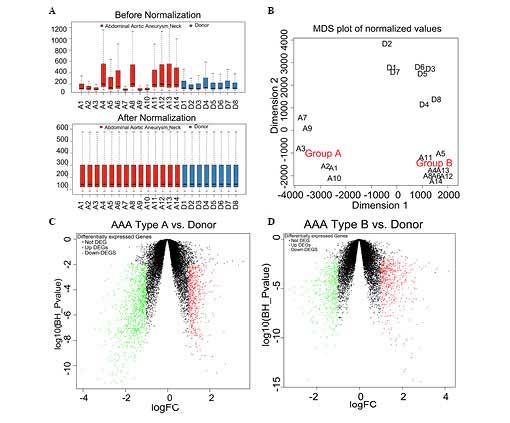 | Figure 1Data preprocessing and screening of
the DEGs (A) The normalized expressed value data are shown. The
black line featured in each of the colored boxes represents the
median of each set of data, which determines the degree of
standardization of the data through its distribution. Following
normalization, the black lines in the boxes are almost in a
straight line, indicating a good degree of standardization. (B) An
MDS plot of the summarized microarray data following normalization.
The array weights, calculated with the design matrix, reflect the
association between the samples. Volcano plots are shown of the
log10false discovery rate against the logFC for each
gene of (C) AAA type A, vs. control and (D) AAA type B, vs.
control. The FC and the statistical significance were plotted on
the x- and y-axes, respectively. The genes, which are statistically
significantly upregulated, are shown in red and those, which are
statistically significantly downregulated, are shown in green. MDS,
multidimensional scaling; FC, fold change; DEG, differentially
expressed gene; AAA, abdominal aortic aneurysm. |
Screening of the DEGs
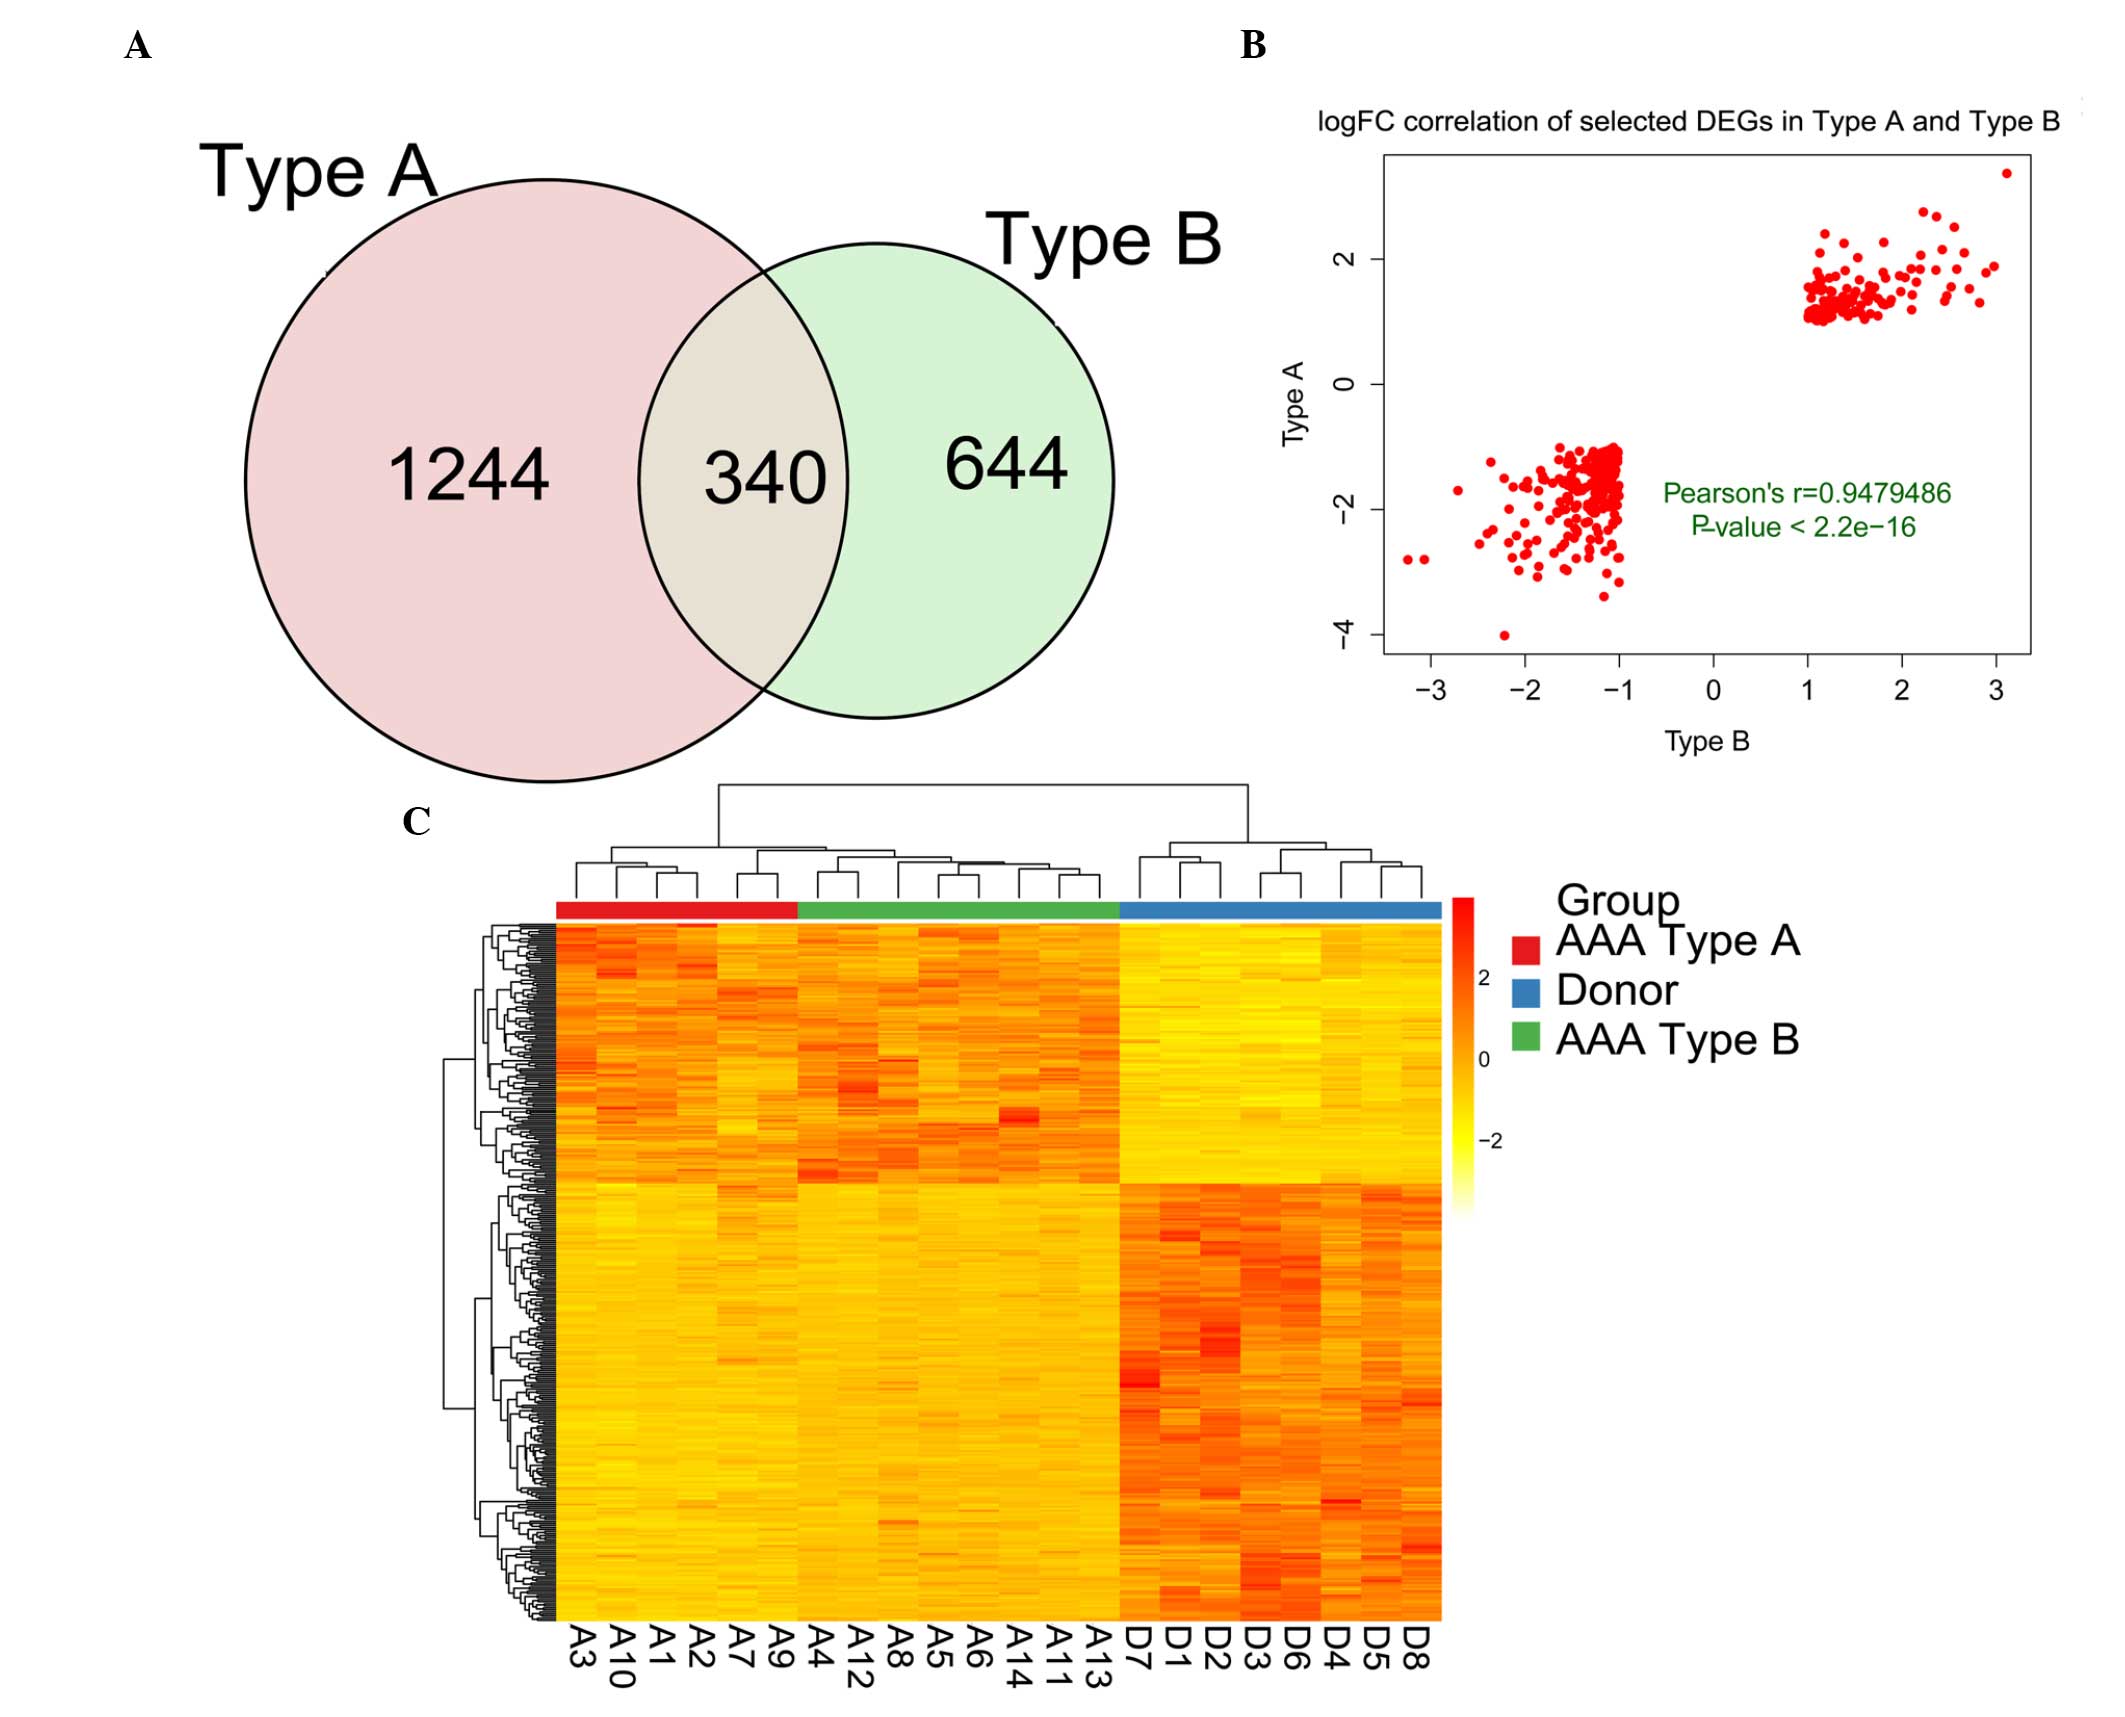
Comparing the AAA type A samples with the donor
controls yielded the identification of 1,584 DEGs (Fig. 1C). Comparing the AAA type B samples
with the donor controls yielded 984 DEGs in total (Fig. 1D). A total of 340 genes were
identified as being DEGs common to each group, as revealed by the
Venn diagram (Fig. 2A), and
therefore, 338 DEGs exhibited a consistent change. An assessment of
the correlation of the 338 DEGs revealed a positive pattern of
correlation, with a Pearson's correlation coefficient (r) of 0.974
(P<2.2−16). The top three upregulated and
downregulated DEGs, with the highest logFC, are listed in Table I. Subsequently, the expression
pattern of the DEGs was determined. From the heat map shown in
Fig. 2, it was observed that the
expression pattern of the DEGs enabled the AAA samples to be
distinguished from the donor control samples. Furthermore, the AAA
sample types A and B were consistent.
 | Table IDifferentially expressed genes in
Type A and Type B. |
Table I
Differentially expressed genes in
Type A and Type B.
| Probe ID | Expression
change | Gene symbol | Type A
| Type B
|
|---|
| logFC | adj.P.Val | logFC | adj.P.Val |
|---|
| ILMN_1899549 | Upregulated | NA | 3.369751 | 0.008994 | 3.112059 | 0.001856 |
| ILMN_1717168 | Upregulated | PCDHGA4 | 2.753187 |
1.33e−10 | 2.225494 |
5.06e−11 |
| ILMN_2177965 | Upregulated | RPS19BP1 | 2.678406 |
4.24e−8 | 2.365836 |
6.39e−9 |
| ILMN_2231051 | Downregulated | TCP11L2 | −3.164650 |
6.34e−8 | −1.003280 | 0.001986 |
| ILMN_1787591 | Downregulated | xpa | −3.391970 |
8.9e−8 | −1.162970 | 0.001270 |
| ILMN_1717733 | Downregulated | NA | −4.015280 |
3.99e−11 | −2.217670 |
5.8e−9 |
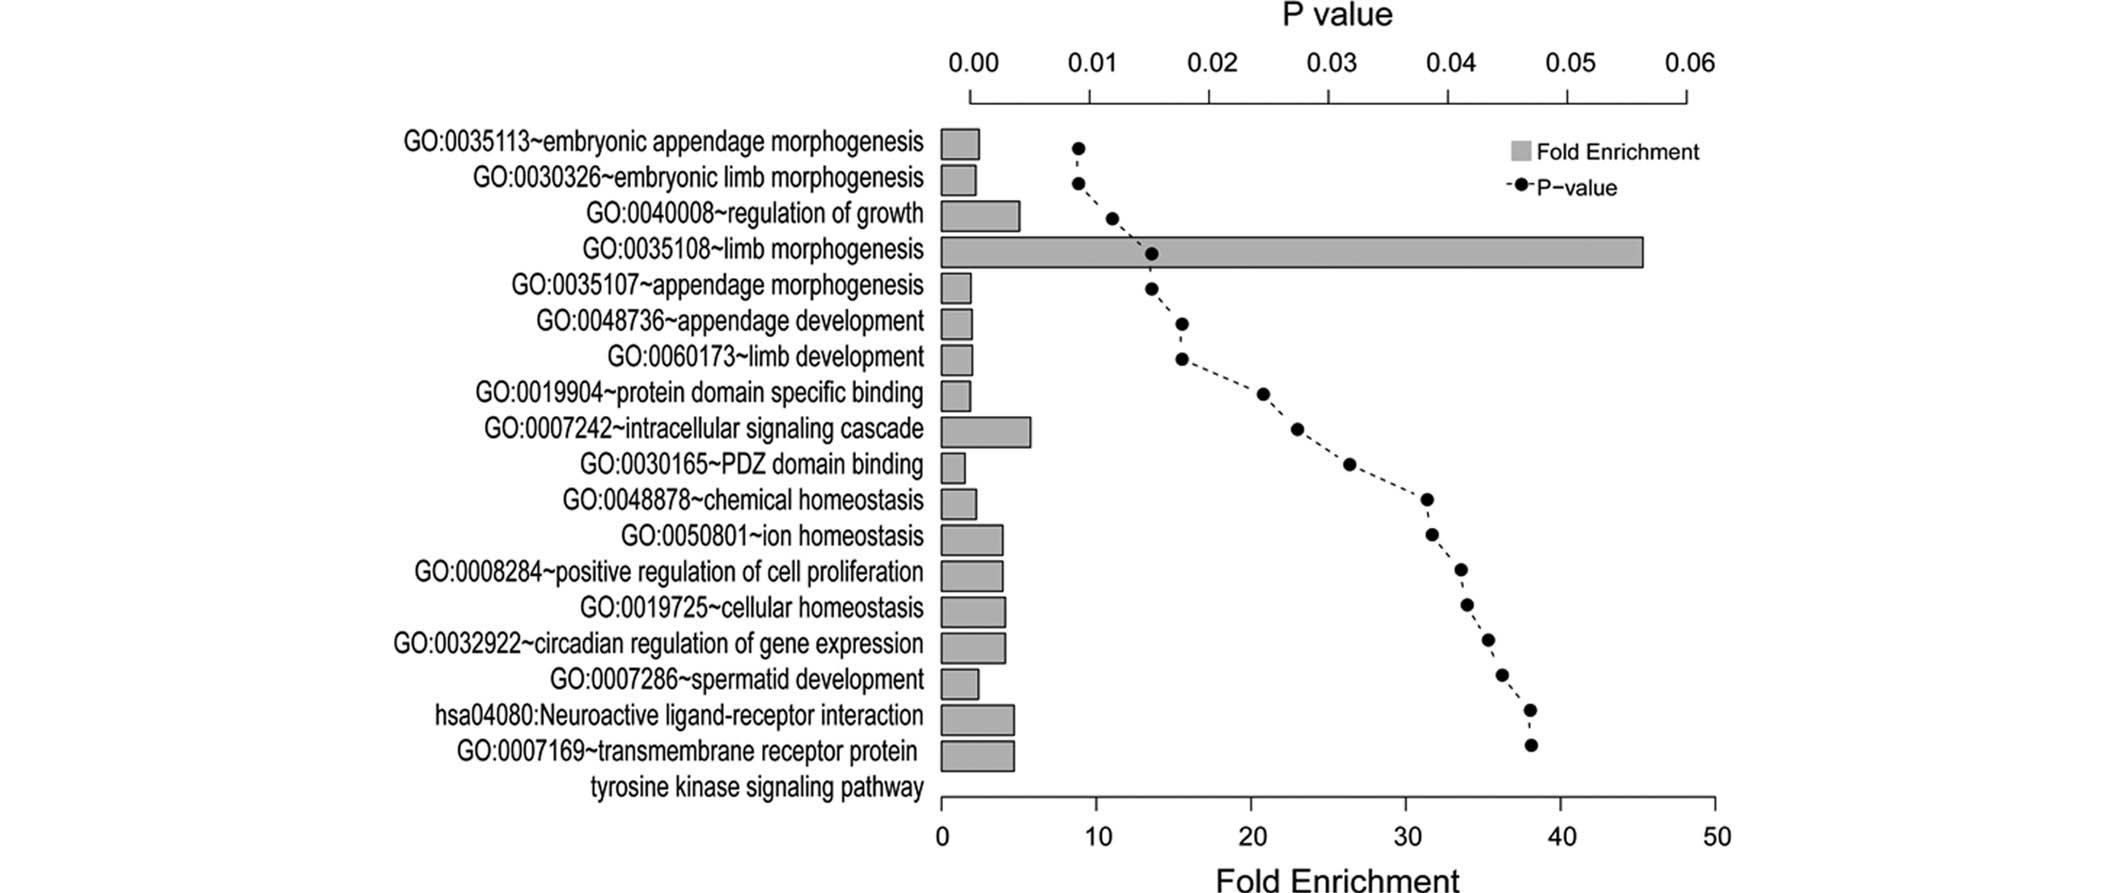
GO and KEGG enrichment analyses
The results of the GO and KEGG enrichment analyses
of the common DEGs using the DAVID tool are presented in Fig. 3. A total of 18 significantly
enriched categories were identified, which comprised 15 biological
processes, two molecular functions and one KEGG pathway, grouped
and annotated manually. The DEGs were predominantly associated with
limb development, including embryonic limb morphogenesis and
appendage development. The tyrosine kinase signaling pathway was
also significantly enriched.
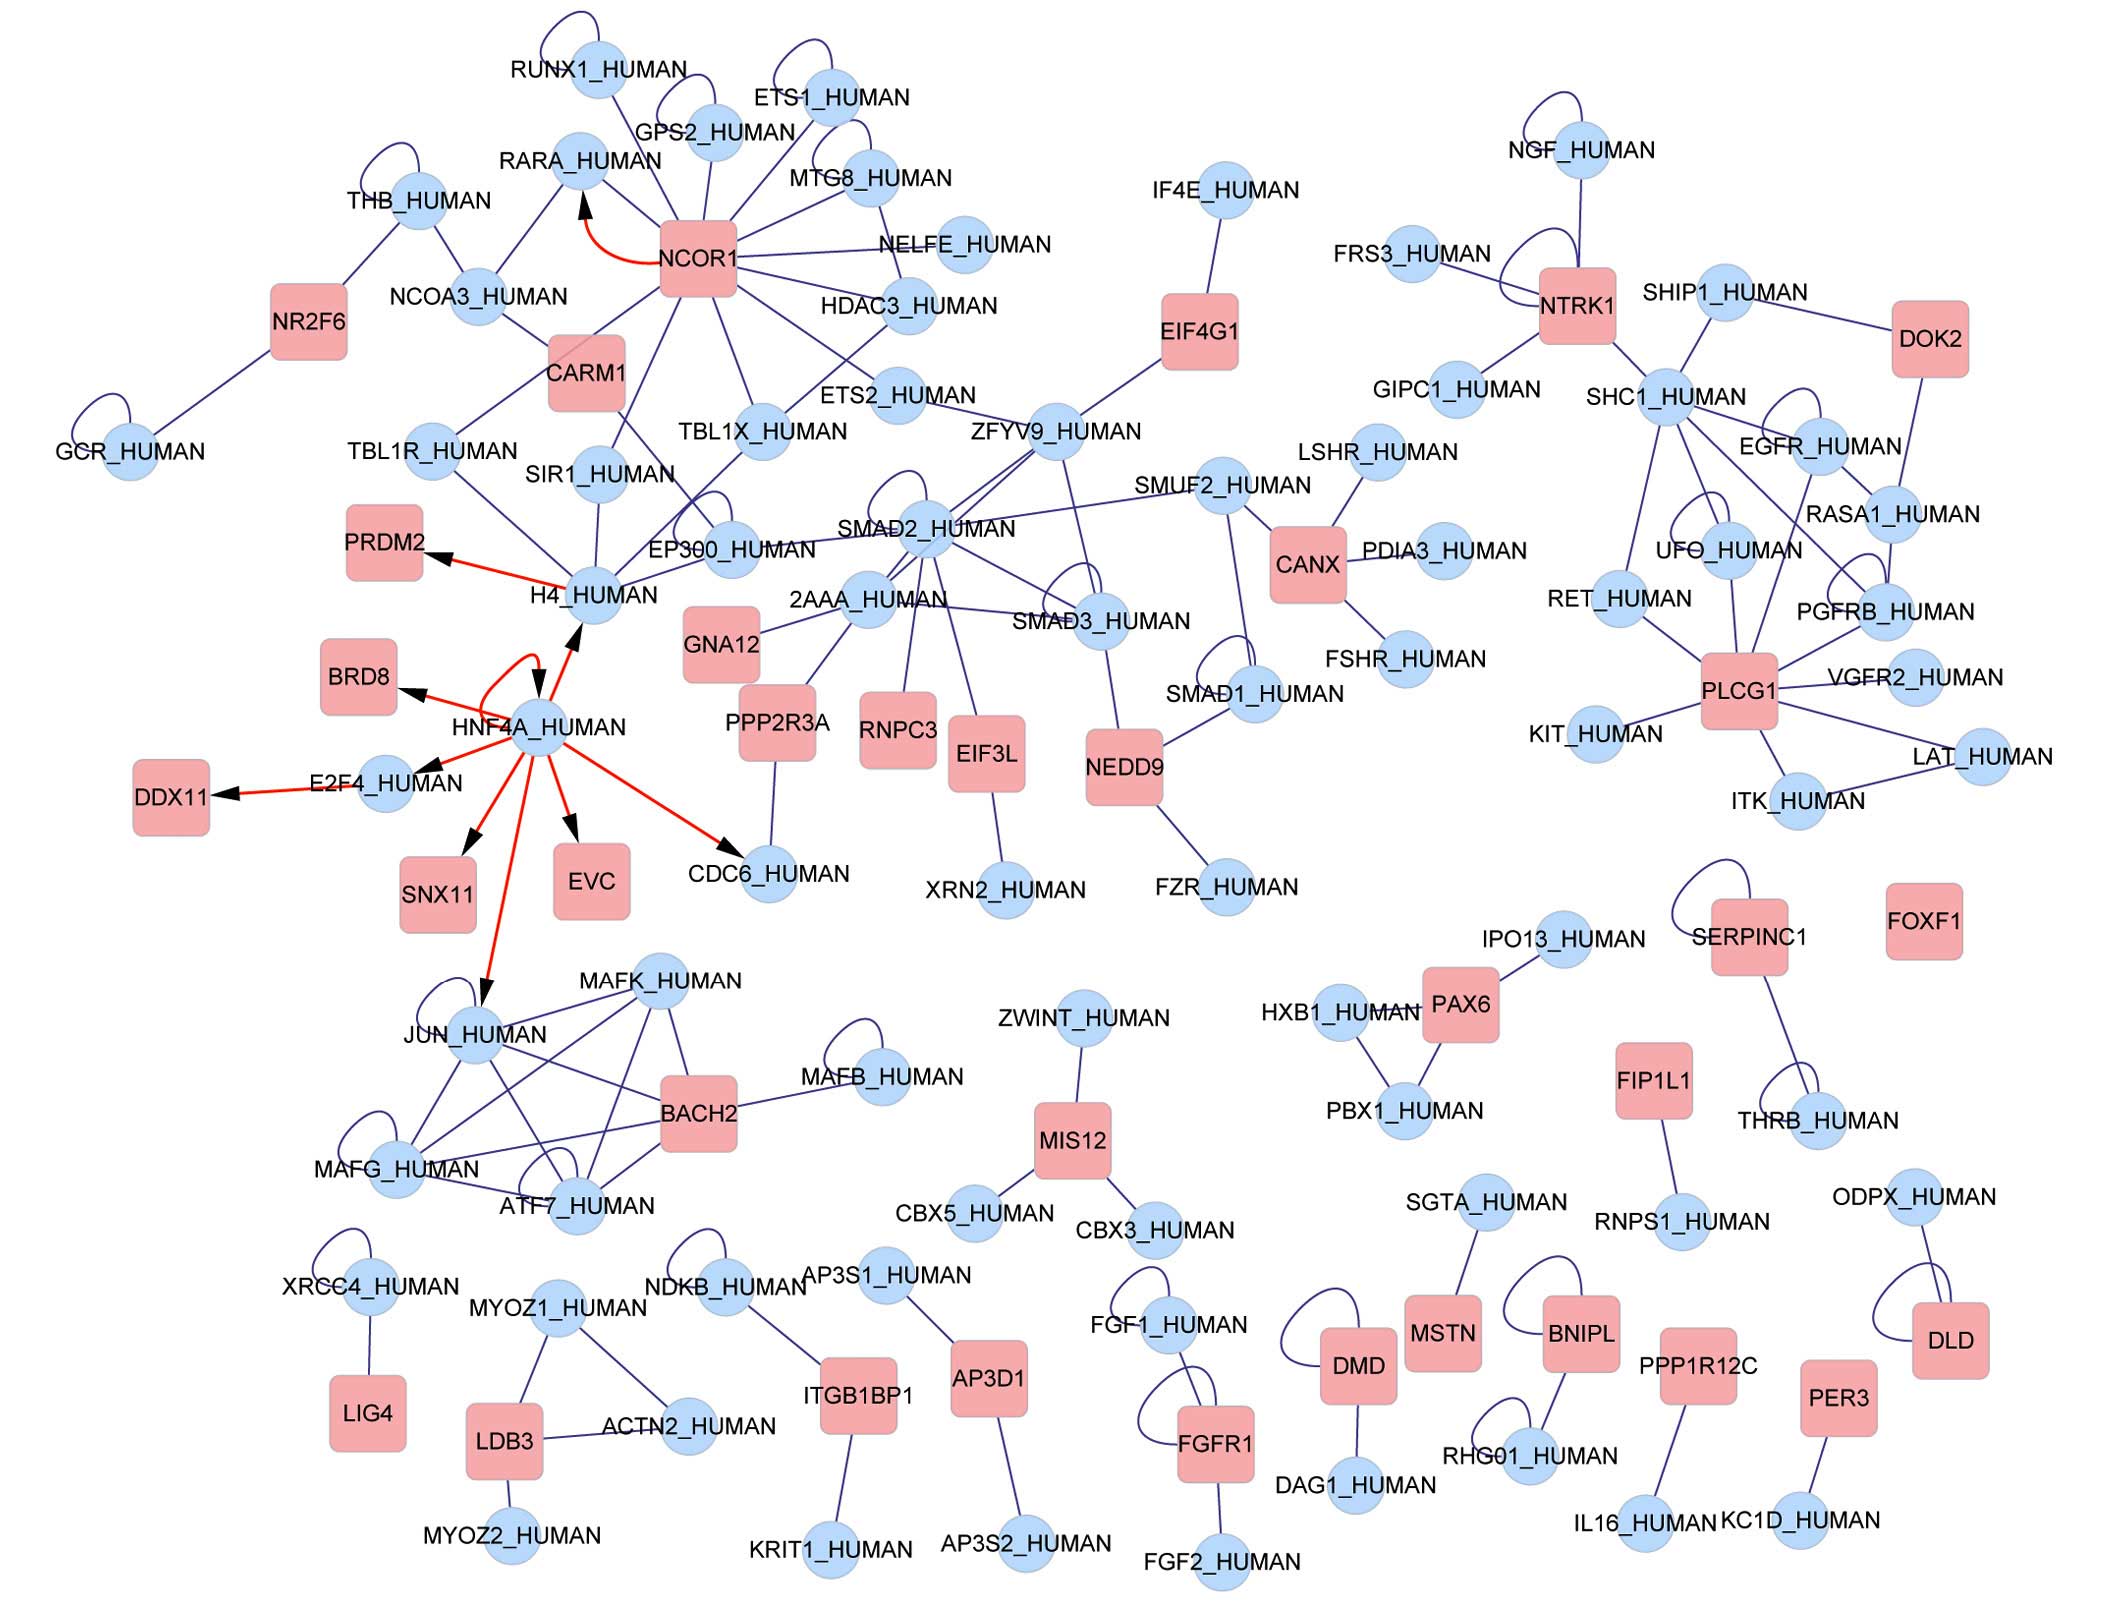
Interaction network and functional
analysis
The 338 probe sets, which were retained, were
mapped, in total, to 297 gene symbols. Interactions between the
genes were searched for in BIND and the results are presented in
Fig. 4. The transcriptional
factors nuclear receptor corepressor 1 (NCOR1), histone 4 (H4), E2F
transcription factor 4 (E2F4) and hepatocyte nuclear factor 4α
(HNF4A) were identified in the network to regulate other DEGs. Six
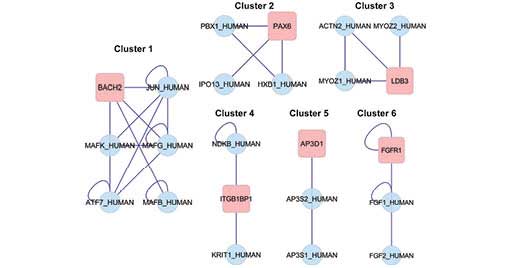
noteworthy clusters emerged from the clustering analysis (Table II) and the subnetwork diagram is
presented in Fig. 5.
| Table IINoteworthy clusters in the
network. |
Table II
Noteworthy clusters in the
network.
| Cluster | GO ID | Nodes | Density | Quality | P-value | Description | Genes in
cluster |
|---|
| 1 | 0043565 | 6 | 0.733 | 0.917 | 0.003 | Sequence-specific
DNA binding | BACH2, JUN, MAKF,
MAFG, ATF7, MAFB |
| 2 | 0045665 | 4 | 0.667 | 1 | 0.011 | Negative regulation
of neuron differentiation | PBX1, PAX6, IPO13,
HXB |
| 3 | 0031143 | 4 | 0.667 | 1 | 0.011 | Pseudopodium | ACTN2, MYOZ2,
MYOZ1, LDB3 |
| 4 | 0007242 | 3 | 0.667 | 1 | 0.026 | Intracellular
signaling cascade | NDKB, ITGB1BP1,
KRIT1 |
| 5 | 0030117 | 3 | 0.667 | 1 | 0.026 | Membrane coat | AP3D1, AP3S2,
AP3S1 |
| 6 | 0001759 | 3 | 0.667 | 1 | 0.026 | Induction of an
organ | FGR1, FGF1,
FGF2 |
Discussion
AAA is a complex disease, of which the pathobiology
remains to be fully elucidated (2). Previous studies have revealed that
the disease has a marked genetic component (12,14,31).
Assessing gene expression profiling in cases of disease may reveal
the underlying changes in gene activity, which contribute to the
disease and enable targets for therapeutic intervention to be
identified. In the present study, the gene expression profile
downloaded from the GEO database was used to examine the mechanism
of AAA development. A total of 340 genes were identified to be
commonly DEGs in AAA samples of type A compared with donor controls
and AAA samples of type B, among which 388 genes exhibited
consistent changes. The analysis of the DEGs indicated that they
were predominantly involved in limb development. The PPI network
analysis revealed that four transcription factors regulated these
DEGs in the network, and that NCOR1, H4 and E2F4 were clustered
across the network in association with HNF4A. Furthermore, c-jun
proto-oncogene (JUN) and its downstream components, which are
regulated upstream in the pathway by HNF4A, were enriched in
cluster 1.
NCOR1, which mediates transcriptional repression by
certain nuclear receptors, is a part of a complex, which promotes
histone deacetylation and the formation of repressive chromatin
structures, and which may impede the access of basal transcription
factors (32). MMPs exert a
significant role in the degradation of the extracellular matrix of
the vessel wall, which gradually leads to the formation of AAA
(33). Mannello et al
(34) demonstrated that MMP-3 may
degrade NCOR1 to prevent transcriptional repression of the
connective tissue growth factor promoter. In line with previous
studies, NCOR1 may exert a critical role in the development of AAA,
based on the PPI network analysis.
H4 is a core histone of the nucleosome, which
functions in nucleosomal wrapping and occupies a central role in
transcriptional regulation, DNA repair, DNA replication and
chromosomal stability (35).
Santos-Rosa et al (36)
reported that the histone code set up by post-translational histone
modifications also respond to DNA damage, which is frequently
observed in cancer cells. HNF4A is a transcriptionally controlled
transcription factor, and it may be essential for the development
of the kidney, liver and intestine (37,38).
A previous study revealed that phospholipase A2
g10-deficent mice were protected from angiotensin-II-induced aortic
aneurysms (39). Guan et al
(40) demonstrated that the
transcription levels of Pla2g12b were regulated by the
transcription factor HNF4A and its co-activator. Furthermore,
Soutoglou et al (41)
reported that HNF4A may interact with histone acetyltransferases, a
process which is dependent on the acetylation status of the
histones. In this context, and based on the results of the present
study, it was postulated that there may be an interaction between
the expression of H4 and HNF4A in the development of AAA.
E2F4 is a transcriptional activator, which binds DNA
co-operatively with differentially regulated transcription factor
proteins, whose products are involved in DNA replication and in
cell cycle regulation (42). The
transcription factor DRTF1/E2F complex functions in the control of
cell cycle progression from G1 to S phase (43). Tung et al (44) identified genes, which are involved
in cell cycle regulation in AAA, using a membrane-based
complementary DNA expression array. Talianidis et al
(45) demonstrated that complex
interactions between HNF4 bound to the proximal promoter and SP1
bound to multiple distal regulatory sites may lead to
transcriptional activation of liver-specific human apolipoprotein
CIII gene. SP1 is a cellular transcription factor involved in a
wide variety of processes, and it has been determined to bind to
different promoters to regulate transcription (46). In addition, Price et al
(47) determined that differences
in allelic expression of the MMP-2 gene, which exerts a major role
in AAA formation, were attributed to the elimination of SP1
binding. Furthermore, the expression levels of HNF4A as a
hepatocyte marker for hepatic differentiation were increased in the
early G1 phase in human embryonic stem cells during their cell
cycle (48). Therefore, an
important interaction may occur between HNF4A and E2F4 in the
pathogenesis of AAA.
A previous study revealed that HNF4A may be a key
upstream mediator of JUN, whereas JUN was intimately associated
with BTB and CNC homology 1, basic leucine zipper transcription
factor 2 (BACH2), which is involved in the lymphocyte signaling
pathway in cluster 1 (49).
Henderson et al (50)
demonstrated the death of smooth muscle cells and the expression of
mediators of apoptosis by T lymphocytes in human AAA. A previous
study revealed that the inhibition of c-Jun N-terminal kinase
caused regression of AAA. In this context, it is surmised that JUN
may interact with BACH2 in the progression of AAA.
In conclusion, genes which are critical in the
development of AAA have been assessed based on the microarray data.
HNF4A exerts an important role in the development of AAA through
the interactions made with three other transcription factors (E2F4,
NCOR1 and H4), and the coordinated regulation of these
transcription factors may represent potential novel targets for the
mechanism underlying the development of AAA. The present study
offers novel insights into the pathobiology of AAA. Further studies
are required to confirm these intriguing results in terms of the
possible associations with the transcriptional factors.
Abbreviations:
|
AAA
|
abdominal aortic aneurysm
|
|
MMP
|
matrix metalloproteinase
|
|
DEG
|
differentially expressed gene
|
|
GEO
|
gene expression omnibus
|
|
MDS
|
multi-dimensional scaling
|
|
FDR
|
false discovery rate
|
|
FC
|
fold change
|
References
|
1
|
Golledge J, Muller J, Daugherty A and
Norman P: Abdominal aortic aneurysm: Pathogenesis and implications
for management. Arterioscler Thromb Vasc Biol. 26:2605–2613. 2006.
View Article : Google Scholar : PubMed/NCBI
|
|
2
|
Maegdefessel L, Dalman RL and Tsao PS:
Pathogenesis of abdominal aortic aneurysms: MicroRNAs, proteases,
genetic associations. Annu Rev Med. 65:49–62. 2014. View Article : Google Scholar
|
|
3
|
Verhoeven EL, Kapma MR, Groen H, Tielliu
IF, Zeebregts CJ, Bekkema F and van den Dungen JJ: Mortality of
ruptured abdominal aortic aneurysm treated with open or
endovascular repair. J Vasc Surg. 48:1396–1400. 2008. View Article : Google Scholar : PubMed/NCBI
|
|
4
|
Golledge J and Norman PE: Current status
of medical management for abdominal aortic aneurysm.
Atherosclerosis. 217:57–63. 2011. View Article : Google Scholar : PubMed/NCBI
|
|
5
|
Sakalihasan N, Limet R and Defawe O:
Abdominal aortic aneurysm. The Lancet. 365:1577–1589. 2005.
View Article : Google Scholar
|
|
6
|
Michel JB, Martin-Ventura JL, Egido J,
Sakalihasan N, Treska V, Lindholt J, Allaire E, Thorsteinsdottir U,
Cockerill G and Swedenborg J; FAD EU Consortium: Novel aspects of
the pathogenesis of aneurysms of the abdominal aorta in humans.
Cardiovasc Res. 90:18–27. 2011. View Article : Google Scholar :
|
|
7
|
Thomas M, Gavrila D, McCormick ML, Miller
FJ Jr, Daugherty A, Cassis LA, Dellsperger KC and Weintraub NL:
Deletion of p47phox attenuates angiotensin II-induced abdominal
aortic aneurysm formation in apolipoprotein E-deficient mice.
Circulation. 114:404–413. 2006. View Article : Google Scholar : PubMed/NCBI
|
|
8
|
Sharma AK, Lu G, Jester A, Johnston WF,
Zhao Y, Hajzus VA, Saadatzadeh MR, Su G, Bhamidipati CM, Mehta GS,
et al: Experimental abdominal aortic aneurysm formation is mediated
by IL-17 and attenuated by mesenchymal stem cell treatment.
Circulation. 126(Suppl 1): S38–S45. 2012. View Article : Google Scholar : PubMed/NCBI
|
|
9
|
Harrison SC, Smith AJ, Jones GT, Swerdlow
DI, Rampuri R, Bown MJ; Aneurysm Consortium; Folkersen L, Baas AF,
de Borst GJ, et al: Interleukin-6 receptor pathways in abdominal
aortic aneurysm. Eur Heart J. 34:3707–3716. 2013. View Article : Google Scholar :
|
|
10
|
Kunieda T, Minamino T, Nishi J, Tateno K,
Oyama T, Katsuno T, Miyauchi H, Orimo M, Okada S, Takamura M, et
al: Angiotensin II induces premature senescence of vascular smooth
muscle cells and accelerates the development of atherosclerosis via
a p-21 dependent pathway. Circulation. 114:953–960. 2006.
View Article : Google Scholar : PubMed/NCBI
|
|
11
|
Manning MW, Cassis LA and Daugherty A:
Differential effects of doxycycline, a broad-spectrum matrix
metalloproteinase inhibitor, on angiotensin II-induced
atherosclerosis and abdominal aortic aneurysms. Arterioscler Thromb
Vasc Biol. 23:483–488. 2003. View Article : Google Scholar
|
|
12
|
Hinterseher I, Tromp G and Kuivaniemi H:
Genes and abdominal aortic aneurysm. Ann Vasc Surg. 25:388–412.
2011. View Article : Google Scholar :
|
|
13
|
Hinterseher I, Erdman R, Elmore JR, Stahl
E, Pahl MC, Derr K, Golden A, Lillvis JH, Cindric MC, Jackson K, et
al: Novel pathways in the pathobiology of human abdominal aortic
aneurysms. Pathobiology. 80:1–10. 2013. View Article : Google Scholar :
|
|
14
|
Golledge J and Kuivaniemi H: Genetics of
abdominal aortic aneurysm. Curr Opin Cardiol. 28:290–296. 2013.
View Article : Google Scholar : PubMed/NCBI
|
|
15
|
Duftner C, Seiler R, Dejaco C, Fraedrich G
and Schirmer M: Increasing evidence for immune-mediated processes
and new therapeutic approaches in abdominal aortic aneurysms-a
review. Ann N Y Acad Sci. 1085:331–338. 2006. View Article : Google Scholar : PubMed/NCBI
|
|
16
|
Kuivaniemi H, Platsoucas CD and Tilson MD
III: Aortic aneurysms: An immune disease with a strong genetic
component. Circulation. 117:242–252. 2008. View Article : Google Scholar : PubMed/NCBI
|
|
17
|
Biros E, Moran CS, Rush CM, Gäbel G,
Schreurs C, Lindeman JH, Walker PJ, Nataatmadja M, West M, Holdt
LM, et al: Differential gene expression in the proximal neck of
human abdominal aortic aneurysm. Atherosclerosis. 233:211–218.
2014. View Article : Google Scholar : PubMed/NCBI
|
|
18
|
Dunning MJ, Smith ML, Ritchie ME and
Tavaré S: Beadarray: R classes and methods for Illumina bead-based
data. Bioinformatics. 23:2183–2184. 2007. View Article : Google Scholar : PubMed/NCBI
|
|
19
|
Bolstad BM: Probe level quantile
normalization of high density oligonucleotide array data.
Unpublished manuscript. 2001
|
|
20
|
Choi J: Guide: A desktop application for
analysing gene expression data. BMC Genomics. 14:6882013.
View Article : Google Scholar : PubMed/NCBI
|
|
21
|
Smyth GK: Limma: Linear models for
microarray data. Bioinformatics and computational biology solutions
using R and Bioconductor. Springer; New York: pp. 397–420. 2005,
View Article : Google Scholar
|
|
22
|
Benjamini Y and Hochberg Y: Controlling
the false discovery rate: a practical and powerful approach to
multiple testing. J R Stat Soc Series B Stat Methodol. 57:289–300.
1995.
|
|
23
|
Makova KD and Li WH: Divergence in the
spatial pattern of gene expression between human duplicate genes.
Genome Res. 7:1638–1645. 2003. View Article : Google Scholar
|
|
24
|
Huang da W, Sherman BT and Lempicki RA:
Systematic and integrative analysis of large gene lists using DAVID
bioinformatics resources. Nat Protoc. 4:44–57. 2009. View Article : Google Scholar : PubMed/NCBI
|
|
25
|
Huang da W, Sherman BT and Lempicki RA:
Bioinformatics enrichment tools: Paths toward the comprehensive
functional analysis of large gene lists. Nucleic Acids Res.
37:1–13. 2009. View Article : Google Scholar :
|
|
26
|
Ashburner M, Ball CA, Blake JA, Botstein
D, Butler H, Cherry JM, Davis AP, Dolinski K, Dwight SS, Eppig JT,
et al: Gene ontology: Tool for the unification of biology. The gene
ontology consortium. Nat Genet. 25:25–29. 2000. View Article : Google Scholar : PubMed/NCBI
|
|
27
|
Shannon P, Markiel A, Ozier O, Baliga NS,
Wang JT, Ramage D, Amin N, Schwikowski B and Ideker T: Cytoscape: A
software environment for integrated models of biomolecular
interaction networks. Genome Res. 13:2498–2504. 2003. View Article : Google Scholar : PubMed/NCBI
|
|
28
|
Martin A, Ochagavia ME, Rabasa LC, Miranda
J, Fernandez-de-Cossio J and Bringas R: BisoGenet: A new tool for
gene network building, visualization and analysis. BMC
Bioinformatics. 11:912010. View Article : Google Scholar : PubMed/NCBI
|
|
29
|
Bader GD, Betel D and Hogue CW: BIND: The
biomolecular interaction network database. Nucleic Acids Res.
31:248–250. 2003. View Article : Google Scholar : PubMed/NCBI
|
|
30
|
Nepusz T, Yu H and Paccanaro A: Detecting
overlapping protein complexes in protein protein interaction
networks. Nat Methods. 9:471–472. 2012. View Article : Google Scholar : PubMed/NCBI
|
|
31
|
Estrelinha M, Hinterseher I and Kuivaniemi
H: Gene expression studies in human abdominal aortic aneurysm. Rev
Vasc Med. 2:77–82. 2014. View Article : Google Scholar
|
|
32
|
Yoon HG, Chan DW, Reynolds AB, Qin J and
Wong J: N-CoR mediates DNA methylation-dependent repression through
a methyl CpG binding protein Kaiso. Mol Cell. 12:723–734. 2003.
View Article : Google Scholar : PubMed/NCBI
|
|
33
|
Saratzis A, Abbas AA, Kiskinis D, Melas N,
Saratzis N and Kitas GD: Abdominal aortic aneurysm: A review of the
genetic basis. Angiology. 62:18–32. 2011. View Article : Google Scholar
|
|
34
|
Mannello F and Medda V: Nuclear
localization of matrix metalloproteinases. Prog Histochem Cytochem.
47:27–58. 2012. View Article : Google Scholar : PubMed/NCBI
|
|
35
|
Turner BM, Birley AJ and Lavender J:
Histone H4 isoforms acetylated at specific lysine residues define
individual chromosomes and chromatin domains in Drosophila polytene
nuclei. Cell. 69:375–384. 1992. View Article : Google Scholar : PubMed/NCBI
|
|
36
|
Santos-Rosa H and Caldas C: Chromatin
modifier enzymes, the histone code and cancer. Eur J Cancer.
41:2381–2402. 2005. View Article : Google Scholar : PubMed/NCBI
|
|
37
|
Kanazawa T, Konno A, Hashimoto Y and Kon
Y: Hepatocyte nuclear factor 4 alpha is associated with survival of
the condensed mesenchyme in the developing mouse kidney. Dev Dyn.
239:1145–1154. 2010. View Article : Google Scholar : PubMed/NCBI
|
|
38
|
Sandovici I, Smith NH, Nitert MD, Ackers
Johnson M, Uribe-Lewis S, Ito Y, Jones RH, Marquez VE, Cairns W,
Tadayyon M, et al: Maternal diet and aging alter the epigenetic
control of a promoter-enhancer interaction at the Hnf4a gene in rat
pancreatic islets. Proc Natl Acad Sci USA. 108:5449–5454. 2011.
View Article : Google Scholar : PubMed/NCBI
|
|
39
|
Zack M, Boyanovsky BB, Shridas P, Bailey
W, Forrest K, Howatt DA, Gelb MH, de Beer FC, Daugherty A and Webb
NR: Group X secretory phospholipase A(2) augments angiotensin II
induced inflammatory responses and abdominal aortic aneurysm
formation in apoE-deficient mice. Atherosclerosis. 214:58–64. 2011.
View Article : Google Scholar
|
|
40
|
Guan M, Qu L, Tan W, Chen L and Wong CW:
Hepatocyte nuclear factor-4 alpha regulates liver triglyceride
metabolism in part through secreted phospholipase A2 GXIIB.
Hepatology. 53:458–466. 2011. View Article : Google Scholar : PubMed/NCBI
|
|
41
|
Soutoglou E, Katrakili N and Talianidis I:
Acetylation regulates transcription factor activity at multiple
levels. Mol Cell. 5:745–751. 2000. View Article : Google Scholar : PubMed/NCBI
|
|
42
|
Beijersbergen RL, Kerkhoven RM, Zhu L,
Carlée L, Voorhoeve PM and Bernards R: E2F-4, a new member of the
E2F gene family, has oncogenic activity and associates with p107 in
vivo. Genes Dev. 8:2680–2690. 1994. View Article : Google Scholar : PubMed/NCBI
|
|
43
|
Zheng N, Fraenkel E, Pabo CO and Pavletich
NP: Structural basis of DNA recognition by the heterodimeric cell
cycle transcription factor E2F-DP. Genes Dev. 13:666–674. 1999.
View Article : Google Scholar : PubMed/NCBI
|
|
44
|
Tung WS, Lee JK and Thompson RW:
Simultaneous analysis of 1176 gene products in normal human aorta
and abdominal aortic aneurysms using a membrane-based complementary
DNA expression array. J Vasc Surg. 34:143–150. 2001. View Article : Google Scholar : PubMed/NCBI
|
|
45
|
Talianidis I, Tambakaki A, Toursounova J
and Zannis VI: Complex interactions between SP1 bound to multiple
distal regulatory sites and HNF-4 bound to the proximal promoter
lead to transcriptional activation of liver-specific human APOCIII
gene. Biochemistry. 34:10298–10309. 1995. View Article : Google Scholar : PubMed/NCBI
|
|
46
|
Cook T, Gebelein B and Urrutia R: Sp1 and
its likes: Biochemical and functional predictions for a growing
family of zinc finger transcription factors. Ann N Y Acad Sci.
880:94–102. 1999. View Article : Google Scholar : PubMed/NCBI
|
|
47
|
Price SJ, Greaves DR and Watkins H:
Identification of novel, functional genetic variants in the human
matrix metalloproteinase-2 gene: Role of Sp1 in allele-specific
transcriptional regulation. J Biol Chem. 276:7549–7558. 2001.
View Article : Google Scholar
|
|
48
|
Pauklin S and Vallier L: The cell cycle
state of stem cells determines cell fate propensity. Cell.
155:135–147. 2013. View Article : Google Scholar : PubMed/NCBI
|
|
49
|
Cooper MD and Alder MN: The evolution of
adaptive immune systems. Cell. 124:815–822. 2006. View Article : Google Scholar : PubMed/NCBI
|
|
50
|
Henderson EL, Geng YJ, Sukhova GK,
Whittemore AD, Knox J and Libby P: Death of smooth muscle cells and
expression of mediators of apoptosis by T lymphocytes in human
abdominal aortic aneurysms. Circulation. 99:96–104. 1999.
View Article : Google Scholar : PubMed/NCBI
|