Introduction
Ovarian cancer is one of the leading contributors to
mortality rates in women worldwide, with a five-year survival rate
of 30–45% (1–3). There were ~21,880 new cases diagnosed
and 13,850 cases of associated mortality reported in the United
States in 2010 (4). Epithelial
ovarian cancer (EOC) is the most common histological type,
comprising 80–90% of all ovarian cancer cases (5). Chemotherapy is an important treatment
for EOC, and patients with advanced EOC have high initial response
rates to chemotherapy (≥80%); however, 70–80% of patients
eventually relapse, with a progression-free survival rate of 18
months (6,7). Although chemotherapy treatment
regimens have improved in previous decades, the efficacy of
chemotherapy for EOC has improved simultaneously. Multidrug
resistance (MDR) is the predominant reason for chemotherapy failure
and poor prognosis in patients with EOC (8).
The role of microRNAs (miRNAs; miRs), and their
target genes associated with MDR, in EOC have been investigated in
previous years (9). As a cluster
of small non-coding molecular RNAs, miRNAs are important in cell
differentiation, proliferation, apoptosis, organism growth and the
development of human disease (10–12).
Mature miRNA primarily targets the 3′-untranslated region (3′-UTR)
of an mRNA strand with a complementary sequence, and then induces
mRNA degradation or inhibits mRNA translation at the
post-transcriptional level (13–15).
The dysfunction of miRNAs is associated with the development and
metastasis of human cancer (16,17).
A single miRNA is able to target multiple mRNAs and,
similarly, a single mRNA can be targeted by multiple miRNAs,
forming multiple complex gene expression regulatory networks
(18). However, the mechanisms
underlying MDR in EOC remain to be fully elucidated. As integrated
network analysis has been applied in investigations of EOC as a
promising technique (19–23), it may provide important information
in investigating the molecular mechanisms underlying MDR in EOC. In
the present study four published microarray datasets (GSE41499,
GSE33482, GSE15372 and GSE28739) and 11 miRNAs (miR-130a, miR-214,
let-7i, miR-125b, miR-376c, miR-199a, miR-93, miR-141, miR-130b,
miR-193b* and miR-200c) were downloaded from public
databases in order to perform a comprehensive bioinformatics
analysis through gene expression analysis, signaling pathway
analysis, literature co-occurrence and miRNA-mRNA interaction
networks. The aim of the present study was to identify any
potential genes, and obtain their bioinformatics information,
highly associated with MDR in EOC.
Materials and methods
Microarray datasets/miRNAs/miRNA target
genes
The four microarray datasets, GSE41499, GSE33482,
GSE15372 and GSE28739, were downloaded from the Gene Expression
Omnibus database (GEO; http://www.ncbi.nlm.nih.gov/geo/) (28). All four microarray datasets
satisfied the following four criteria: i) Data contained
information regarding EOC genome-wide RNA expression; ii) data
provided a comparison of EOC samples between chemotherapy
resistance and chemotherapy sensitivity; iii) a minimum of three
samples were included in each group; iv) each sample provided
detailed information on chemotherapy resistance or sensitivity in
EOC (Table I).
 | Table ICharacteristics of the datasets
selected for the present study. |
Table I
Characteristics of the datasets
selected for the present study.
| GEO accession | Reference | Chip | Experimental
design | Probes | Chemotherapy
response
|
|---|
| Sensitivity | Resistance |
|---|
| GSE41499 | (24) | U133A | Paired cell lines
PEO1 and PEO4 | 22,277 | 4 | 4 |
| GSE33482 | (25) |
Agilent_HumanGenome | Paired cell lines
A2780 and A2780cis | 41,078 | 6 | 6 |
| GSE15372 | (26) | U133 Plus 2.0 | Paired cell lines
A2780 and Round5 A2780 | 54,675 | 5 | 5 |
| GSE28739 | (27) |
Agilent_Human1Av2 | Unpaired,
tissues | 16,096 | 20 | 30 |
A total of 11 miRNAs (miR-130a, miR-214, let-7i,
miR-125b, miR-376c, miR-199a, miR-93, miR-141, miR-130b,
miR-193b* and miR-200c) were investigated in PubMed
(http://www.ncbi.nlm.nih.gov/pubmed/;
Table II), which were those
reported to be highly associated with MDR in EOC (29–39).
The above-mentioned 11 miRNAs were entered into TargetScan
(http://genes.mit.edu/tscan/targetscan2003.html) and
PicTar (http://pictar.mdc-berlin.de/)
(40,41), respectively, to determine the
relative miRNA target genes.
| Table IICharacteristics of the miRNAs
selected for the present study |
Table II
Characteristics of the miRNAs
selected for the present study
| miRNA | Target gene | Expression in EOC
chemotherapy tissue/cell line | Reference |
|---|
| miR-130a | M-CSF | Downregulation | Sorrentino et
al (29) |
| miR-214 | PTEN | Upregulation | Yang et al
(30) |
| let-7i | / | Downregulation | Yang et al
(31) |
| miR-125b | Bak1 | Upregulation | Kong et al
(32) |
| miR-376c | ALK7 | Upregulation | Ye et al
(33) |
| miR-199a | CD44 | Downregulation | Cheng et al
(34) |
| miR-93 | PTEN | Upregulation | Fu et al
(35) |
| miR-141 | KEAP1 | Upregulation | van Jaarsveld et
al (36) |
| miR-130b | CSF-1 | Downregulation | Yang et al
(37) |
|
miR-193b* | / | Upregulation | Ziliak et al
(38) |
| miR-200c | TUBB3 | Upregulation | Prislei et
al (39) |
Gene expression analysis
The Benjamini-Hochberg (BH) (42) method was used to analyze gene
expression, which was performed in GEO2R (http://www.ncbi.nlm.nih.gov/geo/geo2r/) (43), a web tool allowing users to perform
R statistical analysis without command line expertise. An adjusted
P-value of P<0.05 was used as the screening criterion for
statistically significantly expressed genes. The fold change (FC)
method (44) was also used to
estimate gene expression. When logFC<0, the expression of the
genes was downregulated, whereas the expression of the genes was
upregulated when logFC>0.
Pathway enrichment analysis
Genetic pathway enrichment analysis was performed in
the Kyoto Encyclopedia of Genes and Genomes (KEGG) database using
the Database for Annotation, Visualization and Integrated Discovery
(DAVID) tool (http://david.abcc.ncifcrf.gov/) (45,46).
Another web server, DIANA-miRPath (http://www.microrna.gr/miRPathv2) (47) was also used, as it is specifically
designed for miRNA-targeted pathway analysis based on interaction
levels. Fisher's exact probability method was used to determine the
significant difference of pathway enrichment analysis, with
P<0.05 indicating significance.
Co-occurrence analysis
Text mining methods from the literature and disease
levels were combined to screen for MDR-associated genes in EOC,
which were performed in the COREMINE (http://www.coremine.com/medical/#search) and IPAD
(http://bioinfo.hsc.unt.edu/ipad/)
(48) databases, respectively. The
corresponding genes and the exact keywords 'drug resistance', 'drug
resistance, multiple' and 'drug resistance, neoplasm' were input in
COREMINE for co-occurrence analysis, and the disease information
between differentially expressed genes and EOC were mined in the
IPAD database. CytoScape2.6.1 software (49) was used to construct a graph of the
association between genes and MDR.
Integrated gene network analysis
Integrated gene network analysis, based on miRNAs
and their target genes, was performed using Pajek software
(50). The topological
characteristics of the integrated gene network comprised degree
centralization (DC), betweenness centralization (BC), closeness
centralization (CC) and clustering coefficient (CC′), which were
calculated using the Pajek software. Degree of node indicates the
number of adjacent nodes or connected edges each node has. The
higher the number of neighbors (nodes and edges) a node has, the
more importance it has in the network. Therefore, the node is also
called a hub node (51).
Correspondingly, the gene in the position of the hub node was
termed the hub gene. The binding sites of the miRNA-target
interactions were finally analyzed in StarBase (http://star-base.sysu.edu.cn/) (52), which was designed for deciphering
miRNA-target interactions, including miRNA-mRNA interaction
networks from large-scale CLIP-Seq data.
Results
Gene expression and miRNA target
genes
Using the BH method in GEO2R, a total of 5,003
significantly expressed genes were obtained from GSE41499, 3,372
from GSE33482, 2,029 from GSE15372 and 267 from GSE28739. Among
these, 2,505 genes were upregulated and 2,498 were downregulated in
GSE41499, 1,487 genes were upregulated and 1,885 genes were
downregulated in GSE33482, 798 genes were upregulated and 1,231
genes were downregulated in GSE15372, and 180 genes were
upregulated and 87 genes were downregulated in GSE28739,
respectively.
The present study also obtained 47,077 target genes
using TargetScan and 1,675 target genes using PicTar, based on the
previously mentioned 11 miRNAs (miR-130a, miR-214, let-7i,
miR-125b, miR-376c, miR-199a, miR-93, miR-141, miR-130b,
miR-193b* and miR-200c).
Pathway enrichment analysis
Genetic pathway enrichment analysis were performed
in the KEGG database using the DAVID tool, based on upregulated
genes and downregulated genes from the four microarray datasets
(GSE41499, GSE33482, GSE15372 and GSE28739). A total of 11
upregulated signaling pathways were enriched in the KEGG database,
including the mitogen-activated protein kinase (MAPK) signaling
pathway, ubiquitin-mediated proteolysis, axon guidance, focal
adhesion, neurotrophin signaling pathway, pathways in cancer, renal
cell carcinoma, citrate cycle, terpenoid backbone biosynthesis,
mismatch repair and Huntington's disease. In addition, seven
downregulated signaling pathways were identified, including
glycerolipid metabolism, pentose phosphate pathway, fructose and
mannose metabolism, glutathione metabolism, proteasome, p53
signaling pathway and lysosome. The corresponding upregulated and
downregulated genes are shown in Tables III and IV, respectively.
| Table IIICommon upregulated pathways and their
corresponding genes. |
Table III
Common upregulated pathways and their
corresponding genes.
| Upregulated
pathway | Upregulated
gene |
|---|
| MAPK signaling
pathway | FLNA, FLNC,
MAPK8IP2, NF1 |
| Ubiquitin mediated
proteolysis | CDC16, CDC34,
CUL4A, NEDD4, UBE2D1 |
| Axon guidance | CXCR4, DPYSL2, FYN,
NRP1, SLIT2 |
| Focal adhesion | CAV1, FLNA, FLNC,
FYN, PIK3CA |
| Neurotrophin
signaling pathway | BDNF, PIK3CA,
SHC3 |
| Pathways in
cancer | CSF2RA, EPAS1,
FGF18, FGF5, FZD2, FZD7, PIK3CA, TGFB2 |
| Renal cell
carcinoma | EPAS1, PIK3CA,
TGFB2 |
| Citrate cycle | ACLY, ACO1, ACO2,
FH, IDH3B, IDH3G, PDHA1, SDHA |
| Terpenoid backbone
biosynthesis | ACAT2, HMGCR, IDI1,
MVD |
| Mismatch
repair | EXO1, RFC2, RFC4,
RFC5 |
| Huntington's
disease | CLTB, NDUFB3,
NDUFB8, NDUFS6, NDUFV1, SDHA |
| Table IVCommon downregulated pathways and
their corresponding genes. |
Table IV
Common downregulated pathways and
their corresponding genes.
| Downregulated
pathway | Downregulated
gene |
|---|
| Glycerolipid
metabolism | AGPAT3, PNPLA3,
PPAP2C |
| Pentose phosphate
pathway | PFKL, PGD,
PGM1 |
| Fructose and
mannose metabolism | PFKL |
| Glutathione
metabolism | ALDH9A1, HIBCH |
| Proteasome | ACACA, ALDH9A1,
HIBCH |
| P53 signaling
pathway | CDKN2C, MCM6, SKP2,
TTK |
| Lysosome | FAS, RRM2 |
Co-occurrence analysis
The involvement of 11 significantly expressed genes
in cancer drug resistance determined in the COREMINE database, on
the basis of literature co-occurrence (Fig. 1), whereas eight genes associated
with MDR in ovarian cancer were identified in the IPAD database.
Among these, five genes, including aconitase 1 (ACO1),
brain-derived neurotrophic factor (BDNF), chemokine (C-X-C motif)
receptor 4 (CXCR4), 3-hydroxy-3-methylglutaryl-CoA reductase
(HMGCR) and neuropilin 1 (NRP1) were upregulated, and three genes
[FAS, cyclin-dependent kinase inhibitor (CDKN)2C) and S-phase
kinase-associated protein 2 (SKP2)] were downregulated. In
addition, three important signaling pathways were identified in the
IPAD database, including the MAPK signaling pathway, the P53
signaling pathway and axon guidance (Table V).
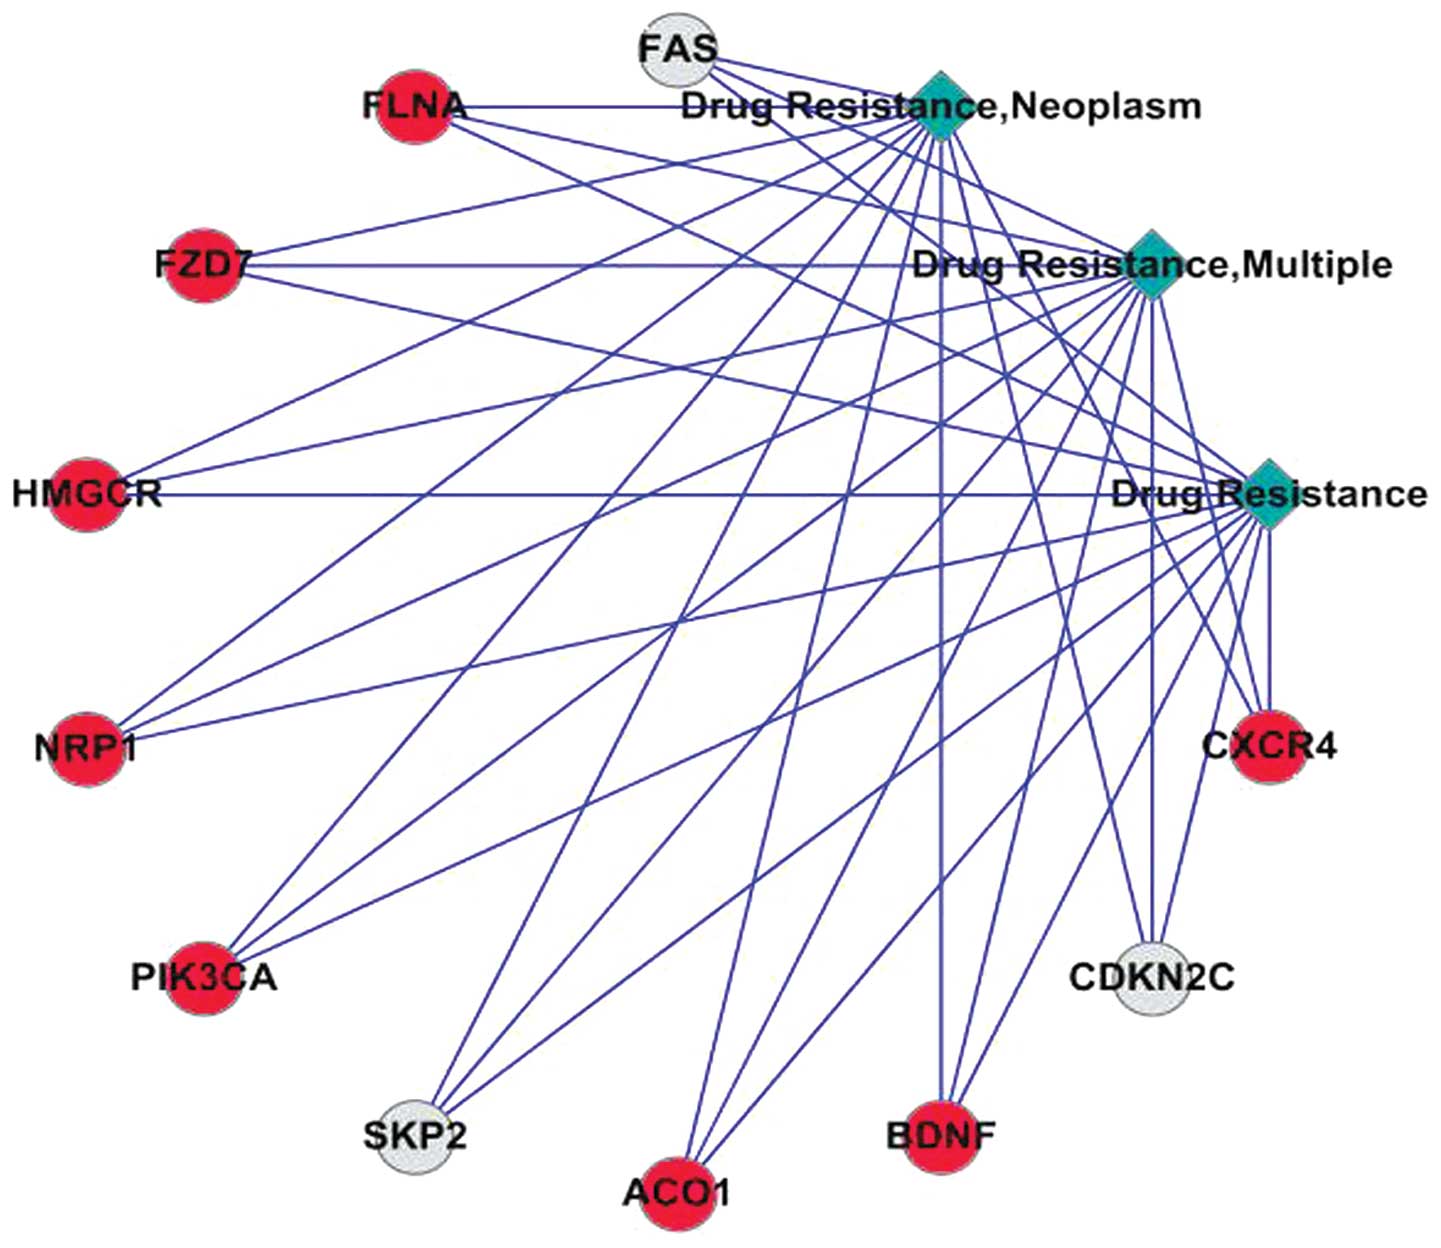 | Figure 1Co-occurrence analysis of
significantly expressed genes in multidrug resistance. Red circles
represent upregulated genes and grey circles downregulated genes.
The lines represent the co-occurrence between nodes. CXCR4,
chemokine (C-X-C motif) receptor 4; CDKN2C, cyclin-dependent kinase
inhibitor 2C; BDNF, brain-derived neurotrophic factor; ACO1,
aconitase 1; SKP2, S-phase kinase-associated protein 2; PIK3CA,
phosphatidylinositol-4,5-bisphosphate 3-kinase (catalytic subunit
α); NRP1, neuropilin 1; HMGCR, 3-hydroxy-3-methylglutaryl-CoA
reductase; FLNA, filamin Aα. |
| Table VEnrichment analysis in the IPAD
database. |
Table V
Enrichment analysis in the IPAD
database.
| Signaling
pathway | Gene | Expression
status | AE | RE | MJI | P |
|---|
| Axon guidance | CXCR4, NRP1 | Upregulation | 2 | 35.89 | 0.21 | 0.04 |
| Axon guidance | NRP1 | Upregulation | 1 | 8.77 | 0.10 | 0.15 |
| MAPK signaling
pathway | BDNF | Upregulation | 1 | 8.54 | 0.10 | 0.15 |
| P53 signaling
pathway | FAS | Downregulation | 1 | 57.17 | 0.17 | 0.04 |
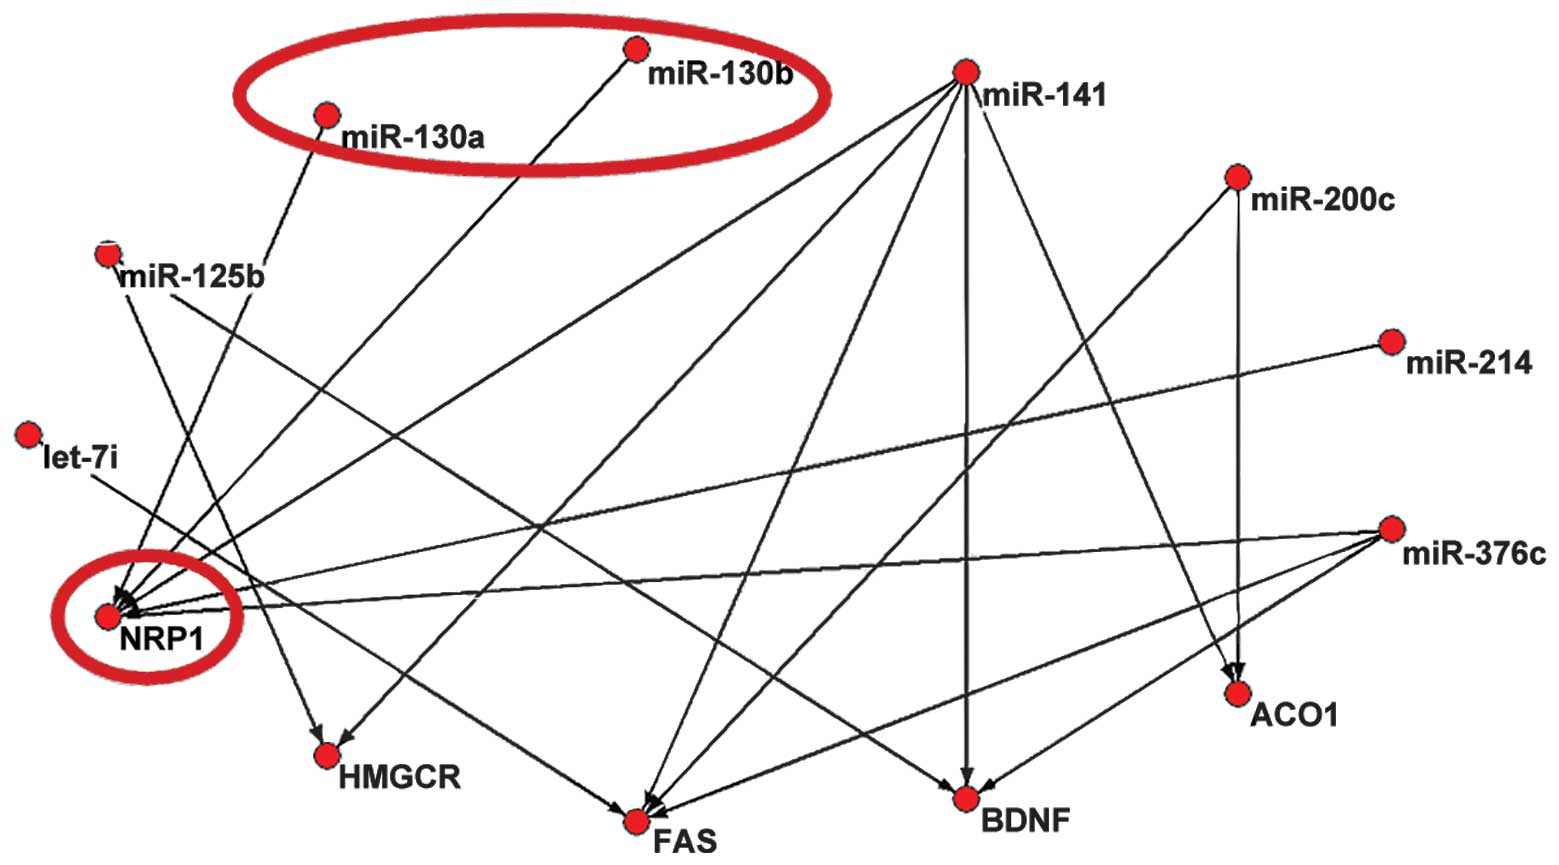
Integrated gene network analysis
The above-mentioned eight genes (ACO1, BDNF, CXCR4,
HMGCR, NRP1, CDKN2C, FAS and SKP2) interacted with the 47,077
target genes from TargetScan and 1,675 target genes from PicTar.
The corresponding text file was subsequently converted into a
format file (.net), to enable it to be recognized by the Pajek
software. Following these steps: File>Network>Read and
Draw>Net work>Layout>Circular>using Permutation
commands, the integrated gene network based on miRNAs and their
target genes (data from TargetScan) was constructed using Pajek
software. In the integrated gene network, the upregulated gene,
NRP1, was found to represent the most important hub gene (Fig. 2). Only NRP1, targeted by miR-130a
and miR-130b, was identified in PicTar.
The topological characteristics of the integrated
gene network, including DC, BC, CC and CC′ were 1.50, 0, 0.44 and
0, respectively. The BC and CC′ values of each node were 0, which
indicated that no clustering phenomenon existed in the whole or
local network. The calculated results of DC and CC are shown in
Table VI. The topological
analysis also demonstrated that the hub gene, NRP1, exhibited a
higher DC and CC, reflecting the orthocenter of the integrated gene
network.
| Table VITopological characteristics of the
integrated gene network. |
Table VI
Topological characteristics of the
integrated gene network.
| Node | DC | CC |
|---|
| let-7i | 1 | 0.342857 |
| miR-125b | 2 | 0.342857 |
| miR-130a | 1 | 0.363636 |
| miR-130b | 1 | 0.363636 |
| miR-141 | 5 | 0.631579 |
| miR-200c | 2 | 0.363636 |
| miR-214 | 1 | 0.363636 |
| miR-376c | 3 | 0.521739 |
| ACO1 | 2 | 0.428571 |
| BDNF | 3 | 0.461538 |
| FAS | 4 | 0.500000 |
| HMGCR | 2 | 0.428571 |
| NRP1 | 5 | 0.545455 |
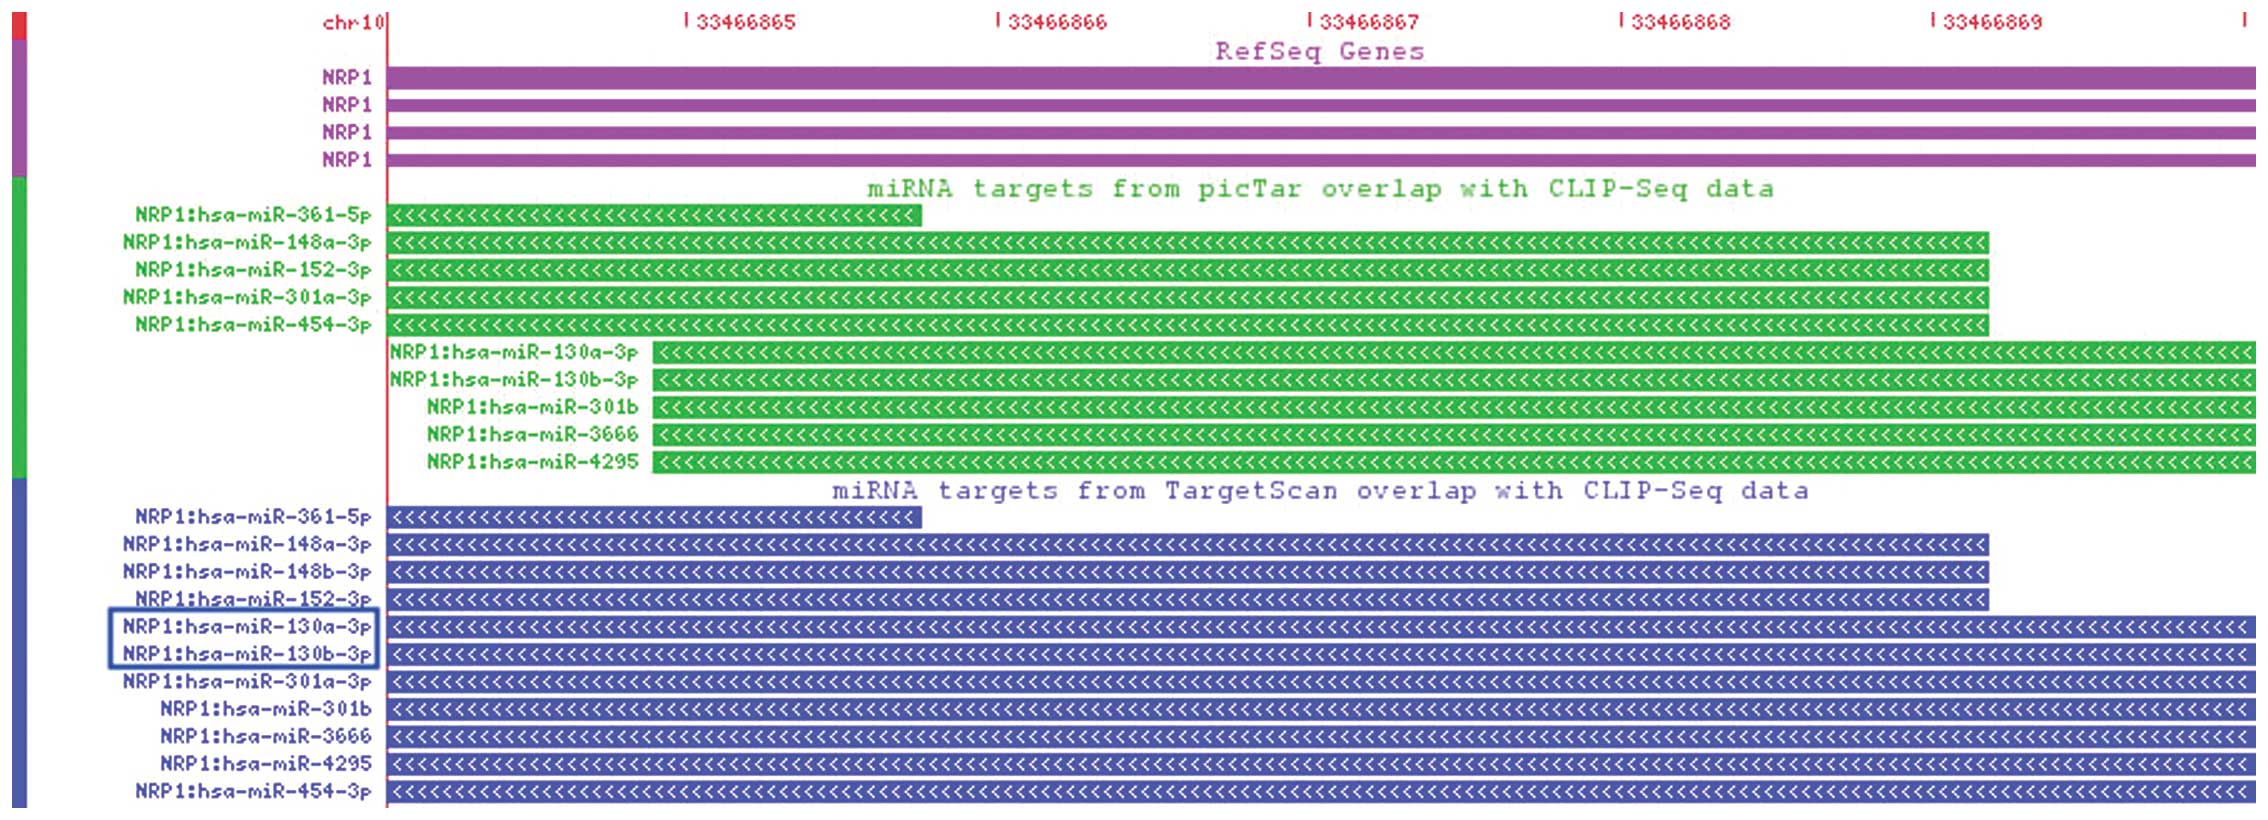
The binding sites between miR-130a and NRP1, and
miR-130b and NRP1 were identified in StarBase. The two binding
sites were found to be located on chromosome 10: 33466864-33466870,
determined by CLIP-Seq datasets in the deepView genome browser
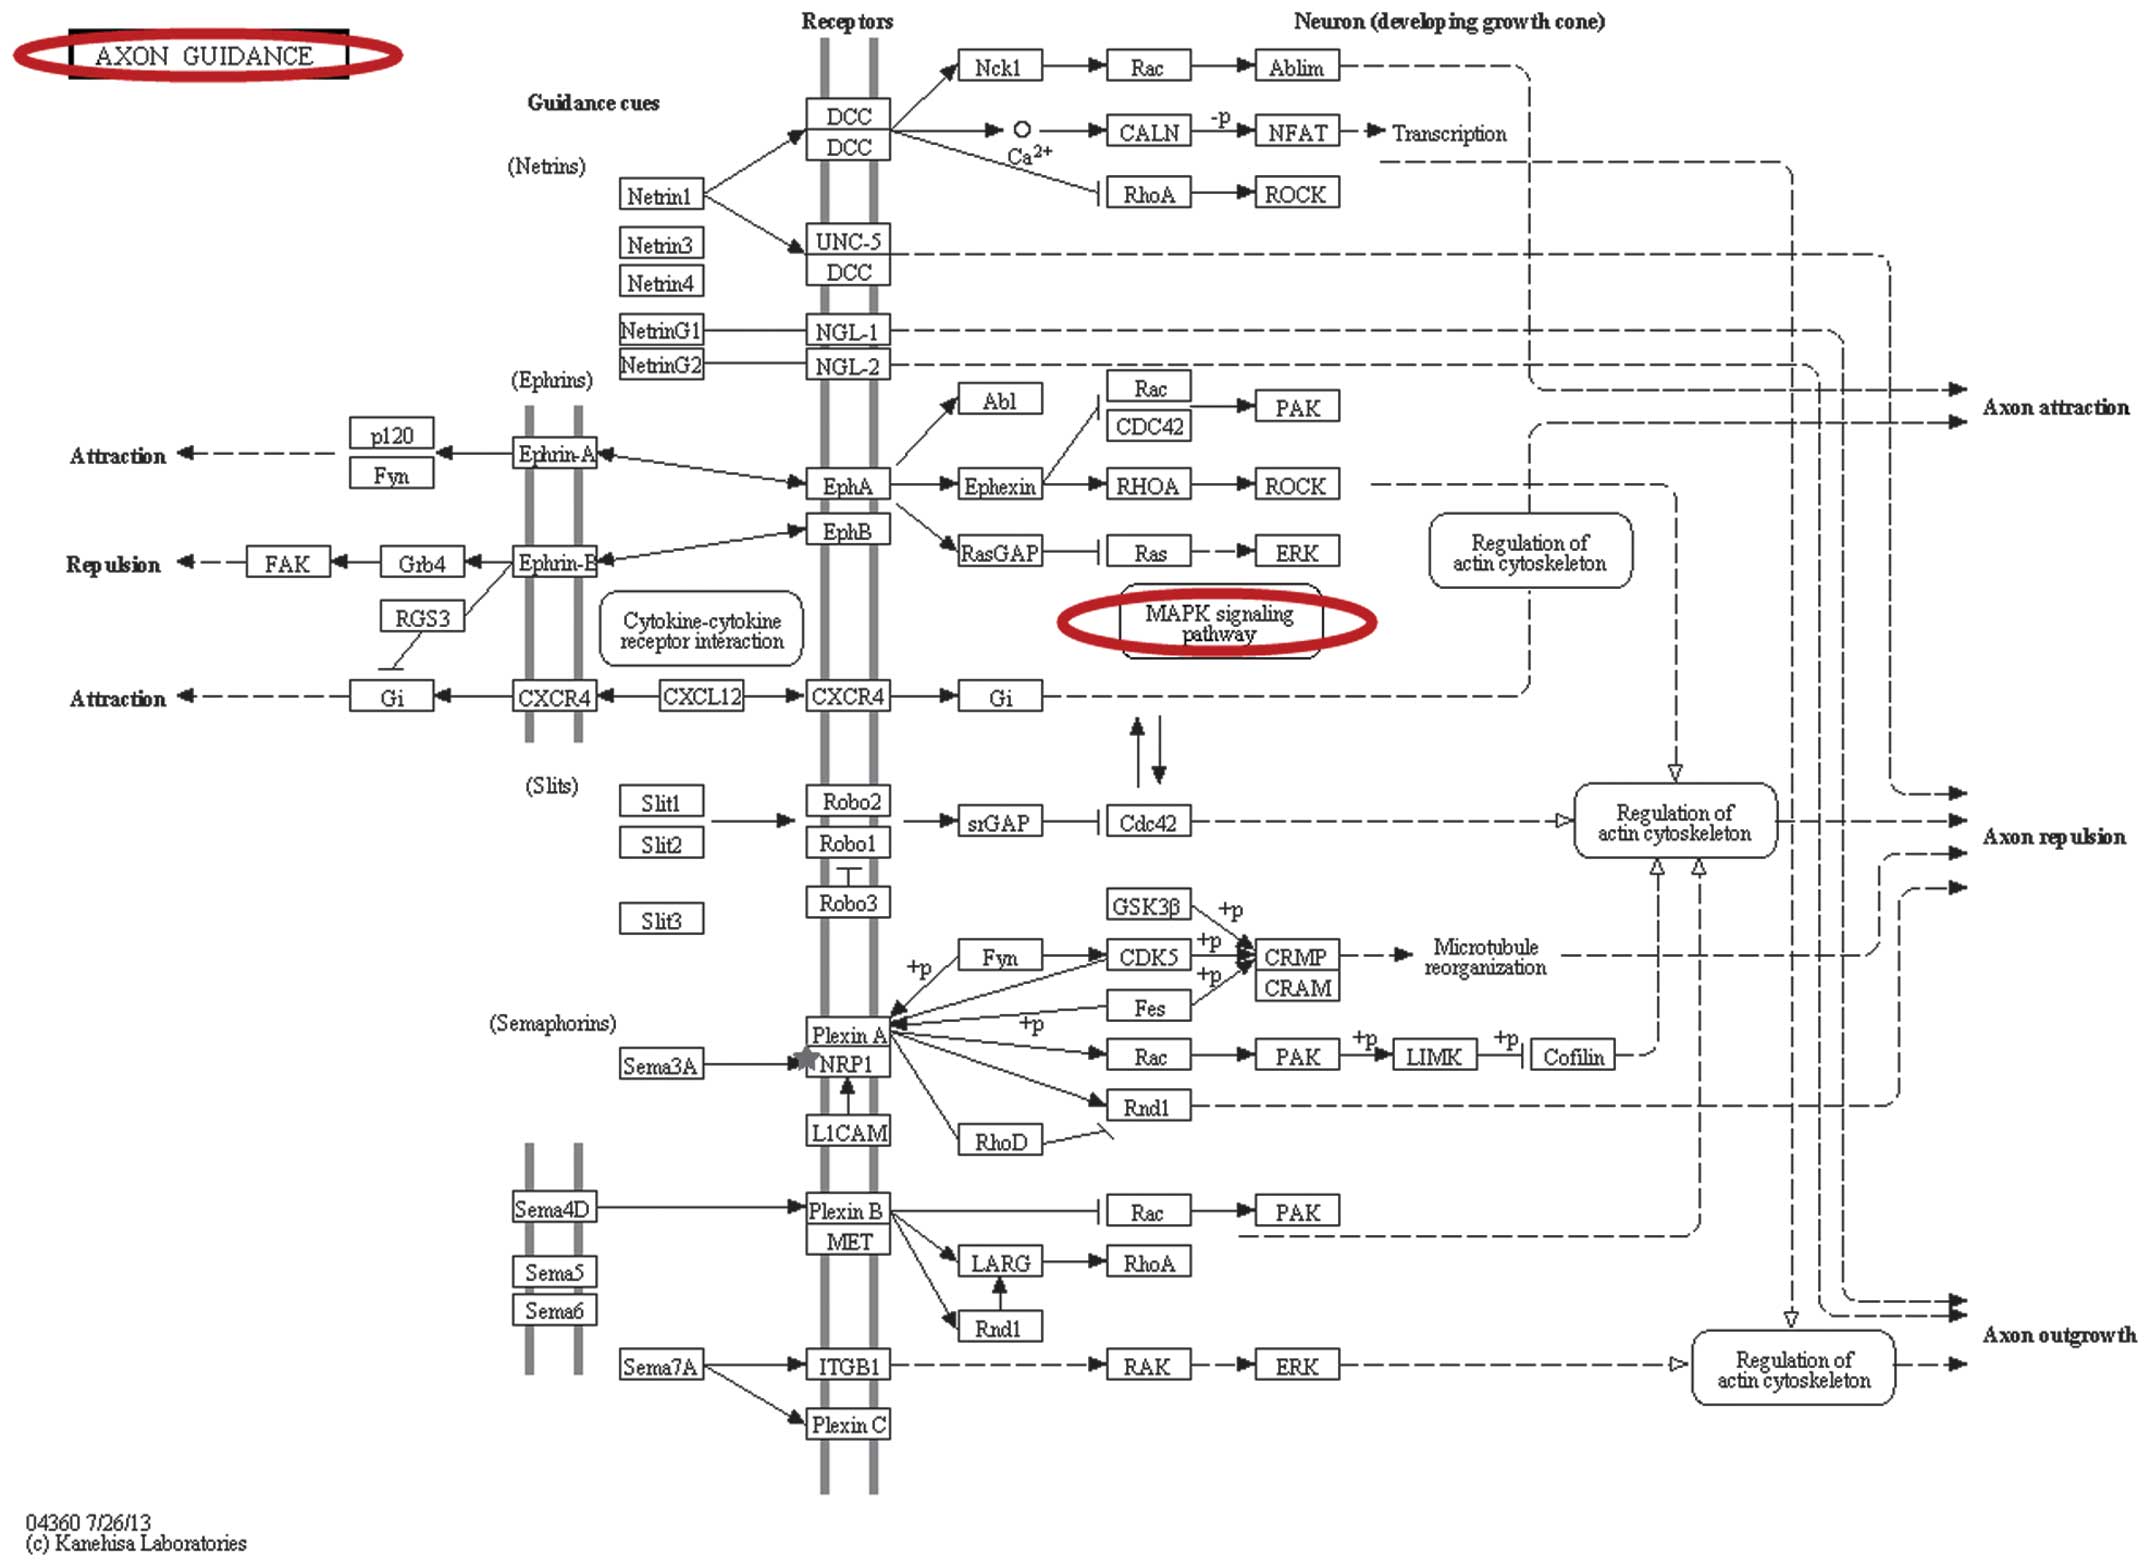
(Fig. 3). Axon guidance (Fig. 4) was identified based on miRNA
signaling pathway analysis in DIANA-miRPath, which involved the hub
NRP1 gene.
Discussion
MDR is the predominant form of tumor resistance to
chemotherapy, and was first reported by Biedler and Riehm in 1970
(53). MDR in EOC may involve
complex interactions among genes and other molecules, including
miRNAs, proteins or transcription factors, in numerous biological
processes. In organisms, these molecular interactions occur between
genes, between miRNAs and genes, and between miRNAs, forming
complex networks to regulate gene expression. Following the
construction of networks for miRNA target genes and transcription
factor target genes in ovarian cancer, a previous study identified
miR-16, cyclin E1, CDKN1A and E2F transcription factor 1 as hub
genes, all of which may be potential biomarkers for ovarian cancer
(54). However, there has been
little focus on MDR in EOC on the basis of integrated gene network
analysis of miRNAs and their target genes. In the present study, a
comprehensive bioinformatics analysis was performed through gene
expression, pathway enrichment, co-occurrence, and interaction
networks, based on published microarray datasets and miRNAs from
public databases. This was performed in order to predict the
potential molecular mechanism underlying MDR in EOC. The results of
the present study suggested that NRP1 was the hub gene of the
network, targeted by miR-130a and miR-130b. Therefore, axon
guidance involving NRP1 may be a novel signaling pathway for MDR in
EOC.
NRP family members have been an area of intense
investigation in the field of cancer research over the last 10
years (55,56). NRP receptors are expressed in
several types of tumor and endothelial cell, and interact with
various soluble molecules, including vascular endothelial growth
factor (VEGF), integrin, c-Met and transforming growth factor
receptors to modulate the progression of cancer (57). NRP1 encodes one of two NRPs, which
contain specific protein domains, allowing NRP1 to be involved in
various signaling pathways, which control cell migration (58). NRPs bind several ligands and
various types of co-receptors, including VEGF. VEGF has the ability
to promote cancer stemness and renewal by directly affecting cancer
stem cells via NRP1 in an autocrine loop, and deletion of NRP1 in
normal cells prevents tumor initiation (59). It has been reported that
immunoreactivity to NRP1 is observed in the vessels of normal
tissue samples adjacent to cancer tissue samples, as well as in
98–100% of carcinoma, and the inhibition of NRP1 signaling results
in defective angiogenesis and recapitulated the effects of
anti-VEGF treatment (60,61). It was also confirmed that knockdown
of NRP1 in regulatory T cells may delay or eliminate oncogeny in
mouse models of several types of human cancer (62). Disorders of the expression of NRP1
is widely observed in human cancer, including breast cancer,
colorectal cancer and chronic lymphocytic leukemia (63–65).
NRP1 in plasmacytoid dendritic cells and T regulatory cells is also
reported to be a promising therapeutic target for the treatment of
cancer (66).
Previously, the expression of NRP1 was found to be
upregulated in EOC, and high expression levels of NRP1 enhanced
proliferation and were associated with ovarian malignancy, making
NRP1 a potential drug targeting candidate for the treatment of EOC
(67). These results were
concordant with those of the present study. However, the
association between high expression levels of NRP1 and MDR in EOC
remains to be elucidated and requires further experimental
verification in the future.
The results of the present study also suggested that
axon guidance was involved in the alteration of the expression of
NRP1. The axon guidance signaling pathway represents a pivotal
stage in the development of the neuronal network. Axons are guided
along specific signaling pathways by various attractive and
repulsive guidance molecules, including netrins, slits, ephrins and
semaphorins, a number of which have been implicated in human
cancers (68–70). However, the role of axon guidance
in MDR in EOC remains to be fully elucidated. The present study
hypothesized that axon guidance is important in the formation of
MDR in EOC, as it acted as one of multiple developmental events in
the MAPK signaling pathway (Fig.
4) (71). The latter mediates
cisplatin-induced apoptosis and triggers DNA damage and drug
resistance in EOC (72,73). Further investigations are required
in order to investigate these hypotheses.
Bioinformatics analysis based on genes and miRNAs
has been used for investigations on chemotherapeutic response and
prognosis in EOC (74–76). MDR in EOC is often accompanied by
alterations in gene expression levels and dysfunction of miRNAs.
Alterations in gene expression and dysfunction of miRNAs often
affects signaling pathways involved in cell proliferation,
adhesion, migration, invasion, apoptosis, drug resistance and
survival (77–79). Gene expression analysis is one of
the basic methods of bioinformatics analysis, and is regularly used
to identify dysregulated genes serving as molecular markers for
EOC. As high-throughput gene expression data are available in the
GEO, four microarray datasets (GSE41499, GSE33482, GSE15372 and
GSE28739) were downloaded for gene expression analyses in the
present study, which were performed using an R-based web
application called GEO2R with the BH method. In addition, 11 miRNAs
were mined from previous literature, all of which were revealed to
be associated with MDR in EOC. The miRNA target genes in the
present study were mined from TargetScan and PicTar. TargetScan and
PicTar represent the first and second generation of miRNA target
prediction algorithms, respectively, and have high positive
predictive values (40,41). The similarity between the two
target prediction algorithms is that the seed sequence of miRNA is
complementary with the 3′-UTR of mRNA, characterized by a
thermodynamic dimer of miRNA target gene (40,41).
Furthermore, PicTar was developed based on the design of the first
generation of prediction algorithms, breaking the limitation of
cross-species conservation. The above characteristic form the basic
of integrated network analysis.
COREMINE is a web tool used for literature mining,
which performs automated analysis of titles and abstracts by
extracting experimental and theoretical biomedical data to create a
gene to gene co-citation network (44). IPAD is a web-based database and
tool used for mining gene function based on the enrichment analysis
of multiple genomic or proteomic data/sources. The present study
used a unique approach with that combined literature co-occurrence
and disease enrichment. Pathway enrichment combined with network
analysis was a further novel approach used in the present study.
This was performed to identify the potential genes involved in drug
resistance from putative pathways and manually drawn networks. All
theoretical conclusions of from the present study require
experimental validation and clinical cohorts in the future.
In conclusion, based on a comprehensive
bioinformatics analysis using gene expression analysis, signaling
pathway analysis, literature co-occurrence and miRNA-mRNA
interaction networks, the present study demonstrated that NRP1 is
targeted by miR-130a and miR-130b, and may contribute to MDR in
EOC. The binding sites of the miRNAs were found to be located on
chromosome 10: 33466864-33466870, and all located in axon guidance,
a potential pathway associated with MDR in EOC. To the best of our
knowledge, the present study is the first to report a gene function
of NRP1 associated with MDR in EOC. The findings provide important
information for further experimental investigations on the
MDR-associated functions of NRP1 in EOC.
Acknowledgments
The present study was supported by a grant from the
Natural Science Foundation of Guangxi, China (grant no.
2011GXNSFA018190).
References
|
1
|
Oberaigner W, Minicozzi P, Bielska-Lasota
M, Allemani C, de Angelis R, Mangone L and Sant M; Eurocare Working
Group: Survival for ovarian cancer in Europe: The across-country
variation did not shrink in the past decade. Acta Oncol.
51:441–453. 2012. View Article : Google Scholar : PubMed/NCBI
|
|
2
|
Corney DC and Nikitin AY: MicroRNA and
ovarian cancer. Histol Histopathol. 23:1161–1169. 2008.PubMed/NCBI
|
|
3
|
Matsuda A and Katanoda K: Five-year
relative survival rate of ovarian cancer in the USA, Europe and
Japan. Jpn J Clin Oncol. 44:1962014. View Article : Google Scholar : PubMed/NCBI
|
|
4
|
Jemal A, Siegel R, Xu J and Ward E: Cancer
statistics, 2010. CA Cancer J Clin. 60:277–300. 2010. View Article : Google Scholar : PubMed/NCBI
|
|
5
|
Samrao D, Wang D, Ough F, Lin YG, Liu S,
Menesses T, Yessaian A, Turner N, Pejovic T and Mhawech-Fauceglia
P: Histologic parameters predictive of disease outcome in women
with advanced stage ovarian carcinoma treated with neoadjuvant
chemotherapy. Transl Oncol. 5:469–474. 2012. View Article : Google Scholar
|
|
6
|
Rubin SC, Randall TC, Armstrong KA, Chi DS
and Hoskins WJ: Ten-year follow-up of ovarian cancer patients after
second-look laparotomy with negative findings. Obstet Gynecol.
93:21–24. 1999. View Article : Google Scholar : PubMed/NCBI
|
|
7
|
Lin H and Changchien CC: Management of
relapsed/refractory epithelial ovarian cancer: Current standards
and novel approaches. Taiwan J Obstet Gynecol. 46:379–388. 2007.
View Article : Google Scholar
|
|
8
|
Faggad A, Darb-Esfahani S, Wirtz R, Sinn
B, Sehouli J, Könsgen D, Lage H, Noske A, Weichert W, Buckendahl
AC, Budczies J, Müller BM, Elwali NE, Dietel M and Denkert C:
Expression of multidrug resistance-associated protein 1 in invasive
ovarian carcinoma: implication for prognosis. Histopathology.
54:657–666. 2009. View Article : Google Scholar : PubMed/NCBI
|
|
9
|
Zong C, Wang J and Shi TM: MicroRNA 130b
enhances drug resistance in human ovarian cancer cells. Tumour
Biol. 35:12151–12156. 2014. View Article : Google Scholar : PubMed/NCBI
|
|
10
|
Jung HJ and Suh Y: MicroRNA in aging: From
discovery to biology. Curr Genomics. 13:548–557. 2012. View Article : Google Scholar :
|
|
11
|
Okamura K, Phillips MD, Tyler DM, Duan H,
Chou YT and Lai EC: The regulatory activity of microRNA* species
has substantial influence on microRNA and 3′UTR evolution. Nat
Struct Mol Biol. 15:354–363. 2008. View Article : Google Scholar : PubMed/NCBI
|
|
12
|
Ro S, Park C, Young D, Sanders KM and Yan
W: Tissue-dependent paired expression of miRNAs. Nucleic Acids Res.
35:5944–5953. 2007. View Article : Google Scholar : PubMed/NCBI
|
|
13
|
Carrington JC and Ambros V: Role of
microRNAs in plant and animal development. Science. 301:336–338.
2003. View Article : Google Scholar : PubMed/NCBI
|
|
14
|
Bartel DP: MicroRNAs: Genomics,
biogenesis, mechanism, and function. Cell. 116:281–297. 2004.
View Article : Google Scholar : PubMed/NCBI
|
|
15
|
He L and Hannon GJ: MicroRNAs: Small RNAs
with a big role in gene regulation. Nat Rev Genet. 5:522–531. 2004.
View Article : Google Scholar : PubMed/NCBI
|
|
16
|
Esquela-Kerscher A and Slack FJ:
Oncomirs-microRNAs with a role in cancer. Nat Rev Cancer.
6:259–269. 2006. View
Article : Google Scholar : PubMed/NCBI
|
|
17
|
Calin GA and Croce CM: MicroRNA signatures
in human cancers. Nat Rev Cancer. 6:857–866. 2006. View Article : Google Scholar : PubMed/NCBI
|
|
18
|
Pitto L, Ripoli A, Cremisi F, Simili M and
Rainaldi G: microRNA(interference) networks are embedded in the
gene regulatory networks. Cell Cycle. 7:2458–2461. 2008. View Article : Google Scholar : PubMed/NCBI
|
|
19
|
Ying H, Lv J, Ying T, Jin S, Shao J, Wang
L, Xu H, Yuan B and Yang Q: Gene-gene interaction network analysis
of ovarian cancer using TCGA data. J Ovarian Res. 6:882013.
View Article : Google Scholar : PubMed/NCBI
|
|
20
|
Chen L, Xuan J, Gu J, Wang Y, Zhang Z,
Wang TL and Shih IeM: Integrative network analysis to identify
aberrant pathway networks in ovarian cancer. Pac Symp Biocomput.
31:422012.
|
|
21
|
Liu H, Xiao F, Serebriiskii IG, O'Brien
SW, Maglaty MA, Astsaturov I, Litwin S, Martin LP, Proia DA,
Golemis EA and Connolly DC: Network analysis identifies an
HSP90-central hub susceptible in ovarian cancer. Clin Cancer Res.
19:5053–5067. 2013. View Article : Google Scholar : PubMed/NCBI
|
|
22
|
Pan XH: Pathway crosstalk analysis based
on protein-protein network analysis in ovarian cancer. Asian Pac J
Cancer Prev. 13:3905–3909. 2012. View Article : Google Scholar : PubMed/NCBI
|
|
23
|
Schmeier S, Schaefer U, Essack M and Bajic
VB: Network analysis of microRNAs and their regulation in human
ovarian cancer. BMC Syst Biol. 5:1832011. View Article : Google Scholar : PubMed/NCBI
|
|
24
|
Perumal M, Stronach EA, Gabra H and
Aboagye EO: Evaluation of 2-deoxy-2-[18F]fluoro-D-glucose- and
3′-deoxy-3′-[18F] fluorothymidine- positron emission tomography as
biomarkers of therapy response in platinum-resistant ovarian
cancer. Mol Imaging Biol. 14:753–761. 2012. View Article : Google Scholar : PubMed/NCBI
|
|
25
|
Haslehurst AM, Koti M, Dharsee M, Nuin P,
Evans K, Geraci J, Childs T, Chen J, Li J, Weberpals J, Davey S,
Squire J, Park PC and Feilotter H: EMT transcription factors snail
and slug directly contribute to cisplatin resistance in ovarian
cancer. BMC Cancer. 19:912012. View Article : Google Scholar
|
|
26
|
Li M, Balch C, Montgomery JS, Jeong M,
Chung JH, Yan P, Huang TH, Kim S and Nephew KP: Integrated analysis
of DNA methylation and gene expression reveals specific signaling
pathways associated with platinum resistance in ovarian cancer. BMC
Med Genomics. 8:342009. View Article : Google Scholar
|
|
27
|
Trinh XB, Tjalma WA, Dirix LY, Vermeulen
PB, Peeters DJ, Bachvarov D, Plante M, Berns EM, Helleman J, Van
Laere SJ and van Dam PA: Microarray-based oncogenic pathway
profiling in advanced serous papillary ovarian carcinoma. PLoS One.
6:e224692011. View Article : Google Scholar : PubMed/NCBI
|
|
28
|
Edgar R, Domrachev M and Lash AE: Gene
expression omnibus: NCBI gene expression and hybridization array
data repository. Nucleic Acids Res. 30:207–210. 2002. View Article : Google Scholar :
|
|
29
|
Sorrentino A, Liu CG, Addario A, Peschle
C, Scambia G and Ferlini C: Role of microRNAs in drug-resistant
ovarian cancer cells. Gynecol Oncol. 111:478–486. 2008. View Article : Google Scholar : PubMed/NCBI
|
|
30
|
Yang H, Kong W, He L, Zhao JJ, O'Donnell
JD, Wang J, Wenham RM, Coppola D, Kruk PA, Nicosia SV and Cheng JQ:
MicroRNA expression profiling in human ovarian cancer: miR-214
induces cell survival and cisplatin resistance by targeting PTEN.
Cancer Res. 68:425–433. 2008. View Article : Google Scholar : PubMed/NCBI
|
|
31
|
Yang N, Kaur S, Volinia S, Greshock J,
Lassus H, Hasegawa K, Liang S, Leminen A, Deng S, Smith L, et al:
MicroRNA microarray identifies Let-7i as a novel biomarker and
therapeutic target in human epithelial ovarian cancer. Cancer Res.
68:10307–10314. 2008. View Article : Google Scholar : PubMed/NCBI
|
|
32
|
Kong F, Sun C, Wang Z, Han L, Weng D, Lu Y
and Chen G: miR-125b confers resistance of ovarian cancer cells to
cisplatin by targeting pro-apoptotic Bcl-2 antagonist killer 1. J
Huazhong Univ Sci Technolog Med Sci. 31:543–549. 2011. View Article : Google Scholar : PubMed/NCBI
|
|
33
|
Ye G, Fu G, Cui S, Zhao S, Bernaudo S, Bai
Y, Ding Y, Zhang Y, Yang BB and Peng C: MicroRNA 376c enhances
ovarian cancer cell survival by targeting activin receptor-like
kinase 7: Implications for chemoresistance. J Cell Sci.
124:359–368. 2011. View Article : Google Scholar : PubMed/NCBI
|
|
34
|
Cheng W, Liu T, Wan X, Gao Y and Wang H:
MicroRNA-199a targets CD44 to suppress the tumorigenicity and
multidrug resistance of ovarian cancer-initiating cells. FEBS J.
279:2047–2059. 2012. View Article : Google Scholar : PubMed/NCBI
|
|
35
|
Fu X, Tian J, Zhang L, Chen Y and Hao Q:
Involvement of microRNA-93, a new regulator of PTEN/Akt signaling
pathway, in regulation of chemotherapeutic drug cisplatin
chemosensitivity in ovarian cancer cells. FEBS Lett. 586:1279–1286.
2012. View Article : Google Scholar : PubMed/NCBI
|
|
36
|
van Jaarsveld MT, Helleman J, Boersma AW,
van Kuijk PF, van Ijcken WF, Despierre E, Vergote I, Mathijssen RH,
Berns EM, Verweij J, et al: miR-141 regulates KEAP1 and modulates
cisplatin sensitivity in ovarian cancer cells. Oncogene.
32:4284–4293. 2013. View Article : Google Scholar
|
|
37
|
Yang C, Cai J, Wang Q, Tang H, Cao J, Wu L
and Wang Z: Epigenetic silencing of miR-130b in ovarian cancer
promotes the development of multidrug resistance by targeting
colony-stimulating factor 1. Gynecol Oncol. 124:325–334. 2012.
View Article : Google Scholar
|
|
38
|
Ziliak D, Gamazon ER, Lacroix B, Kyung Im
H, Wen Y and Huang RS: Genetic variation that predicts platinum
sensitivity reveals the role of miR-193b* in chemotherapeutic
susceptibility. Mol Cancer Ther. 11:2054–2061. 2012. View Article : Google Scholar : PubMed/NCBI
|
|
39
|
Prislei S, Martinelli E, Mariani M,
Raspaglio G, Sieber S, Ferrandina G, Shahabi S, Scambia G and
Ferlini C: MiR-200c and HuR in ovarian cancer. BMC Cancer.
13:722013. View Article : Google Scholar : PubMed/NCBI
|
|
40
|
Lewis BP, Shih IH, Jones-Rhoades MW,
Bartel DP and Burge CB: Prediction of mammalian microRNA targets.
Cell. 115:787–798. 2003. View Article : Google Scholar : PubMed/NCBI
|
|
41
|
Krek A, Grün D, Poy MN, Wolf R, Rosenberg
L, Epstein EJ, MacMenamin P, da Piedade I, Gunsalus KC, Stoffel M
and Rajewsky N: Combinatorial microRNA target predictions. Nat
Genet. 37:495–500. 2005. View
Article : Google Scholar : PubMed/NCBI
|
|
42
|
Benjamini Y and Hochberg Y: Controlling
the false discovery rate: A practical and powerful approach to
multiple testing. J R Statist Soc B. 57:289–300. 1995.
|
|
43
|
Barrett T, Wilhite SE, Ledoux P,
Evangelista C, Kim IF, Tomashevsky M, Marshall KA, Phillippy KH,
Sherman PM, Holko M, et al: NCBI GEO: Archive for functional
genomics data sets-update. Nucleic Acids Res. 41(Database issue):
D991–D995. 2013. View Article : Google Scholar :
|
|
44
|
Melaiu O, Cristaudo A, Melissari E, Di
Russo M, Bonotti A, Bruno R, Foddis R, Gemignani F and Pellegrini
S: Review of transcriptome studies combined with data mining
reveals novel potential markers of malignant pleural mesothelioma.
Mutat Res. 750:132–140. 2012. View Article : Google Scholar
|
|
45
|
Kanehisa M and Goto S: KEGG: Kyoto
encyclopedia of genes and genomes. Nucleic Acids Res. 28:27–30.
2000. View Article : Google Scholar
|
|
46
|
Huang GW, Sherman BT, Tan Q, Kir J, Liu D,
Bryant D, Guo Y, Stephens R, Baseler MW, Lane HC and Lempicki RA:
DAVID bioinformatics resources: Expanded annotation database and
novel algorithms to better extract biology from large gene lists.
Nucleic Acids Res. 35:W169–W175. 2007. View Article : Google Scholar : PubMed/NCBI
|
|
47
|
Vlachos IS, Kostoulas N, Vergoulis T,
Georgakilas G, Reczko M, Maragkakis M, Paraskevopoulou MD,
Prionidis K, Dalamagas T and Hatzigeorgiou AG: DIANA miRPath v.2.0:
Investigating the combinatorial effect of microRNAs in pathways.
Nucleic Acids Res. 40:W498–W504. 2012. View Article : Google Scholar : PubMed/NCBI
|
|
48
|
Zhang F and Drabier R: IPAD: The
integrated pathway analysis database for systematic enrichment
analysis. BMC Bioinformatics. 13(Suppl 15): S72012. View Article : Google Scholar : PubMed/NCBI
|
|
49
|
Shannon P, Markiel A, Ozier O, Baliga NS,
Wang JT, Ramage D, Amin N, Schwikowski B and Ideker T: Cytoscape: A
software environment for integrated models of biomolecular
interaction networks. Genome Res. 13:2498–2504. 2003. View Article : Google Scholar : PubMed/NCBI
|
|
50
|
Batagelj V and Mrvar A: Pajek-Analysis and
Visualization of Large Networks. Mutzel P, Jünger M and Leipert S:
Graph Drawing. Lecture Notes in Computer Science. Springer Berlin
Heidelberg; 2265. pp. 477–478. 2002, View Article : Google Scholar
|
|
51
|
Ozgur A, Vu T, Erkan G and Radev DR:
Identifying gene-disease associations using centrality on a
literature mined gene-interaction network. Bioinformatics.
24:i277–i285. 2008. View Article : Google Scholar : PubMed/NCBI
|
|
52
|
Li JH, Liu S, Zhou H, Qu LH and Yang JH:
starBase v2.0: Decoding miRNA-ceRNA, miRNA-ncRNA and protein-RNA
interaction networks from large-scale CLIP-Seq data. Nucleic Acids
Res. 42(Database issue): D92–D97. 2014. View Article : Google Scholar :
|
|
53
|
Biedler JL and Riehm H: Cellular
resistance to actinomycin D in Chinese hamster cells in vitro:
cross-resistance, radioautographic, and cytogenetic studies. Cancer
Res. 30:1174–1184. 1970.PubMed/NCBI
|
|
54
|
Ying H, Lv J, Ying T, Li J, Yang Q and Ma
Y: MicroRNA and transcription factor mediated regulatory network
for ovarian cancer: Regulatory network of ovarian cancer. Tumour
Biol. 34:3219–3225. 2013. View Article : Google Scholar : PubMed/NCBI
|
|
55
|
Chen C, Li M, Chai H, Yang H, Fisher WE
and Yao Q: Roles of neuropilins in neuronal development,
angiogenesis, and cancers. World J Surg. 29:271–275. 2005.
View Article : Google Scholar : PubMed/NCBI
|
|
56
|
Geretti E and Klagsbrun M: Neuropilins:
novel targets for anti-angiogenesis therapies. Cell Adh Migr.
1:56–61. 2007. View Article : Google Scholar : PubMed/NCBI
|
|
57
|
Grandclement C and Borg C: Neuropilins: A
new target for cancer therapy. Cancers (Basel). 3:1899–1928. 2011.
View Article : Google Scholar
|
|
58
|
Lampropoulou A and Ruhrberg C: Neuropilin
regulation of angiogenesis. Biochem Soc Trans. 42:1623–1628. 2014.
View Article : Google Scholar : PubMed/NCBI
|
|
59
|
Beck B, Driessens G, Goossens S, Youssef
KK, Kuchnio A, Caauwe A, Sotiropoulou PA, Loges S, Lapouge G, Candi
A, et al: A vascular niche and a VEGF-Nrp1 loop regulate the
initiation and stemness of skin tumours. Nature. 478:399–403. 2011.
View Article : Google Scholar : PubMed/NCBI
|
|
60
|
Jubb AM, Strickland LA, Liu SD, Mak J,
Schmidt M and Koeppen H: Neuropilin-1 expression in cancer and
development. J Pathol. 226:50–60. 2012. View Article : Google Scholar
|
|
61
|
Pan Q, Chanthery Y, Liang WC, Stawicki S,
Mak J, Rathore N, Tong RK, Kowalski J, Yee SF, Pacheco G, et al:
Blocking neuropilin-1 function has an additive effect with
anti-VEGF to inhibit tumor growth. Cancer Cell. 11:53–67. 2007.
View Article : Google Scholar : PubMed/NCBI
|
|
62
|
Delgoffe GM, Woo SR, Turnis ME, Gravano
DM, Guy C, Overacre AE, Bettini ML, Vogel P, Finkelstein D,
Bonnevier J, et al: Stability and function of regulatory T cells is
maintained by a neuropilin-1-semaphorin-4a axis. Nature.
501:252–256. 2013. View Article : Google Scholar : PubMed/NCBI
|
|
63
|
Ghosh S, Sullivan CA, Zerkowski MP,
Molinaro AM, Rimm DL, Camp RL and Chung GG: High levels of vascular
endothelial growth factor and its receptors (VEGFR-1, VEGFR-2,
neuropilin-1) are associated with worse outcome in breast cancer.
Hum Pathol. 39:1835–1843. 2008. View Article : Google Scholar : PubMed/NCBI
|
|
64
|
Staton CA, Koay I, Wu JM, Hoh L, Reed MW
and Brown NJ: Neuropilin-1 and neuropilin-2 expression in the
adenoma-carcinoma sequence of colorectal cancer. Histopathology.
62:908–915. 2013. View Article : Google Scholar : PubMed/NCBI
|
|
65
|
Piechnik A, Dmoszynska A, Omiotek M, Mlak
R, Kowal M, Stilgenbauer S, Bullinger L and Giannopoulos K: The
VEGF receptor, neuropilin-1, represents a promising novel target
for chronic lymphocytic leukemia patients. Int J Cancer.
133:1489–1496. 2013. View Article : Google Scholar : PubMed/NCBI
|
|
66
|
Chaudhary B, Khaled YS, Ammori BJ and
Elkord E: Neuropilin 1: Function and therapeutic potential in
cancer. Cancer Immunol Immunother. 63:81–99. 2014. View Article : Google Scholar
|
|
67
|
Baba T, Kariya M, Higuchi T, Mandai M,
Matsumura N, Kondoh E, Miyanishi M, Fukuhara K, Takakura K and
Fujii S: Neuropilin-1 promotes unlimited growth of ovarian cancer
by evading contact inhibition. Gynecol Oncol. 105:703–711. 2007.
View Article : Google Scholar : PubMed/NCBI
|
|
68
|
Duman-Scheel M: Deleted in colorectal
cancer (DCC) path-finding: Axon guidance gene finally turned tumor
suppressor. Curr Drug Targets. 13:1445–1453. 2012. View Article : Google Scholar : PubMed/NCBI
|
|
69
|
Ge C, Li Q, Wang L and Xu X: The role of
axon guidance factor semaphorin 6B in the invasion and metastasis
of gastric cancer. J Int Med Res. 41:284–292. 2013. View Article : Google Scholar : PubMed/NCBI
|
|
70
|
Göhrig A, Detjen KM, Hilfenhaus G, Körner
JL, Welzel M, Arsenic R, Schmuck R, Bahra M, Wu JY, Wiedenmann B
and Fischer C: Axon guidance factor SLIT2 inhibits neural invasion
and metastasis in pancreatic cancer. Cancer Res. 74:1529–1540.
2014. View Article : Google Scholar : PubMed/NCBI
|
|
71
|
Sundaram MV: RTK/Ras/MAPK signaling.
WormBook. 1–19. 2006.
|
|
72
|
Wei SQ, Sui LH, Zheng JH, Zhang GM and Kao
YL: Role of ERK1/2 kinase in cisplatin-induced apoptosis in human
ovarian carcinoma cells. Chin Med Sci J. 19:125–129.
2004.PubMed/NCBI
|
|
73
|
Li F, Meng L, Zhou J, Xing H, Wang S, Xu
G, Zhu H, Wang B, Chen G, Lu YP and Ma D: Reversing chemoresistance
in cisplatin-resistant human ovarian cancer cells: A role of c-Jun
NH2-terminal kinase 1. Biochem Biophys Res Commun. 335:1070–1077.
2005. View Article : Google Scholar : PubMed/NCBI
|
|
74
|
Yang D, Sun Y, Hu L, Zheng H, Ji P, Pecot
CV, Zhao Y, Reynolds S, Cheng H, Rupaimoole R, Cogdell D, Nykter M,
Broaddus R, Rodriguez-Aguayo C, Lopez-Berestein G, Liu J,
Shmulevich I, Sood AK, Chen K and Zhang W: Integrated analyses
identify a master microRNA regulatory network for the mesenchymal
subtype in serous ovarian cancer. Cancer Cell. 23:186–199. 2013.
View Article : Google Scholar : PubMed/NCBI
|
|
75
|
Han Y, Huang H, Xiao Z, Zhang W, Cao Y, Qu
L and Shou C: Integrated analysis of gene expression profiles
associated with response of platinum/paclitaxel-based treatment in
epithelial ovarian cancer. PLoS One. 7:e527452012. View Article : Google Scholar
|
|
76
|
Delfino KR and Rodriguez-Zas SL:
Transcription factor-microRNA-target gene networks associated with
ovarian cancer survival and recurrence. PLoS One. 8:e586082013.
View Article : Google Scholar : PubMed/NCBI
|
|
77
|
Liu M1, Zhang X, Hu CF, Xu Q, Zhu HX and
Xu NZ: MicroRNA-mRNA functional pairs for cisplatin resistance in
ovarian cancer cells. Chin J Cancer. 33:285–294. 2014. View Article : Google Scholar : PubMed/NCBI
|
|
78
|
Yang L, Moss T, Mangala LS, Marini J, Zhao
H, Wahlig S, Armaiz-Pena G, Jiang D, Achreja A, Win J, Roopaimoole
R, Rodriguez-Aguayo C, Mercado-Uribe I, Lopez-Berestein G, Liu J,
Tsukamoto T, Sood AK, Ram PT and Nagrath D: Metabolic shifts toward
glutamine regulate tumor growth, invasion and bioenergetics in
ovarian cancer. Mol Syst Biol. 10:7282014. View Article : Google Scholar : PubMed/NCBI
|
|
79
|
Ibrahim FF, Jamal R, Syafruddin SE, Ab
Mutalib NS, Saidin S, MdZin RR, Hossain Mollah MM and Mokhtar NM:
MicroRNA-200c and microRNA-31 regulate proliferation, colony
formation, migration and invasion in serous ovarian. J Ovarian Res.
8:562015. View Article : Google Scholar
|