Introduction
Rapamycin inhibits mechanistic target of rapamycin
(mTOR), a conserved serine/threonine kinase that responds to growth
factors, nutrients and hypoxia (1). Rapamycin binds to the kinase domain
of mTOR upon complexing with FK506 binding protein 12 (FKBP12) in
TOR complex 1 (TORC1) (2) or
through the phosphorylation of rictor, a necessary component of
TORC2 (3). As a result, rapamycin
inhibits growth in various cell types and thus is a promising
anti-cancer agent (4).
The effect of rapamycin on mTOR function is highly
conserved between species from yeast to humans (5,6). In
addition, microarray analyses testing the extent of global
alterations in the transcriptome in yeast and in mammals contribute
to the understanding of the mechanisms and pathways associated with
the effect of rapamycin (7–12).
In vivo studies indicate that rapamycin results in
developmental delay in different organisms including Drosophila
melanogaster, zebrafish and mice (6,13,14).
Previous studies using zebrafish have identified significant
effects of rapamycin on autophagy (15), prevention of hepatic steatosis
(16), heart development (17) and demonstrated the importance of
zebrafish as a mitochondrial and ribosomal disease model (18,19).
Although the zebrafish is an emerging model in drug-screening and
in vivo disease models (20), evolutionarily conserved effects of
rapamycin on the zebrafish transcriptome in addition to the
dose-dependency in embryonic/larval size and pigmentation have not
previously been studied.
In the present study, the transcriptional response
of zebrafish embryonic fibroblast cell line, ZF4, was characterized
following exposure to 100 nM rapamycin treatment for 48 h. To the
best of our knowledge, the current study is the first transcriptome
analysis of zebrafish ZF4 cells in response to rapamycin treatment
demonstrating significant alterations in the steady state mRNA
levels of zebrafish cells. In addition, the present study confirmed
the microarray results by reverse transcription-quantitative
polymerase chain reaction (RT-qPCR) for a set of genes exhibiting
large effect sizes. Significantly altered pathways indicated by
Kyoto Encyclopedia of Genes and Genomes (KEGG) analysis included
ribosomes, proteasomal machinery, oxidative phosphorylation and
cell cycle. Notably, meta-analysis performed on microarray datasets
of mouse cell lines treated with rapamycin revealed a high level of
conservation between the mouse and zebrafish pathways modulated by
rapamycin. Furthermore, statistical analysis of shared Gene
Ontology (GO) terms between zebrafish and mice revealed a
significant positive association. Additionally, the present study
indicated that in vivo treatment of rapamycin resulted in a
significant dose-dependent reduction in body size and in
particular, pigmentation of zebrafish.
Materials and methods
Cell culture and rapamycin exposure
ZF4, a cell line derived from zebrafish embryonic
fibroblast cells [CRL-2050 American Type Culture Collection (ATCC),
Manassas, VA, USA], were cultured in Dulbecco's modified Eagle's
medium/F-12 (1:1) (SH30023; GE Healthcare Life Sciences, Logan, UT,
USA) containing 10% fetal bovine serum (FBS; CH30160; GE Healthcare
Life Sciences) with 1% streptomycin/penicillin (10,000 U/ml
Penicillin, 10,000 µg/ml Streptomycin; SV30010; GE
Healthcare Life Sciences) at 28°C. ZF4 cells were treated with
rapamycin at a final concentration of 100 nM (553210; EMD
Millipore, Billerica, MA, USA) or dimethyl sufloxide (DMSO; 0.002%)
as control and collected at indicated time points. ZF4 cells
previously were shown to be stable over multiple passages with no
observable alterations in phenotype (21). ZF4 passage numbers (P) used for
different analyses following purchase from ATCC were as follows:
P16, microarray analysis; P19, reverse transcription-quantitative
polymerase chain reaction (RT-qPCR); P20,
3-(4,5-dimethylthiazol-2-yl)-2,5-diphenyltetrazolium bromide (MTT)
assay; P21, propidium iodide (PI) analysis; P23, bromodeoxyuridine
(BrdU) assay; and P19, cell death detection (CDD) analysis.
Cell viability and proliferation
ZF4 cells at a density of 2×10⁴ were
treated with 100 nM rapamycin, DMSO or culture medium for 48 h in
96-well microplates prior to an MTT assay for cell viability
(Vybrant MTT Cell Proliferation Assay kit, V-13154; Thermo Fisher
Scientific, Inc., Waltham, MA, USA). The absorbance was read at 540
nm using a µQuant™ Microplate Spectrophotometer (Bio-Tek
Instruments, Winooski, VT, USA).
ZF4 cells at a density of 5×10⁵ were
seeded in 6-well plates in triplicate, and were treated with 100 nM
rapamycin or DMSO for 48 h for cell cycle analysis using PI (50
µg/ml) staining (22). For
each sample, 1×10⁴ cells were analyzed using a BD
FACScalibur cell analyzer (BD Biosciences, San Jose, CA, USA).
ZF4 cells at a density of 5×10⁵ cells
were seeded in 6-well plates with 100 nM rapamycin or DMSO for 48 h
in triplicate, prior to the application of 30 µM BrdU for 24
h, to determine alterations in DNA synthesis. Subsequently, cells
fixed with 70% ice cold ethanol were blocked with 10%
FBS/phosphate-buffered saline (PBS) for 1 h, and incubated with
monoclonal mouse anti-BrdU antibody (1:500 in 2% FBS in PBS; M0744;
Dako, Glostrup, Denmark) for 1 h at room temperature, followed by
goat anti-mouse secondary antibody conjugated to AlexaFluor 488
(1:750 in 2% FBS; A11029; Thermo Fisher Scientific, Inc.) for 1 h
at room temperature. The cells were counterstained with
4′,6-diamidino-2-phenylindole (Roche Diagnostics, Basel,
Switzerland) for 1 min and were analyzed in multiple fields using a
Zeiss AX10 Imager A1 microscope (Carl Zeiss AG, Oberkochen,
Germany).
The rate of apoptosis following rapamycin treatment
was measured using a CDD enzyme-linked immunosorbent assay
(ELISA)PLUS kit (Roche Diagnostics, GmbH, Mannheim,
Germany) performed according to manufacturer's protocols following
the treatment of 2×10⁴ ZF4 cells with 100 nM rapamycin,
DMSO or culture media for 48 h in 96 well plates, in duplicate.
Absorbency was measured using an µQuant™ Microplate
Spectrophotometer (Bio-Tek Instruments) at 405 nm using 490 nm as a
reference.
Microarray experiment
A total of 5. 5×10⁶ ZF4 cells, cultured
in T-150 flasks in triplicate, were treated with rapamycin at a
final concentration of 100 nM or DMSO for 48 h prior to collection.
Total RNA was isolated using an SV Total RNA Isolation kit
according to the manufacturer's instructions (Z3100, Promega
Corporation, Madison, WI, USA). The quantity and quality of total
RNA was assessed using an Agilent 2100 BioAnalyzer (Agilent
Technologies, Inc., Santa Clara, CA, USA). All samples had RNA
integrity number values greater than 8. Total RNA converted to cDNA
was in vitro transcribed in the presence of biotinylated
nucleotides to produce biotin-labeled cRNA (antisense RNA, 3′ IVT
Express kit; Affymetrix, Santa Clara, CA, USA). Fragmented cRNA
(Ambion; Thermo Fisher Scientific, Inc.) was hybridized to an
Affymetrix GeneChip Zebrafish (Affymetrix, Inc., Santa Clara, CA,
USA) according to the manufacturer's instructions. Following
staining with a streptavidin-phycoerythrin conjugate (Invitrogen;
Thermo Fisher Scientific, Inc.), the intensity emitted by the bound
RNA was quantified using a GeneChip scanner (GeneChip Scanner 3000
7G; Affymetrix, Inc.). The Affymetric CEL files and normalized
expression data were deposited into the Gene Expression Omnibus
(GEO) database (GSE53086; http://www.ncbi.nlm.nih.gov/geo/).
Microarray data analysis
The Affymetrix GeneChip Zebrafish genome array
contains ~15,600 probe sets. The quality control of the arrays and
assessment of RNA integrity were performed in R software, version
2.10.1 (https://www.r-project.org) using
affy (23) and
affyPLM (24) packages. Raw
microarray data were normalized using justRMA by Biometric Research
Branch (BRB)-Array tools, version 4.2.1 (http://brb.nci.nih.gov/BRB-ArrayTools/download.html).
The differentially expressed genes (fold change based on the
geometric mean of intensities) under the rapamycin treatment were
determined using the class comparison function of the BRB-array
tools. The significance threshold was set at P<0.05 for the
univariate tests. Fisher's exact tests were then conducted with
multiple test correction using Database for Annotation,
Visualization and Integrated Discovery (DAVID; https://david.ncifcrf.gov/) 6.7 analysis (25,26)
to test the enrichment of the upregulated and downregulated probe
sets indicated by KEGG and GO pathway analysis in zebrafish.
Meta-analysis of mouse rapamycin exposure
microarray datasets
The GEO database was searched for microarray
datasets performed using the Affymetrix Mouse Genome 430 2.0 Array
in which mouse cell lines were treated with rapamycin. Samples that
belong to a rapamycin treatment and associated control group were
selected for further study. The CEL files were retrieved from three
datasets (GSE21755, GSE19885 and GSE5332). Samples used from
GSE21755 included rapamycin (n=2, 20 nM for 24 h) and control (n=3,
DMSO for 24 h) treatments on two different tuberous sclerosis (Tsc)
null mouse embryonic fibroblast lines (MEFs), Tsc1−/−
(p53+/+, 3T3-immortalized) and Tsc2−/−
(p53−/−, derived from a littermate of the wild-type cell
line) (11). From GSE19885,
rapamycin (100 nM for 24 h; n=3) and control (DMSO for 24 h; n=3)
treated samples from a rapamycin sensitive mouse brain tumor cell
line, BC3H1, were used (12). From
GSE5332, TSC2−/− MEFs treated with 20 nM rapamycin or
DMSO for 14 h (n=6) (10) were
included in the meta-analysis. The quality control analysis of the
CEL files was performed using R packages affyQCReport (https://www.bioconductor.org/packages/release/bioc/html/affyQCReport.html)
(23) and affyPLM
(https://www.bioconductor.org/packages/release/bioc/html/affyPLM.html)
(24). One sample (GSM497116) from
GSE19885 did not pass the quality control check thus was excluded
from further analysis. CEL files normalized using robust multichip
average (23) were subjected to
meta-analysis using MetaDE Bioconductor package (https://cran.r-project.org/web/packages/MetaDE/index.html)
(27). Normalized expression data
along with control and treatment sample labels for each GSE dataset
were given as input to meta-analysis function for calculation of
z-scores, P-values and the false-discovery rate (FDR) using a
random effects model (1,000 permutations; seed value set to 123).
Filtered probes with FDR <0.005 (corresponding P-value:
5.7×10⁻⁴) were used for further DAVID analysis.
Meta-analysis was conducted in R software, version 3.1.2.
Significant KEGG and GO pathways were extracted using DAVID for up-
and downregulated mouse probe sets separately and then associated
with the zebrafish functional pathway results.
RT-qPCR validation experiments
Results from the microarray data were confirmed for
selected significantly upregulated or downregulated genes by
RT-qPCR analysis. An independent set of rapamycin treatment
experiments was performed in which 5×10⁶ ZF4 cells were
treated with 100 nM rapamycin or DMSO in triplicate for 6 or 48 h
prior to collection. For each sample, 1.2 µg RNA, reverse
transcribed into cDNA according to the manufacturer's instructions
(K1622; Fermentas; Thermo Fisher Scientific, Inc.), was amplified
with sequence specific primers designed using Primer3 (Table I; http://frodo.wi.mit.edu/primer3/). qPCR reactions were
performed using an iCycler (Bio-Rad Laboratories, Inc., Hercules,
CA, USA) for each sample in duplicate, using DyNAmo HS SYBR Green
qPCR Kit (F-410 L; Thermo Fisher Scientific, Inc.). The running
parameters were as follows: 1 cycle at 95°C for 10 min, followed by
45 cycles of 95°C for 30 sec, 60°C for 30 sec, 72°C for 30 sec, and
finally 72°C for 10 min. b2m was used as the reference gene
(28). The 10-fold serial
dilutions were used to identify the primer efficiencies (E)
(Table I). A modified
2−ΔΔCq met hod (29)
was applied to calculate fold expression change of selected genes:
(Etarget)ΔCtTarget
(control-sample)/(Eref)ΔCtReference
(control-sample). The fold changes values were
log2 transformed prior to plotting and performing
statistical analyses.
 | Table IPrimers and the primer efficiencies
used for the microarray confirmations. |
Table I
Primers and the primer efficiencies
used for the microarray confirmations.
| Gene name | Forward primer (5′
3′) | Reverse primer (5′
3′) | Primer
efficiency |
|---|
| foxm1 |
GACACATGACCCTGAAGGAGA |
AGAGTGAGACAGCGGTTTGC | 1.90 |
| pah |
TGTGGGTATCGTGAGGACAA |
GGAGCTGTGGCGAATGTACT | 1.75 |
| cyp26b1 |
CAACACGGGACAAGAGCTG |
CCCATAAGAACCTTACGCACA | 1.92 |
| tagln2 |
GCTGGTACAGTGGATCGTCA |
TGGATCTTCTTCACAGGCTTT | 1.98 |
| ddc |
CCTGCCTGTACGGAGCTAGA |
CTGGATCAGCCTGACGATTT | 1.85 |
| bambia |
TTTGCATGACCTCACACACC |
CGGAACCACACCTCTTTAGC | 1.91 |
| dkk1b |
CGCTATTAAAGTCGGTTCAGG |
TTGCACTGGAGACAGACACC | 1.89 |
| wif1 |
CAGACTCTGCGTTCTTTGGA |
GGATGGTCACCTCAAATGCT | 1.86 |
| mmp9 |
CAAGACATTCGACGGAGACC |
TGCTTTCCCGAAAGAGATCA | 2.00 |
| b2m |
TTCTTTGTCTGCTGTACATCACTG |
TGCTTGGTGTCCGACATAAC | 1.95 |
Rapamycin treatment of zebrafish
embryos
Shield stage zebrafish embryos (EMBL Heidelberg,
Heidelberg, Germany) were placed into 96-well plates; each well
contained 3 embryos. Final concentrations of 2, 10 and 20 µM
rapamycin (R0395; Sigma-Aldrich, St. Louis, MO, USA) or equivalent
DMSO concentrations were added to the embryo medium. Zebrafish
embryos were collected at 1–5 days post fertilization (dpf) for
further examination. The study was approved by the Bilkent
University Local Animal Ethics Committee (No. 2003/5; Bilkent
University, Ankara, Turkey); and in vivo zebrafish rapamycin
exposure experiments were performed at European Molecular Biology
Laboratory (Heidelberg, Germany) in compliance with local animal
care regulations.
Statistical analysis
Minitab software, version 13.20 (Minitab Inc., State
College, PA, USA) was used to analyze the significance of the
RT-qPCR, MTT, BrdU, CDD and PI staining and in vivo results.
The significance between groups was detected with Fisher's pairwise
comparisons following a one-way analysis of variance (ANOVA).
RT-qPCR results from 6 and 48 h rapamycin or equivalent of DMSO
treatments were analyzed with either one-way or two-way ANOVA as
necessary. A general linear model was applied to detect the
significance of dose- and time-dependent rapamycin treatment on
body length in vivo in zebrafish embryos. The graphs were
generated using GraphPad Prism software, version 5.0 (GraphPad
Software, Inc., San Diego, CA, USA). P<0.05 was considered to
indicate a statistically significant difference. The Pearson
correlation coefficient and associated P-value were calculated
using the cor.test function in R. Functional analyses were
performed using DAVID version 6.7. For DAVID based pathways and GO
analyses, P-values corrected using the Benjamini Hochberg method
were reported; Benjamini<0.05 was considered to indicate a
statistically significant difference. Zebrafish and mouse GO term
lists [biological process (BP); cellular compartment (CC);
molecular function (MF)] were matched with each other; and shared
terms having P≤0.05 were tested for a significant positive
association using odds ratios (OR, based on the conditioned maximum
likelihood estimate) calculated using two-sided Fisher's exact test
from the exact2×2 package in R software, version 3.1.2 (30,31).
Results
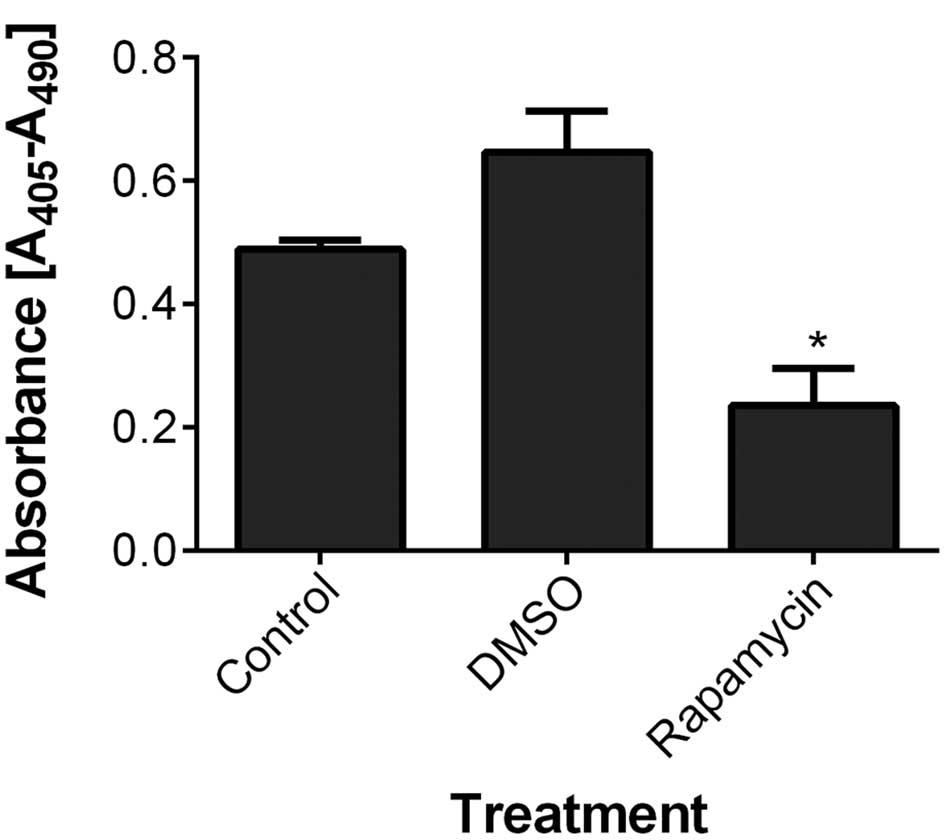
Rapamycin reduces basal apoptosis with no
detectable alteration in cell viability or proliferation in ZF4
cells
The results indicated that 100 nM rapamycin did not
have significant effects on cytotoxicity or DNA synthesis in ZF4
cells (one-way ANOVA; MTT, P=0.47; BrdU, P=0.141; data not shown).
In addition, cell fractions in G0/G1, S and
G2/M phases or in subG1 phase did not differ between the
rapamycin and DMSO treated groups (one-way ANOVA for subG1 phase;
P=0.394; data not shown). Notably, however, the ELISA-based CDD
analysis showed that rapamycin significantly reduced the basal
apoptosis in ZF4 cells (one-way ANOVA; P=0.01; Fig. 1).
Rapamycin affects steady state mRNA
expression in zebrafish ZF4 cells
The differentially expressed genes between rapamycin
and DMSO control groups were obtained using the class comparison
function of the BRB array tools (P<0.05). This model is
preferable for data with small number of samples since it uses a
random variance model for univariate tests to compute a P-value for
each probe set together with an FDR value (32). A total of 2,186 probe sets (904
upregulated and 1,282 downregulated) were detected as significantly
modulated between the rapamycin and DMSO groups at P<0.05.
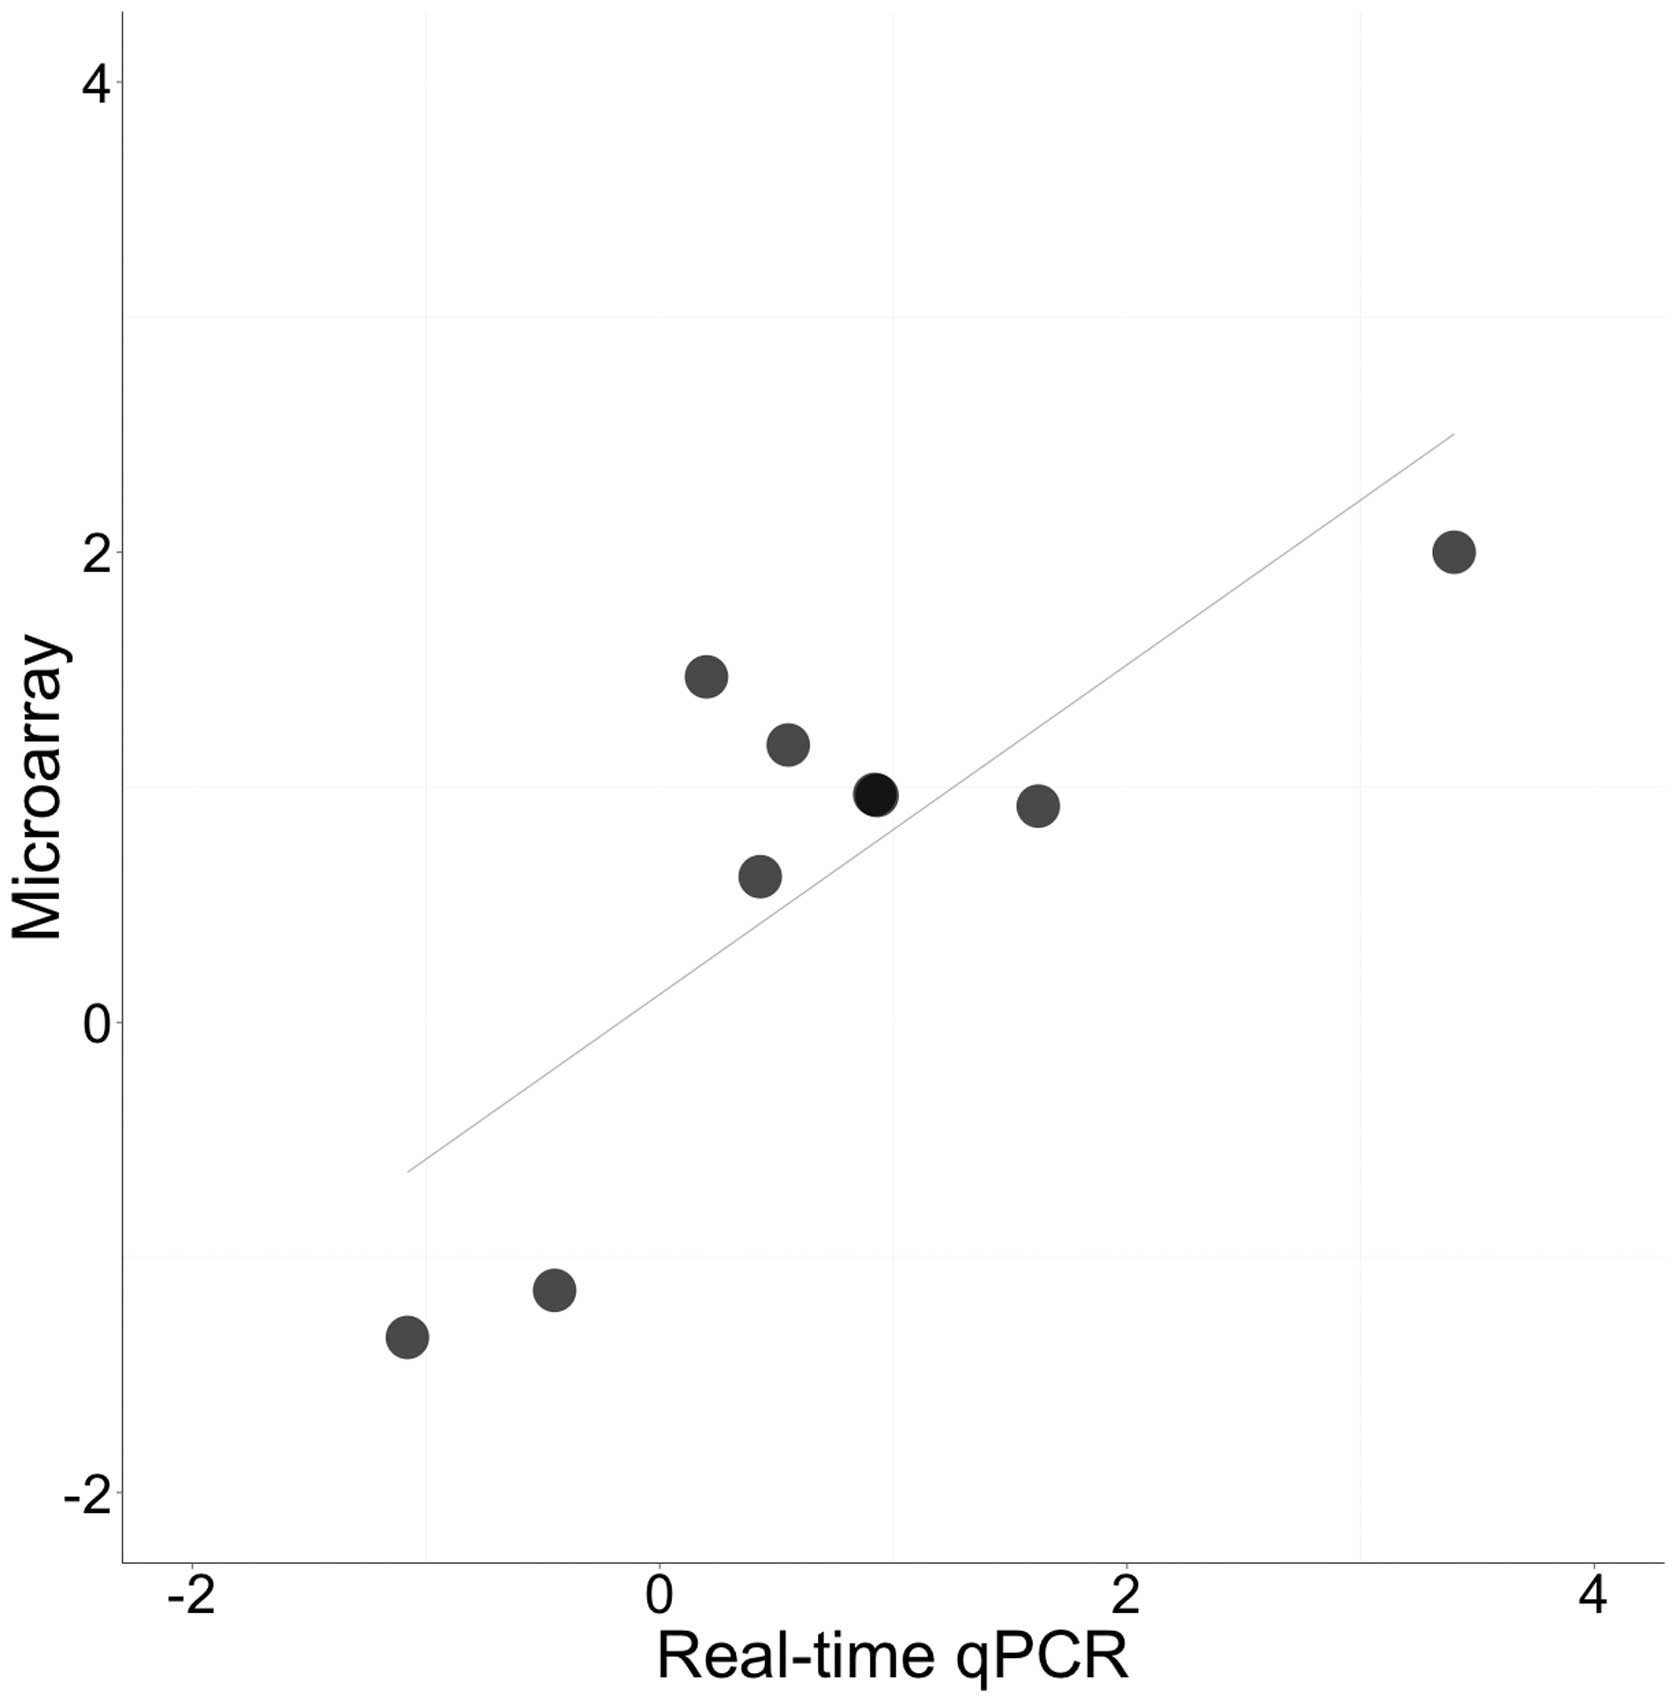
RT-qPCR validation and microarray results
are correlated
To validate the microarray results, RT-qPCR was used
to test whether rapamycin treated ZF4 cells exhibited
time-dependent alterations in gene expression (at 6 and 48 h). A
total of nine genes (seven upregulated and two downregulated) were
selected that exhibited high fold-change differences, low P-values
and FDRs. Of the nine selected genes, six showed statistically
significant alterations in time or treatment or both (P<0.05;
Fig. 2). These genes included dopa
decarboxylase (ddc), cytochrome P450, family 26, subfamily
b, polypeptide 1 (cyp26b1), dickkopf 1b (dkk1b), wnt
inhibitory factor 1 (wif1), forkhead box M1 (foxm1)
and phenylalanine hydroxylase (pah) (Fig. 2). Overall, the log2 fold
changes of all the selected genes at 48 h of rapamycin exposure
were highly correlated between the microarray and RT-qPCR data
(Pearson correlation coefficient, r=0.79, P=0.011; Fig. 3).
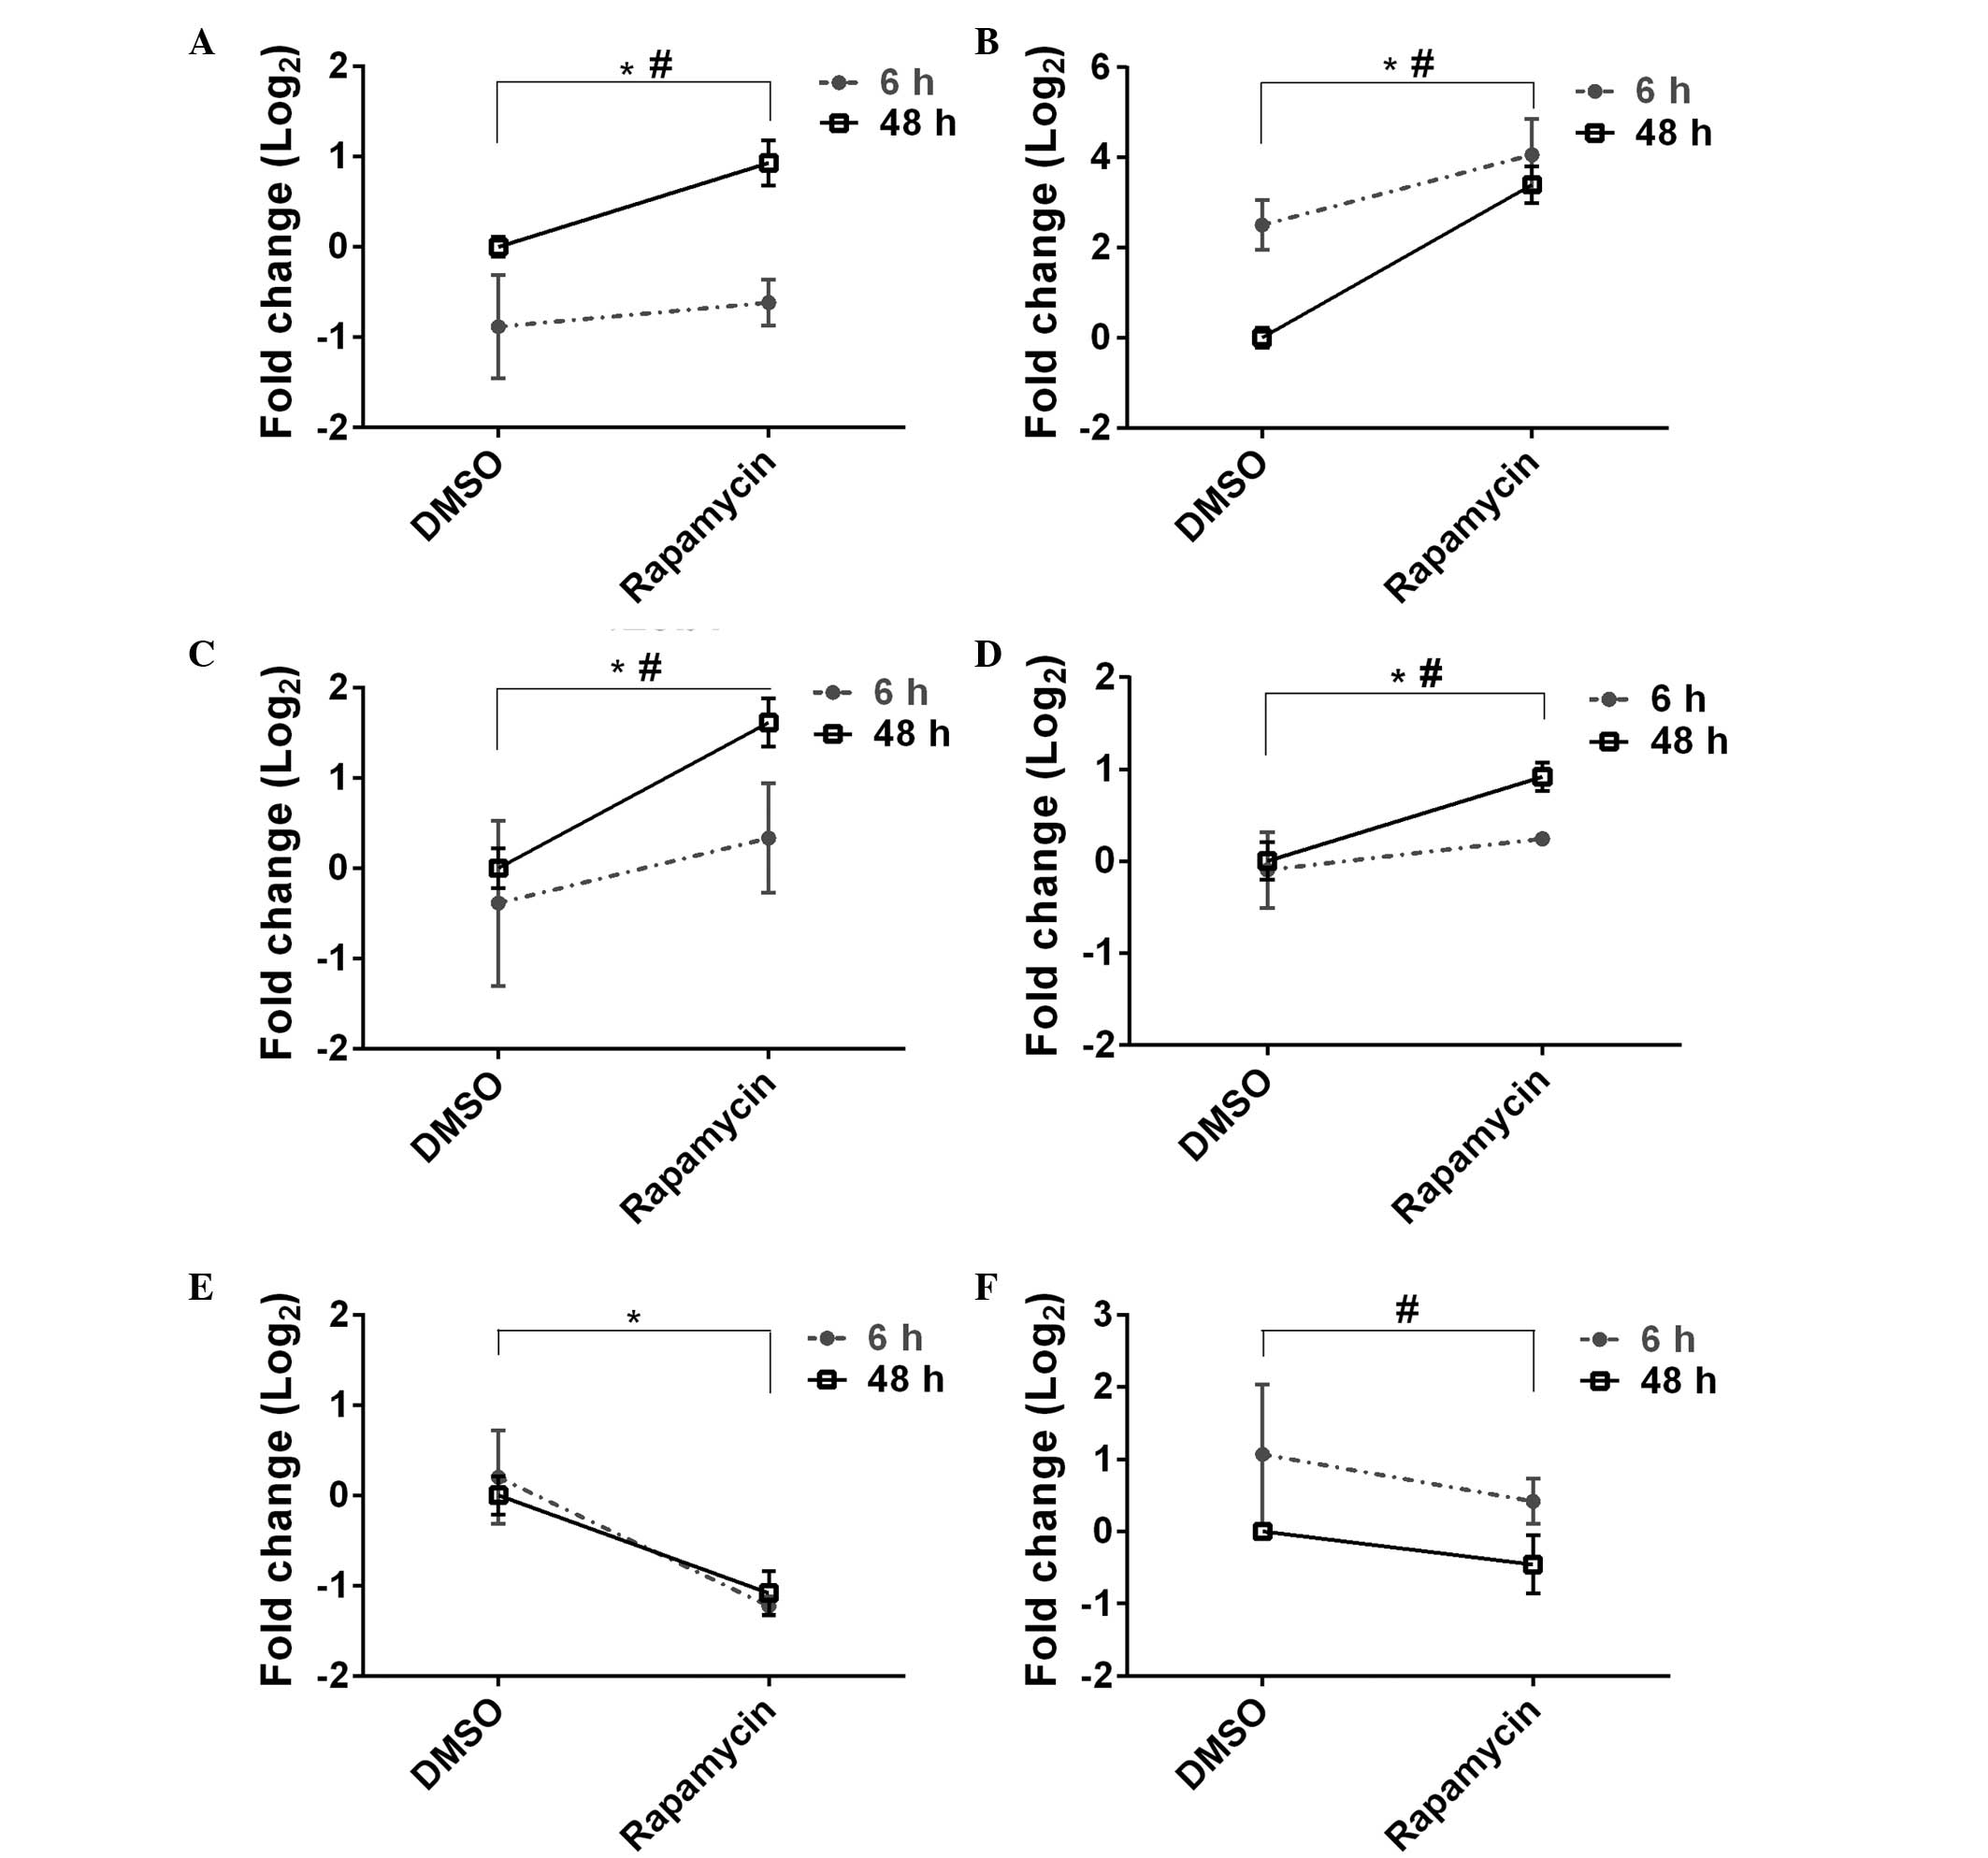 | Figure 2Genes showing significant modulations
by microarray and RT-qPCR analyses. The significantly upregulated
genes selected for RT-qPCR confirmation were (A) ddc, (B)
dkk1b; (C) cyp26b1 and (D) wif1. Two-way
ANOVA, ddc, Ptreatment= 0.022, Ptime
≤0.001; dkk1b, Ptreatment ≤0.001,
Ptime=0.004; cyp26b1,
Ptreatment=0.008, Ptime=0.039; wif1,
Ptreatment=0.004, Ptime=0.039. The
significantly downregulated genes by rapamycin in RT-qPCR analysis
were (E) pah and (F) foxm1. Two-way ANOVA,
pah, Ptreatment ≤0.001, Ptime=0.884;
foxm1, Ptreatment=0.098, Ptime=0.010.
*P<0.05 DMSO vs. rapamycin; #P<0.05 6 h
vs. 48 h. RT-qPCR, reverse transcription-quantitative polymerase
chain reaction; ANOVA, analysis of variance; ddc, dopa
decarboxylase; dkk1b, dickkopf 1b; cyp26b1,
cytochrome P450, family 26, subfamily b, polypeptide 1;
wif1, wnt inhibitory factor 1; pah, phenylalanine
hydroxylase; foxm1, forkhead box M1; DMSO, dimethyl
sulfoxide. |
KEGG pathway and GO enrichment analyses
reveal high conservation between zebrafish and mouse in the
response to rapamycin
According to KEGG pathway analysis in zebrafish,
genes coordinately upregulated in response to rapamycin treatment
were largely the components of small and large nuclear ribosomes,
while those that were downregulated were enriched for proteasomal
complexes, oxidative phosphorylation, the cell cycle,
glycolysis/gluconeogenesis and certain metabolic pathways (Table II). Meta-analysis of the mouse
datasets identified 5,019 consistently however, differentially
expressed probe sets (FDR<0.005) among which 2,776 were
downregulated and 2,243 were upregulated. KEGG pathway comparisons
between zebrafish and mice revealed that ribosome was the most
significantly upregulated pathway term, while several pathways
downregulated in zebrafish were also downregulated in mice
(Table II). Similarly, the shared
GO terms between the zebrafish and mouse rapamycin datasets were
identified (Table III). Commonly
upregulated GO terms for CC included ribosomal and
ribonucleoprotein complexes, while proteasome complexes,
endoplasmic reticulum and mitochondrion terms were among the
commonly downregulated CC terms (data not shown). However, Fisher's
exact test for GO-CC did not indicate a significant positive
association for the significant (P≤0.05) shared terms from mouse
and zebrafish [OR, 1.89; (95% CI, 0.53–6.52); P=0.36; Table III]. Conversely, for GO terms of
MF, an overall significant positive association was found between
zebrafish and mice (OR, 9.79; (95% CI, 1.58–86.01);
P=1.2×10⁻²; Table
III). Several GO-MF categories, including DNA binding,
structural constituent of ribosomes, threonine-type endopeptidase
and peptidase activity, and cofactor binding, were common between
zebrafish and mice. Similarly, shared zebrafish and mouse GO-BP
terms were significantly and positively associated with each other
[OR, 23.68; (95% CI, 5.84–107.61); P=6.3×10⁻⁸; Table III]. Upregulated GO-BP terms
primarily included embryonic processes such as embryonic
morphogenesis and embryonic organ development, while the top
downregulated GO-BP terms were enriched in DNA metabolic process
and the cell cycle, as in the KEGG pathway analysis (Table IV).
| Table IIKyoto Encyclopedia of Genes and
Genomes pathway results from the Database for Annotation,
Visualization and Integrated Discovery for upregulated and
downregulated genes in zebrafish (Benjamini <0.05) and
respective results from mice meta-analysis for rapamycin
treatment. |
Table II
Kyoto Encyclopedia of Genes and
Genomes pathway results from the Database for Annotation,
Visualization and Integrated Discovery for upregulated and
downregulated genes in zebrafish (Benjamini <0.05) and
respective results from mice meta-analysis for rapamycin
treatment.
| Genes | Zebrafish
microarray
| Mouse meta-analysis
|
|---|
| Count | P-value | Benjamini | Count | P-value | Benjamini |
|---|
| Upregulated
genes | | | | | | |
| Ribosome | 15 |
1.5×10−06 |
1.3×10−04 | 36 |
5.8×10⁻¹⁸ |
9.3×10⁻¹⁶ |
| Downregulated
genes | | | | | | |
| Oxidative
phosphorylation | 42 |
1.9×10⁻¹⁵ |
2.3×10⁻¹³ | 25 |
4.2×10−03 |
3.7×10−02 |
| Cell cycle | 32 |
4.9×10−08 |
3.0×10−06 | 27 |
6.9×10−04 |
7.8×10−03 |
| Proteasome | 16 |
1.5×10−05 |
6.1×10−04 | 27 |
3.5×10⁻¹⁴ |
3.0×10⁻¹² |
| Valine, leucine
and isoleucine degradation | 13 |
7.6×10−05 |
2.3×10−03 | 6 |
5.4×10−01 |
8.2×10−01 |
| Glutathione
metabolism | 11 |
6.2×10−04 |
1.5×10−02 | 11 |
4.2×10−02 |
1.9×10−01 |
|
Progesterone-mediated oocyte
maturation | 20 |
7.3×10−04 |
1.5×10−02 | 9 |
6.9×10−01 |
8.9×10−01 |
| Arginine and
proline metabolism | 14 |
8.4×10−04 |
1.5×10−02 | 10 |
1.0×10−01 |
3.5×10−01 |
|
Glycolysis/gluconeogenesis | 14 |
1.2×10−03 |
1.8×10−02 | 19 |
1.6×10−04 |
2.5×10−03 |
| N-glycan
biosynthesis | 11 |
2.6×10−03 |
3.5×10−02 | 6 |
5.4×10−01 |
8.2×10−01 |
| Pyruvate
metabolism | 10 |
3.1×10−03 |
3.7×10−02 | 11 |
8.6×10−03 |
6.1×10−02 |
| Oocyte
meiosis | 21 |
3.9×10−03 |
4.2×10−02 | 15 |
3.3×10−01 |
6.7×10−01 |
| Fatty acid
metabolism | 9 |
4.5×10−03 |
4.5×10−02 | 3 |
9.6×10−01 |
9.9×10−01 |
| Tricarboxylic acid
cycle | 9 |
4.5×10−03 |
4.5×10−02 | 7 |
1.0×10−01 |
3.5×10−01 |
| Table IIICounts for the significant
(P<0.05) shared GO terms in mice and zebrafish. |
Table III
Counts for the significant
(P<0.05) shared GO terms in mice and zebrafish.
| Zebrafish | Mice
|
|---|
All shared terms
| Ambiguous terms
removed
|
|---|
| Down | Up | Down | Up |
|---|
| GO-BP | | | | |
| Down | 54 | 13 | 43 | 2 |
| Up | 3 | 18 | 1 | 16 |
| GO-CC | | | | |
| Down | 23 | 8 | 17 | 3 |
| Up | 12 | 8 | 3 | 0 |
| GO-MF | | | | |
| Down | 18 | 2 | 17 | 1 |
| Up | 5 | 6 | 4 | 5 |
| Table IVTop five shared significant
(Benjamini <0.05) GO-BP term results from Database for
Annotation, Visualization and Integrated Discovery categories for
the upregulated and downregulated genes following rapamycin
treatment. |
Table IV
Top five shared significant
(Benjamini <0.05) GO-BP term results from Database for
Annotation, Visualization and Integrated Discovery categories for
the upregulated and downregulated genes following rapamycin
treatment.
| GO-BP terms | Zebrafish
microarray
| Mouse meta-analysis
|
|---|
| Count | P-value | Benjamini | Count | P-value | Benjamini |
|---|
| Upregulated
genes | | | | | | |
| GO:0006412;
translation | 25 |
6.9×10−05 |
1.1×10−02 | 52 |
1.5×10−07 |
6.1×10−05 |
| GO:0048598;
embryonic morphogenesis | 23 |
6.3×10−05 |
1.3×10−02 | 48 |
1.0×10−04 |
7.4×10−03 |
| GO:0048568;
embryonic organ development | 17 |
1.8×10−04 |
2.0×10−02 | 34 |
4.8×10−04 |
2.5×10−02 |
| GO:0009792;
embryonic development ending in birth or egg hatching | 16 |
1.8×10−04 |
2.3×10−02 | 55 |
7.2×10−05 |
5.6×10−03 |
| GO:0043009;
chordate embryonic development | 16 |
1.8×10−04 |
2.3×10−02 | 54 |
1.1×10−04 |
7.5×10−03 |
| Downregulated
genes | | | | | | |
| GO:0006259; DNA
metabolic process | 35 |
5.0×10−07 |
1.3×10−04 | 79 |
4.7×10−08 |
4.8×10−06 |
| GO:0007049; cell
cycle | 31 |
3.9×10−07 |
1.4×10−04 | 96 |
7.1×10−06 |
3.8×10−04 |
| GO:0006091;
generation of precursor metabolites and energy | 28 |
8.0×10−07 |
1.4×10−04 | 62 |
1.6×10⁻¹⁰ |
2.7×10−08 |
| GO:0005996;
monosaccharide metabolic process | 19 |
9.8×10−06 |
7.2×10−04 | 41 |
4.5×10−06 |
2.5×10−04 |
| GO:0019318; hexose
metabolic process | 18 |
2.0×10−05 |
1.2×10−03 | 39 |
1.3×10−06 |
8.0×10−05 |
Some of the generalized GO terms, such as
translation and cell cycle, were significant in both up and
downregulated categories, particularly in mice. Following the
removal of such ambiguous (both up and downregulated) terms, the
P-values of the Fisher's test results for BP [OR, 253.65; (95% CI,
25.08–7219.69); P=9.1×10⁻¹²] and MF [OR, 18.22; (95% C
I, 1. 52–521.42); P=7.9×10−03] categories remained
significant. However the Fisher's test for GO-CC remained
insignificant.
The Fisher's tests for GO term association between
zebrafish and mice were repeated for different FDR values of mouse
meta-analysis (i.e. FDR<0.05, FDR<0.01 and the top ranked
2,186 probes) to test whether the observed associations at
FDR<0.005 were robust. Fisher's tests using probe sets specified
at each FDR cut-off revealed that GO-BP (all terms) were
significantly positively associated between zebrafish and mice
regardless of the FDR values selected (FDR<0.05,
P=3.1×10⁻¹⁴; FDR<0.01, P=1.2×10−09; top
2,186 ranked probes, P=3.4×10−05). A similar result was
observed for GO-MF at FDR of 0.01 (P=7.8×10−03) and top
2,186 ranked probes (P=3.0×10−02), however, not for
FDR<0.05 (P=0.12). Consistent with FDR value of 0.005, the
Fisher's test for GO-CC was not significant at any other selected
value.
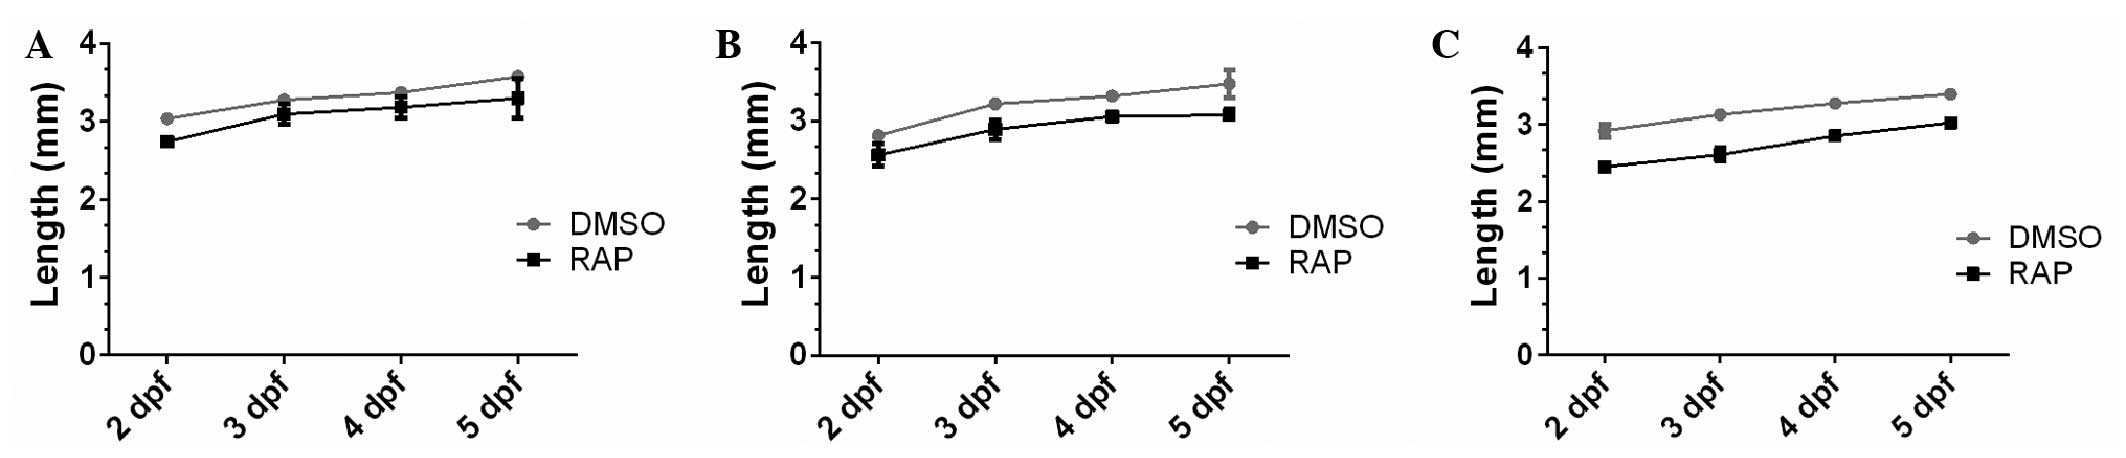
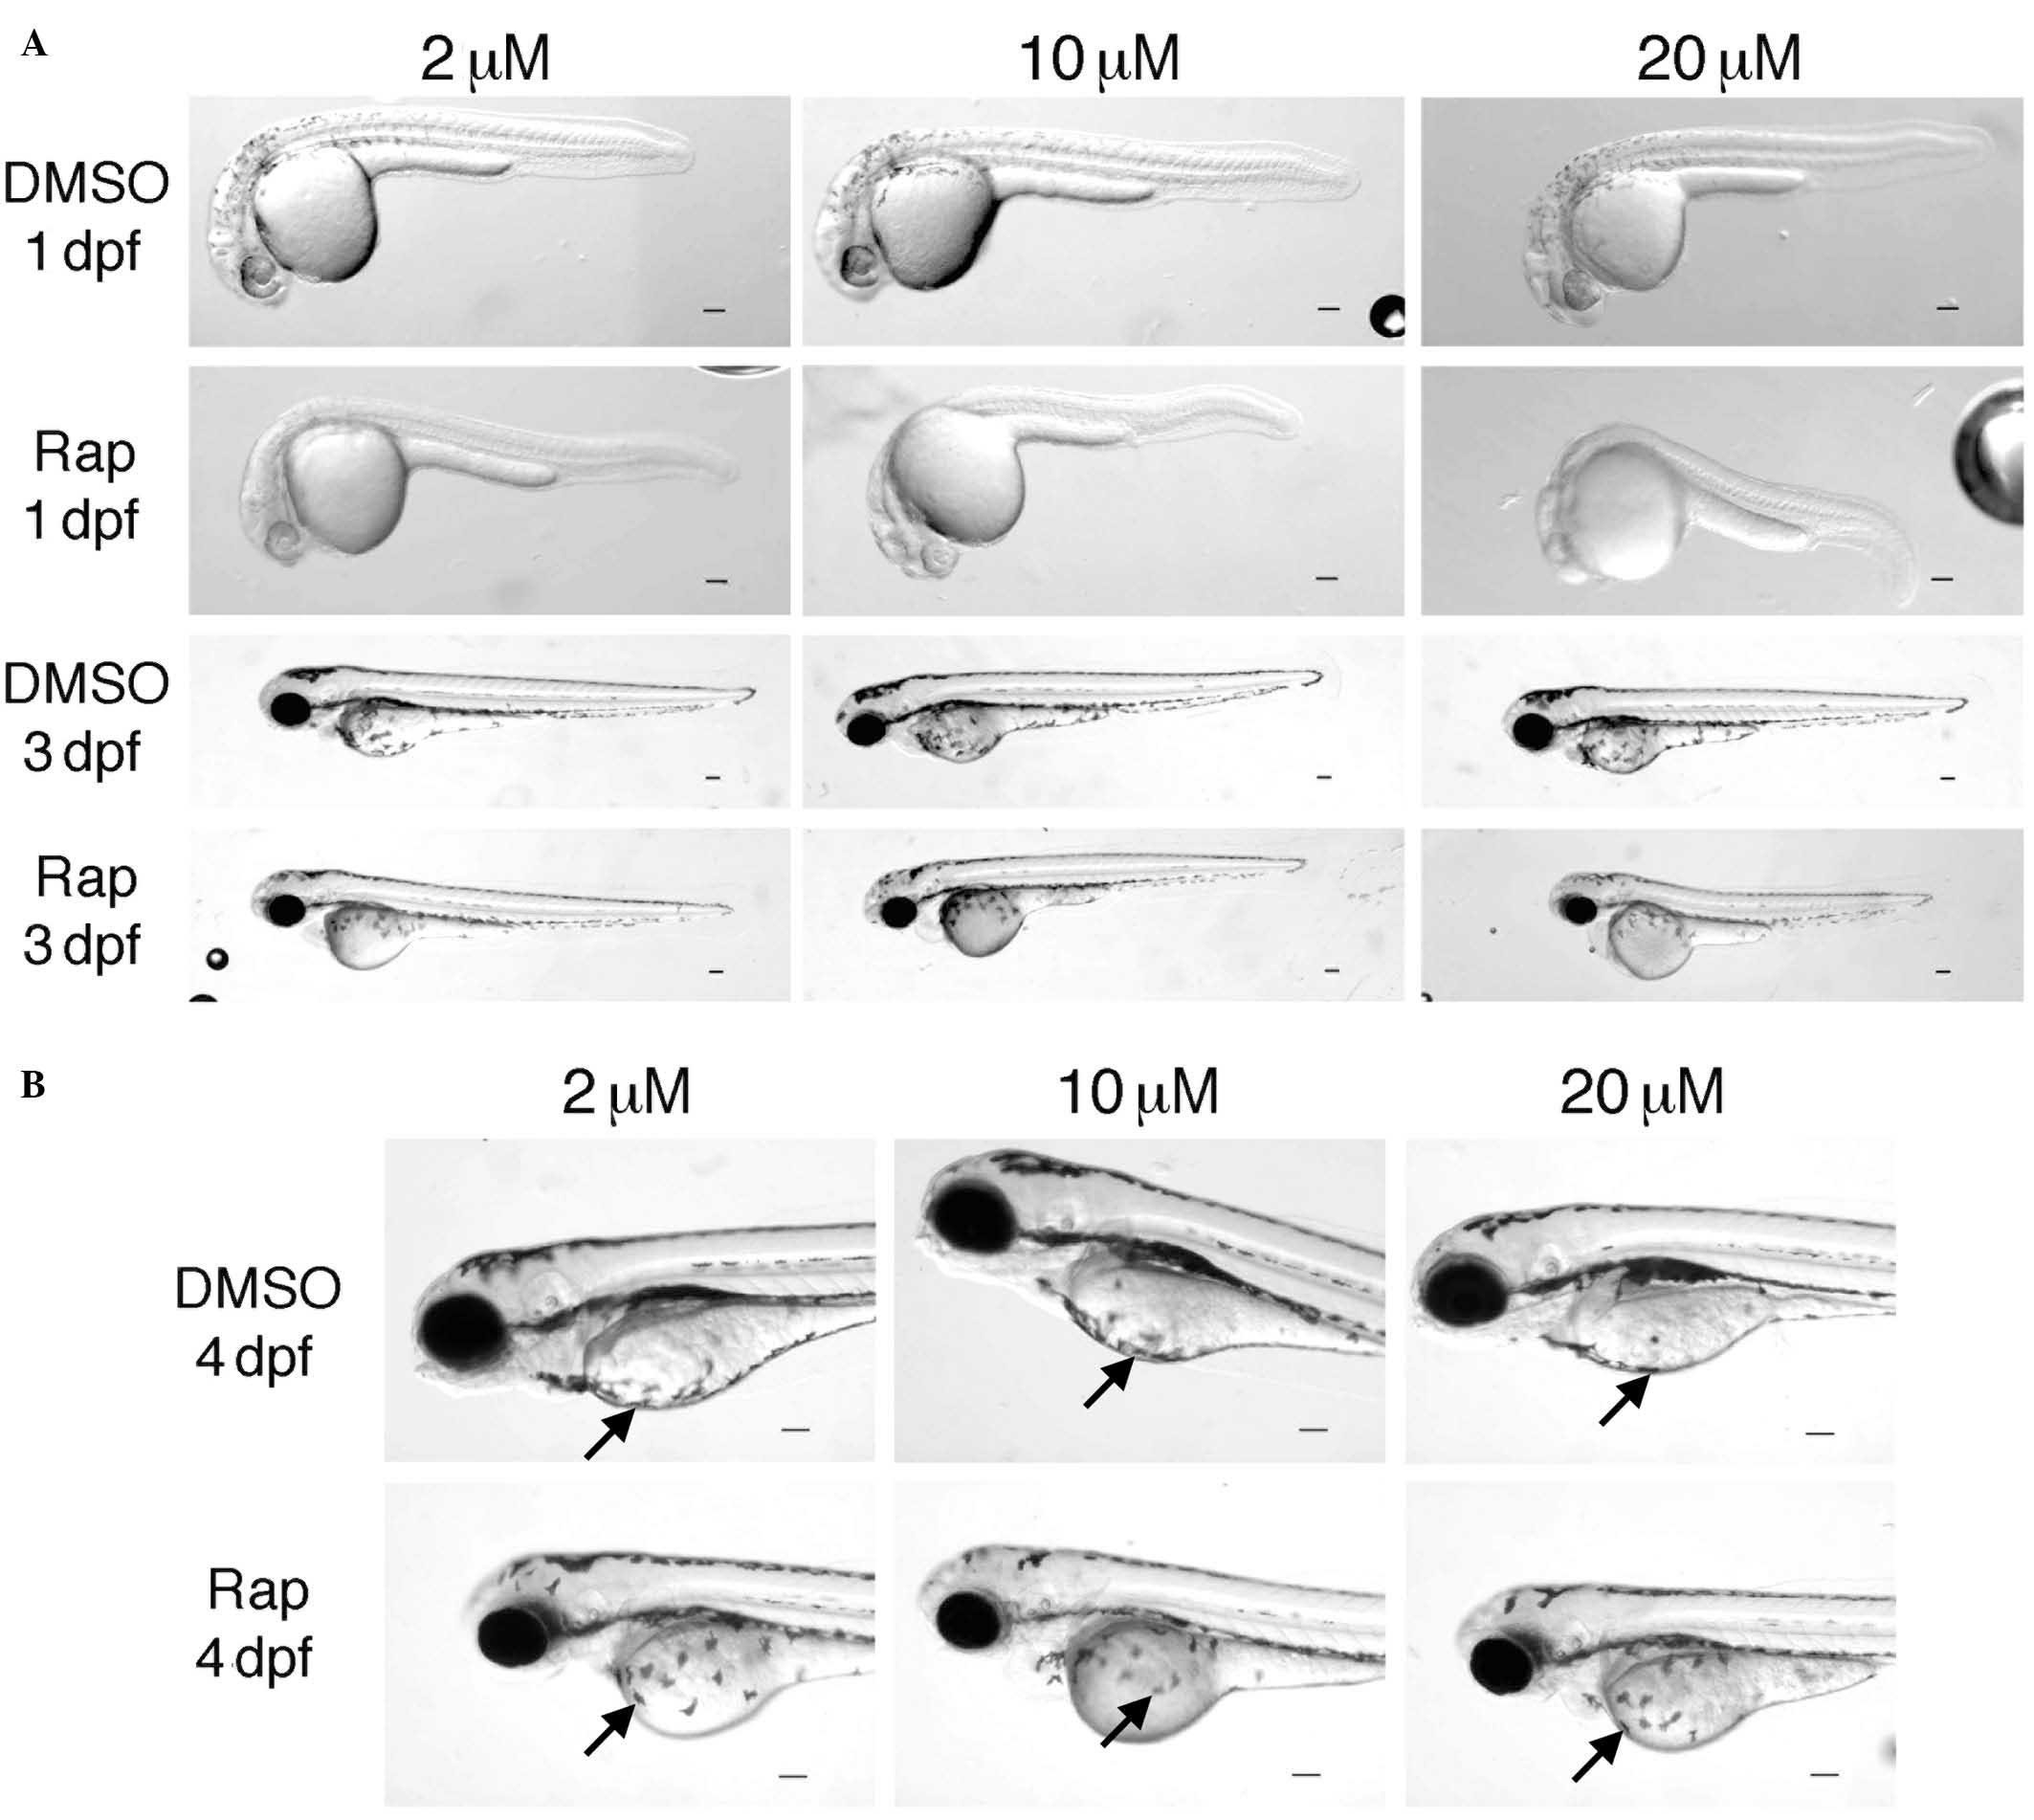
Effects of rapamycin on body size and
pigmentation are dose-dependent
Rapamycin has been shown to limit growth in multiple
organisms, however, the dose- and time-dependency of such effects
have not been well assessed. Therefore, the effects of rapamycin on
the development of zebrafish embryos (TLF) treated with increasing
doses of rapamycin were assessed at different time points (1–5
dpf). The results suggested that rapamycin resulted in a
significant delay in the development of the embryos in a dose- and
time-dependent manner, indicated by the alterations in body length
(Fig. 4). Rapamycin treated
embryos had larger yolks and shorter body sizes, and the effect of
rapamycin on body size was more apparent at 10 and 20 µM
treatments compared with the 2 µM treatment (Figs. 4 and 5). In particular, rapamycin treated
embryos exhibited marked reduction in melanocyte distribution, with
this observed to be dose-dependent (Fig. 5A and B).
Discussion
The present study, to the best of our knowledge, is
the first characterization of the global transcriptional response
of a zebrafish cell line (ZF4) when exposed to 100 nM rapamycin.
Rapamycin treatment in zebrafish was demonstrated to result in the
coordinated modulation of genes that belonged to pathways important
in cell growth, division and metabolism. Meta-analysis of
heterogeneous mouse microarray datasets then enabled the
identification of functional pathways similarly and significantly
modulated in zebrafish and mice in response to rapamycin (Tables II and III). Thus, the current study represents
an important step in an improved understanding of the functional
conservation of mTOR inhibition by rapamycin among vertebrates.
Comparative KEGG pathway analysis identified that
ribosome was the most significant pathway upregulated in both
species when exposed to rapamycin, while proteasome complexes,
oxidative phosphorylation, the cell cycle and certain metabolic
pathways were commonly downregulated (Table II). A well-known effect of
rapamycin on cellular metabolism is the inhibition of translation
through the modulation of ribosomal subunits and/or eukaryotic
translational factors (33). In
the yeast model, rapamycin negatively affects both the steady state
and polysome-associated mRNA levels of genes involved in RNA
processing and ribosome biogenesis together with the proteasome
(9). However, in reports regarding
vertebrates, the effects of rapamycin on ribosomes have been
attributed predominantly to alterations in the polysome-associated
mRNA pool (34,35). The comparative transcriptomics of
the present study indicated that, in both zebrafish and mice,
steady state mRNA levels of ribosomal subunits were upregulated
coordinately. These results indicate that rapamycin may result in
an increased accumulation of nuclear ribosomal subunit mRNAs in
vertebrates. Although small in magnitude, this collective increase
may actually be effectively large since ribosomal subunits are
highly expressed.
The observed increase in nuclear ribosomal component
expression may be the result of translation inhibition itself. With
the stalling of translation or sequestering of mRNAs, a surplus of
mRNA for the translational machinery may accumulate (36); however, this requires further
investigation. Notably, a previous study indicated that
translational inhibitors paradoxically induced the transcription of
ribosomal architecture components and translational regulatory
factors (37). The implications of
an increase in the ribosomal mRNA pool in response to translational
inhibition may be associated with the apoptotic and
survival-associated functions of rapamycin treatment. It has been
previously demonstrated that ribosomal subunit mRNAs may regulate
apoptosis driven by p53, and thus have implications in cell
survival and apoptosis (38).
Additionally, the current study demonstrated a
coordinated but mild downregulation of a subset of the
mitochondrial ribosomal proteins in rapamycin treated ZF4 cells and
mouse cell lines, indicated by the significant enrichment of
mitochondrion and mitochondrial part terms among downregulated
GO-CC terms (data not shown, Benjamini <0.05). This result is in
accord with previous studies reporting that rapamycin resulted in
the downregulation of mitochondrial ribosomes (10). The proteasome was a significantly
downregulated KEGG pathway, for both zebrafish and mice (Table II). Additionally, a previous study
indicated that rapamycin was able to downregulate proteasome
subunits at the transcriptional and translational levels in human
E6-1 Jurkat T cells (34). Hence,
by reducing proteasomal subunit expression, rapamycin may also act
as a proteasomal inhibitor in zebrafish.
Cellular analyses indicated that in ZF4 cells,
rapamycin reduced the rate of basal apoptosis while having no
significant effect on cell viability or proliferation. As
previously indicated, rapamycin may induce or protect cells from
apoptosis (39,40). The current study suggests that
rapamycin may have a protective effect against apoptosis in ZF4
cells that can potentially mask alterations in cell number and
viability. The MTT test did not indicate a significant growth
inhibition in ZF4 cells following rapamycin treatment, however,
rapamycin was observed to significantly downregulate zebrafish and
mouse KEGG and GO-BP pathways including the cell cycle (Tables II and IV).
Notably, the correlations among the three individual
mouse dataset fold change values (log2) were
significantly high, ranging between 0.21 and 0.59 regardless of the
mutations the cell lines carried (Tp53, Tsc1 and Tcs2 genes). This
suggests that the meta-analysis used in the current study was able
to capture a significant portion of the conserved aspects of
rapamycin treatment in mice, which may then be extended to
zebrafish, a non-mammalian vertebrate. A previous study showed that
ZF4 cells exhibited a drastic cellular growth inhibition and a
reduction in the expression of conserved E2F1 pathway-associated
genes in response to serum starvation (41). Accordingly, the present study
indicates that the ZF4 cell line is a valuable model for detecting
conserved modulators of cell growth and division-associated genes
and pathways.
Additionally, the present study provided a
foundation for the identification and validation of novel genes
affected by rapamycin treatment time-dependently using ZF4
fibroblast cells. The cor relation between the log fold changes
obtained from the independent RT-qPCR and microarray data in
response to rapamycin was significantly high, however, it was only
possible to confirm the significance of 55% of the genes by
RT-qPCR. The discrepancies between the RT-qPCR and microarray
results may result from the differences arising from the use of
different cell passages in the experiments and/or potentially
different probe and primer sequences/dynamics between the
microarray and RT-qPCR methodologies (42). Upon validation by RT-qPCR, a
significant modulation in response to rapamycin was observed in
several pigmentation associated genes, with an increase in the
expression of dkk1b and ddc and a reduction in
pah expression (Fig. 2). In
a previous study, the overexpression of DKK1 suppresses melanocyte
growth and proliferation in human keratinocytes (43). DDC provides dopamine by conversion
from dopa, which also can be used for melanin production, such as
in butterfly wings (44). PAH
supplies tyrosine for melanin production and contributes to
melanogenesis (45), and PAH (Enu)
mice have inactive TORC1 (46).
The role of TOR signaling in melanin pigmentation has also been
observed in Drosophila, such that increased TORC1 activity
resulted in altered pigmentation (47).
Zebrafish embryos and adults have been shown to be
sensitive to rapamycin. For instance, treatment with 400 nM
rapamycin resulted in a mild delay in embryonic development while
arresting digestive tract development 72 hpf following exposure
(6). Similarly, 10 nmol/l
rapamycin treatment phenocopied embryonic growth-associated protein
morphants exhibiting developmental delays, vessel defects and
cardiac failure (48). In
addition, the growth of the adult caudal fin in zebrafish was
negatively affected by treatment with rapamycin (49). The present in vivo study not
only confirmed the growth limiting effects of rapamycin in
zebrafish but also implicated a dose-dependent role for mTOR
inhibition in pigmentation-associated processes. Indeed, a negative
effect of rapamycin on melanocytes has been indicated in a
Xenopus model (50),
complementing the alterations observed in the present study
regarding pigmentation upon rapamycin exposure in zebrafish
(Fig. 5). However, the mechanisms
underlying the effects of rapamycin on pigmentation should be
explored at the transcript level in vivo.
In conclusion, the present study indicates that
rapamycin modulates a wide range of transcripts in ZF4 cells,
including nuclear and mitochondrial ribosomal machinery components
and proteasomal subunits. These functional alterations were
supported by KEGG and GO pathway meta-analysis of mouse microarray
datasets of rapamycin exposure. This is the first report, to the
best of our knowledge, of the conservation between the zebrafish
and mouse functional pathway enrichment profiles in response to an
mTOR inhibitor. Furthermore, the significantly affected genes
produced high gene enrichment scores suggesting that a coordinated
set of conserved events occurs in response to rapamycin in
zebrafish and mice. Additionally, the results revealed that the
response of zebrafish embryos to rapamycin exhibits similarities
with those from other organisms, providing a foundation for
comparative expression profiling studies of rapamycin treatment
between zebrafish and mammals.
Acknowledgments
The authors wish to thank to Dr Carl J Neumann for
enabling the in vivo zebrafish embryo studies to be
conducted in his laboratory at the European Molecular Biology
Laboratory (Heidelberg, Germany), Ms. Sabine Fischer for technical
support and guidance, and Dr Gulcin Cakan Akdogan for help in the
preparation of figures. The current study was funded by The
Scientific and Technological Research Council of Turkey (grant nos.
103T038 and 105S365).
References
|
1
|
Corradetti MN and Guan KL: Upstream of the
mammalian target of rapamycin: Do all roads pass through mTOR?
Oncogene. 25:6347–6360. 2006. View Article : Google Scholar : PubMed/NCBI
|
|
2
|
Brown EJ, Albers MW, Shin TB, Ichikawa K,
Keith CT, Lane WS and Schreiber SL: A mammalian protein targeted by
G1-arresting rapamycin-receptor complex. Nature. 369:756–758. 1994.
View Article : Google Scholar : PubMed/NCBI
|
|
3
|
Akcakanat A, Singh G, Hung MC and
Meric-Bernstam F: Rapamycin regulates the phosphorylation of
rictor. Biochem Biophys Res Commun. 362:330–333. 2007. View Article : Google Scholar : PubMed/NCBI
|
|
4
|
Rao RD, Buckner JC and Sarkaria JN:
Mammalian target of rapamycin (mTOR) inhibitors as anti-cancer
agents. Curr Cancer Drug Targets. 4:621–635. 2004. View Article : Google Scholar : PubMed/NCBI
|
|
5
|
Loewith R, Jacinto E, Wullschleger S,
Lorberg A, Crespo JL, Bonenfant D, Oppliger W, Jenoe P and Hall MN:
Two TOR complexes, only one of which is rapamycin sensitive, have
distinct roles in cell growth control. Mol Cell. 10:457–468. 2002.
View Article : Google Scholar : PubMed/NCBI
|
|
6
|
Makky K, Tekiela J and Mayer AN: Target of
rapamycin (TOR) signaling controls epithelial morphogenesis in the
vertebrate intestine. Dev Biol. 303:501–513. 2007. View Article : Google Scholar : PubMed/NCBI
|
|
7
|
Ji J and Zheng PS: Activation of mTOR
signaling pathway contributes to survival of cervical cancer cells.
Gynecol Oncol. 117:103–108. 2010. View Article : Google Scholar : PubMed/NCBI
|
|
8
|
Jimenez RH, Lee JS, Francesconi M,
Castellani G, Neretti N, Sanders JA, Sedivy J and Gruppuso PA:
Regulation of gene expression in hepatic cells by the mammalian
Target of Rapamycin (mTOR). PLoS One. 5:e90842010. View Article : Google Scholar : PubMed/NCBI
|
|
9
|
Preiss T, Baron-Benhamou J, Ansorge W and
Hentze MW: Homodirectional changes in transcriptome composition and
mRNA translation induced by rapamycin and heat shock. Nat Struct
Biol. 10:1039–1047. 2003. View
Article : Google Scholar : PubMed/NCBI
|
|
10
|
Cunningham JT, Rodgers JT, Arlow DH,
Vazquez F, Mootha VK and Puigserver P: mTOR controls mitochondrial
oxidative function through a YY1-PGC-1alpha transcriptional
complex. Nature. 450:736–740. 2007. View Article : Google Scholar : PubMed/NCBI
|
|
11
|
Duvel K, Yecies JL, Menon S, Raman P,
Lipovsky AI, Souza AL, Triantafellow E, Ma Q, Gorski R, Cleaver S,
et al: Activation of a metabolic gene regulatory network downstream
of mTOR complex 1. Mol Cell. 39:171–183. 2010. View Article : Google Scholar : PubMed/NCBI
|
|
12
|
Totary-Jain H, Sanoudou D, Ben-Dov IZ,
Dautriche CN, Guarnieri P, Marx SO, Tuschl T and Marks AR:
Reprogramming of the microRNA transcriptome mediates resistance to
rapamycin. J Biol Chem. 288:6034–6044. 2013. View Article : Google Scholar : PubMed/NCBI
|
|
13
|
Hentges KE, Sirry B, Gingeras AC,
Sarbassov D, Sonenberg N, Sabatini D and Peterson AS: FRAP/mTOR is
required for proliferation and patterning during embryonic
development in the mouse. Proc Natl Acad Sci USA. 98:13796–13801.
2001. View Article : Google Scholar : PubMed/NCBI
|
|
14
|
Oldham S, Montagne J, Radimerski T, Thomas
G and Hafen E: Genetic and biochemical characterization of dTOR,
the Drosophila homolog of the target of rapamycin. Genes Dev.
14:2689–2694. 2000. View Article : Google Scholar : PubMed/NCBI
|
|
15
|
Ganesan S, Moussavi Nik SH, Newman M and
Lardelli M: Identification and expression analysis of the zebrafish
orthologues of the mammalian MAP1LC3 gene family. Exp Cell Res.
328:228–237. 2014. View Article : Google Scholar : PubMed/NCBI
|
|
16
|
Sapp V, Gaffney L, EauClaire SF and
Matthews RP: Fructose leads to hepatic steatosis in zebrafsih that
is reversed by mechanistic target of rapamycin (mTOR) inhibition.
Hepatology. 60:1581–1592. 2014. View Article : Google Scholar : PubMed/NCBI
|
|
17
|
Burkhalter MD, Fralish GB, Premont RT,
Caron MG and Philipp M: Grk5l controls heart development by
limiting mTOR signaling during symmetry breaking. Cell Rep.
4:625–632. 2013. View Article : Google Scholar : PubMed/NCBI
|
|
18
|
Kim SH, Scott SA, Bennett MJ, Carson RP,
Fessel J, Brown HA and Ess KC: Multi-organ abnormalities and mTORC1
activation in zebrafish model of multiple acyl-CoA dehydrogenase
deficiency. PLoS Genet. 9:e10035632013. View Article : Google Scholar : PubMed/NCBI
|
|
19
|
Xu B, Lee KK, Zhang L and Gerton JL:
Stimulation of mTORC1 with L-leucine rescues defects associated
with Roberts syndrome. PLoS Genet. 9:e10038572013. View Article : Google Scholar : PubMed/NCBI
|
|
20
|
Li Y, Huang W, Huang S, Du J and Huang C:
Screening of anti-cancer agent using zebrafish: Comparison with the
MTT assay. Biochem Biophys Res Commun. 422:85–90. 2012. View Article : Google Scholar : PubMed/NCBI
|
|
21
|
Driever W and Rangini Z: Characterization
of a cell line derived from zebrafish (Brachydanio rerio) embryos.
In Vitro Cell Dev Biol Anim. 29A:749–754. 1993. View Article : Google Scholar : PubMed/NCBI
|
|
22
|
Krishan A: Rapid flow cytofluorometric
analysis of mammalian cell cycle by propidium iodide staining. J
Cell Biol. 66:188–193. 1975. View Article : Google Scholar : PubMed/NCBI
|
|
23
|
Gautier L, Cope L, Bolstad BM and Irizarry
RA: Affy-analysis of Affymetrix GeneChip data at the probe level.
Bioinformatics. 20:307–315. 2004. View Article : Google Scholar : PubMed/NCBI
|
|
24
|
Bolstad BM, Collin F, Brettschneider J,
Simpson K, Cope L, Irizarry RA and Speed TP: Quality assessment of
affymetrix GeneChip data. Bioinformatics and Computational Biology
Solutions Using R and Bioconductor. Gentleman R, Carey V, Huber W,
Irizarry R and Dudoit S: Springer; New York: pp. 33–47. 2005,
View Article : Google Scholar
|
|
25
|
Huang da W, Sherman BT and Lempicki RA:
Systematic and integrative analysis of large gene lists using DAVID
bioinformatics resources. Nat Protoc. 4:44–57. 2009. View Article : Google Scholar : PubMed/NCBI
|
|
26
|
Huang da W, Sherman BT and Lempicki RA:
Bioinformatics enrichment tools: Paths toward the comprehensive
functional analysis of large gene lists. Nucleic Acids Res.
37:1–13. 2009. View Article : Google Scholar
|
|
27
|
Wang X, Kang DD, Shen K, Song C, Lu S,
Chang LC, Liao SG, Huo Z, Tang S, Ding Y, et al: An R package suite
for microarray meta-analysis in quality control, differentially
expressed gene analysis and pathway enrichment detection.
Bioinformatics. 28:2534–2536. 2012. View Article : Google Scholar : PubMed/NCBI
|
|
28
|
McCurley AT and Callard GV:
Characterization of housekeeping genes in zebrafish: Male-female
differences and effects of tissue type, developmental stage and
chemical treatment. BMC Mol Biol. 9:1022008. View Article : Google Scholar : PubMed/NCBI
|
|
29
|
Pfaffl MW: A new mathematical model for
relative quantification in real-time RT-PCR. Nucleic Acids Res.
29:e452001. View Article : Google Scholar : PubMed/NCBI
|
|
30
|
Fay MP: Confidence intervals that match
Fisher's exact or Blaker's exact tests. Biostatistics. 11:373–374.
2010. View Article : Google Scholar :
|
|
31
|
Yildiz G, Arslan-Ergul A, Bagislar S, Konu
O, Yuzugullu H, Gursoy-Yuzugullu O, Ozturk N, Ozen C, Ozdag H,
Erdal E, et al: Genome-wide transcriptional reorganization
associated with senescence-to-immortality switch during human
hepatocellular carcinogenesis. PLoS One. 8:e640162013. View Article : Google Scholar : PubMed/NCBI
|
|
32
|
Wright GW and Simon RM: A random variance
model for detection of differential gene expression in small
microarray experiments. Bioinformatics. 19:2448–2455. 2003.
View Article : Google Scholar : PubMed/NCBI
|
|
33
|
Terada N, Patel HR, Takase K, Kohno K,
Nairn AC and Gelfand EW: Rapamycin selectively inhibits translation
of mRNAs encoding elongation factors and ribosomal proteins. Proc
Natl Acad Sci USA. 91:11477–11481. 1994. View Article : Google Scholar : PubMed/NCBI
|
|
34
|
Grolleau A, Bowman J, Pradet-Balade B,
Puravs E, Hanash S, Garcia-Sanz JA and Beretta L: Global and
specific translational control by rapamycin in T cells uncovered by
microarrays and proteomics. J Biol Chem. 277:22175–22184. 2002.
View Article : Google Scholar : PubMed/NCBI
|
|
35
|
Parent R, Kolippakkam D, Booth G and
Beretta L: Mammalian target of rapamycin activation impairs
hepatocytic differentiation and targets genes moderating lipid
homeostasis and hepatocellular growth. Cancer Res. 67:4337–4345.
2007. View Article : Google Scholar : PubMed/NCBI
|
|
36
|
Moore MJ: From birth to death: The complex
lives of eukaryotic mRNAs. Science. 309:1514–1518. 2005. View Article : Google Scholar : PubMed/NCBI
|
|
37
|
Boshoff HI, Myers TG, Copp BR, McNeil MR,
Wilson MA and Barry CE III: The transcriptional responses of
Mycobacterium tuberculosis to inhibitors of metabolism: Novel
insights into drug mechanisms of action. J Biol Chem.
279:40174–40184. 2004. View Article : Google Scholar : PubMed/NCBI
|
|
38
|
Bhat KP, Itahana K, Jin A and Zhang Y:
Essential role of ribosomal protein L11 in mediating growth
inhibition-induced p53 activation. EMBO J. 23:2402–2412. 2004.
View Article : Google Scholar : PubMed/NCBI
|
|
39
|
Ravikumar B, Berger Z, Vacher C, O'Kane CJ
and Rubinsztein DC: Rapamycin pre-treatment protects against
apoptosis. Hum Mol Genet. 15:1209–1216. 2006. View Article : Google Scholar : PubMed/NCBI
|
|
40
|
Tirado OM, Mateo-Lozano S and Notario V:
Rapamycin induces apoptosis of JN-DSRCT-1 cells by increasing the
Bax: Bcl-xL ratio through concurrent mechanisms dependent and
independent of its mTOR inhibitory activity. Oncogene.
24:3348–3357. 2005. View Article : Google Scholar : PubMed/NCBI
|
|
41
|
Sucularli C, Senturk S, Ozturk M and Konu
O: Dose- and time-dependent expression patterns of zebrafish
orthologs of selected E2F target genes in response to serum
starvation/replenishment. Mol Biol Rep. 38:4111–4123. 2011.
View Article : Google Scholar
|
|
42
|
Dallas PB, Gottardo NG, Firth MJ, Beesley
AH, Hoffmann K, Terry PA, Freitas JR, Boag JM, Cummings AJ and Kees
UR: Gene expression levels assessed by oligonucleotide microarray
analysis and quantitative real-time RT-PCR-how well do they
correlate? BMC Genomics. 6:592005. View Article : Google Scholar
|
|
43
|
Yamaguchi Y, Passeron T, Hoashi T, Watabe
H, Rouzaud F, Yasumoto K, Hara T, Tohyama C, Katayama I, Miki T and
Hearing VJ: Dickkopf 1 (DKK1) regulates skin pigmentation and
thickness by affecting Wnt/beta-catenin signaling in keratinocytes.
FASEB J. 22:1009–1020. 2008. View Article : Google Scholar
|
|
44
|
Koch PB, Keys DN, Rocheleau T, Aronstein
K, Blackburn M, Carroll SB and ffrench-Constant RH: Regulation of
dopa decarboxylase expression during colour pattern formation in
wild-type and melanic tiger swallowtail butterflies. Development.
125:2303–2313. 1998.PubMed/NCBI
|
|
45
|
Schallreuter KU and Wood JM: The
importance of L-phenylalanine transport and its autocrine turnover
to L-tyrosine for melanogenesis in human epidermal melanocytes.
Biochem Biophys Res Commun. 262:423–428. 1999. View Article : Google Scholar : PubMed/NCBI
|
|
46
|
Kwak SS, Suk J, Choi JH, Yang S, Kim JW,
Sohn S, Chung JH, Hong YH, Lee DH, Ahn JK, et al: Autophagy
induction by tetrahydrobiopterin deficiency. Autophagy.
7:1323–1334. 2011. View Article : Google Scholar : PubMed/NCBI
|
|
47
|
Zitserman D, Gupta S, Kruger WD,
Karbowniczek M and Roegiers F: The TSC1/2 complex controls
Drosophila pigmentation through TORC1-dependent regulation of
catecholamine biosynthesis. PLoS One. 7:e487202012. View Article : Google Scholar : PubMed/NCBI
|
|
48
|
Wenzlau JM, Garl PJ, Simpson P, Stenmark
KR, West J, Artinger KB, Nemenoff RA and Weiser-Evans MC: Embryonic
growth-associated protein is one subunit of a novel N-terminal
acetyltransferase complex essential for embryonic vascular
development. Circ Res. 98:846–855. 2006. View Article : Google Scholar : PubMed/NCBI
|
|
49
|
Goldsmith MI, Iovine MK, O'Reilly-Pol T
and Johnson SL: A developmental transition in growth control during
zebrafish caudal fin development. Dev Biol. 296:450–457. 2006.
View Article : Google Scholar : PubMed/NCBI
|
|
50
|
Moriyama Y, Ohata Y, Mori S, Matsukawa S,
Michiue T, Asashima M and Kuroda H: Rapamycin treatment causes
developmental delay, pigmentation defects and gastrointestinal
malformation on Xenopus embryogenesis. Biochem Biophys Res Commun.
404:974–978. 2011. View Article : Google Scholar
|