Introduction
Acute lymphoblastic leukemia (ALL) is a neoplastic
disease originating from B- or T-lymphocytes (1–2), and
accounts for 80% of childhood acute leukemia (AL) and is the most
common type of cancer affecting children (3,4). The
incidence rate of ALL is 5-fold higher than that of acute myeloid
leukemia (AML) (3). The ALL
prognosis has improved greatly. However, only 80–90% of the
children achieve complete remission (5,6),
whereas 20% of children with leukemia suffer ALL relapse and
subsequently have a poor prognosis (3,6).
Homeobox (HOX) is a highly conserved family of genes
that controls embryonic development and cell differentiation.
Abnormal regulation thereof is associated with the occurrence of
malignant tumors (7). HOX is
divided into the A, B, C, and D genetic clusters, which are located
on chromosomes, HOXA (7p15), HOXB (17q21), HOXC (12q13) and HOXD
(2q31) (8).
Differentiation of abnormal hematopoietic
stem/progenitor cells (HSPC) regulated by HOX is associated with
the occurrence and development of leukemia (9–11).
The differentiation and development of HSPC was regulated by HOXA5
at the pluripotent stem cell stage during differentiation and
development from erythroid to granulocyte cells (12). Kim et al (13) showed that the amount of HOXA5
methylation level is associated with the 3-year survival rate of
AML patients. Inhibition of the expression of HOXA5 gene in
bone marrow hematopoietic cells by the antisense oligonucleotide
technique showed that myeloid progenitor cell growth was inhibited,
while the proliferation of erythroid progenitor cells was
accelerated. When the HOXA5 gene was overexpressed, the
proliferation and differentiation of K562 cells into erythroid
cells was inhibited (14). The
abovementioned studies suggested that HOXA5 is associated with the
development of leukemia. All-trans retinoic acid (ATRA) exerts
antitumor effects by inducing the differentiation of tumor cells,
promoting tumor cell apoptosis and regulating cell tumor-related
gene and protein expression (15,16).
Previous studies have confirmed that ATRA is capable of regulating
the expression of certain HOX genes in hematopoietic cells, such as
HOXB2, HOXB4 and HOXA10, which provides a new
research direction for ATRA in the treatment of leukemia (17–19).
The aim of the present study was to investigate the
changes in the expression of HOXA5 gene and its relationship
with the cell cycle and apoptosis through the intervention of the
human K562 myeloid leukemia cell line using ATRA, in order to
analyze the role HOXA5 plays on the pathogenesis and the
development process of myeloid leukemia.
Materials and methods
Cell line
K562 cells were provided by the Central Laboratory
of the Affiliated Hospital of Luzhou Medical College (Luzhou,
China).
Reagents and instruments
Reagents and equipment used were as follows: Total
RNA extraction kit [Tiangen Biotech (Beijing) Co., Ltd., Beijing,
China]; iScript cDNA synthesis kit, C1000 polymerase chain reaction
(PCR) amplification, protein electrophoresis (Bio-Rad, Berkeley,
CA, USA); cell counting kit-8 (CCK-8) kit (Beyotime Biotechnology
Research Institute, Jiangsu, China); ATRA (Sigma, St. Louis, MO,
USA); fetal bovine serum (Hyclone, Logan, UT, USA); flow cytometry
apoptosis kit box, cell cycle kit, flow cytometry (BD Biosciences,
Franklin Lakes, NJ, USA); western blotting primary antibody (Abcam,
Cambridge, UK); western blotting secondary antibody (Beyotime
Biotechnology Research Institute); HOXA5 and GAPDH primers (Sangon
Biotech Co., Ltd., Shanghai, China); cell culture box (NuAire US
Autoflow, Plymouth, MN, USA); high speed centrifuge (Beckman
Coulter, Athens, Greece); and clean bench (Suzhou Antai Air Tech
Co., Ltd., Suzhou, China).
Cell proliferation and toxicity test
(CCK-8)
According to the incubation time, the cells were
divided into the negative control group (K562 cells and culture
medium without ATRA intervention) and four experimental groups
(i.e., ATRA 24 h, 48 h, 72 h and 96 h groups). A blank group, i.e.,
culture medium without K562 cells was also established as a
control. The ATRA concentrations used were, 5.0, 7.5, 10.0 and
15.0, and 20.0 µmol/l, respectively, in accordance with the
CCK-8 kit instructions. Optical density (OD) values were measured
at 450 nm. The experiment was repeated three times. The mean value
was calculated for the cell proliferation inhibition rate as: (OD
of control group − OD of experimental group)/(OD of control group −
OD of blank group) × 100%.
Experimental group
The experiment was divided into the control and
experimental groups. The cells in the experimental group were
treated with 10 µmol/l ATRA for 24, 48 and 72 h,
respectively.
Detection of K562 cell apoptosis
To detect cell apoptosis, the cells were washed with
phosphate-buffered saline and suspended in binding buffer, followed
by the addition of annexin V-fluorescein isothiocyanate and
propidium iodide. After 15 min at room temperature (25°C) in the
dark, the apoptotic rate was measured using flow cytometry within 1
h.
Detection of K562 cell cycle
To determine the cell cycle, the cells were
suspended in buffer solution followed by the addition of solution A
and incubation for 10 min. Solution B was added and incubated for
10 min at room temperature. Solution C was subsequently added and
kept at 2–8°C for 10 min in the dark. The cell cycle was then
determined using flow cytometry.
Quantitative PCR for the determination of
HOXA5 mRNA expression
Total RNA was extracted from K562 cells using a
total RNA extraction kit. The concentration and purity
(OD260/OD280) were determined. The total RNA was reverse
transcribed into cDNA on a PCR instrument using an iScript cDNA
kit. HOXA5 gene cDNA was added into the reaction system on
ABI RT-PCR according to the manufacturer protocols. HOXA5
and GAPDH primer sequences are shown in Table I. Cycle threshold (Ct) values
obtained were analyzed by Step One software (Applied Biosystems,
Foster City, CA, USA). Sample Ct value and target gene relative
expression were also calculated (2−ΔΔCt).
 | Table ISequence primers for HOXA5 gene
and GAPDH. |
Table I
Sequence primers for HOXA5 gene
and GAPDH.
| Gene | Primer F | Primer R |
|---|
| HOXA5 |
5′-TTTTGCGGTCGCTATCC-3′ |
5′-CTGAGATCCATGCCATTGTAG-3′ |
| GAPDH |
5′-ATGCTGGCGCTGAGTACGTC-3′ |
5′-GGTCATGAGTCCTTCCACGATA-3′ |
Expression of HOXA5 protein in K562
cells
Cells were collected from the experimental and
control groups and were processed using SDS-PAGE and western blot
analysis, and the protein bands were subsequently scanned and
quantified. The primary antibody was rabbit anti-human HOXA5
polyclonal antibody, and the secondary antibody was goat
anti-rabbit immunoglobulin G conjugated with horseradish
peroxidase. Subsequently, the protein bands of HOXA5 were
analyzed.
The internal reference gene was β-actin (Beyotime
Biotechnology Research Institute). The relative ratio of the target
protein was determined using HOXA5 protein bands of gray value and
β-actin protein bands of gray value. The gray level ratio with
HOXA5 and the internal reference gene β-actin, as well as the
relative expression quantity of HOXA5 protein expressed in the
experimental group was carried out. Subsequently, the protein bands
of HOXA5 were analyzed.
Statistical analysis
Data were analyzed using SPSS 17.0 software (SPSS,
Inc., Chicago, IL, USA). Data were presented as mean ± standard
deviation. A comparison between groups was analyzed by
single-factor variance analysis. Pair-wise comparisons used least
significant difference. P<0.05 was considered to indicate a
statistically significant difference. The correlation analysis
between two variables was analyzed using the Spearman rank
correlation analysis, and a=0.05 was a significant test level.
Results
Effect of ATRA intervention on K562 cell
proliferation inhibition
Table II shows the
cell proliferation and cell viability in each group. The results
showed that, the OD value was decreased with the increase in the
concentration of ATRA (P<0.05). At the same concentration of
ATRA, with the extension of incubation time, OD value increased
gradually. The differences between groups were also statistically
significant (P<0.05).
| Table IICell viability of K562 determined by
ATRA on different concentration (OD=450 nm, mean ± SD). |
Table II
Cell viability of K562 determined by
ATRA on different concentration (OD=450 nm, mean ± SD).
| Time | Blank group | Control group | Drug concentration
(µmol/l)
| F-value | P-value |
|---|
| 5.0 | 7.5 | 10.0 | 15.0 | 20.0 |
|---|
| 24 h | 0.200±0.0002 | 0.840±0.0002 | 0.850±0.0003 | 0.710±0.0002 | 0.540±0.0002 | 0.395±0.0002 | 0.280±0.0001 | 8643395.770 | <0.05 |
| 48 h | 0.200±0.0001 | 0.870±0.0001 | 0.968±0.0001 | 0.741±0.0002 | 0.578±0.0001 | 0.330±0.0002 | 0.220±0.0001 | 2.767E7 | <0.05 |
| 72 h | 0.201±0.0002 | 0.900±0.0002 | 1.000±0.0002 | 0.830±0.0002 | 0.661±0.0001 | 0.301±0.0002 | 0.210±0.0003 | 1.472E7 | <0.05 |
| 96 h | 0.201±0.0002 | 0.970±0.0002 | 1.119±0.0001 | 0.890±0.0001 | 0.740±0.0003 | 0.237±0.0003 | 0.200±0.0002 | 2.710E7 | <0.05 |
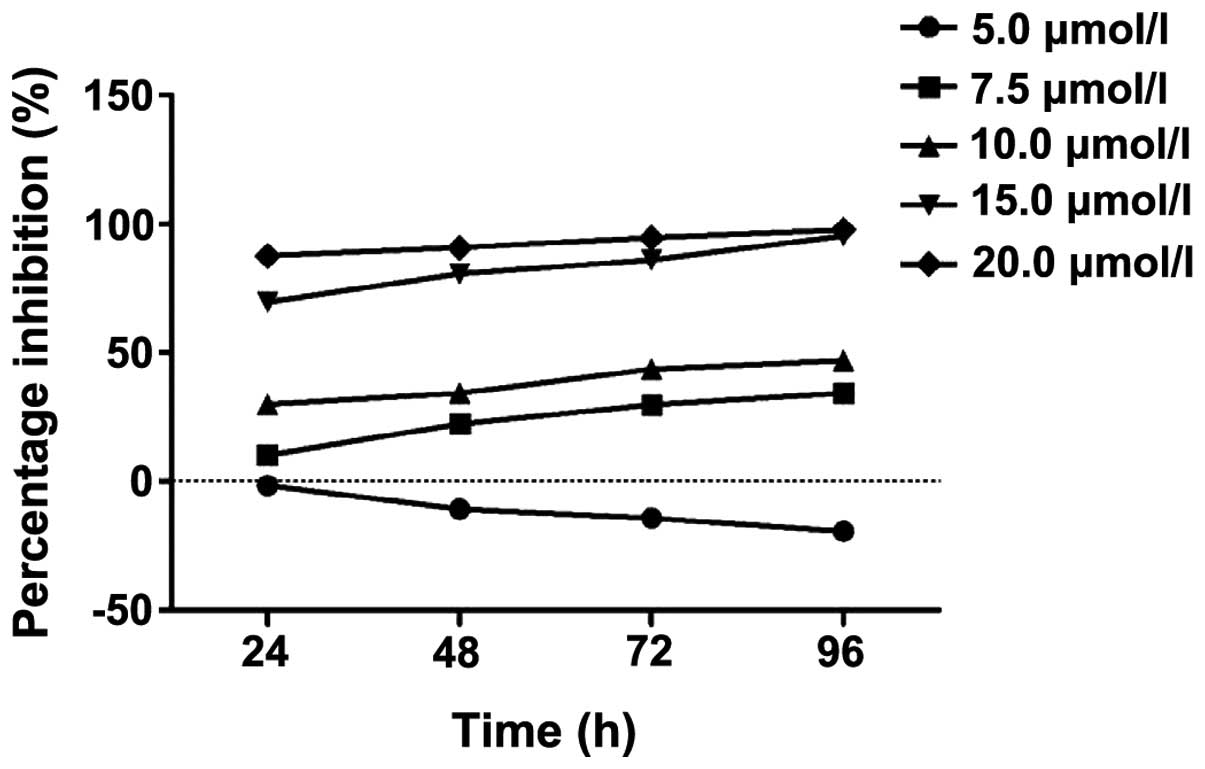
Fig. 1 shows the
inhibition of K562 cell proliferation as a percentage change. The
proliferation of the K562 cell inhibition rate was lower when the
ATRA concentrations were 5.0 and 7.5 µmol/l. The result
indicated that the inhibitory effect of the drug on the cells was
weaker. When the concentration of ATRA was 15.0 and 20.0
µmol/l, the proliferation of the K562 cell inhibitory rate
was markedly higher, indicating that the inhibitory effects of drug
on cells were strong with strong cytotoxicity. The concentration of
ATRA at 10 µmol/l was optimal when the proliferation
inhibitory rate was ~50%, and at this ATRA concentration it was
easy to detect the HOXA gene and protein expression. Thus,
10 µmol/l of ATRA was used in the subsequent
experiments.
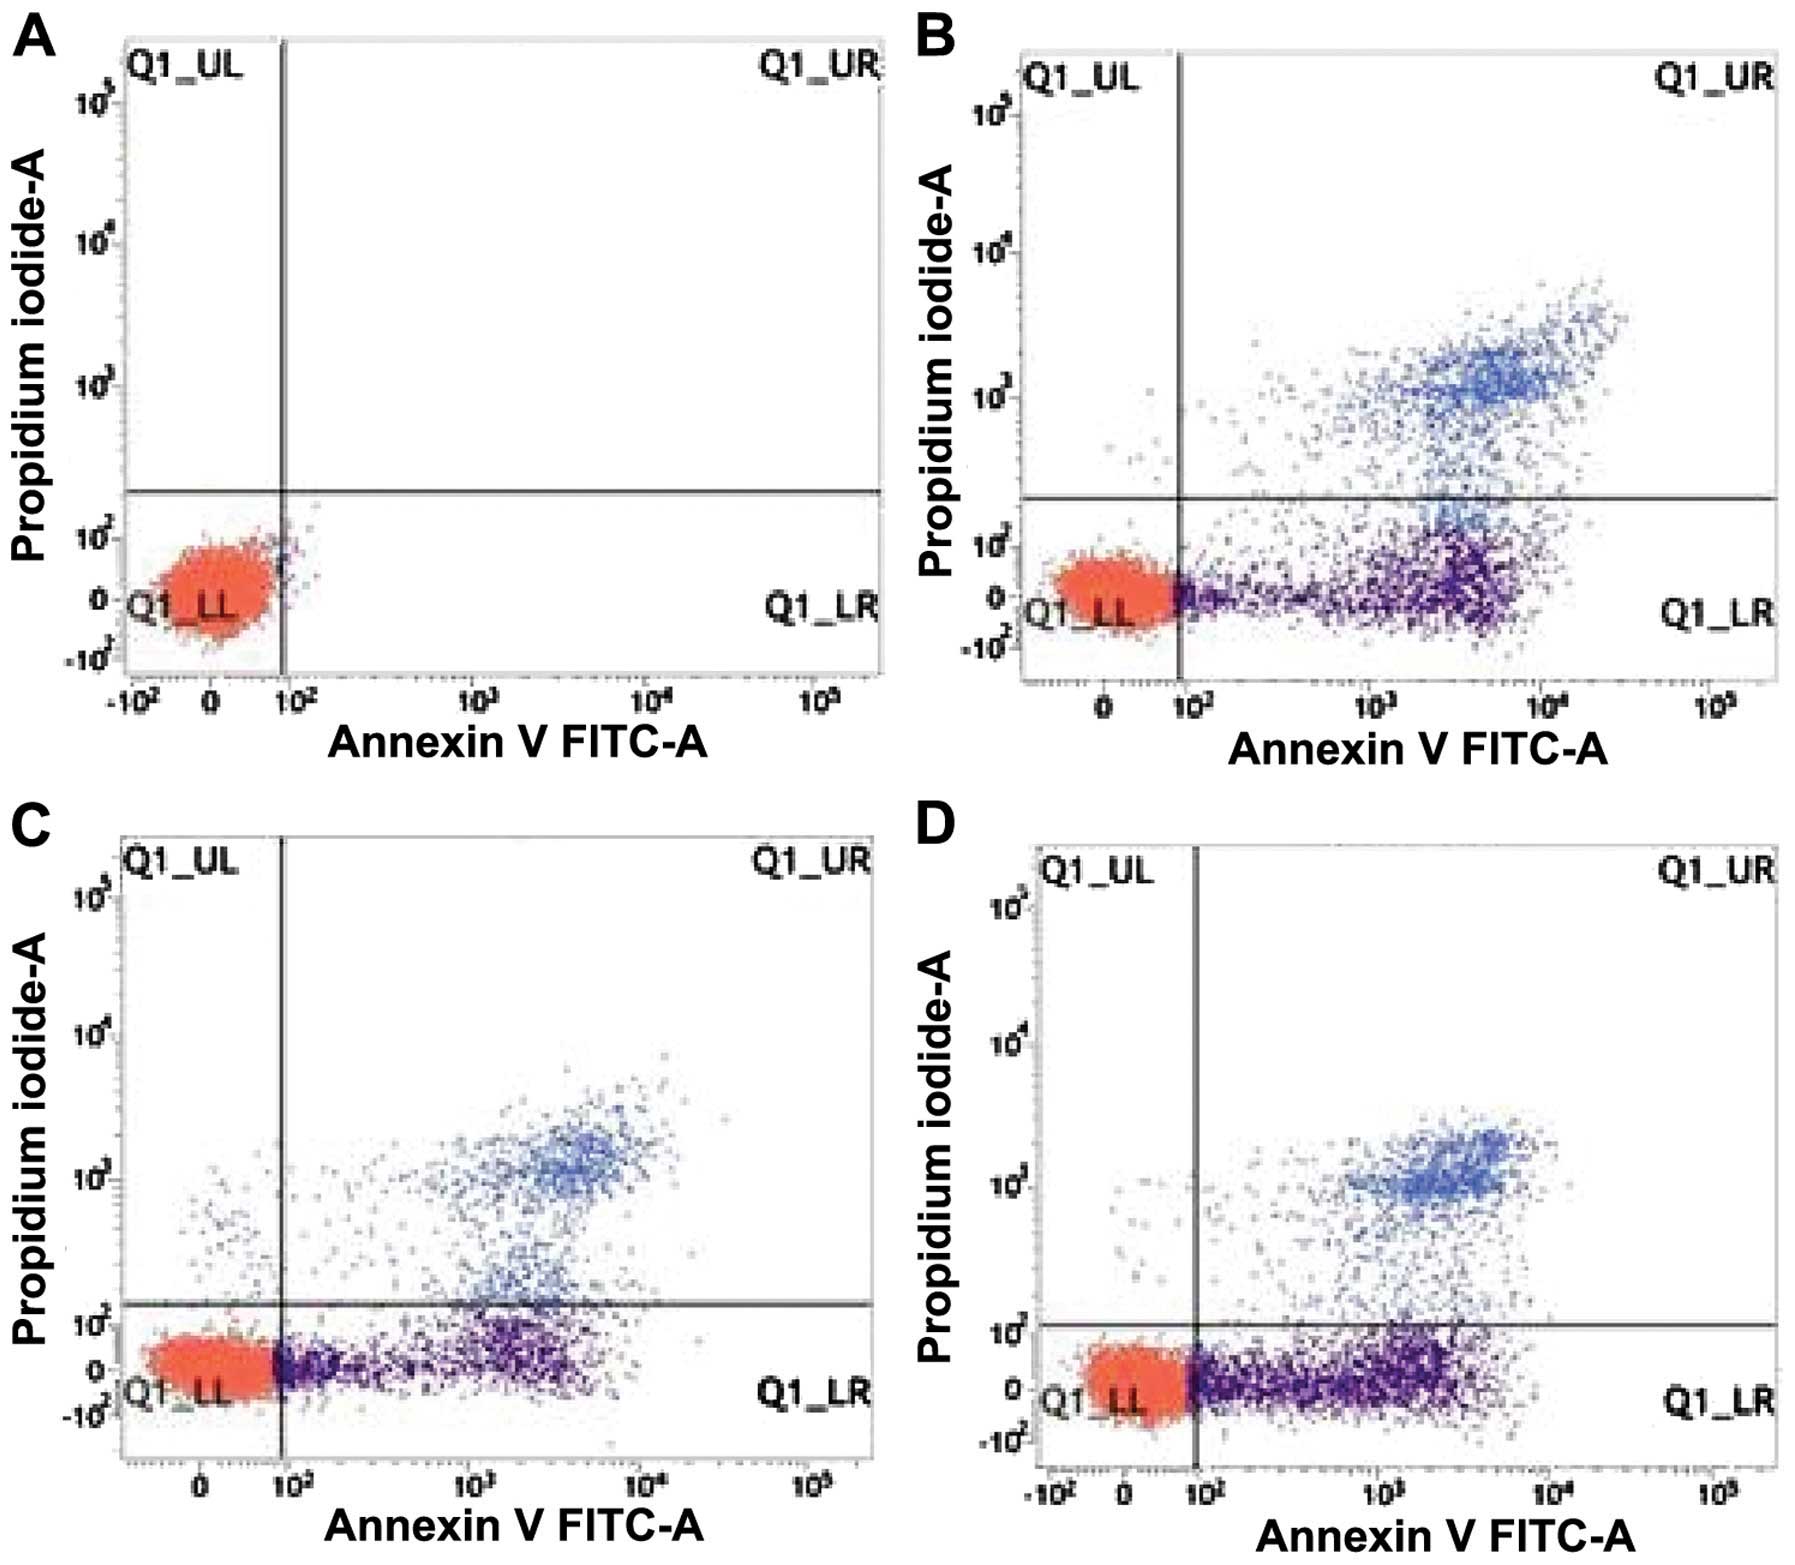
Effect of ATRA on apoptosis of K562
cells
Determination of K562 cell apoptotic rates using
flow cytometry (Fig. 2). LL in the
lower left quadrant is indicated living cells. LR in the right
lower quadrant indicated early apoptotic cells. UR in the right
upper quadrant represented the late apoptotic cells with UL in the
left upper quadrant of the mechanically damaged cells. The ratio of
the number of cells in the UR and LR quadrants and the total cell
number constituted the apoptotic rate.
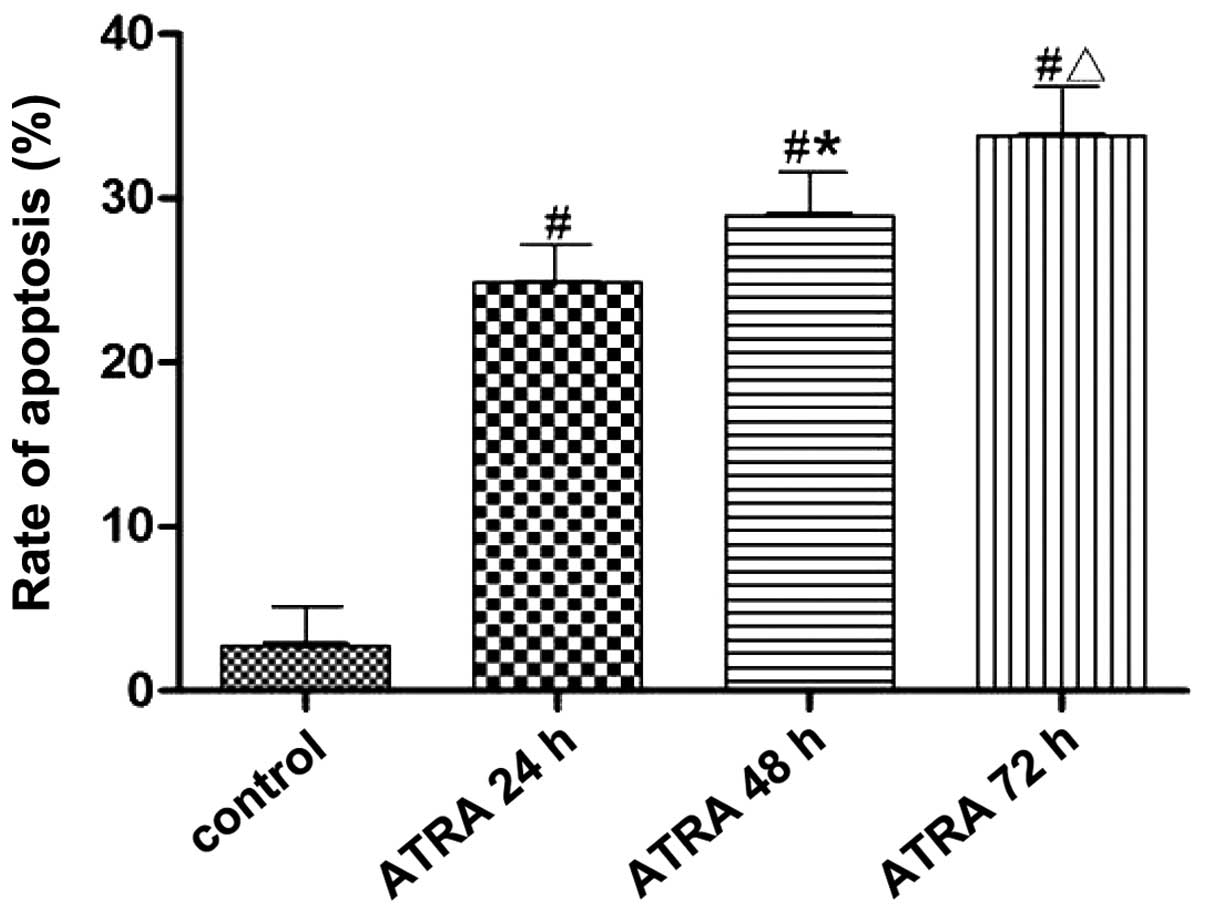
Data of the cell apoptotic rate in each group was
measured using flow cytometry and analyzed using SPSS 17.0 software
(Fig. 3). The apoptotic rates of
K562 cells were 24.84±0.14, 28.90±0.30 and 33.44±0.48% after 10.0
µmol/l ATRA intervention for 24, 48 and 72 h, respectively,
which was significantly higher than that in the control group
(P<0.05). The apoptotic rate was increased gradually with the
prolongation of ATRA intervention (P<0.05).
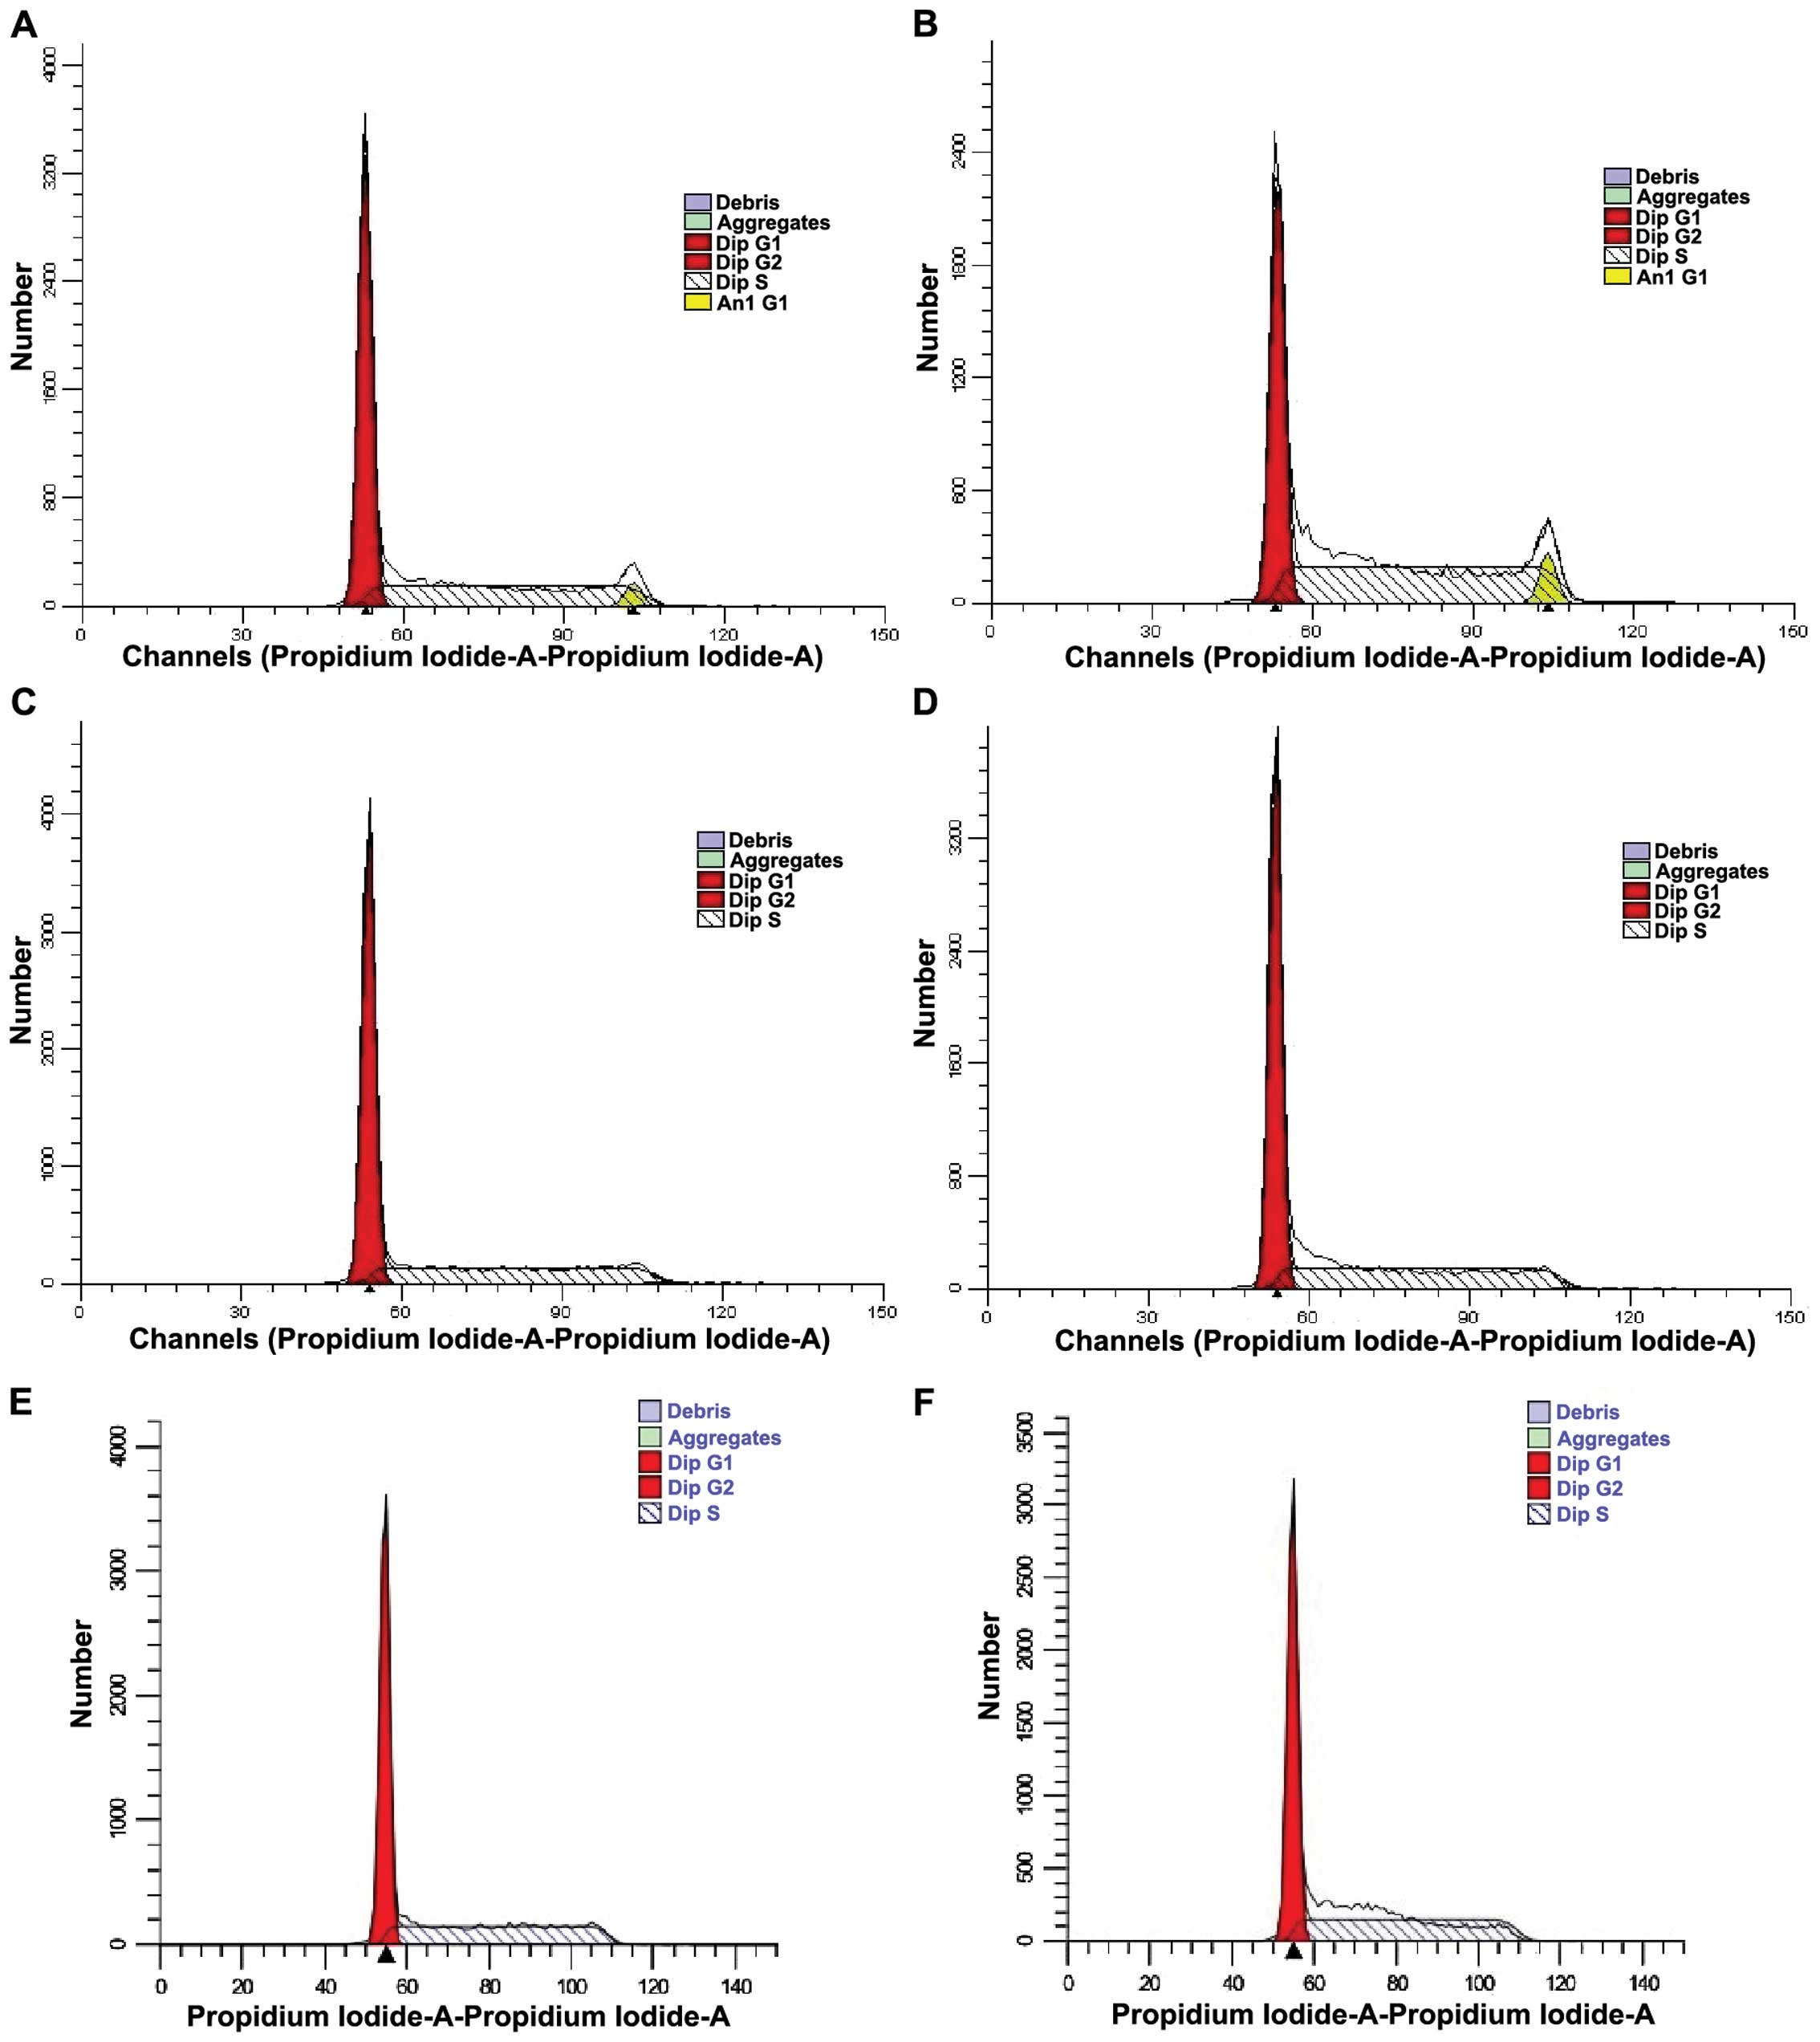
Analysis of K562 cell cycle using flow
cytometry
Cell cycle was determined by flow cytometry
(Fig. 4). ModFit software (Verity
Software House, Topsham, ME, USA) was used to calculate the
proportion of cell cycle at each time point (Table III). The data showed that the
proportion of G0/G1 phase was increased and the proportion of S
stage was reduced in the drug-treated group compared to those in
the control group at each time point, indicating that cell
proliferation and cell cycle were inhibited in the G0/G1 phase.
| Table IIIThe effects of ATRA on the K562 cell
cycle. |
Table III
The effects of ATRA on the K562 cell
cycle.
| Group | Control group (%)
| Drug intervention
group (%)
|
|---|
| G0/G1 | S | G2/M | G0/G1 | S | G2/M |
|---|
| ATRA 24 h | 49.08 | 45.97 | 4.95 | 51.14 | 41.49 | 7.37 |
| ATRA 48 h | 58.99 | 41.01 | 0.00 | 61.91 | 38.09 | 0.00 |
| ATRA 72 h | 53.54 | 46.46 | 0.00 | 56.26 | 43.74 | 0.00 |
Effect of ATRA intervention for 24, 48
and 72 h on the expression of HOXA5 mRNA
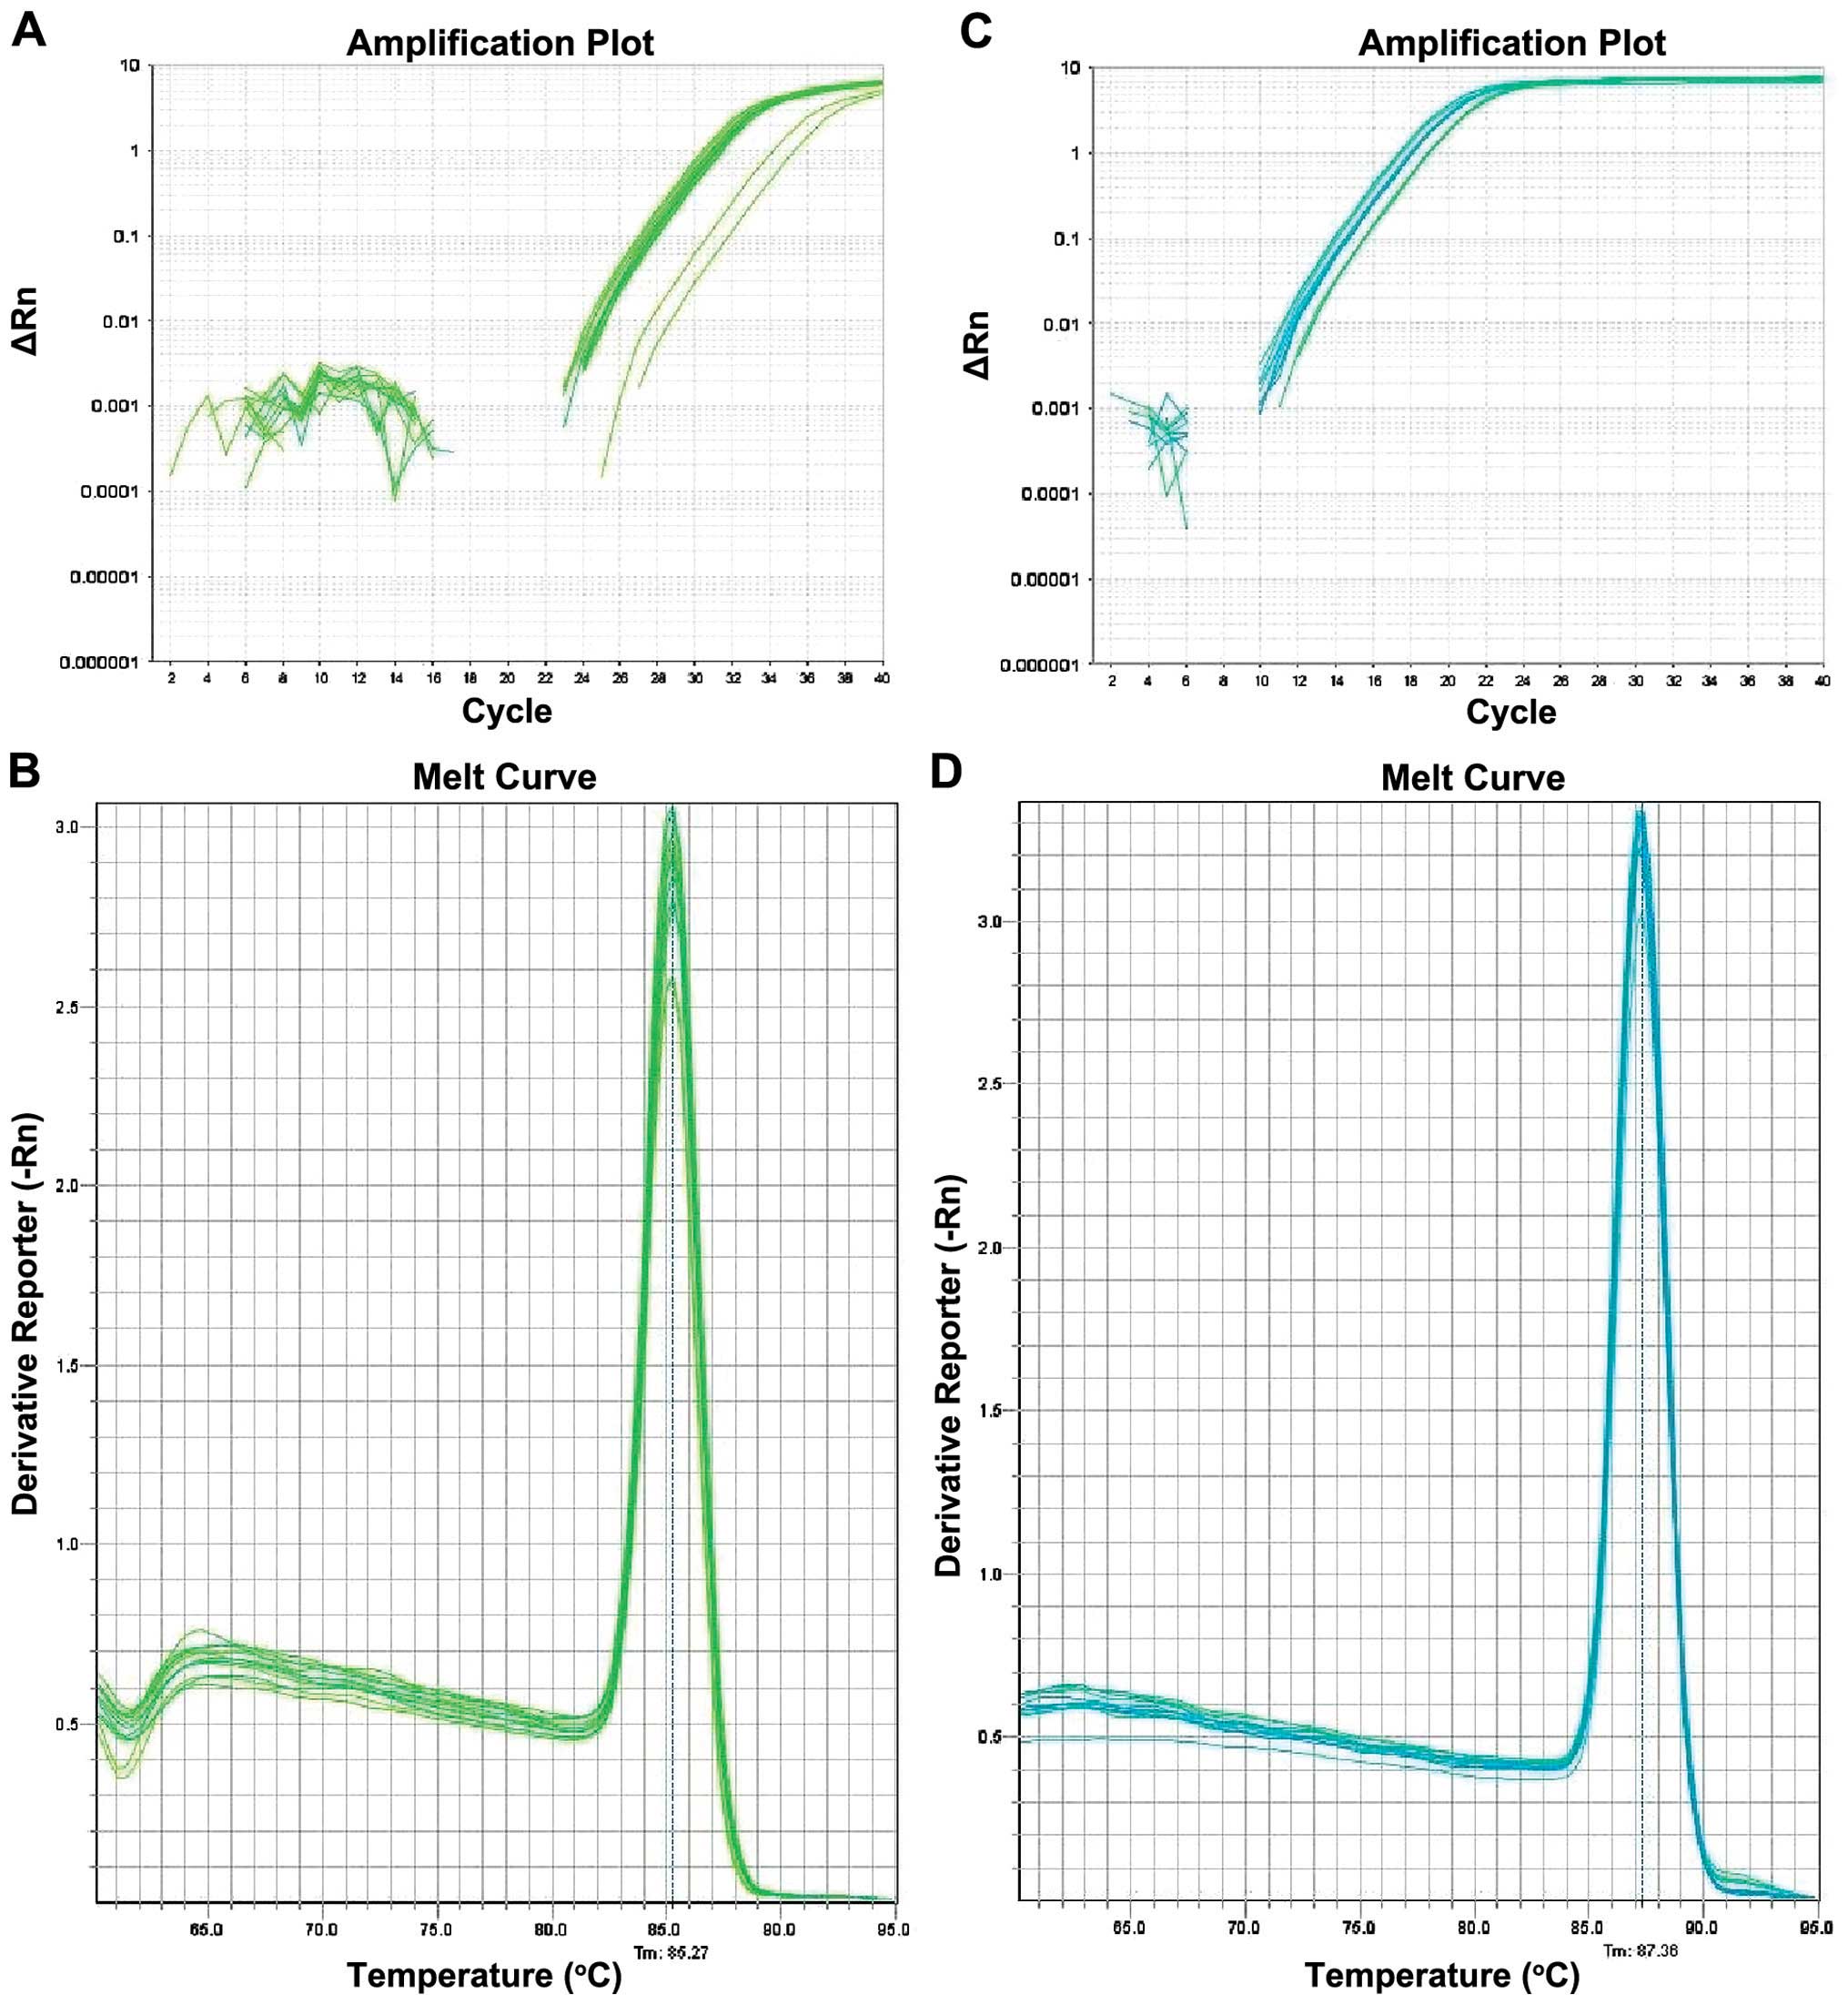
Amplification and dissolution curve in the
experiment. HOXA5 gene and its reference GAPDH amplification
curve are S-type kinetic curves (Fig.
5). HOXA5 and GAPDH melting curves were obtained
following PCR reaction, which is a single absorption peak with the
single solution temperature, 85.3 and 87.4°C, respectively. This
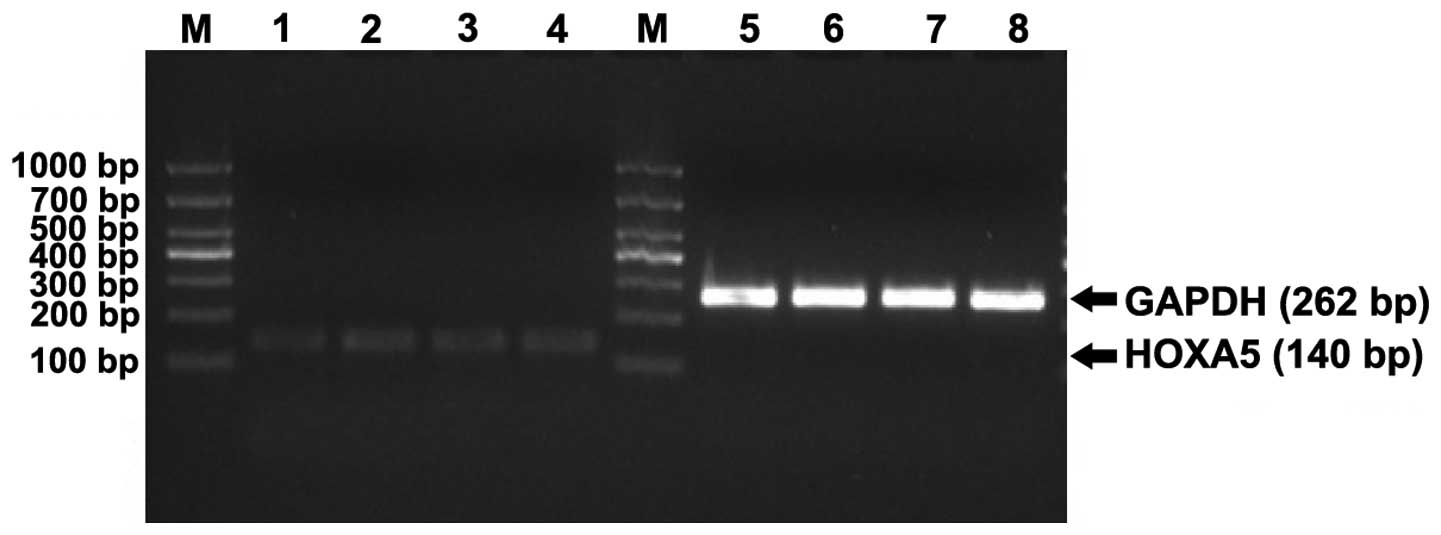
result indicated that the primers were specific. Results of the
agarose gel electrophoresis for the RT-PCR amplification products
of HOXA5 gene and GAPDH in K562 cells are shown in Fig. 6. The bands are clearly shown with
no impurities, suggesting that the RT-PCR amplification was
successful.
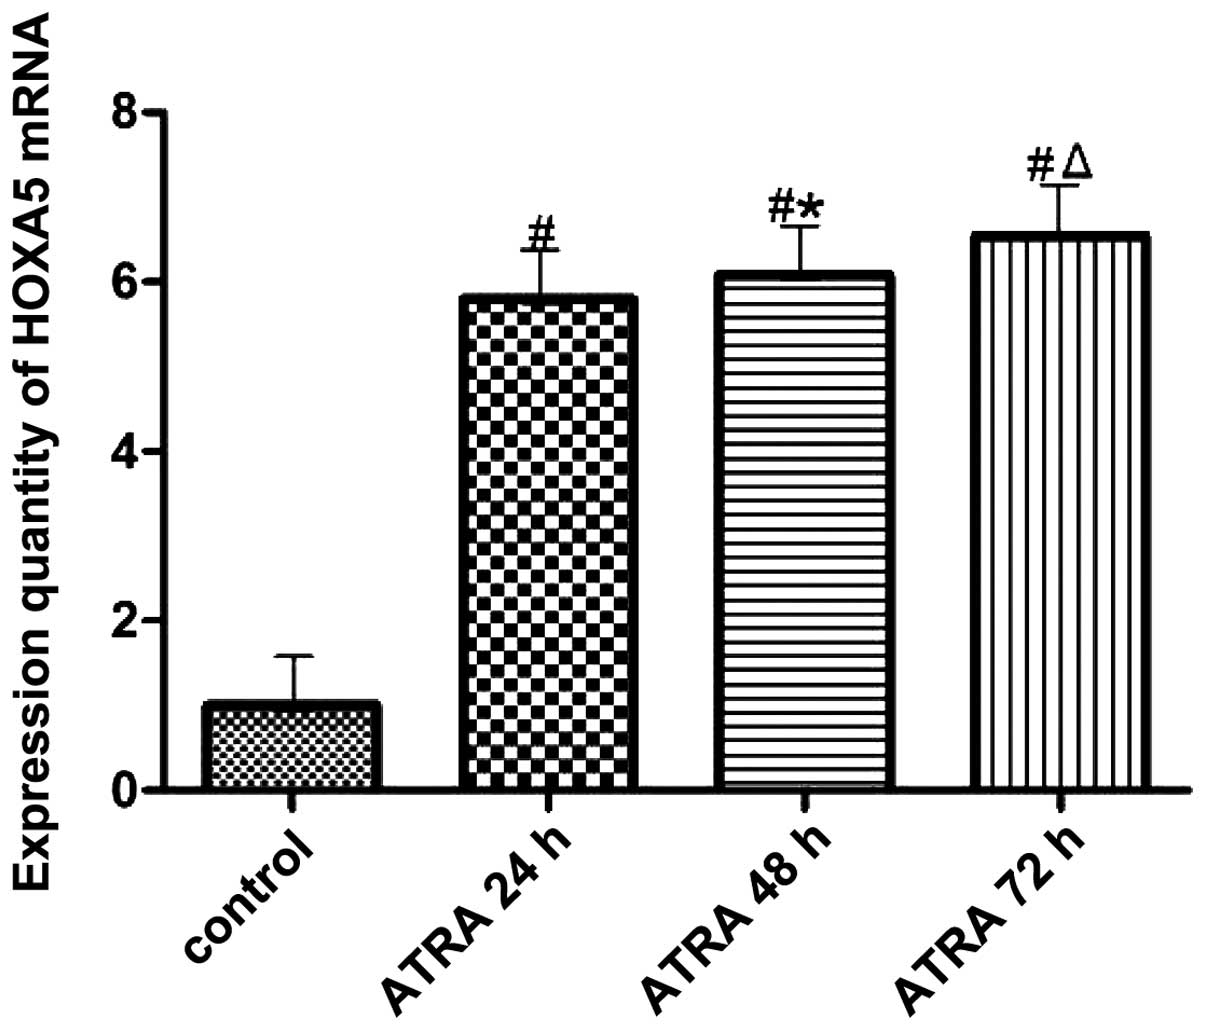
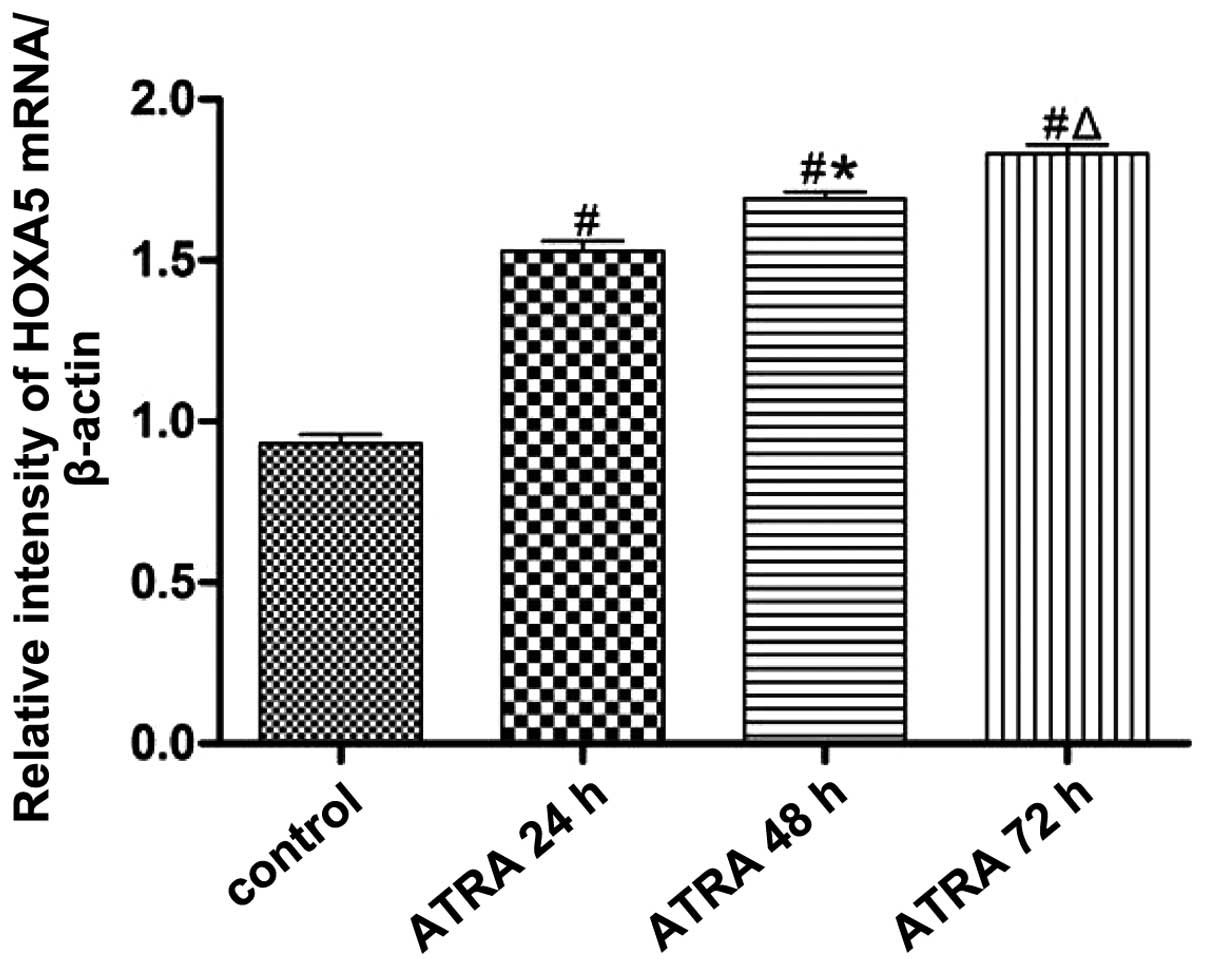
Expression of HOXA5 mRNA in K562 cells
detected by RT-PCR
The amount of HOXA5 mRNA expression is shown in
Fig. 7. It is evident that HOXA5
mRNA expression in the experimental group increased compared with
that in the control group. The difference was statistically
significant (P<0.05). With the prolonged intervention time,
HOXA5 mRNA expression increased gradually (Fig. 7). The difference was statistically
significant (P<0.05).
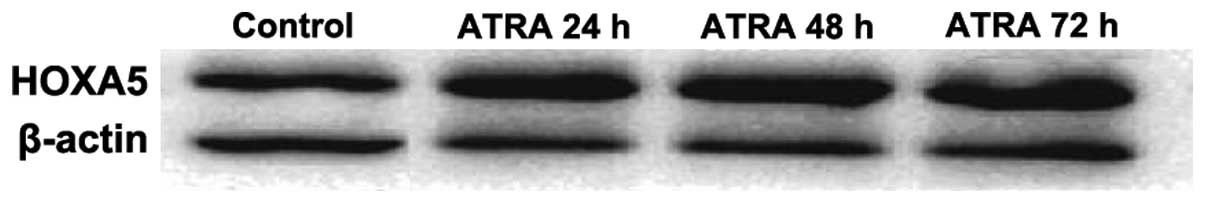
Expression of HOXA5 protein detected by
western blotting
The electrophoresis of HOXA5 protein and β-actin are
shown in Fig. 8. Each of the
electrophoretic bands is clear, and HOXA5 protein expression was
increased in the experimental group compared with that of the
control group, and with prolonged intervention time, the HOXA5
expression increased gradually.
Expression of HOXA5 protein following
ATRA intervention in K562 cells
Fig. 9 shows that
HOXA5 protein expression was increased in the experimental group
compared with that of the control group. The difference was
statistically significant (P<0.05). With prolonged intervention
time, HOXA5 expression increased gradually. The difference was
statistically significant (P<0.05).
HOXA5 mRNA and protein expression changes
its relationship with cell apoptosis after ATRA intervention of
K562 cells
The mRNA HOXA5 and protein expression and cell
apoptotic rate were increased 24, 48 and 72 h after ATRA
intervention in the experimental group compared with that of the
control group (Table IV).
| Table IVThe relationship between cell
apoptosis and HOXA5 mRNA and protein expression changes (mean ±
SD). |
Table IV
The relationship between cell
apoptosis and HOXA5 mRNA and protein expression changes (mean ±
SD).
| Group | HOXA5 mRNA | HOXA5 protein | Apoptotic rate
(%) |
|---|
| Control | 1.0008±0.0002 | 0.826±0.042 | 2.70±0.04 |
| ATRA 24 h | 5.7969±0.0010 | 1.128±0.065 | 24.84±0.14 |
| ATRA 48 h | 6.0849±0.0011 | 1.373±0.029 | 28.90±0.30 |
| ATRA 72 h | 6.5453±0.0017 | 1.540±0.042 | 33.44±0.48 |
Spearman rank correlation analysis revealed that the
correlation coefficient rate of HOXA5 mRNA expression and cell
apoptosis was 0.944, which was positively correlated (P<0.05).
The correlation coefficient for the relationship between HOXA5
protein expression and the apoptotic rate was 0.826 (P<0.05).
Thus, ATRA may promote K562 cell apoptosis by upregulating the
expression of HOXA5.
HOXA5 mRNA and protein expression changes
in K562 cells after ATRA intervention
Following treatment with ATRA the ratio of cells in
the G0/G1 phase were higher and the ratio of cells in S stage was
lower in the intervention group compared with that of the control
group (Table III).
Accordingly, the G0/G1 phase increased percentage
was calculated as (experiment group-control group)/control group)
and S stage reduction percentage as (control group-experimental
group/control group) (Table
V).
| Table VThe relationship between cell cycle
and HOXA5 mRNA and protein expression changes. |
Table V
The relationship between cell cycle
and HOXA5 mRNA and protein expression changes.
| Group | HOXA5 mRNA | HOXA5 protein | G0/G1 increased
% | S stage decreased
% |
|---|
| ATRA 24 h | 5.7969±0.0010 | 1.128±0.065 | 4.20 | 9.75 |
| ATRA 48 h | 6.0849±0.0011 | 1.373±0.029 | 4.95 | 7.12 |
| ATRA 72 h | 6.5453±0.0017 | 1.540±0.042 | 5.08 | 5.85 |
The Spearman rank correlation analysis revealed that
the correlation coefficient of the amount of HOXA5 mRNA expression
and the increased percentage of cells in G0/G1 was 1.00, which was
positively correlated. Its correlation coefficient with the S phase
decreased percentage was −1.00, indicating a negative correlation.
The correlation coefficient of HOXA5 protein expression and
increased percentage of the cell cycle in G0/G1 phase was 1.00,
which was positively correlated. The correlation coefficient with
the S phase decreased percentage was −1.00, indicating a negative
correlation. These data suggested that ATRA may increase mRNA HOXA5
and protein expression in the G0/G1 phase, decreasing the
proportion of S stage and inhibiting cell proliferation.
Discussion
Leukemia is a hematopoietic system malignant
proliferative disease, whose incidence is on the increase. It is
the most common malignant tumor for children, accounting for
approximately 33% of children with malignant tumors (12). It is a serious threat to the health
of children and adolescents. The pathogenesis of leukemia is
unclear at present. HOXA is the master control gene for HSPC
proliferation and differentiation, and the abnormal expression of
is closely associated with the disease of blood system (20–22).
Guo and Liu (23)
identified that HOXA9 is expressed in HL-60 cells, and HOXA9 mRNA
and protein expression level changes in HL-60 cells following
treatment with ATRA. Zhang and Liu (24) showed HOXB7 mRNA and protein
expression in human umbilical cord blood stem cells by RT-PCR and
western blot analysis. In addition, authors of that study showed
that HOXB7 mRNA and protein expression increased after ATRA
intervention, suggesting that ATRA regulates the expression of
Hox genes affecting the hematopoietic cells.
In the present study, RT-PCR and western blot
analysis revealed that in the process of K562 cell proliferation,
HOXA5 mRNA and protein expression was detected. HOXA5 mRNA and
protein expression was elevated following ATRA intervention of K562
cells for 24, 48 and 72 h. With the intervention time prolonged,
HOXA5 mRNA and protein expression levels increased gradually. The
results indicate that HOXA5 mRNA and protein expression increased
in K562 cells following treatment with ATRA in a time-dependent
manner, which is similar to other reports on Hox gene
expression (23).
ATRA is an effective cell apoptosis-inducing agent
that promotes tumor cell apoptosis. Zhu et al (25) demonstrated that the rate of
apoptosis of the pancreatic cancer cell lines were significantly
higher than those in the control group following ATRA intervention
of the human SW1990, Patu8988, bxpc3 pancreatic cancer cell lines,
as detected by flow cytometry. Additionally, the apoptotic rate
increased with longer treatment time. The experimental study also
showed that the cell apoptotic rate increased following the
intervention with 10 µmol/l ATRA for the human K562 myeloid
leukemia cell line. With the increase in the time of intervention,
the apoptotic rate increased gradually, as indicated in the
above-mentioned results. Numerous chemotherapeutic agents are able
to interfere with the cell cycle by blocking it. Inui et al
(26) demonstrated that ATRA was
able to change the cell cycle and signal transduction pathway by
affecting the synthesis of DNA, and confine the cell cycle to a
certain period of stagnation through investigation. Zhou et
al (27) identified that A549
cell proliferation was inhibited, and the cell cycle was arrested
in G1/G0 phase following ATRA intervention detected by flow
cytometry. The results in the present study have shown that the
proportion of the cell cycle in the G0/G1 phase increased after
10.0 µmol/l ATRA intervention of K562 cells for 24, 48 and
72 h. The cell proportion in S stage was reduced. The cell cycle
was arrested in the G0/G1 phase and cell proliferation was
inhibited, similar to the abovementioned results.
In addition, data pertaining to HOXA5 mRNA and
protein expression, the cell apoptotic rate and cell cycle changes
were analyzed using the Spearman correlation analysis. Our results
that HOXA5 mRNA and protein expression and cell apoptosis were
positively associated. It also positively correlated with the
increased percentages of the cell cycle in G0/G1 phase, but
negatively correlated with the reduction percentage of S phase,
suggesting that ATRA inhibits K562 cell proliferation and induces
cell apoptosis through the upregulation of HOXA5 mRNA and protein
expression. The etiology and pathogenesis of childhood leukemia
have yet to be determined. Abnormally expressed HOX gene may
regulate the proliferation and differentiation of hematopoietic
stem cells.
References
|
1
|
Huang Z, Liu WJ, Guo QL and Liu CY:
Platelet parameter and platelet membrane glycoprotein in childhood
acute lymphoblastic leukemia. Genet Mol Res. 14:16074–16089. 2015.
View Article : Google Scholar : PubMed/NCBI
|
|
2
|
Xu Q and Liu W-J: Platelet changes in
acute leukemia. Cell Biochem Biophys. 67:1473–1479. 2013.
View Article : Google Scholar
|
|
3
|
Huang HP, Liu WJ, Guo QL and Ba YQ: Effect
of silencing HOXA5 gene expression using RNA interference on cell
cycle and apoptosis in Jurkat cells. Int J Mol Med. 37:669–678.
2016.PubMed/NCBI
|
|
4
|
Wessler JM: Leukemia in children: Getting
back to school-part 1. NASN Sch Nurse. 30:116–118. 2015. View Article : Google Scholar : PubMed/NCBI
|
|
5
|
Annesley CE and Brown P: Novel agents for
the treatment of childhood acute leukemia. Ther Adv Hematol.
6:61–79. 2015. View Article : Google Scholar : PubMed/NCBI
|
|
6
|
Lohi O, Kanerva J, Taskinen M,
Harila-Saari A, Rounioja S, Jahnukainen K, Lähteenmäki P and
Vettenranta K: Childhood leukemia. Duodecim. 129:939–946. 2013.
|
|
7
|
Liu WJ, Huang MX, Guo QL, Chen JH and Shi
H: Effect of human cytomegalovirus infection on the expression of
Hoxb2 and Hoxb4 genes in the developmental process of cord blood
erythroid progenitors. Mol Med Rep. 4:1307–1311. 2011.PubMed/NCBI
|
|
8
|
Delval S, Taminiau A, Lamy J, Lallemand C,
Gilles C, Noël A and Rezsohazy R: The Pbx interaction motif of
Hoxa1 is essential for its oncogenic activity. PLoS One.
6:e252472011. View Article : Google Scholar : PubMed/NCBI
|
|
9
|
Jiang N and Liu W: Role of HOX gene in
occurrence of leukemia and study progress. J Appl Clin Pediatr.
27:215–217. 2012.
|
|
10
|
Alharbi RA, Pettengell R, Pandha HS and
Morgan R: The role of HOX genes in normal hematopoiesis and acute
leukemia. Leukemia. 27:1000–1008. 2013. View Article : Google Scholar
|
|
11
|
Ding X, Yang Z, Zhou F, Wang F, Li X, Chen
C, Li X, Hu X, Xiang S and Zhang J: Transcription factor AP-2α
regulates acute myeloid leukemia cell proliferation by influencing
Hoxa gene expression. Int J Biochem Cell Biol. 45:1647–1656. 2013.
View Article : Google Scholar : PubMed/NCBI
|
|
12
|
Huang MX and Liu WJ: Effect of cluster a
in Hox gene on proliferation and differentiation of hematopoietic
stem/progenitor cells and its relation to leukemia - review. J Exp
Hematol. 17:835–839. 2009.
|
|
13
|
Kim SY, Hwang SH, Song EJ, Shin HJ, Jung
JS and Lee EY: Level of HOXA5 hypermethylation in acute myeloid
leukemia is associated with short-term outcome. Korean J Lab Med.
30:469–473. 2010. View Article : Google Scholar : PubMed/NCBI
|
|
14
|
Bach C, Buhl S, Mueller D, García-Cuéllar
MP, Maethner E and Slany RK: Leukemogenic transformation by HOXA
cluster genes. Blood. 115:2910–2918. 2010. View Article : Google Scholar : PubMed/NCBI
|
|
15
|
Estey E, Garcia-Manero G, Ferrajoli A,
Faderl S, Verstovsek S, Jones D and Kantarjian H: Use of all-trans
retinoic acid plus arsenic trioxide as an alternative to
chemotherapy in untreated acute promyelocytic leukemia. Blood.
107:3469–3473. 2006. View Article : Google Scholar
|
|
16
|
Liu WJ, Jiang NJ, Guo QL and Xu Q: ATRA
and As2O3 regulate differentiation of human hematopoietic stem
cells into granulocyte progenitor via alteration of HoxB8
expression. Eur Rev Med Pharmacol Sci. 19:1055–1062. 2015.
|
|
17
|
Chen S, Fang Y, Ma L, Liu S and Li X:
Realgar-induced apoptosis and differentiation in all-trans retinoic
acid (ATRA)-sensitive NB4 and ATRA-resistant
MR2 cells. Int J Oncol. 40:1089–1096. 2012.
|
|
18
|
Liu WJ, Guo QL, Chen HY, Zou Y and Huang
MX: Studies on HOXB4 expression during differentiation of human
cytomegalovirus-infected hematopoietic stem cells into lymphocyte
and erythrocyte progenitor cells. Cell Biochem Biophys. 63:133–141.
2012. View Article : Google Scholar
|
|
19
|
Chen JH, Liu WJ, Guo QL, Yang M, Jing QF
and Huang MX: Umbilical cord blood hematopoietic stem progenitor
cell proliferation in the process of human cytomegalovirus
infection on HOXA9 and HOXA10 gene expression. Chin J Pract
Pediatr. 25:607–610. 2010.
|
|
20
|
Kurscheid S, Bady P, Sciuscio D, Samarzija
I, Shay T, Vassallo I, Criekinge WV, Daniel RT, van den Bent MJ,
Marosi C, et al: Chromosome 7 gain and DNA hypermethylation at the
HOXA10 locus are associated with expression of a stem cell related
HOX-signature in glioblastoma. Genome Biol. 16:16–23. 2015.
View Article : Google Scholar : PubMed/NCBI
|
|
21
|
Musialik E, Bujko M, Kober P, Grygorowicz
MA, Libura M, Przestrzelska M, Juszczyński P, Borg K, Florek I,
Jakóbczyk M, et al: Promoter DNA methylation and expression levels
of HOXA4, HOXA5 and MEIS1 in acute myeloid leukemia. Mol Med Rep.
11:3948–3954. 2015.PubMed/NCBI
|
|
22
|
Jiang Q and Liu WJ: Relationship between
the HOX gene family and the acute myeloid leukemia-review. Zhongguo
Shi Yan Xue Ye Xue Za Zhi. 21:1340–1344. 2013.In Chinese.
PubMed/NCBI
|
|
23
|
Guo WW and Liu WJ: Expression of homeobox
A9 in myeloid leukemia cell line HL-60 and effect of drugs on its
expression. J Exp Hematol. 20:300–304. 2012.In Chinese.
|
|
24
|
Zhang JX and Liu WJ: Expression and
intervention of B7 in the development process of cord blood
progenitor cells of myeloid progenitor cells. Practical J Pediatr.
26:1181–1184. 2011.
|
|
25
|
Zhu Y, Xia L, Zhang Y, Zhang X and Yuan Y:
All trans retinoic acid on a variety of pancreatic cancer cell
induced apoptosis. Chin J Pancreatol. 7:24–27. 2007.
|
|
26
|
Inui N, Sasaki S, Suda T, Chida K and
Nakamura H: The loss of retinoic acid receptor alpha, beta and
alcohol dehydrogenase3 expression in non-small cell lung cancer.
Respirology. 8:302–309. 2003. View Article : Google Scholar : PubMed/NCBI
|
|
27
|
Zhou RJ, Liaow EG, Yang ZZ, Min JX and
Xiao YB: Effects and mechanisms of ATRA on proliferation, cell
cycle of lung carcinoma cell line A549. Di 3 Jun Yi Da Xue Xue Bao.
29:1399–1401. 2007.In Chinese.
|