Introduction
The process of hematopoietic stem cells (HSCs) to
red blood cells is regulated by external factors such as
interleukin-3 (IL-3), stem sell factor (SCF), granulocyte
macrophage colony-stimulating factor (GM-CSF) and erythropoietin
(EPO) (1). Other factors such as
intracellular factors Myc, Myb, GATA-1, GATA-2, hypoxia-inducible
factor-1α (HIF-1α) and microRNAs (miRNAs) may play a role in the
process (2). miRNAs comprise a
class of small non-coding RNAs that regulate gene expression by
degradation of mRNAs or translational repression. The biosynthesis
of miRNAs is a multistep process (3). They are typically transcribed by RNA
polymerase II (Pol II) and commonly arise from the introns of
coding genes or from intergenic long non-coding RNAs known as
primary miRNAs (pri-miRNAs). Pri-miRNAs contain one or more miRNAs
within hairpins. These hairpins are usually cleaved from the
pri-miRNA transcript in the nucleus by the microprocessor complex,
which consists of the RNA-binding protein (RBP) DGCR8 and the RNA
endonuclease Drosha. The resulting pre-miRNA hairpins are
transported to the cytoplasm where they are further processed into
approximately 21-nucleotide long double-stranded RNAs (dsRNAs) by
the endonuclease Dicer. Mature single-stranded miRNAs are
transferred back into nucleus to form nucleoprotein complex
formation-induced silencing complex (miRNP/RNA-induced silencing
complex, miRNP/RISC). These structures can bind to the 3′UTR region
of target mRNAs and inhibit the translation or initiate the
degradation process of target mRNA (4). The degree of pairing between miRNA
and target mRNA determines the action mode of the
miRNA/RISC-inhibiting target mRNA (5,6).
A wide variety of transcription factors are involved
in the establishment of hematopoietic cell lineages. GATA
transcription factors are characterized by a conserved dual zinc
finger domain. Transcription factor GATA-2 is essential for the
early stages of hematopoiesis. Primitive and definitive
hematopoiesis is abrogated when the GATA-2 gene is deleted,
and it appears to play a role in the proliferation of the early
precursors rather than in their differentiation (7,8).
GATA-2 is abundantly expressed during embryogenesis and plays an
important role in the specification of the hematopoietic lineage
during embryogenesis (9).
Haematopoietic transcription factor GATA-1 is the founding member
of the GATA family transcription factors, which is expressed in
primitive and definitive erythroid cells, megakaryocytes,
eosinophils, mast cells and the Sertoli cells of the testis
(10). GATA-1 is essential for
normal erythropoiesis (11,12)
and is directly involved in cell survival. It activates
transcription of the erythropoietin receptor (EPOR) (13). EPO signaling is essential for the
survival of erythroid progenitors (14). Transcription nuclear
factor-erythroid 2 (NF-E2) is a target for RUNX1 which is essential
for the regulation of erythroid, megakaryocytic maturation and
differentiation as well as globin expression (15). RUNX1 and NF-E2 upregulation is not
specific for MPNs, but is also seen in polycythemic disorders with
enhanced HIF signaling (16). The
detected miRNAs are not less consistent because different
laboratories selected distinct cell sources. However, miR-223,
miR-144, miR-451, miR-17, miR-210 and miR-23R are closely related
to the regulation of erythropoiesis and play important roles in
erythroid-directed differentiation, proliferation and maturation of
red blood cells. Those miRNAs act on the target genes downstream of
erythropoiesis-related and regulated development and biological
function in red blood cells (2).
There are many studies on miRNA regulation during erythroid
differentiation. The erythroid-specific transcription factors, such
as GATA-1, LMO2, EKLF, and c-kit as miRNA downstream target genes
or target proteins coordinate to regulate erythroid
differentiation. The GATA-1 and NF-E2 transcription factors also
act as upstream factors regulating miRNA199b-5p, miRNA199b-5p-27a
and miRNA-24 (17,18).
Previous studies focused on classic gene expression
and erythropoiesis regulation. However, to the best of our
knowledge, studies on the association between miRNA and
erythropoiesis are relatively rare. Even fewer studies are
available concerning hypoxic condition. In the present study, we
treated K562 cells with HIF-1α lentiviral overexpression vector to
identify the mechanism of miRNAs and erythroid transcription
factors in K562 cells under hypoxia to expand the theory of
erythropoiesis regulation.
Materials and methods
Cell lines and cell culture
The K562 cells lines (frozen by the Qinghai
Provincial People's Hospital of Hematology Research) were cultured
in RMPI-1640 complete medium (Gibco, Grand Island, NY, USA) with
10% fetal bovine serum (FBS) (Sijiqing, Hangzhou, China) and
penicillin/streptomycin (Ybiotech, Shanghai, China). The cells were
maintained at 37°C with 5% CO2 and the medium was
changed every 2–3 days. The cells were divided into 2–3 flasks and
cultured sequentially. The cells in the logarithmic growth phase
were used for subsequent experiments.
Cell transfection
For transfection with plasmids, logarithmic growth
phase K562 (105) cells were introduced into 12-well
culture plates (final volume of 1 ml) at 60% confluency and were
incubated for 8 h in an incubator (Thermo Fisher Scientific,
Waltham, MA, USA) with 5% CO2 prior to transfection with
HIF-1α knockout or HIF-1α lentiviral overexpression vector (MOI
10). The transfection reagent lentivirus (Cyanogen, Inc., Seattle,
WA, USA) was used according to the manufacturer's instructions. The
K562 cells were divided into 3 groups: i) control group with
lentiviral negative control; ii) interference group with HIF-1α
knockout lentivirus; and iii) overexpression group with HIF-1α
lentiviral overexpression vector. Polybrene (Cyanogen, Inc.) was
added to the groups (final concentration of 5 µg/ml). Fresh
medium was added (final volume 2 ml) after 8 h incubation with 5%
CO2. After 72 h, the cells were observed using an
inverted fluorescence microscope (Olympus, Tokyo, Japan) and then
transferred to 6-well plates. Puromycin (final concentration 1
µg/ml) (Solarbio, Beijing, China) was added after 72 h and
6-well plates were screened for positive cells (19). For hypoxic exposure, the positively
transfected cells were placed in an incubator with 5%
CO2. The incubator chamber was tightly sealed and
thoroughly flushed with 1% O2/5% CO2/balance
nitrogen and set at 37 °C. The cells were harvested after 72 h. All
the experiments were repeated three times.
RNA extraction, reverse transcription and
quantitative PCR
Total RNA was extracted using TRIzol reagent
(Ambion, Carlsbad, CA, USA) and was quantified using a NanoDrop
2000 spectrophotometer (Thermo Fisher Scientific, Waltham, MA,
USA). The first strand of cDNA was produced using an M-MLV reverse
transcriptase (Invitrogen, Carlsbad, CA, USA) according to the
manufacturer's instructions. mRNA was quantified by qPCR using
TransScript First-Strand cDNA Synthesis SuperMix (TransGen Biotech,
Beijing, China) with the ABI 7500 Real-Time PCR detection system
(Applied Biosystems Life Technologies, Foster City, CA, USA). PCR
reactions were performed in triplex tubes, and GAPDH was used as an
endogenous control to standardize the amount of the sample mRNA.
Using 20 µl of the reaction system, the reaction condition
was: Two-Step PCR amplification, pre-denaturing conditions were
95°C for 30 sec; 95°C reaction for 5 sec, 60°C annealing for 31 sec
with a total of 40 cycles. The quantification data were analyzed
with ABI 7500 software (Applied Biosystems Life Technologies)
(20). The primers were
synthesized according to the designed sequence by Shenggong
(Shanghai, China) and were used for quantitative PCR: HIF-1α
forward, 5′-ATACATGGTACCCACGAAGTGTTCCTTTG-3′ and reverse,
5′-ATACATCTCGAGAAAGAGACAAGTCCA-3′; GATA-1 forward,
5′-ATCACAAGATGAATGGGCAGAA-3′ and reverse,
5′-CACAGTGTCGTGGTGGTCGT-3′; GATA-2 forward, 5′
CATCAAGCCCAAGCGAAGA-3′ and reverse, 5′-CACAGGCGTTGCAGACAGG-3′;
NF-E2 forward, 5′-TGGGACCATCTTCCTTGTG-3′ and reverse
5′-TTGCCATTGTCATCCTCTTCT-3′; GAPDH forward,
5′-ATCAAGAAGGTGGTGAAGCA-3′ and reverse,
5′-CAAAGGTGGAGGAGTGGGT-3′.
miRNA reverse transcription and PCR
Total RNA was extracted using the TRIzol reagent.
For miRNA reverse a TaqMan® MicroRNA Reverse
Transcription kit (Applied Biosystems Life Technologies) was used.
The RT primer was produced by Applied Biosystems Life Technologies
and the corresponding miRNA.
Reaction system was produced using 7 µl
master mix I: 100 mM dNTPs with dTTP 0.15 µl,
MultiScribe™ Reverse Transciptase 50 U/µl 1.00
µl, 10X reverse transciptase buffer 1.5 µl, RNase
inhibitor, 20 U/µl 0.19 µl, nuclease-free water 4.16
µl, 3 µl of 5X RT primer, and 5 µl RNA
sample.
Reverse conditions were: 16°C for 30 min, 42°C for
30 min, 85°C for 5 min. The quantitative PCR reaction system (20
µl) was produced using 1.00 µl TaqMan®
Small Assay (20X), product from 1.33 µl RT reaction, 10
µl TaqMan Universal PCR master mix II (2X), and 7.67
µl nuclease-free water. The reaction conditions were: Option
AmpErase UNG activity 50°C for 2 min, enzyme activation 95°C for 10
min, 40 cycles, denaturation at 95°C for 15 sec,
annealing/extension at 60°C for 60 sec.
Protein extraction and western blot
assay
The cells were collected and washed twice with cold
PBS. Cells (1×10⁶) were added to 1 ml of RIPA lysis
buffer (including 10 µl of 10 mg/ml PMSF) (Solarbio). The
cell samples were transferred to an Eppendorf tube (Axygen, LA,
USA) following incubation on ice for 30 min. Cell lysate
supernatant was collected, divided and stored at −20°C.
Subsequently, the cells were centrifuged at 2,000 × g for 15 min.
Total cell extracts were quantified using the BCA Protein Assay kit
(Vigorous, Beijing, China) within Synergy 4 (BioTek, Winooski, VT,
USA). Electrophoresis sample buffer (4X) (volume = 1/3 of lysates
volume) was added to the same quality of the protein lysates
(volume × protein concentration) and placed in a hot water bath for
5 min. Cell extracts were fractionated by electrophoresis on 10%
SDS polyacrylamide gels and proteins were transferred to
polyvinylidene difluoride membranes (Millipore Corp., Billerica,
MA, USA). The membranes were blocked with 5% non-fat dry milk
solution for 2 h and incubated with one of the following monoclonal
antibodies: anti-HIF-1α (ab75186), anti-GATA-1 (ab76121),
anti-GATA-2 (ab109241) and anti-NF-E2 (ab140598) overnight. The
antibodies were rabbit mAb to human with a dilution of 1:1000,
1:3000, 1:1000 and 1:1000, respectively. Peroxidase-conjugated
AffiniPure goat anti-rabbit IgG (Solarbio) was subsequently added.
After washing with TBS-T buffer three times, the membrane was
treated with Immobilon™ Western Chemiluminescent HRP Substrate
(Beyotime Institute of Biotechnology, Shanghai, China) and exposed
to a gel imaging system camera with Image Lab™ software version 2.0
(Bio-Rad, Berkeley, CA, USA).
Statistical analyses
Statistical analyses were performed using SPSS 17.0
software (SPSS Inc., Chicago, IL, USA). Data are presented as the
means ± standard deviation (SD) and were analyzed using one-way
ANOVA in three groups and Student's t-test (two-tailed). P<0.05
was considered to indicate statistically significant results.
Results
Transfection efficiency of recombinant
lentivirus to K562 cells
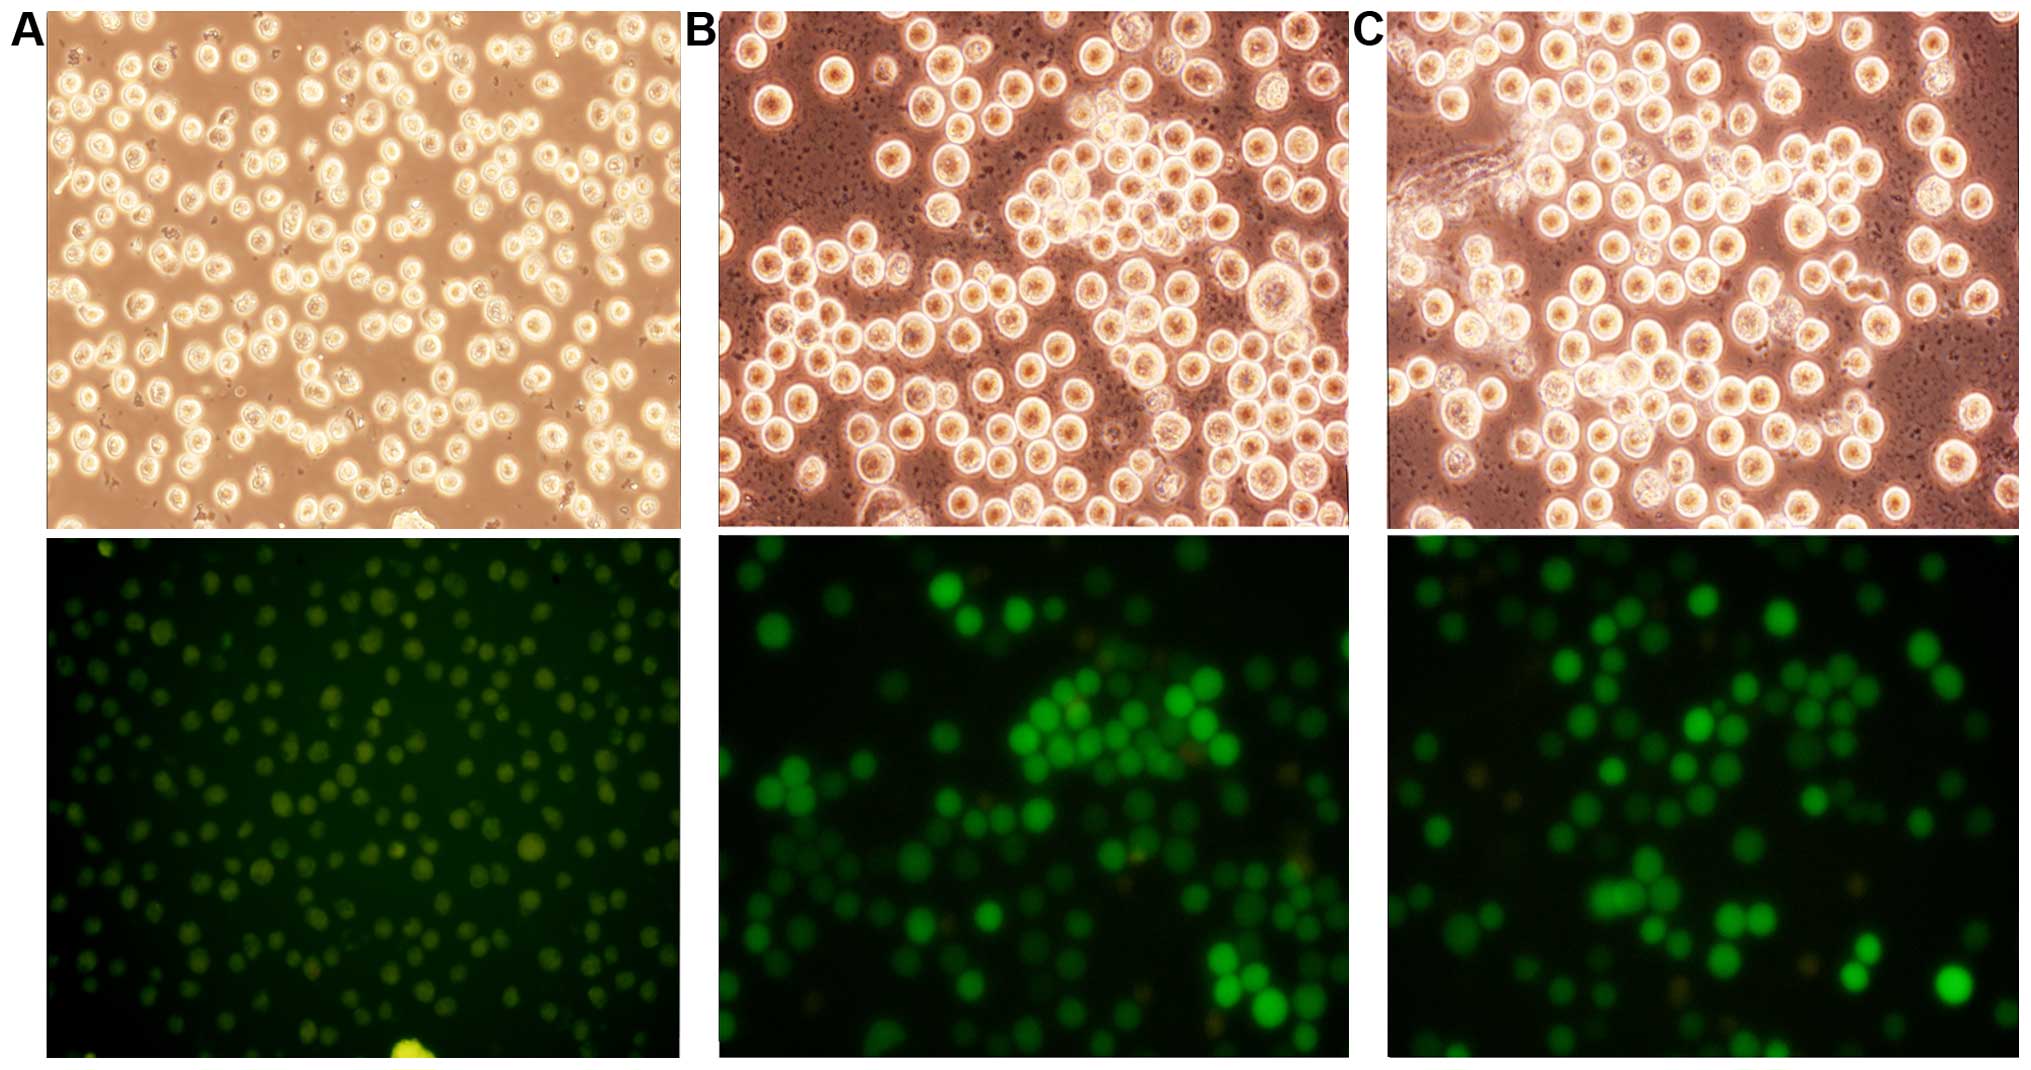
As shown in Fig. 1,
the optimal MOI was 10 and >90% of the cells were
transfected.
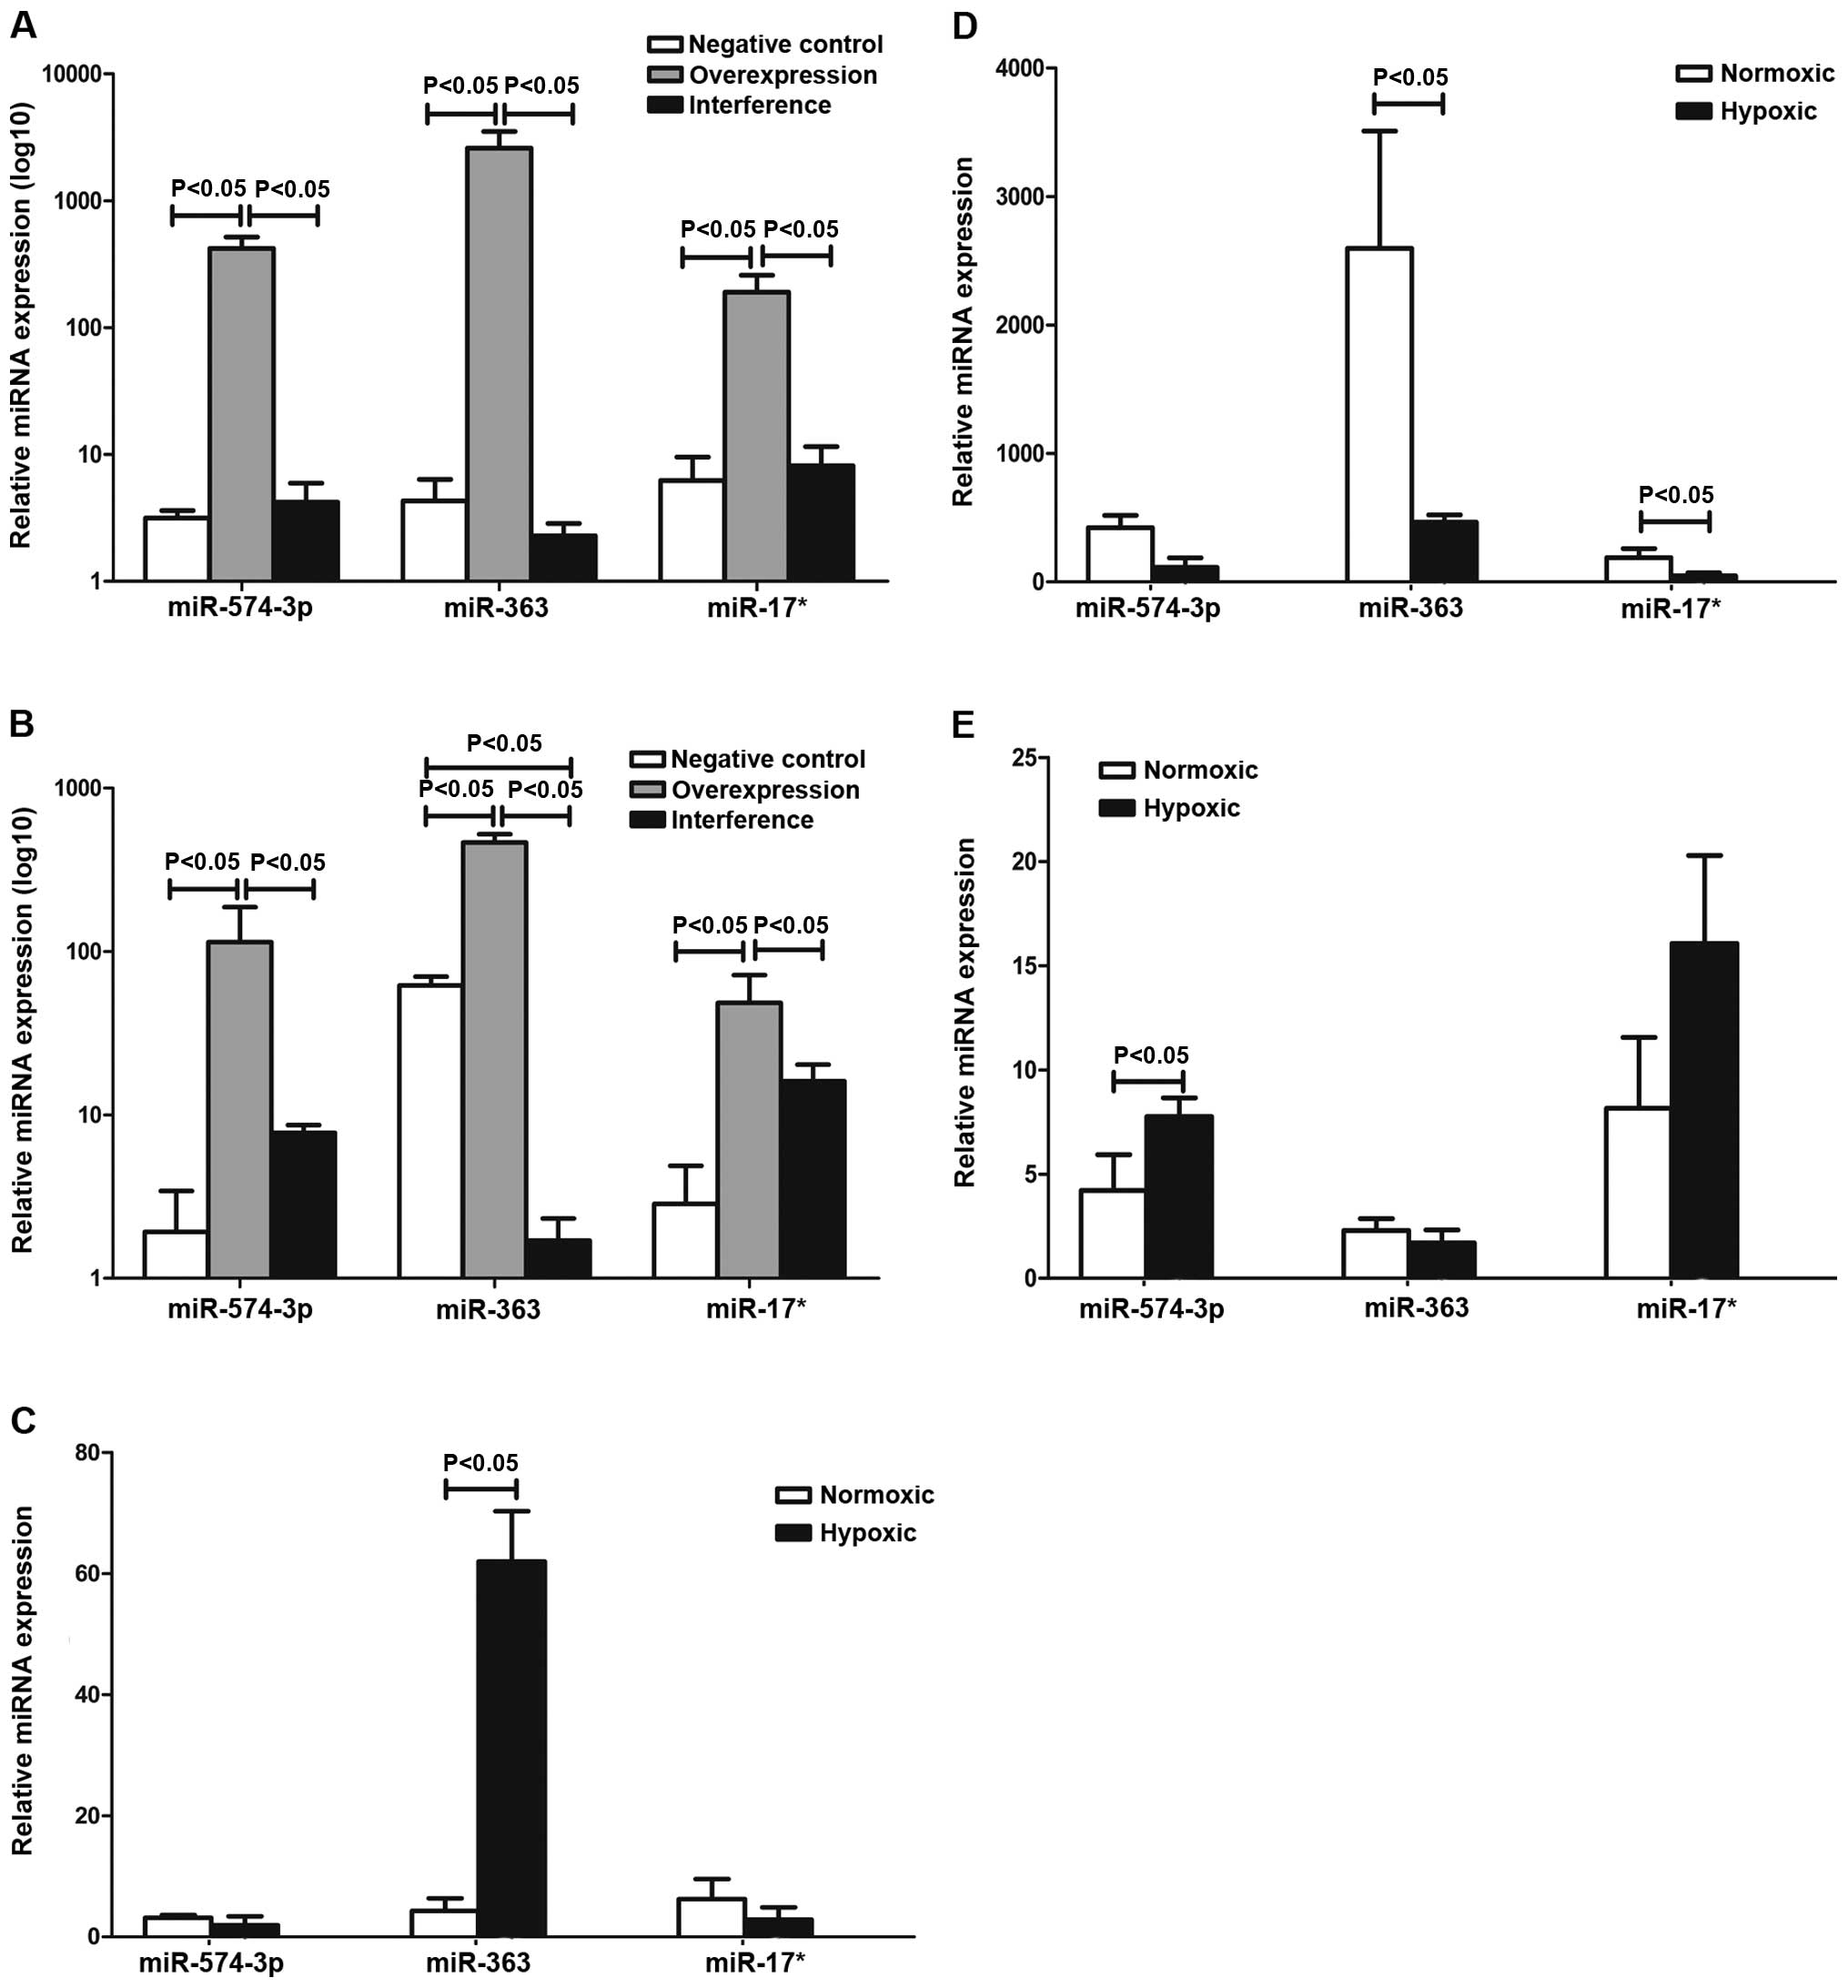
Erythroid miRNA levels in the negative,
overexpression and interference groups
The results in Table
I and Fig. 2 show that the
expression of miR-17*, miR-363 and miR-574-5p of the negative,
overexpression and interference groups were determined by qPCR. The
results suggested that miR-363 was involved in the regulation of
hematopoiesis via the HIF-1α pathway in K562 cells under hypoxia.
miR-17* and miR-574-5p were not entirely dependent on HIF-1α.
 | Table IErythroid miRNA levels in the
negative control, overexpression and interference groups (means ±
SD, n=9). |
Table I
Erythroid miRNA levels in the
negative control, overexpression and interference groups (means ±
SD, n=9).
| Group | Normoxic
| Hypoxic
|
|---|
| miR-574-3p | miR-363 | miR-17a | miR-574-3p | miR-363 | miR-17a |
|---|
| Negative | 3.16±0.46 | 4.31±2.06 | 6.25±3.30 | 1.92±1.50 | 62.00±8.29c | 2.85±2.03 |
| Overexpression |
422.27±95.42a |
2597.27±912.72a |
190.32±68.96a |
114.18±72.64a,c |
465.43±57.29a,c | 48.45±23.20a,c |
| Interference | 4.21±1.73b | 2.29±0.57b | 8.16±3.40b | 7.76±0.90b,c | 1.70±0.62b,b | 16.07±4.22b |
| F | 84.480 | 32.308 | 28.071 | 9.077 | 227.683 | 11.792 |
| P-value | 0.000001 | 0.000078 | 0.000135 | 0.006964 | 0.000001 | 0.003059 |
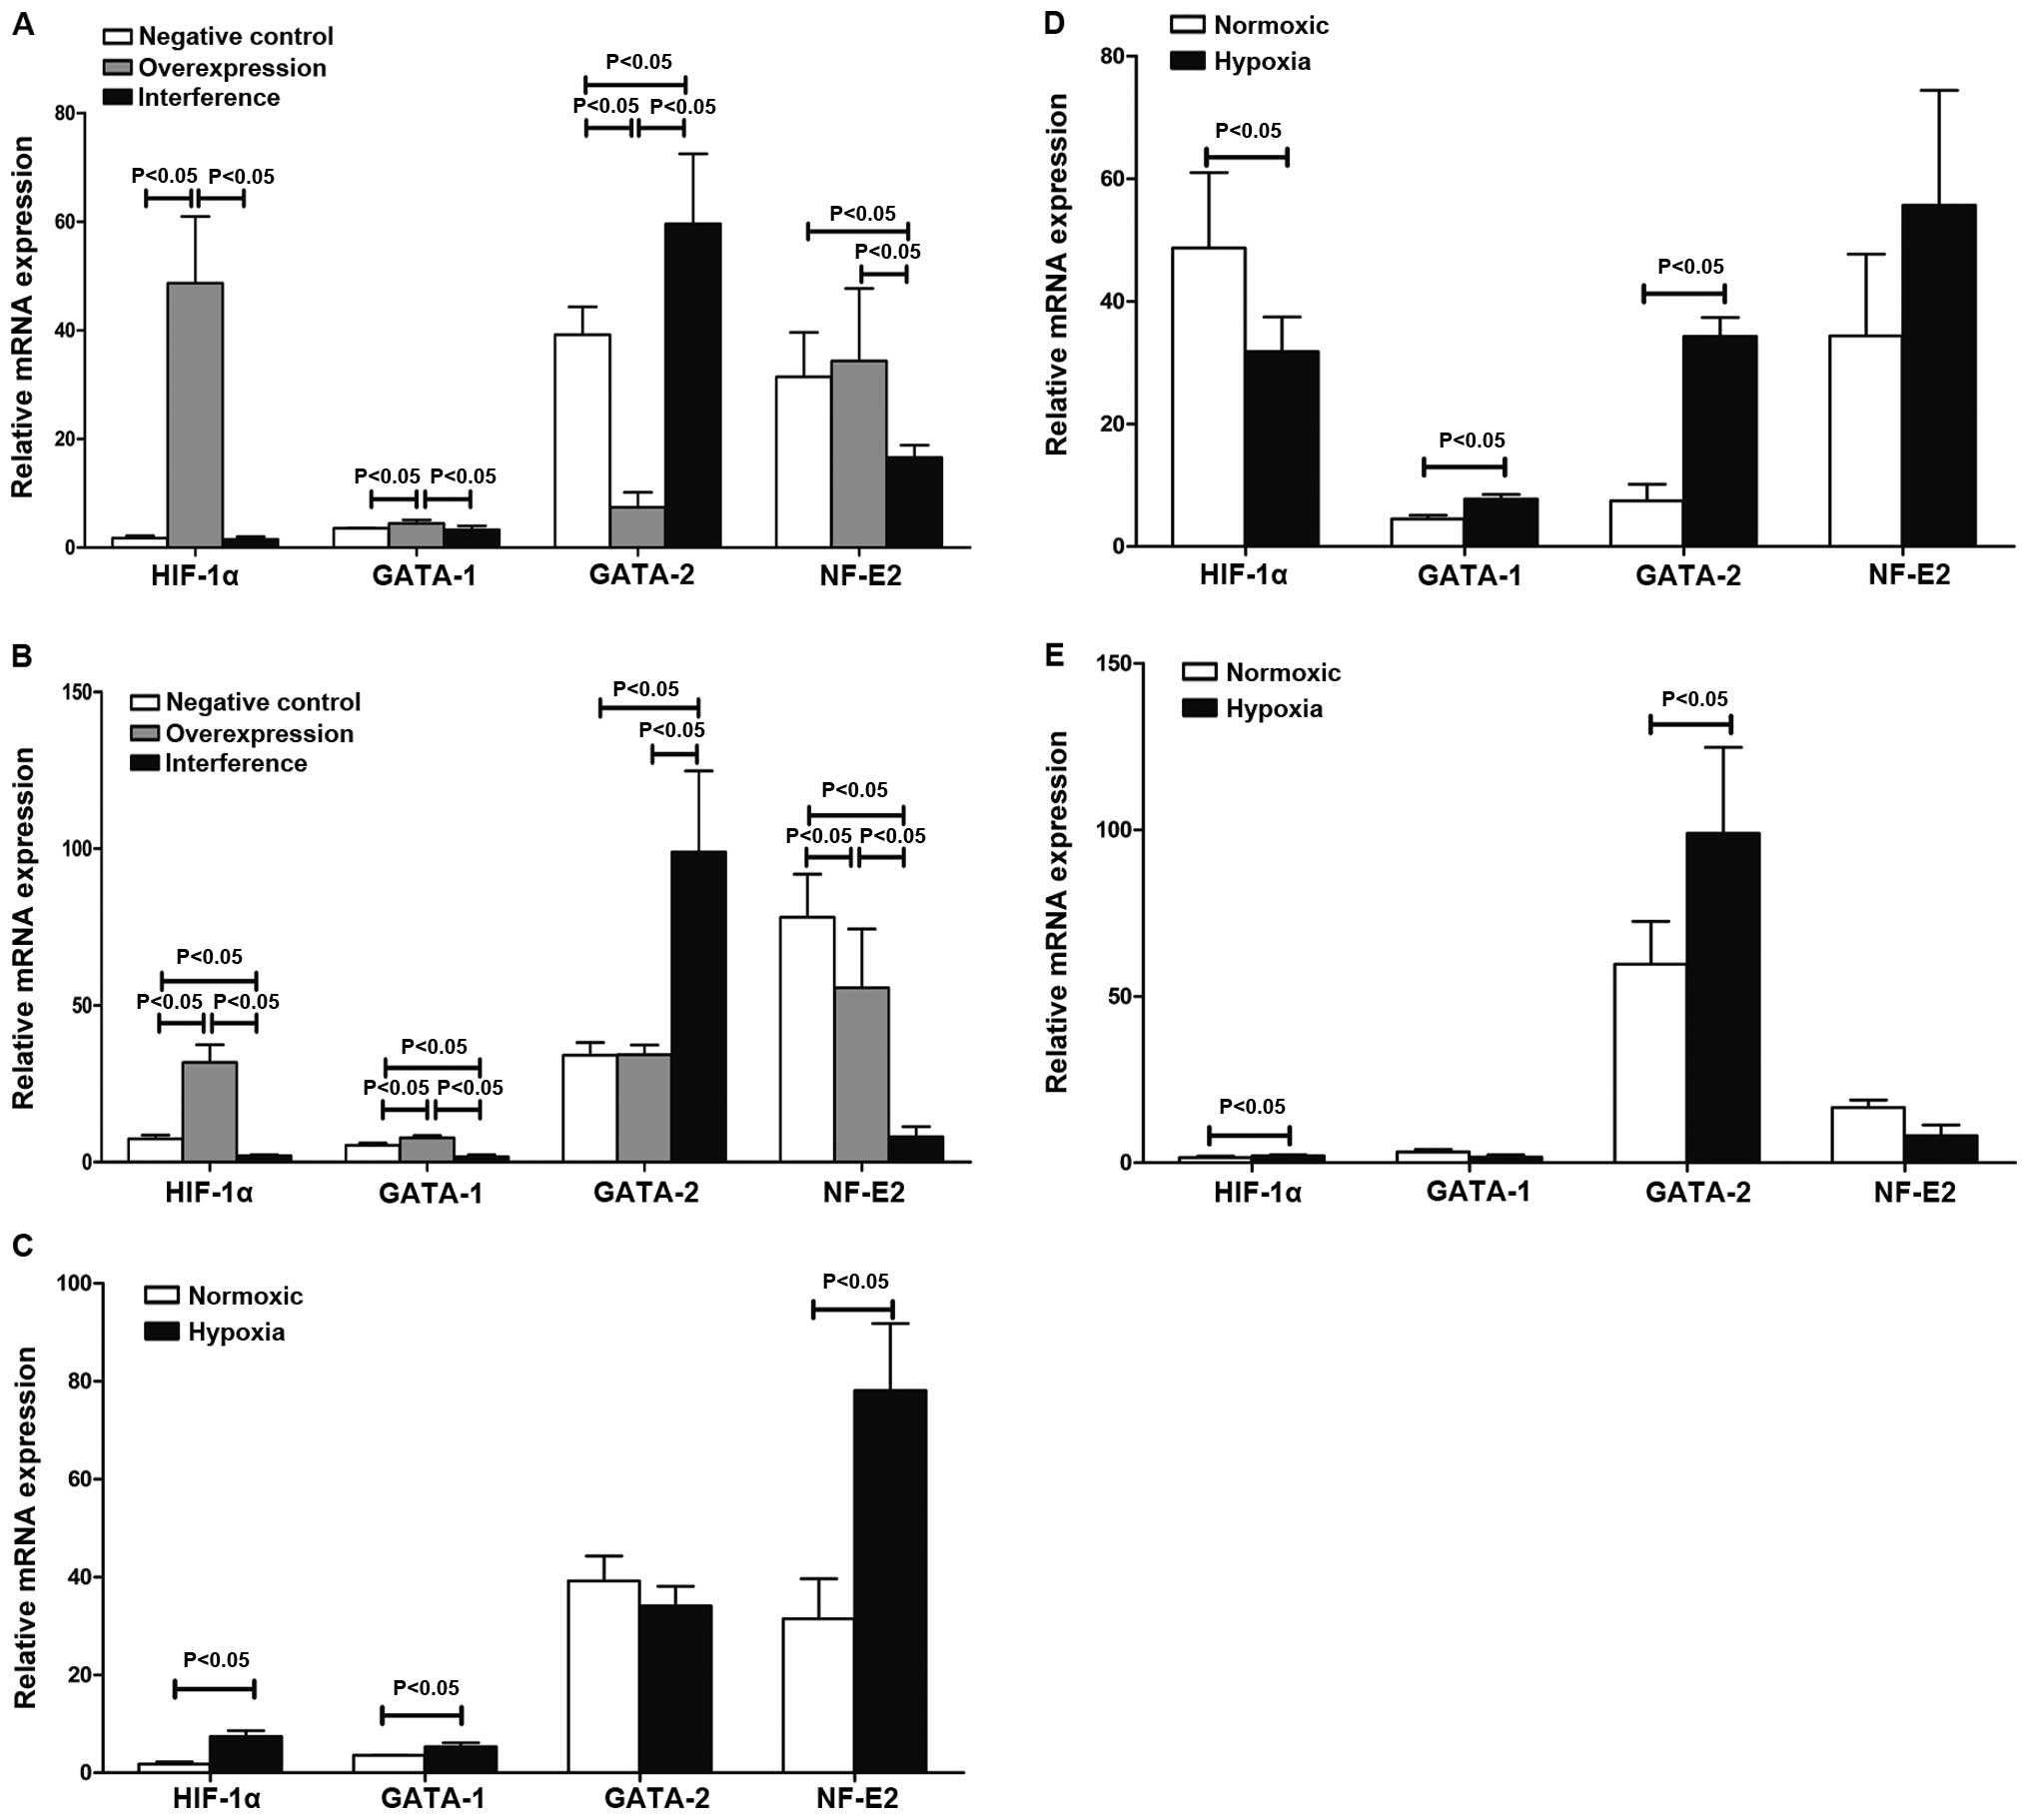
Erythroid transcription factors mRNA and
protein expression levels
The levels of HIF-1α, GATA-1, GATA-2 and NF-E2 mRNA
in the negative, overexpression and interference groups were
determined using quantitative PCR. The results in Table II and Fig. 3 show that HIF-1α mediated
GATA-1/GATA-2 induction involved in the regulation of hematopoiesis
in K562 cells under hypoxia. HIF-1α promoted the expression of
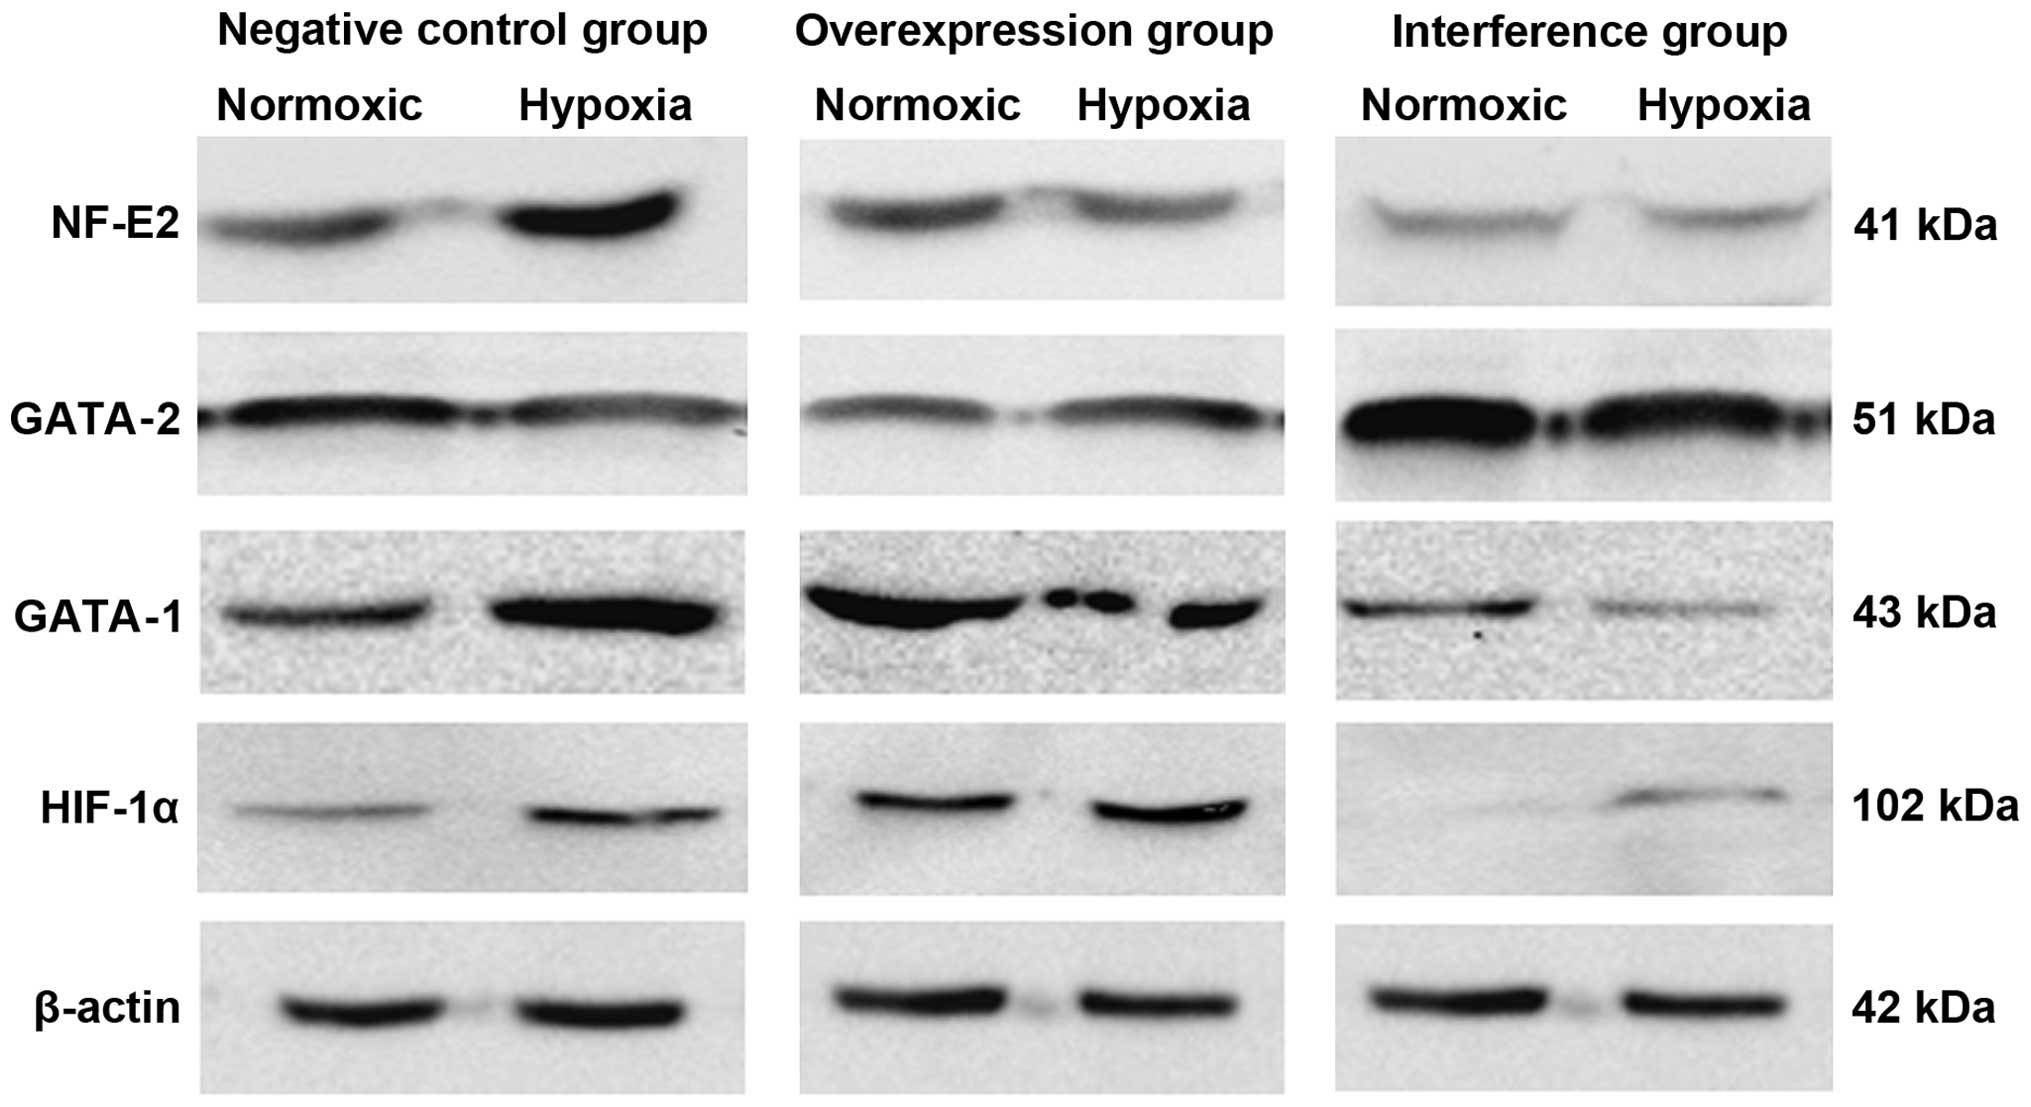
NF-E2 mRNA involvement in hematopoietic regulation. The western
blot results suggested that the expression of GATA-1, GATA-2 and
NF-E2 proteins was substantially consistent with changes in their
respective mRNAs (Fig. 4).
| Table IIErythroid transcription factor miRNA
levels in the negative control, overexpression and interference
groups (means ± SD, n=9). |
Table II
Erythroid transcription factor miRNA
levels in the negative control, overexpression and interference
groups (means ± SD, n=9).
| Group | Normoxic
| Hypoxic
|
|---|
| HIF-1α | GATA-1 | GATA-2 | NF-E2 | HIF-1α | GATA-1 | GATA-2 | NF-E2 |
|---|
| Negative | 1.77±0.43 | 3.57±0.05 | 39.20±5.10 | 31.44±8.20 | 7.40±1.21c | 5.33±0.76c | 34.11±4.01 | 78.13±13.68c |
| Overexpression | 48.69±12.28a | 4.48±0.61a | 7.45±2.72a | 34.37±13.33 | 31.79±5.65ac | 7.73±0.76a,c | 34.28±3.05c | 55.62±18.74a |
| Interference | 1.52±0.48b | 3.29±0.73b | 59.60±12.90a,b | 16.56±2.29a,b | 2.06±0.28 a–c | 1.72±0.61a,b | 98.91±25.84a–c | 8.09±3.25a,b |
| F | 58.569 | 5.023 | 41.498 | 4.369 | 90.048 | 71.638 | 24.160 | 27.960 |
| P-value | 0.000007 | 0.037090 | 0.000029 | 0.047209 | 0.000001 | 0.000003 | 0.000241 | 0.000138 |
Discussion
Hematopoietic differentiation is a process through
which HSCs differentiate into progenitor cells of each chain and
then divide into a variety of different forms of mature blood
cells. Hematopoietic differentiation is an extremely complex
regulatory process with regard to the regulation of epigenetic and
transcriptional and post-transcriptional, translation and
post-translational levels (21).
Erythroid differentiation is an important part of hematopoietic
differentiation and an important way through which the body can
produce mature red blood cells. It is regulated by specific
transcription factors that have strong spatial and temporal
specificity. For example, the transcription factor GATA-2 has a
high expression level in erythroid precursor cells to maintain the
characteristics of stem cells in erythroid differentiation. GATA-1
expression gradual enhancement promotes the erythroid progenitor
cells into mature red blood cells (22–26).
By the end of differentiation, the involvement of EKLF and NF-E2
transcription factors was detected (12). Previous findings also showed that
miRNA was a universal mechanism of post-transcriptional gene
regulation that controlled precise gene expression (27,28).
miRNA was involved in the whole process of erythropoiesis
regulation, including the differentiation of erythroid lineage,
appreciation of erythroid progenitor cells, terminal
differentiation and denucleation of red blood cells (29–35).
Some researchers obtained a more comprehensive interaction atlas
between human CD34+ HSC miRNA and mRNA by analyzing
miRNA expression and binding of the prediction miRNA target gene
and corresponding mRNA expression profiles of CD34 HSC in human
peripheral blood and bone marrow, respectively (36). Other studies suggest the
integration of the miRNA-mRNA analysis (37).
In the present study, K562 cells were transfected
with lentiviral-overexpressed and interference HIF-1α gene.
Expression of miR-17*, miR-363 and miR-574-5p was determined by
quantitative PCR. The results suggested that miR-17*, miR-363 and
miR-574-5p expression levels in the overexpression group were
higher than those in the negative control and the interference
groups under normoxia and hypoxia. miR-363 expression in the
interference group was lower than that in the negative control
group in hypoxic conditions. The results of the present study
showed that miR-363 was involved in the regulation of hematopoiesis
via the HIF-1α pathway in K562 cells under hypoxia. We also showed
that hsa-miR-17* and hsa-miR-574-5p were not entirely dependent on
HIF-1α. Other factors may be involved in the regulation of the
abovementioned three miRNAs under hypoxia.
Quantitative PCR and western blot results showed
that GATA-1, GATA-2 and NF-E2 transcription level variations
correlated well with the expression levels of their respective
proteins. Our results showed that GATA-1 and NF-E2 were involved in
hematopoiesis regulation via HIF-1α.
On erythroid differentiation regulation in hypoxia,
erythroid transcription factor and miRNA have also made great
progress. EPO-EPOR signaling and GATA-1 are necessary to generate
the normal erythroid cells and regulate the progress of erythroid
cell appreciation, differentiation and maturation (38–40).
Under hypoxic conditions, the overexpression of GATA-1 promoted the
expression of erythroid surface markers CD71 and CD235a by
increasing HIF-1α in umbilical cord blood CD34+ and K562
cells (41). Results from prior
studies revealed that hematopoietic GATA-1 as an EPOR promoter was
involved in the transcriptional regulation of various genes in
erythrocytes (13,17). Previous experiments showed that
GATA-1 regulated erythroid-related globulin, heme biosynthetic
enzymes, membrane protein and erythroid transcription factor genes
(42,43). The experimental data suggested that
GATA-1 and hsa-miR-363 were regulated by HIF-1α under hypoxia.
Nevertheless, the association between GATA-1 and hsa-miR-363 is
unclear and in need of further clarification.
Based on the HIF-1α/GATA-l/miR-363/GATA-2 regulatory
pathways, important gene expression associated with erythroid
differentiation is regulated by the GATA-1 transcription factor and
the miRNA of HIF-1α regulation. The regulatory networks of
hematopoietic differentiation are more dynamic and complex due to
miRNA involvement. There are many studies on the differentiation of
GATA-l/GATA-2 regulation through the GATA-1/2 switch (22,23,44).
Regulation of erythroid transcription factor and miRNA under
hypoxia condition have been the subject of at least one study
(45). It was shown that miRNA-17
enhanced expansion and promoted erythroid differentiation via
HIF-1α in cord blood CD34+ cells (45). Under hypoxic conditions, miRNA-210
overexpression increased the expression of globin genes and
promoted the maturation of erythroids in K562 cells and erythroid
progenitor cells in thalassemia. The opposite occurred after the
expression of miRNA-210 was suppressed (46,47).
Our results suggest that GATAl and miR-363 were involved in the
regulation of hematopoiesis via the HIF-1α pathway in K562 cells
under hypoxic condition. We found that hsa-miR-17* and
hsa-miR-574-5p were not entirely dependent on HIF-1α and there may
be more complex regulatory mechanisms involved under hypoxia.
Acknowledgments
The present study was funded by Regional Projects of
the National Science Foundation (project code no. 81360084), the
Project of 2014 Qinghai Talent 'Little Heights' and the National
Key Disciplines (Hematology) in Qinghai Provincial People's
Hospital.
References
|
1
|
Hattangadi SM, Wong P, Zhang L, et al:
From stem cell to red cell: regulation of erythropoiesis at
multiple levels by multiple proteins, RNAs, and chromatin
modifications. Blood. 118:6258–6268. 2011. View Article : Google Scholar : PubMed/NCBI
|
|
2
|
Undi RB, Kandi R and Gutti RK: MicroRNAs
as haematopoiesis regulators. Adv Hematol. 2013:695–754. 2013.
View Article : Google Scholar
|
|
3
|
Ha M and Kim VN: Regulation of microRNA
biogenesis. Nat Rev Mol Cell Biol. 15:509–524. 2014. View Article : Google Scholar : PubMed/NCBI
|
|
4
|
Zhao S and Liu M: The progress of microRNA
mechanism and research. China Science C Series. 39:109–113.
2009.
|
|
5
|
Hashimoto K, Otero M, Imagawa K, de Andrés
MC, Coico JM, Roach HI, Oreffo RO, Marcu KB and Goldring MB:
Regulated transcription of human matrix metalloproteinase 13
(MMP13) and interleukin-1β (IL1B) genes in chondrocytes depends on
methylation of specific proximal promoter CpG sites. J Biol Chem.
288:10061–10072. 2013. View Article : Google Scholar : PubMed/NCBI
|
|
6
|
Cai L: Epigenetic frontier (M) Beijing.
Tsinghua University Press. 2012. 133–142. 2012.
|
|
7
|
Tsai FY, Keller G, Kuo FC, Weiss M, Chen
J, Rosenblatt M, Alt FW and Orkin SH: An early haematopoietic
defect in mice lacking the transcription factor GATA-2. Nature.
371:221–226. 1994. View
Article : Google Scholar : PubMed/NCBI
|
|
8
|
Tsai FY and Orkin SH: Transcription factor
GATA-2 is required for proliferation/survival of early
hematopoietic cells and mast cell formation, but not for erythroid
and myeloid terminal differentiation. Blood. 89:3636–3643.
1997.PubMed/NCBI
|
|
9
|
Vicente C, Conchillo A, García-Sánchez MA
and Odero MD: The role of the GATA2 transcription factor in normal
and malignant hematopoiesis. Crit Rev Oncol Hematol. 82:1–17. 2012.
View Article : Google Scholar
|
|
10
|
Ferreira R, Ohneda K, Yamamoto M and
Philipsen S: GATA1 function, a paradigm for transcription factors
in hematopoiesis. Mol Cell Biol. 25:1215–1227. 2005. View Article : Google Scholar : PubMed/NCBI
|
|
11
|
Pevny L, Simon MC, Robertson E, Klein WH,
Tsai SF, D'Agati V, Orkin SH and Costantini F: Erythroid
differentiation in chimaeric mice blocked by a targeted mutation in
the gene for transcription factor GATA-1. Nature. 349:257–260.
1991. View
Article : Google Scholar : PubMed/NCBI
|
|
12
|
Pevny L, Lin CS, D'Agati V, Simon MC,
Orkin SH and Costantini F: Development of hematopoietic cells
lacking transcription factor GATA-1. Development. 121:163–172.
1995.PubMed/NCBI
|
|
13
|
Zon LI, Youssoufian H, Mather C, Lodish HF
and Orkin SH: Activation of the erythropoietin receptor promoter by
transcription factor GATA-1. Proc Natl Acad Sci USA.
88:10638–10641. 1991. View Article : Google Scholar : PubMed/NCBI
|
|
14
|
Lacombe C and Mayeux P: The molecular
biology of erythropoietin. Nephrol Dial Transplant. 14(Suppl 2):
22–28. 1999. View Article : Google Scholar : PubMed/NCBI
|
|
15
|
Zhou Z, Li X, Deng C, Ney PA, Huang S and
Bungert J: USF and NF-E2 cooperate to regulate the recruitment and
activity of RNA polymerase II in the beta-globin gene locus. J Biol
Chem. 285:15894–15905. 2010. View Article : Google Scholar : PubMed/NCBI
|
|
16
|
Kapralova K, Lanikova L, Lorenzo F, Song
J, Horvathova M, Divoky V and Prchal JT: RUNX1 and NF-E2
upregulation is not specific for MPNs, but is seen in polycythemic
disorders with augmented HIF signaling. Blood. 123:391–394. 2014.
View Article : Google Scholar :
|
|
17
|
Li Y, Bai H, Zhang Z, Li W, Dong L, Wei X,
Ma Y, Zhang J, Yu J, Sun G, et al: The up-regulation of miR-199b-5p
in erythroid differentiation is associated with GATA-1 and NF-E2.
Mol Cells. 37:213–219. 2014. View Article : Google Scholar : PubMed/NCBI
|
|
18
|
Wang F, Zhu Y, Guo L, Dong L, Liu H, Yin
H, Zhang Z, Li Y, Liu C, Ma Y, et al: A regulatory circuit
comprising GATA1/2 switch and microRNA-27a/24 promotes
erythropoiesis. Nucleic Acids Res. 42:442–457. 2014. View Article : Google Scholar
|
|
19
|
Xu H, Iyer N, Huettner JE and
Sakiyama-Elbert SE: A puromycin selectable cell line for the
enrichment of mouse embryonic stem cell-derived V3 interneurons.
Stem Cell Res Ther. 6:2202015. View Article : Google Scholar : PubMed/NCBI
|
|
20
|
Livak KJ and Schmittgen TD: Analysis of
relative gene expression data using real-time quantitative PCR and
the 2(-Delta Delta C(T)) method. Methods. 25:402–408. 2001.
View Article : Google Scholar
|
|
21
|
Hattangadi SM, Wong P, Zhang L, Flygare J
and Lodish HF: From stem cell to red cell: regulation of
erythropoiesis at multiple levels by multiple proteins, RNAs, and
chromatin modifications. Blood. 118:6258–6268. 2011. View Article : Google Scholar : PubMed/NCBI
|
|
22
|
Doré LC, Chlon TM, Brown CD, White KP and
Crispino JD: Chromatin occupancy analysis reveals genome-wide GATA
factor switching during hematopoiesis. Blood. 119:3724–3733. 2012.
View Article : Google Scholar : PubMed/NCBI
|
|
23
|
Bresnick EH, Lee HY, Fujiwara T, Johnson
KD and Keles S: GATA switches as developmental drivers. J Biol
Chem. 285:31087–31093. 2010. View Article : Google Scholar : PubMed/NCBI
|
|
24
|
Grass JA, Boyer ME, Pal S, Wu J, Weiss MJ
and Bresnick EH: GATA-1-dependent transcriptional repression of
GATA-2 via disruption of positive autoregulation and domain-wide
chromatin remodeling. Proc Natl Acad Sci USA. 100:8811–8816. 2003.
View Article : Google Scholar : PubMed/NCBI
|
|
25
|
Martowicz ML, Grass JA, Boyer ME, Guend H
and Bresnick EH: Dynamic GATA factor interplay at a multicomponent
regulatory region of the GATA-2 locus. J Biol Chem. 280:1724–1732.
2005. View Article : Google Scholar
|
|
26
|
Grass JA, Jing H, Kim SI, Martowicz ML,
Pal S, Blobel GA and Bresnick EH: Distinct functions of dispersed
GATA factor complexes at an endogenous gene locus. Mol Cell Biol.
26:7056–7067. 2006. View Article : Google Scholar : PubMed/NCBI
|
|
27
|
Wightman B, Ha I and Ruvkun G:
Posttranscriptional regulation of the heterochronic gene lin-14 by
lin-4 mediates temporal pattern formation in C. elegans. Cell.
75:855–862. 1993. View Article : Google Scholar : PubMed/NCBI
|
|
28
|
Lee RC, Feinbaum RL and Ambros V: The C.
elegans hetero chronic gene lin-4 encodes small RNAs with antisense
complementarity to lin-14. Cell. 75:843–854. 1993. View Article : Google Scholar : PubMed/NCBI
|
|
29
|
Wang Q, Huang Z, Xue H, Jin C, Ju XL, Han
JD and Chen YG: MicroRNA miR-24 inhibits erythropoiesis by
targeting activin type I receptor ALK4. Blood. 111:588–595. 2008.
View Article : Google Scholar
|
|
30
|
Fu YF, Du TT, Dong M, Zhu KY, Jing CB,
Zhang Y, Wang L, Fan HB, Chen Y, Jin Y, et al: Mir-144 selectively
regulates embryonic alpha-hemoglobin synthesis during primitive
erythropoiesis. Blood. 113:1340–1349. 2009. View Article : Google Scholar
|
|
31
|
Patrick DM, Zhang CC, Tao Y, Yao H, Qi X,
Schwartz RJ, Jun-Shen Huang L and Olson EN: Defective erythroid
differentiation in miR-451 mutant mice mediated by 14-3-3zeta.
Genes Dev. 24:1614–1619. 2010. View Article : Google Scholar : PubMed/NCBI
|
|
32
|
Rasmussen KD, Simmini S, Abreu-Goodger C,
Bartonicek N, Di Giacomo M, Bilbao-Cortes D, Horos R, Von Lindern
M, Enright AJ and O'Carroll D: The miR-144/451 locus is required
for erythroid homeostasis. J Exp Med. 207:1351–1358. 2010.
View Article : Google Scholar : PubMed/NCBI
|
|
33
|
Yu D, dos Santos CO, Zhao G, Jiang J,
Amigo JD, Khandros E, Dore LC, Yao Y, D'Souza J, Zhang Z, et al:
miR-451 protects against erythroid oxidant stress by repressing
14-3-3zeta. Genes Dev. 24:1620–1633. 2010. View Article : Google Scholar : PubMed/NCBI
|
|
34
|
Sankaran VG, Menne TF, Šćepanović D,
Vergilio JA, Ji P, Kim J, Thiru P, Orkin SH, Lander ES and Lodish
HF: MicroRNA-15a and -16-1 act via MYB to elevate fetal hemoglobin
expression in human trisomy 13. Proc Natl Acad Sci USA.
108:1519–1524. 2011. View Article : Google Scholar : PubMed/NCBI
|
|
35
|
Zhang L, Flygare J, Wong P, Lim B and
Lodish HF: miR-191 regulates mouse erythroblast enucleation by
down-regulating Riok3 and Mxi1. Genes Dev. 25:119–124. 2011.
View Article : Google Scholar : PubMed/NCBI
|
|
36
|
Georgantas RW III, Hildreth R, Morisot S,
Alder J, Liu CG, Heimfeld S, Calin GA, Croce CM and Civin CI:
CD34+ hematopoietic stem-progenitor cell microRNA
expression and function: a circuit diagram of differentiation
control. Proc Natl Acad Sci USA. 104:2750–2755. 2007. View Article : Google Scholar
|
|
37
|
Norfo R, Zini R, Pennucci V, Bianchi E,
Salati S, Guglielmelli P, Bogani C, Fanelli T, Mannarelli C, Rosti
V, et al: Associazione Italiana per la Ricerca sul Cancro Gruppo
Italiano Malattie Mieloproliferative Investigators: miRNA-mRNA
integrative analysis in primary myelofibrosis CD34+
cells: role of miR-155/JARID2 axis in abnormal megakaryopoiesis.
Blood. 124:e21–e32. 2014. View Article : Google Scholar : PubMed/NCBI
|
|
38
|
Crispino JD, Lodish MB, MacKay JP and
Orkin SH: Use of altered specificity mutants to probe a specific
protein-protein interaction in differentiation: the GATA-1:FOG
complex. Mol Cell. 3:219–228. 1999. View Article : Google Scholar : PubMed/NCBI
|
|
39
|
Jelkmann W: Molecular biology of
erythropoietin. Intern Med. 43:649–659. 2004. View Article : Google Scholar : PubMed/NCBI
|
|
40
|
Fried W: Erythropoietin and
erythropoiesis. Exp Hematol. 37:1007–1015. 2009. View Article : Google Scholar : PubMed/NCBI
|
|
41
|
Zhang FL, Shen GM, Liu XL, Wang F, Zhao YZ
and Zhang JW: Hypoxia-inducible factor 1-mediated human GATA1
induction promotes erythroid differentiation under hypoxic
conditions. J Cell Mol Med. 16:1889–1899. 2012. View Article : Google Scholar
|
|
42
|
Weiss MJ and Orkin SH: GATA transcription
factors: key regulators of hematopoiesis. Exp Hematol. 23:99–107.
1995.PubMed/NCBI
|
|
43
|
Orkin SH: GATA-binding transcription
factors in hematopoietic cells. Blood. 80:575–581. 1992.PubMed/NCBI
|
|
44
|
Moriguchi T and Yamamoto M: Network
regulation of Gata1 and Gata2 gene-dynamics underlies erythroid
differentiation. Rinsho Ketsueki. 55:633–642. 2014.In Japanese.
PubMed/NCBI
|
|
45
|
Yang Y, Ma W, Wu D, Huang Y, Li H, Zou J,
Zhang Y, Feng M and Luo J: MiR-17 partly promotes hematopoietic
cell expansion through augmenting HIF-1α in osteoblasts. PLoS One.
8:e702322013. View Article : Google Scholar
|
|
46
|
Bianchi N, Zuccato C, Lampronti I,
Borgatti M and Gambari R: Expression of miR-210 during erythroid
differentiation and induction of gamma-globin gene expression. BMB
Rep. 42:493–499. 2009. View Article : Google Scholar : PubMed/NCBI
|
|
47
|
Fabbri E, Manicardi A, Tedeschi T, Sforza
S, Bianchi N, Brognara E, Finotti A, Breveglieri G, Borgatti M,
Corradini R, et al: Modulation of the biological activity of
microRNA-210 with peptide nucleic acids (PNAs). Chem Med Chem.
6:2192–2202. 2011. View Article : Google Scholar : PubMed/NCBI
|