Introduction
Follicular lymphoma (FL) is the second most common
form of non-Hodgkin's B-cell lymphoma (NHL) and the most common
subtype of indolent NHL. The majority of FL cases (~85%) harbor the
t(14;18)(q32;q21) translocation (1), which juxtaposes the B-cell lymphoma 2
(BCL2) gene on chromosome 18 to the immunoglobulin heavy
chain gene (IGH) locus, resulting in constitutive expression
of BCL2. Therefore, BCL2 is an important diagnostic marker of FL.
However, 10–20% of cases are BCL2-negative (2), and this loss of BCL2 expression is
frequent in high-grade cases (grades 3A and B) (1). Of these BCL2-negative cases, FL is
difficult to diagnose even when other immunohistochemical markers
are investigated.
It was previously reported that upregulation of
certain protocadherin-γ (PCDH-γ) subfamily genes in nodal
and duodenal FL using gene expression analysis (3). PCDH-γ subfamily genes, which
are predominantly expressed in the nervous system, constitute the
largest subgroup (~80 members) of the cadherin superfamily of
cell-adhesion molecules (4,5). In
various tumor types, PCDH genes are downregulated or
silenced via promoter hypermethylation-mediated gene inactivation,
including PCDH8 (6) in
breast carcinoma, PCDH9 in glioblastoma (7), PCDH17 in esophageal carcinoma
(8) and PCDH10 in Burkitt
and diffuse large B-cell lymphoma (9). However, the mechanisms and associated
molecular function of PCDH-γ subfamily gene upregulation in FL
remain to be elucidated. In the present study, PCDHGA3 was
investigated as a potentially useful diagnostic marker, even in
BCL2-negative FL cases. Furthermore, a functional analysis of
PCDHGA3 was performed in an FL-derived cell line.
Materials and methods
Patients and cell lines
A total of 71 formalin-fixed paraffin-embedded
tissue (FFPET) samples were selected, including 17 nodal reactive
lymphoid hyperplasia (RLH) samples and 54 FL samples, obtained from
the routine and consultation files of the Department of Pathology,
Okayama University Graduate School of Medicine, Dentistry and
Pharmaceutical Sciences (Okayama, Japan). Of the 54 FL cases, 20
were grade 1 or 2, 9 were grade 3A, 10 were FL with diffuse area
and 15 were BCL2-negative.
Patient samples were diagnosed on the basis of
morphological and immunophenotypical observations according to the
current World Health Organization classification (1), and all cases were reviewed by three
skilled hematopathologists (Dr Katsuyoshi Takata, Dr Yasuharu Sato
and Professor Tadashi Yoshino). The study protocol was approved by
the Institutional Review Board of Okayama University Graduate
School of Medicine, Dentistry, and Pharmaceutical Sciences
(Okayama, Japan). All study procedures were conducted in accordance
with the guidelines of the Declaration of Helsinki.
The human FL-derived cell lines, FL18 and FL318 were
provided by Dr Ohno of Kyoto University (Kyoto, Japan). The cells
were cultured at 37°C in 5% CO2 in RPMI-1640 (Nissui
Pharmaceutical Co., Ltd., Tokyo, Japan) supplemented with 10% fetal
bovine serum (Biological Industries, Cromwell, CT, USA) and 10,000
U/ml streptomycin and 10,000 µg/ml penicillin (Invitrogen; Thermo
Fisher Scientific, Inc., Waltham, MA, USA). The cells were passaged
every 3 days and used at 60–70% confluence; 10–20 passages were
used for subsequent experiments.
Microarray data analyses
Gene expression data of 18 nodal FL and 8 RLH
samples from a previous study (3)
(GSE48047) were re-analyzed. Expressed genes correlating with
PCDHGA3 expression were identified using GeneSpring software
version 11.0.2 (Agilent Technologies, Inc., Santa Clara, CA, USA),
as previously described (3).
Hematoxylin and eosin staining and
immunohistochemistry
Patient samples were fixed with 10% formaldehyde for
24 h at room temperature. The tissues were then embedded in
paraffin and cut into 3 µm sections. The slides were soaked in
xylene, dipped into a Coplin jar containing Mayer's hematoxylin and
agitated for 30 sec. The slides were then rinsed in H2O
for 1 min, then counterstained with 1% eosin Y solution for 10–30
sec with agitation. The sections were then dehydrated with two
changes of 95% alcohol and two changes of 100% alcohol for 30 sec
each, then 1–2 drops of mounting medium was added, and covered with
a coverslip.
Formalin-fixed paraffin-embedded tissue sections (3
µm thick) were immunohistochemically stained using a BOND-MAX
autostainer (Leica Biosystems, Melbourne, Australia), with immune
complexes visualized by the polymer method, according to the
manufacturer's protocol and as previously described (10). The following primary antibodies
were used: Rabbit anti-human PCDHGA3 (1:50; cat. no. RB33029;
Abgent, Inc., San Diego, CA, USA) and mouse anti-human CD21 (1:20;
cat. no. IR608; Dako Cytomation, Glostrup, Denmark). For the
indirect double immunofluorescence study, cytospin slides of FL18
cells were subjected to staining with the primary antibodies
against PCDHGA3 and mouse anti- tumor necrosis factor receptor
superfamily member 6B (TNFRSF6B; 1:100; cat. no. ab57956; Abcam,
Cambridge, UK), as described previously (10).
Reverse transcription-polymerase chain
reaction (RT-PCR)
Total RNA was extracted from cells using the
miRNeasy Mini Kit (Qiagen GmbH, Hilden, Germany) according to the
manufacturer's protocols. RNA concentration was measured using a
NanoDrop 1000 spectrophotometer (Thermo Fisher Scientific, Inc.,
Wilmington, DE, USA) and reverse-transcribed into cDNA using
SuperScript III First-Strand Synthesis System kit (Invitrogen;
Thermo Fisher Scientific, Inc.) and a Bio-Rad T100 Thermal Cycler
(Bio-Rad Laboratories, Inc., Hercules, CA, USA), according to the
manufacturer's protocol. PCR was performed using GeneAmp Fast (2X)
PCR Master Mix (Thermo Fisher Scientific, Inc.), using the
following PCDHGA3-specific primer sequences: Forward,
5′-CTCACAAGCTCAGTCCCAGA-3′ and reverse, 5′-CATAAGTGATGCGGGCGTTG-3′.
β-actin (ACTB) was also amplified as a control, using the
following primers: Forward, 5′-CATGTACGTTGCTATCCAGGC-3′ and
reverse, 5′-CTCCTTAATGTCACGCACGAT-3′ (Sigma-Aldrich; Merck
Millipore, Darmstadt, Germany). Reactions were performed using a
Bio-Rad T100 Thermal Cycler and thermal cycling conditions
consisting of: 94°C for 2 min, 94°C for 30 sec, 55°C annealing
temperature for 30 sec, and 72°C for 1 min for 30 cycles, followed
by 72°C for 10 min. Following amplification, PCR products were
separated on 1.5% agarose gels and visualized by ethidium bromide
fluorescence using a Gel Print 2000i VGA, USA (BioImage; Thermo
Fisher Scientific, Inc.) The resulting bands were compared to
β-actin bands produced using the same cDNA isolated from each cell
line.
PCDHGA3 gene knockdown assay
Three PCDHGA3 small interfering (si)RNAs
(s31922, s31923 and s31924) and one negative control siRNA
(Silencer Select Negative Control #1) were obtained from Thermo
Fisher Scientific, Inc. FL18 cells (5×10⁵) were
transfected with 200 nM PCDHGA3 or negative control siRNA
using a Neon Transfection System (Invitrogen; Thermo Fisher
Scientific, Inc.) under the conditions of 1400 V, 20 ms and 2
pulses. At 24 h post-transfection, the medium was replaced with
fresh medium. The cells were grown for a further 48 h and harvested
for subsequent analysis.
Total RNA was extracted from cells using a miRNeasy
Mini kit (Qiagen, Inc.) according to the manufacturer's protocol.
RNA purity and concentration were determined
spectrophotometrically. RNA was reverse-transcribed into cDNA using
SuperScript III First-Strand Synthesis System kit (Invitrogen;
Thermo Fisher Scientific, Inc.) and a Bio-Rad T100 Thermal Cycler
(Bio-Rad Laboratories, Inc.), according to the manufacturer's
protocol. Quantitative PCR (qPCR) was performed using a StepOnePlus
Real-Time PCR System and TaqMan Gene Expression assays (Thermo
Fisher Scientific, Inc.). Specific probes for PCDHGA3
(Hs00259230_s1), GAPDH (Hs02758991_g1) and ACTB
(Hs99999903_m1) were obtained from Thermo Fisher Scientific, Inc.
The relative degree of change for each gene was calculated using
the 2−ΔΔCq method (11), with GAPDH as the endogenous
control.
Cell proliferation assay
At 24 h post-siRNA transfection, cells were seeded
in a 24-well culture plate at a density of 1×10⁵
cells/ml. At 48 and 72 h post-transfection, cell numbers were
manually counted via trypan blue staining.
Western blotting
Cultured FL18 cells (1×10⁶) were
harvested, washed in cold PBS, and lysed using Ambion KDalert lysis
buffer (Thermo Fisher Scientific, Inc.). Equal amounts of protein
(15 µg per lane) from each sample were separated by 8% SDS-PAGE
(Bolt Bis-Tris Plus Gel, Thermo Fisher Scientific, Inc.), the
membranes were blocked with PBS-T (PBS with 0.1% Tween-20)
containing 5% skimmed milk power at room temperature for 1 h, then
transferred onto a polyvinylidene difluoride membrane (Invitrogen;
Thermo Fisher Scientific, Inc.). Membranes were incubated at 4°C
overnight with a rabbit anti-human PCDHGA3 antibody (1:500; cat.
no. AP13611C; Abgent, Inc., San Diego, CA, USA); a mouse anti-human
β-actin antibody (1:50,000; cat. no. sc47778; Santa Cruz
Biotechnology, Inc., Dallas, TX, USA) served as a loading control,
as previously described (12). The
membrane was washed in PBS-T, and incubated with horseradish
peroxidase-conjugated secondary antibody at room temperature for 1
h. The following secondary antibodies were used: Donkey anti-rabbit
(1:50,000; cat. no. NA9340V; GE Healthcare Life Sciences, Chalfont,
UK) and sheep anti-mouse (1:50,000; cat. no. NA9310V, GE Healthcare
Life Sciences). The membrane was washed with PBS-T, and immune
complexes were visualized using an enhanced chemiluminescence Prime
Detection System (GE Healthcare Life Sciences).
Statistical analysis
The Chi-squared test, Fisher's exact test and
one-way analysis of variance were conducted using SPSS software,
version 14.0 (SPSS, Inc., Chicago, IL, USA). P<0.05 was
considered to indicate a statistically significant difference.
Results
Expression of PCDH-γ subfamily genes
is upregulated in nodal FL compared with RLH
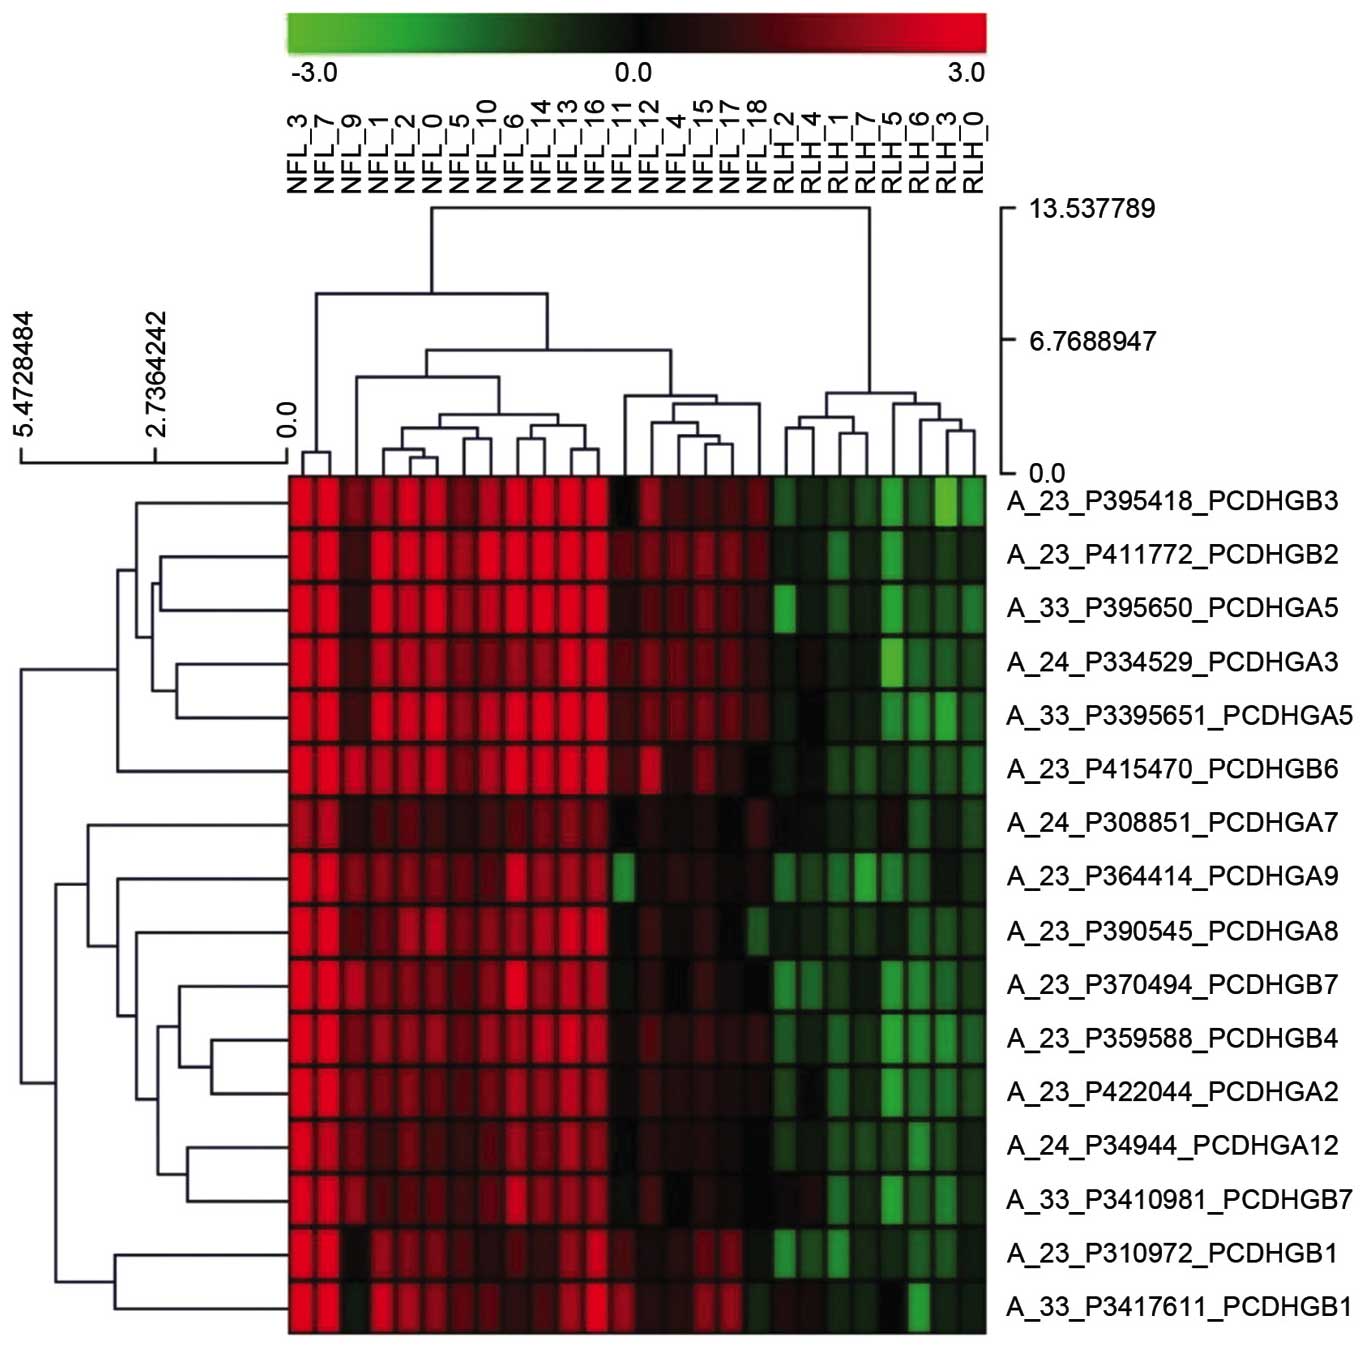
Of the differentially expressed genes in terms of
gene ontology between nodal FL and RLH, the top five upregulated
genes were PCDH-γ subfamily members B4, B3, B2, A5 and A3. A
heatmap of the PCDH-γ subfamily genes is presented in Fig. 1. Therefore, PCDHGA3, as a
representative gene, was selected for further analysis.
PCDHGA3 is strongly expressed in FL,
including high-grade and BCL2-negative cases
Results of the immunohistochemical analysis of RLH
and FL samples are presented in Fig.
2 and Table I. Only 1/17 RLH
samples was weakly PCDHGA3-positive (Fig. 2A and B), whereas 19/20 (95%) FL
grade 1–2 samples were positive (Fig.
2C and D). In addition, approximately half of the FL grade 3A
samples were positive (Fig. 2E and
F). Notably, all 10 samples of FL with diffuse area were
PCDHGA3-positive (Fig. 2G-I) and
13 of 15 (87%) BCL2-negative FL samples were PCDHGA3-positive
(Fig. 2J-M). Ki-67 staining (a
marker of proliferation) was performed to diagnose BCL2-negative
neoplastic follicles. These results revealed that FL cells express
PCDHGA3 irrespective of BCL2 status or grade.
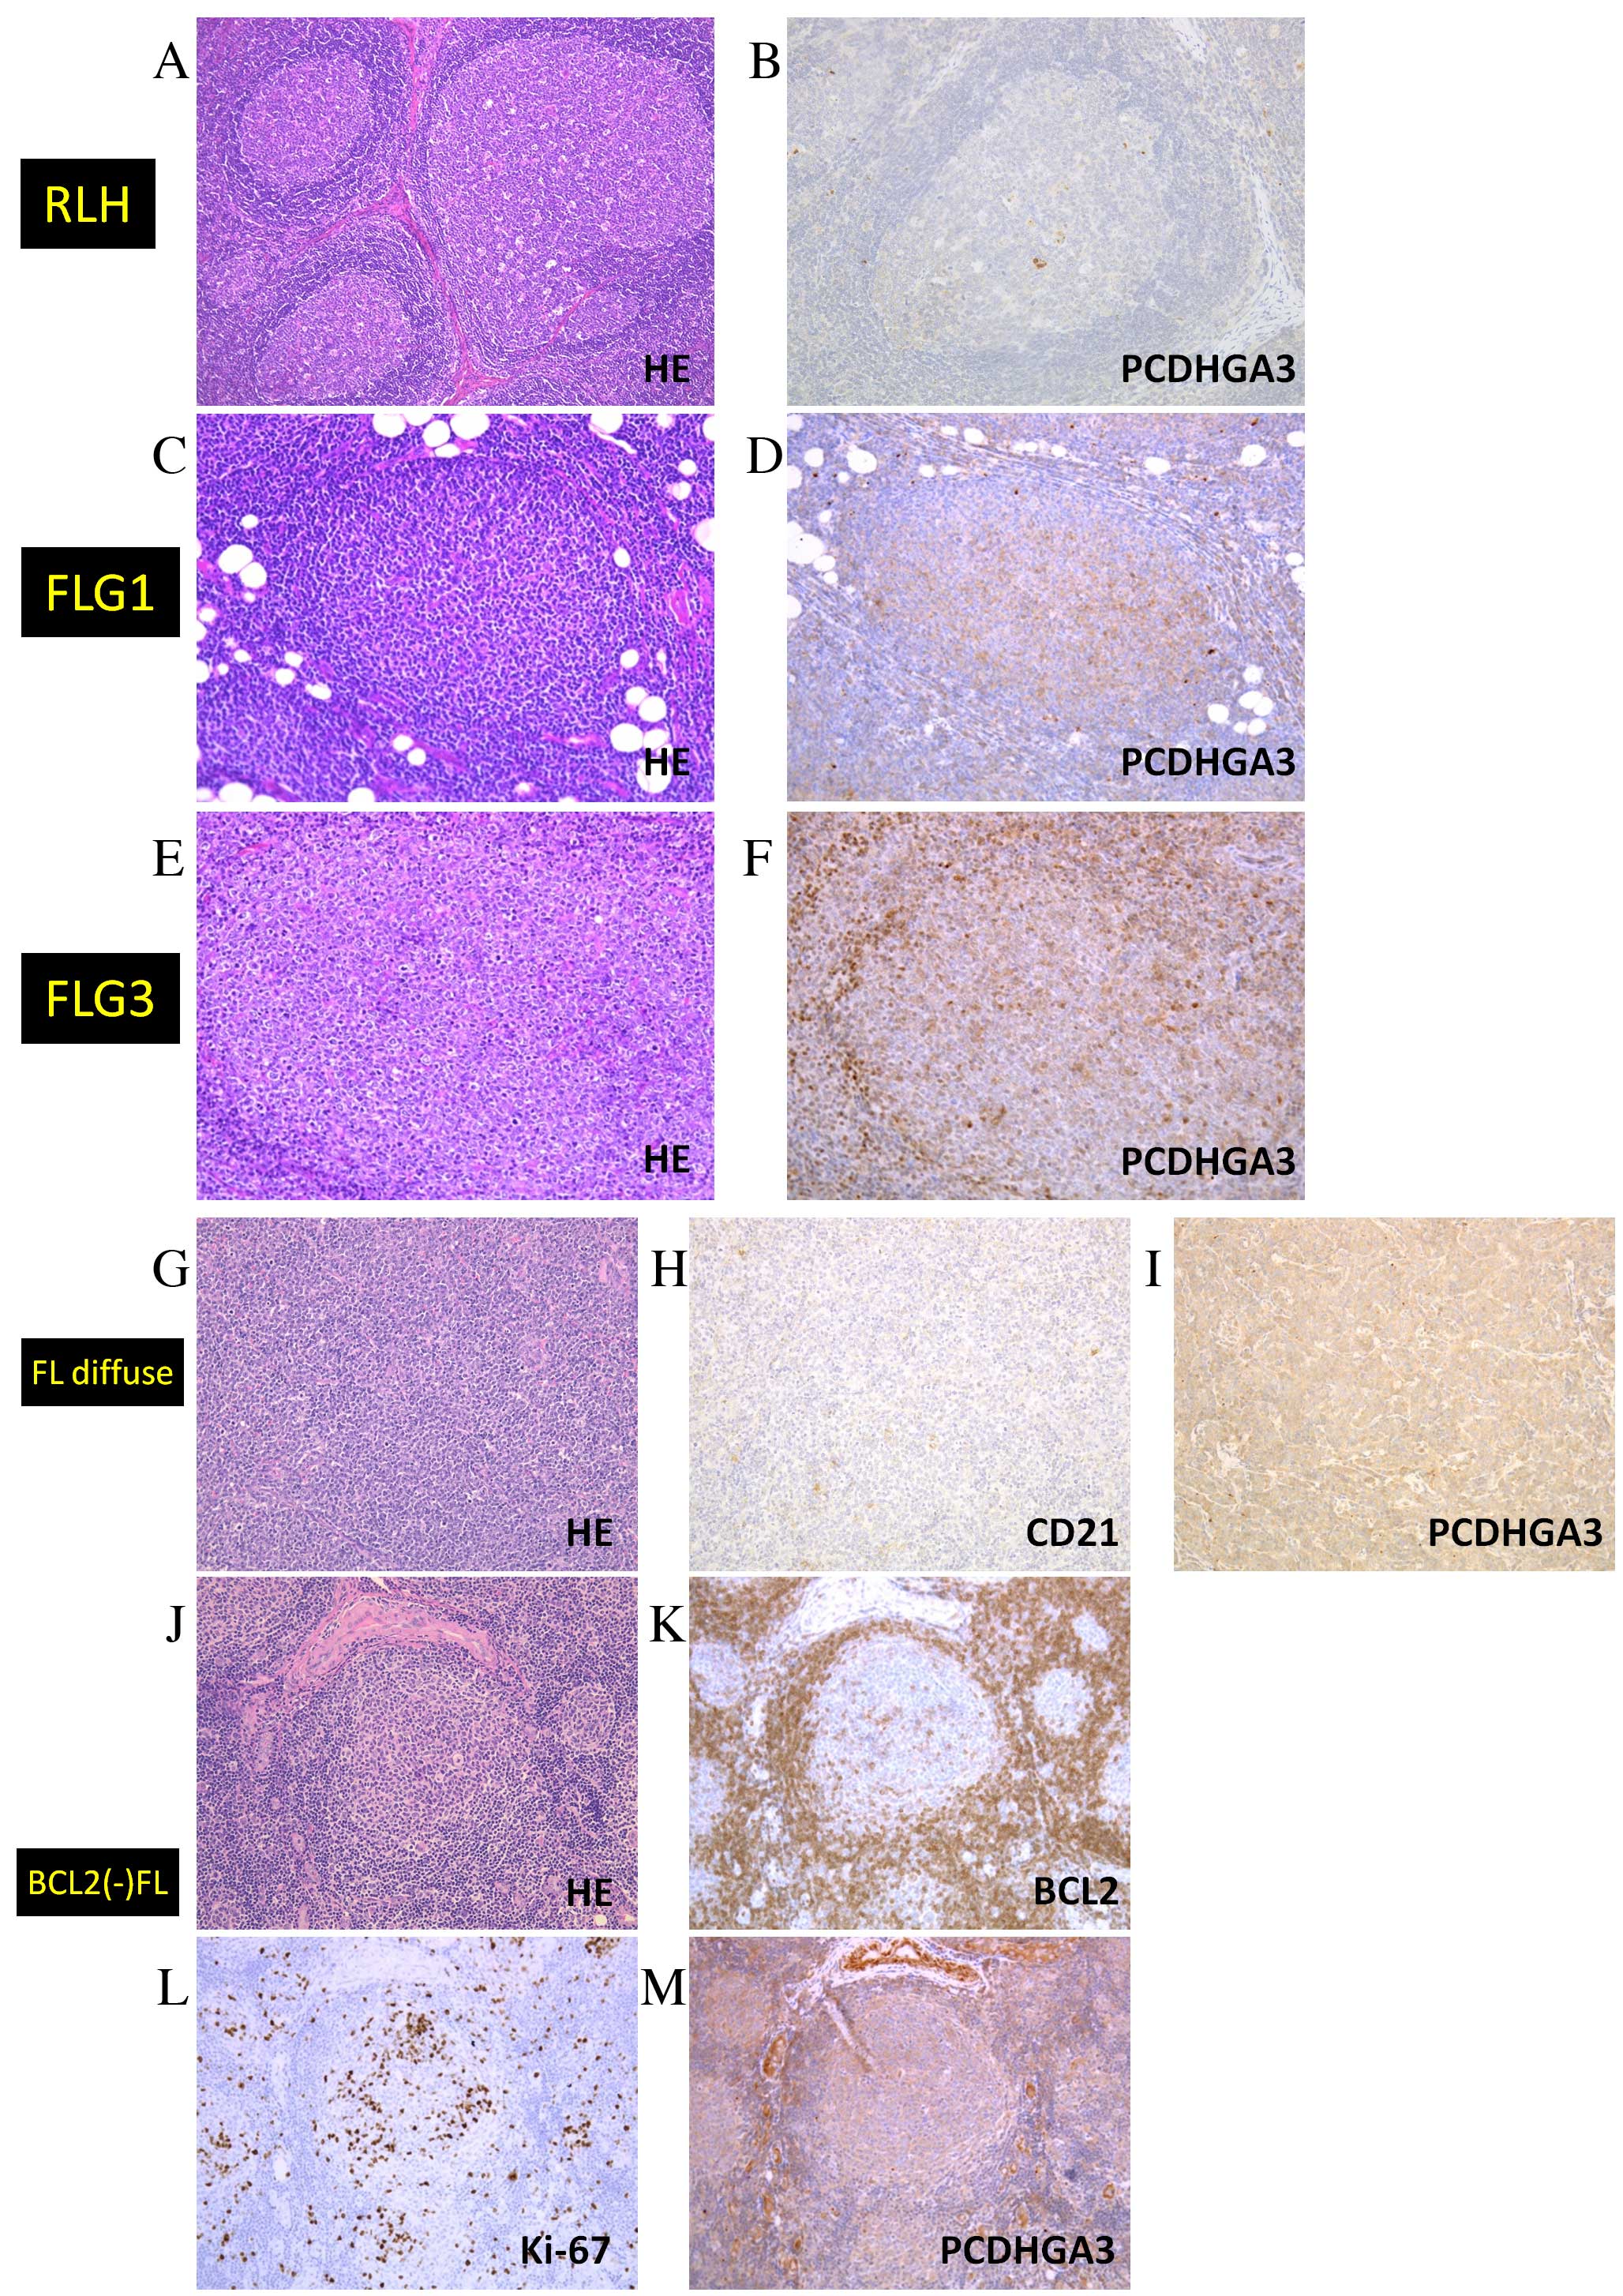 | Figure 2.Immunohistochemical analysis of
PCDHGA3 in FL samples. (A) HE staining of RLH. (B) PCDHGA3 was
negative in RLH. (C) HE staining of an FL grade 1 sample, which was
(D) positive for PCDHGA3. (E) HE staining of an FL grade 3 sample,
which was (F) positive for PCDHGA3. (G) HE staining of an FL with
diffuse area sample, which was (H) negative for CD21-expressing
follicular dendritic cells and (I) positive for PCDHGA3. (J) HE
staining of a BCL2-negative FL sample, which was (K) negative for
BCL2, (L) positive for Ki-67 and (M) positive for PCDHGA3. All
these images were representative of their groups. Original
magnification A and G-M, ×100. Original magnification B-F, ×200.
PCDHG, protocadherin γ; FL, follicular lymphoma; HE, hematoxylin
and eosin; RLH, reactive lymphoid hyperplasia; CD, cluster of
differentiation; BCL2, B-cell lymphoma 2. |
 | Table I.PCDHGA3 expression in RLH and FL
samples. |
Table I.
PCDHGA3 expression in RLH and FL
samples.
| Histological
subtype | No. studied | Positive (%) | P-value (vs.
RLH) |
|---|
| RLH | 17 | 1 (5.9) | – |
| FL (Grades 1 and
2) | 20 | 19 (95) | <0.001 |
| FL (Grade 3) | 9 | 5 (55.6) | 0.028 |
| FL (Diffuse
area) | 10 | 10 (100) | <0.001 |
| FL (BCL2
negative) | 15 | 13 (86.7) | <0.001 |
PCDHGA3 silencing reduces cell
proliferation in the FL18 cell line
As a large proportion of nodal FL cases expressed
PCDHGA3, PCDHGA3 expression status was examined in the FL
cell lines, FL18 and FL318. The two cell lines expressed
PCDHGA3 mRNA, as determined by RT-qPCR (Fig. 3A). PCDHGA3 gene knockdown
with PCDHGA3 siRNAs was performed in the FL18 cell line. The
silencing effects of three different PCDHGA3-specific siRNAs
in FL18 cells were evaluated using RT-qPCR and western blotting.
The s31924 siRNA was selected for further analysis as it yielded
the greatest PCDHGA3 mRNA inhibition ratio (55.9%) relative
to untreated FL18 cells (P=0.005 Fig.
3B and C). Following PCDHGA3 knockdown, proliferation
curves were generated for untreated FL18 cells, and FL18 cells
transfected with negative siRNA or PCDHGA3 s31924 siRNA.
Proliferation was significantly suppressed in FL18 cells
transfected with PCDHGA3 siRNA at 72 h compared with
untreated FL18 cells. (P<0.001; Fig. 3D).
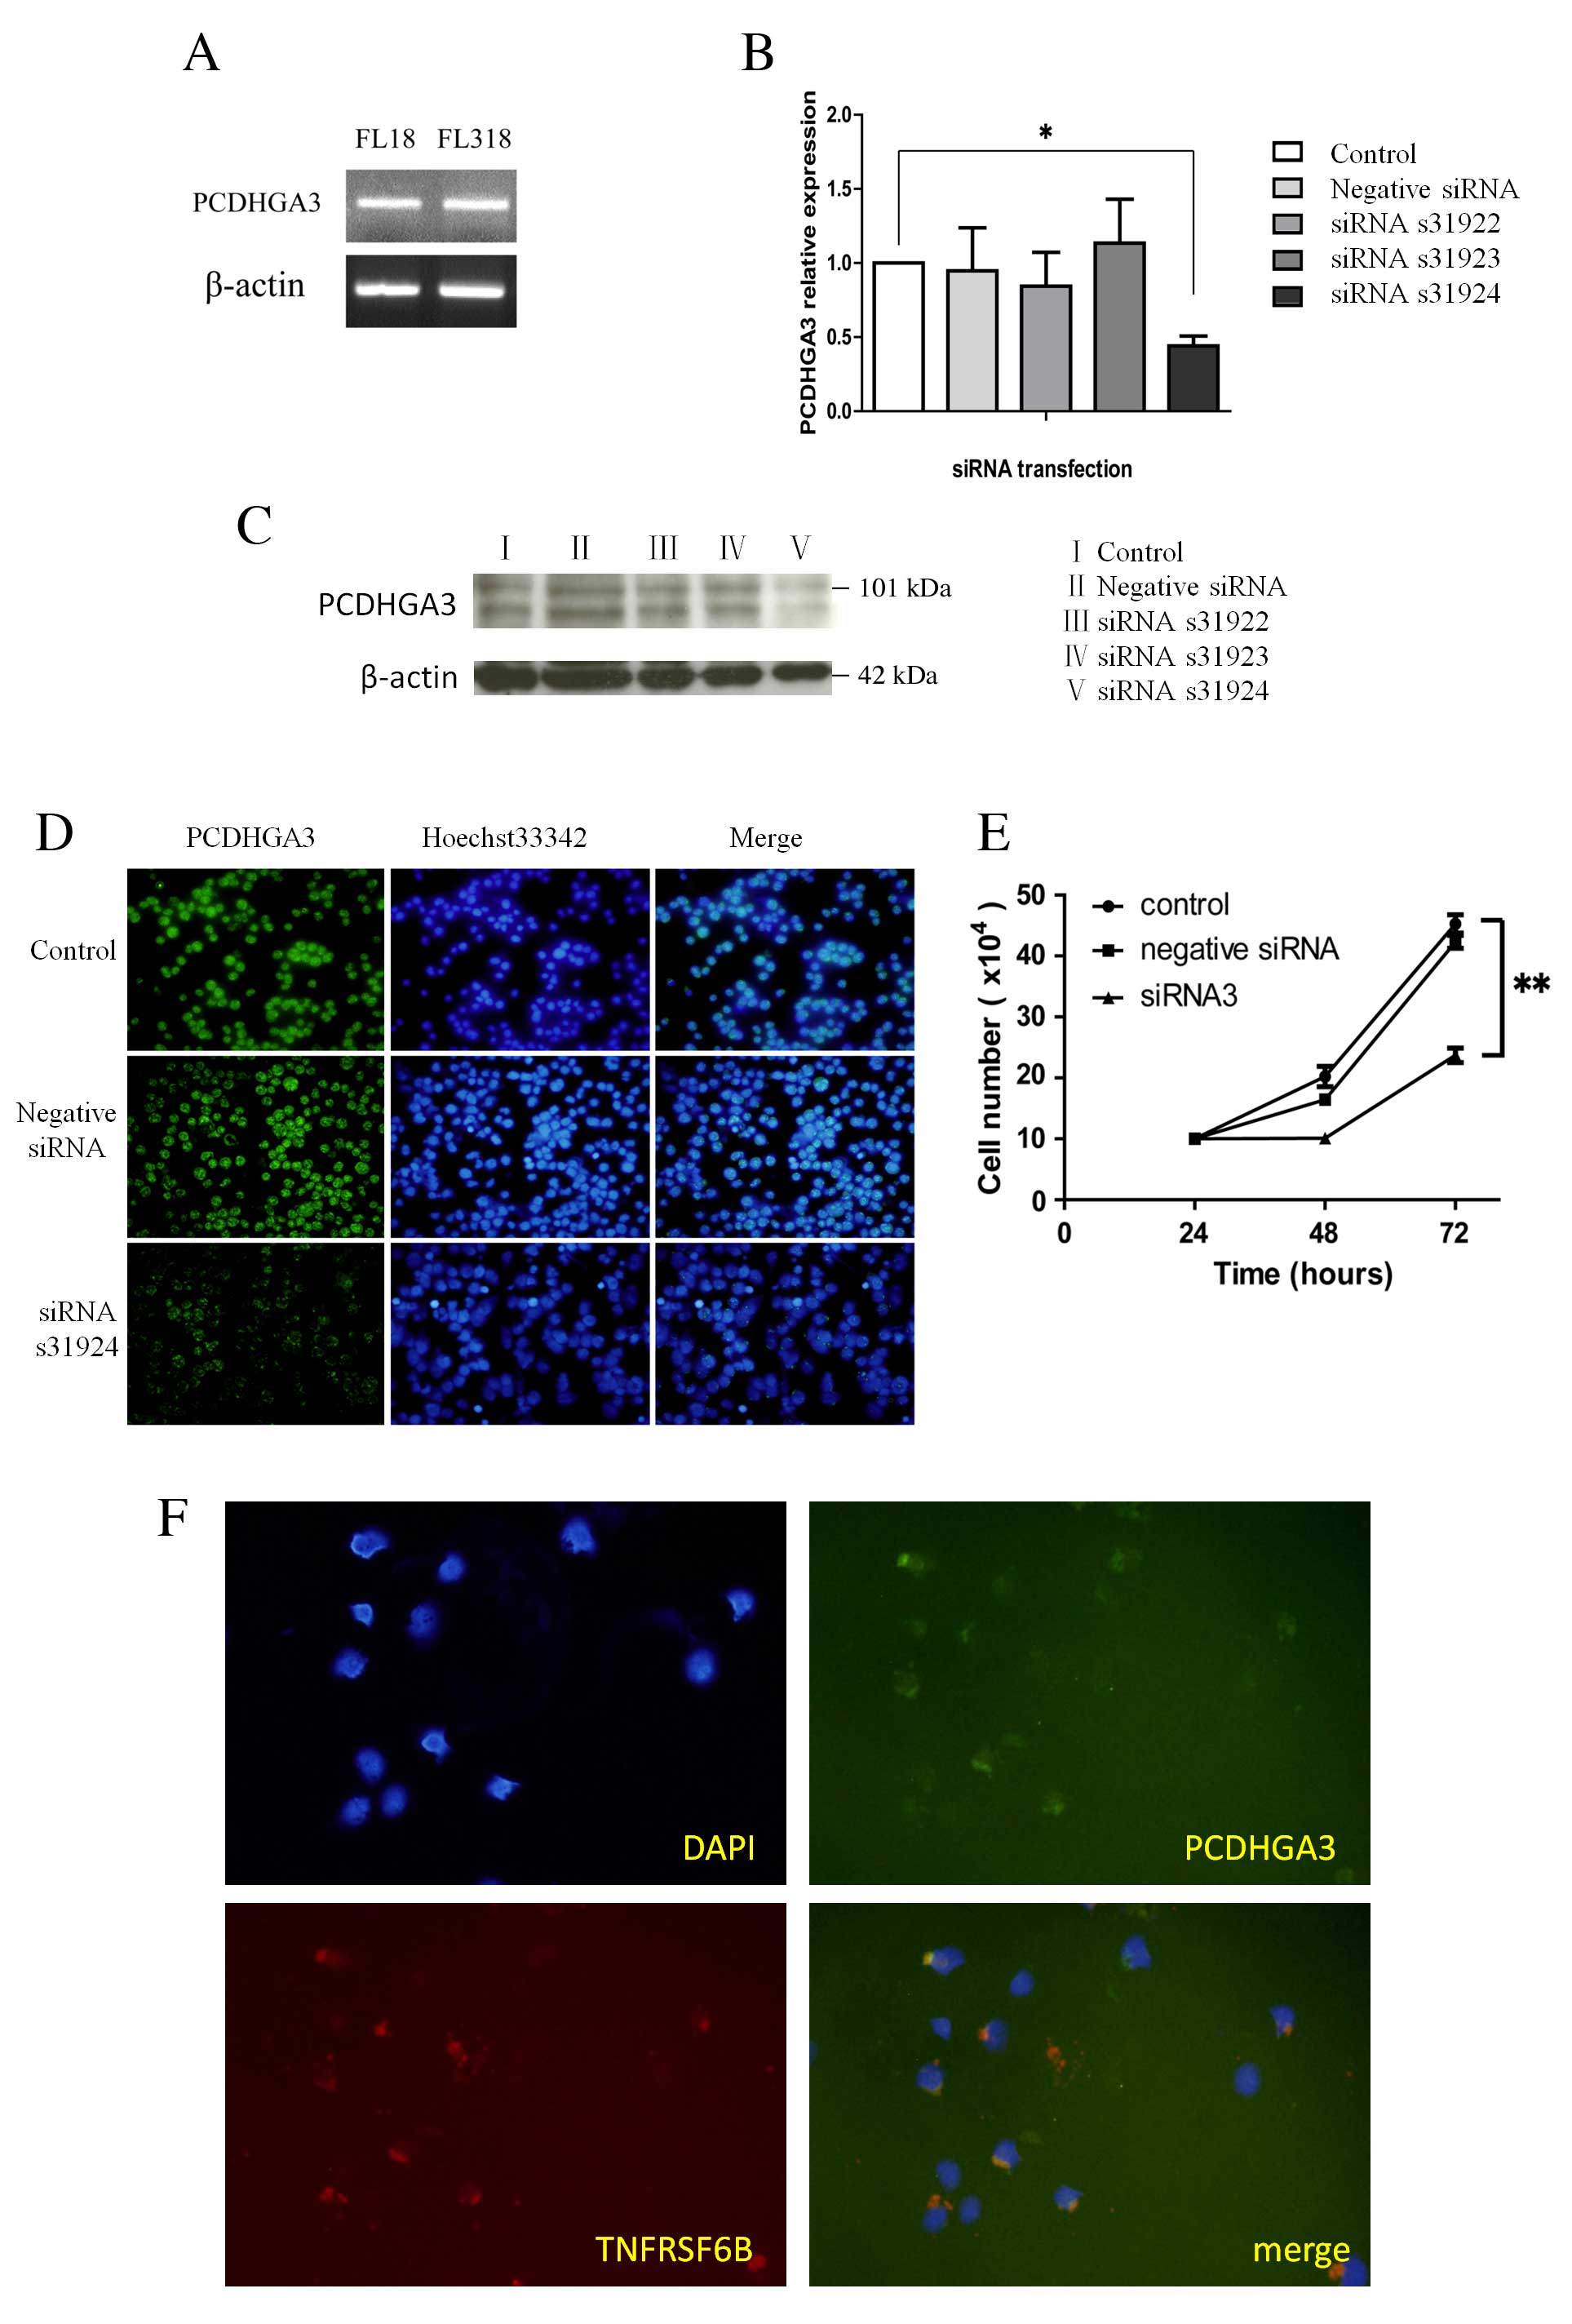 | Figure 3.PCDHGA3 gene knockdown. (A)
PCDHGA3 mRNA was detected in the FL-derived cell lines, FL18
and FL318. Knockdown of the PCDHGA3 gene was confirmed by
(B) reverse transcription-quantitative polymerase chain reaction,
(C) western blotting and (D) immunofluorescence. The siRNA, s31924,
was selected for further analysis because it yielded the greatest
PCDHGA3 mRNA inhibition ratio (55.9%) relative to untreated
FL18 cells, original magnification ×100. (E) Cell proliferation was
significantly suppressed in PCDHGA3 siRNA-treated FL18 cells
at 72 h. (F) Coexpression of PCDHGA3 and TNFRSF6B was observed in
the FL18 cell line by double immunofluorescence staining, original
magnification ×200. *P<0.01; **P<0.001. PCDHG, protocadherin
γ; FL, follicular lymphoma; siRNA, small interfering RNA; TNFRSF6B,
tumor necrosis factor receptor superfamily member 6B; DAPI,
4,6-diamidino-2-phenylindole. |
Coexpression of TNFRSF6B and PCDHGA3
in the FL18 cell line
Genes expressed concomitantly with PCDHGA3
were selected from the gene expression data of nodal FL and RLH
(Table II). TNFRSF6B was
among the top five correlated genes. Furthermore, the protein
encoded by this gene may be involved in regulating the suppression
of Fas ligand-mediated cell death (13). Coexpression of TNFRSF6B and PCDHGA3
was observed in the FL18 cell line by double immunostaining
(Fig. 3E).
| Table II.Top 10 genes correlated with
PCDHGA3. |
Table II.
Top 10 genes correlated with
PCDHGA3.
| Gene name | Gene symbol | Median value |
|---|
| Opiate receptor-like
1 | OPRL1 | 0.6731 |
| Tumor necrosis factor
receptor superfamily, member 6b, decoy | TNFRSF6B | 0.6721 |
| ADAMTS-like 5 | ADAMTSL5 | 0.6635 |
|
1-Aminocyclopropane-1-carboxylate
synthetase homolog | ACCSL | 0.6401 |
| Carbohydrate
sulfotransferase 4 | CHST4 | 0.6375 |
| Transmembrane
channel-like 6 | TMC6 | 0.6331 |
| Solute carrier family
16, member 12 | SLC16A12 | 0.6299 |
| MAM domain containing
4 | MAMDC4 | 0.6281 |
| PRKC, apoptosis, WT1,
regulator | PAWR | 0.6271 |
| Cullin-associated
and neddylation-dissociated 1 | CAND1 | 0.6288 |
Discussion
PCDHs, which are downregulated via epigenetic
mechanisms in various tumor types, have been suggested as candidate
tumor suppressor genes (6–9,14).
It has been previously demonstrated that expression of PCDH-γ
subfamily genes is upregulated in low-grade FL (3). In the present study, PCDHGA3
expression was investigated in various grades of FL using
immunohistochemistry, and it was examined whether this gene product
may contribute to cell proliferation in an FL-derived cell line. As
an antibody against PCDHGA3 suitable for use in immunohistochemical
studies was available, this gene and protein was selected for
further analysis.
For the pathological diagnosis of FL, detection of
aberrant BCL2 expression in neoplastic follicles is important and
useful, as 80–90% of cases of low-grade FL harbor the IGH-BCL2
translocation. Although only 10–20% cases of low-grade FL lack BCL2
expression, cases of high-grade FL less commonly harbor this
translocation and therefore less frequently express BCL2 (15). As it may be difficult to diagnose
BCL2-negative FL, other diagnostic markers have been investigated.
For example, Masir et al (16) reported that a rabbit monoclonal
BCL2 antibody (E17) facilitated the diagnosis of BCL2-negative FLs,
whereas Zamo et al (17)
reported the lack of TUBB3 expression in BCL2-negative FLs. The
present study hypothesized that PCDHGA3 is a useful diagnostic
marker for all cases of FL, as PCDHGA3 expression was observed
irrespective of BCL2 status. The positivity of PCDHGA3 in FL Grade
3 (55.6%) was lower than the rest of the listed FL group
(86.7–100%) although it was still high enough to use as a
diagnostic tool. This may be associated with the high-grade feature
of the tumor cells, and should be investigated further in future
studies.
Similarly high levels of PCDHGA3 expression
were detected in FL18 cells and samples from FL cases, and FL18
cell proliferation was suppressed following PCDHGA3 gene
knockdown, suggesting that PCDHGA3 is associated with FL
tumor cell growth.
To investigate the mechanism underlying the effect
of PCDHGA3 on tumor cell proliferation, gene expression
profiles were reanalyzed to identify genes that were differentially
expressed concomitantly with PCDHGA3. TNFRSF6B was
among the top five coexpressed genes. TNFRSF6B
overexpression has been reported in various types of malignant
tumors (18–20) and its protein product inhibits Fas
ligand-mediated cell death. With regards to lymphoma, a study by
Bedewy et al (21) revealed
that TNFRSF6B expression was associated with shorter event-free
survival in an aggressive subtype of B-cell lymphoma. In the
present study, coexpression of TNFRSF6B and PCDHGA3 proteins was
observed in the FL18 cell line. The association between these genes
remains to be elucidated, although the proteins may interact with
each other. Further investigation is required to clarify this.
In conclusion, the results of the present study
revealed that PCDHGA3 was expressed in FL, irrespective of the BCL2
status and tumor grade, and was demonstrated to be associated with
cell proliferation. Further studies involving molecular genetic
analysis are required to clarify the mechanisms underlying the
effect of PCDHGA3 in FL.
Acknowledgements
Dr Xueyan Zhang was supported by a grant from the
China Scholarship Council.
References
|
1
|
NL SS Harris, Jaffe ES, Ott G, Nathwani
BN, et al: World Health Organization Classification of Tumours, WHO
Classification of Tumours of Haematopoietic and Lymphoid Tissues.
4th. International Agency for Research on Cancer (IARC); Lyon: pp.
220–226. 2008
|
|
2
|
Lai R, Arber DA, Chang KL, Wilson CS and
Weiss LM: Frequency of bcl-2 expression in non-Hodgkin's lymphoma:
A study of 778 cases with comparison of marginal zone lymphoma and
monocytoid B-cell hyperplasia. Mod Pathol. 11:864–869.
1998.PubMed/NCBI
|
|
3
|
Takata K, Tanino M, Ennishi D, Tari A,
Sato Y, Okada H, Maeda Y, Goto N, Araki H, Harada M, et al:
Duodenal follicular lymphoma: Comprehensive gene expression
analysis with insights into pathogenesis. Cancer Sci. 1015:608–615.
2014. View Article : Google Scholar
|
|
4
|
Morishita H and Yagi T: Protocadherin
family: Diversity, structure, and function. Curr Opin Cell Biol.
19:584–592. 2007. View Article : Google Scholar : PubMed/NCBI
|
|
5
|
Chen WV, Alvarez FJ, Lefebvre JL, Friedman
B, Nwakeze C, Geiman E, Smith C, Thu CA, Tapia JC, Tasic B, et al:
Functional significance of isoform diversification in the
protocadherin gamma gene cluster. Neuron. 75:402–409. 2012.
View Article : Google Scholar : PubMed/NCBI
|
|
6
|
Yu J, Koujak S, Nagase S, Li CM, Su T,
Wang X, Keniry M, Memeo L, Rojtman A, Mansukhani M, et al: PCDH8,
the human homolog of PAPC, is a candidate tumor suppressor of
breast cancer. Oncogene. 27:4657–4665. 2008. View Article : Google Scholar : PubMed/NCBI
|
|
7
|
de Tayrac M, Etcheverry A, Aubry M,
Saïkali S, Hamlat A, Quillien V, Le Treut A, Galibert MD and Mosser
J: Integrative genome-wide analysis reveals a robust genomic
glioblastoma signature associated with copy number driving changes
in gene expression. Genes Chromosomes and Cancer. 48:55–68. 2009.
View Article : Google Scholar : PubMed/NCBI
|
|
8
|
Haruki S, Imoto I, Kozaki K, Matsui T,
Kawachi H, Komatsu S, Muramatsu T, Shimada Y, Kawano T and Inazawa
J: Frequent silencing of protocadherin 17, a candidate tumour
suppressor for esophageal squamous-cell carcinoma. Carcinogenesis.
31:1027–1036. 2010. View Article : Google Scholar : PubMed/NCBI
|
|
9
|
Ying J, Gao Z, Li H, Srivastava G, Murray
PG, Goh HK, Lim CY, Wang Y, Marafioti T, Mason DY, et al: Frequent
epigenetic silencing of protocadherin 10 by methylation in multiple
haematologic malignancies. Br J Haematol. 136:829–832. 2007.
View Article : Google Scholar : PubMed/NCBI
|
|
10
|
Hayashi E, Takata K, Sato Y, Tashiro Y,
Tachiyama Y, Sawada-Kitamura S, Hiramatsu Y, Sugiguchi S, Nose S,
Hirokawa M, et al: Distinct morphologic, phenotypic, and
clinical-course characteristics of indolent peripheral T-cell
lymphoma. Hum Pathol. 44:1927–1936. 2013. View Article : Google Scholar : PubMed/NCBI
|
|
11
|
Livak KJ and Schmittgen TD: Analysis of
relative gene expression data using real-time quantitative PCR and
the 2(−Delta Delta C(T)) Method. Methods. 25:402–408. 2001.
View Article : Google Scholar : PubMed/NCBI
|
|
12
|
Takata K, Sato Y, Nakamura N, Tokunaka M,
Miki Y, Kikuti Y Yukie, Igarashi K, Ito E, Harigae H, Kato S, et
al: Duodenal follicular lymphoma lacks AID but expresses BACH2 and
has memory B-cell characteristics. Mod Pathol. 26:22–31. 2013.
View Article : Google Scholar : PubMed/NCBI
|
|
13
|
Curtin JF and Cotter TG: Live and let die:
Regulatory mechanisms in Fas-mediated apoptosis. Cell Signal.
15:983–992. 2003. View Article : Google Scholar : PubMed/NCBI
|
|
14
|
Zheng L, Sharma R, Gaskin F, Fu SM and Ju
ST: A novel role of IL-2 in organ-specific autoimmune inflammation
beyond regulatory T cell checkpoint: Both IL-2 knockout and Fas
mutation prolong lifespan of Scurfy mice but by different
mechanisms. J Immunol. 179:8035–8041. 2007. View Article : Google Scholar : PubMed/NCBI
|
|
15
|
Leich E, Salaverria I, Bea S, Zettl A,
Wright G, Moreno V, Gascoyne RD, Chan WC, Braziel RM, Rimsza LM, et
al: Follicular lymphomas with and without translocation t(14;18)
differ in gene expression profiles and genetic alterations. Blood.
114:826–834. 2009. View Article : Google Scholar : PubMed/NCBI
|
|
16
|
Masir N, Campbell LJ, Goff LK, Jones M,
Marafioti T, Cordell J, Clear AJ, Lister TA, Mason DY and Lee AM:
BCL2 protein expression in follicular lymphomas with t(14;18)
chromosomal translocations. Br J Haematol. 144:716–725. 2009.
View Article : Google Scholar : PubMed/NCBI
|
|
17
|
Zamo A, Erdini F, Malerba G and Chilosi M:
Lack of expression of TUBB3 characterizes both BCL2-positive and
BCL2-negative follicular lymphoma. Mod Pathol. 27:808–813. 2014.
View Article : Google Scholar : PubMed/NCBI
|
|
18
|
Wu Y, Guo E, Yu J, Xie Q and Chen J: High
DcR3 expression predicts stage pN2 in gastric cancer.
Hepatogastroenterology. 54:2172–2176. 2007.PubMed/NCBI
|
|
19
|
Connor JP and Felder M: Ascites from
epithelial ovarian cancer contain high levels of functional decoy
receptor 3 (DcR3) and is associated with platinum resistance.
Gynecol Oncol. 111:330–335. 2008. View Article : Google Scholar : PubMed/NCBI
|
|
20
|
Weissinger D, Tagscherer KE,
Macher-Göppinger S, Haferkamp A, Wagener N and Roth W: The soluble
Decoy Receptor 3 is regulated by a PI3K-dependent mechanism and
promotes migration and invasion in renal cell carcinoma. Mol
Cancer. 12:1202013. View Article : Google Scholar : PubMed/NCBI
|
|
21
|
Bedewy AM, Elgammal MM, Bedewy MM and
El-Maghraby SM: Assessing DcR3 expression in relation to survivin
and other prognostic factors in B cell non-Hodgkin's lymphoma. Ann
Hematol. 92:1359–1367. 2013. View Article : Google Scholar : PubMed/NCBI
|