Introduction
Urolithiasis is a common urological disease that has
a high recurrence rate (1). The
incidence of urolithiasis in China is between 1 and 10%. As calcium
oxalate stones are present in 80–90% of cases, there is marked
interest in elucidating the mechanisms underlying the formation of
these stones. MicroRNAs (miRNAs) are a type of small non-coding
RNA, that functions to silence mRNA expression and the
post-transcriptional regulation of gene expression through
base-pairing with complementary sequences within target mRNA
molecules (2,3). miRNAs target mRNA sequences for
cleavage and inhibit translation by binding to the 3′-untranslated
region of target mRNAs (4). It is
estimated that >30% of protein-encoding gene translation is
regulated by miRNAs (5). However,
to the best of our knowledge, no studies have investigated an
association between miRNAs and the development of hyperoxaluria (a
form of urolithiasis) in vivo. The present study
hypothesized that the deregulation of miRNA expression may
partially elicit cytotoxic effects in the kidneys. To the best of
our knowledge, this is the first study that has investigated the
miRNA expression profiles underlying formation in kidney tissues
in vivo. The aim of the present study was to determine the
differences in the miRNA expression profiles between hyperoxaluric
rats and normal rats using miRNA microarray technology and reverse
transcription-quantitative polymerase chain reaction (RT-qPCR)
analysis, and to examine the interaction of miRNAs and genes using
gene ontology (GO) and pathway analysis. The results may provide an
insight into the mechanisms underlying the pathogenesis of calcium
oxalate stone formation.
Materials and methods
Animal models
A total of 20 male Sprague-Dawley rats (275–300 g)
were obtained from the Animal Experimental Center of Tongji Medical
College, Huazhong University of Science and Technology (Wuhan,
China), and were acclimated to 12 h light/dark cycles at 23°C for 1
week prior to the start of experiments in a specific pathogen-free
animal house with a relative humidity of 45–55%. Rats were
maintained on a diet consisting of standard laboratory chow (Wuhan
WanQianJiaXing Bio-Technology Co., Ltd., Wuhan, China) and had free
access to the food. Rats were randomly divided into two equal
groups of 10; the experimental (EXP) and control (CON) groups. Rats
in the EXP group had free access to drinking water containing 1%
(v/v) ethylene glycol and 0.5% ammonium chloride for a period of
two weeks in order to induce hyperoxaluria. Rats in the CON group
were provided with tap water for two weeks. At this point, urine
specimens were collected from rats at 24-h intervals using a
metabolism cage, and ion chromatography (883 Basic IC plus; Metrohm
AG, Herisau, Switzerland) was performed to evaluate oxalate levels
according to the methods described previously (6). A total of three rats exhibited
relatively high concentrations of urine oxalate levels, and all
rats were anesthetized by intraperitoneal injection of
pentobarbital (40 mg/kg) prior to surgery. Rats were placed in a
supine position, and the kidneys were removed before they were
sacrificed by neck dislocation under anesthesia at the end of
surgery. Kidney tissues were fixed with 4% paraformaldehyde (cat.
no. G1101; Wuhan Goodbio technology Co., Ltd., Hubei, China),
paraffin-embedded and divided into 4-µm sections, before they were
subject to von Kossa staining by treating with 2% silver nitrate
and 5% sodium thiosulfate according to the standard staining
protocol. Kidney tissues were then visualized using an inverted
light microscope (IX71; Olympus Corporation, Tokyo, Japan). The
present study was conducted in strict accordance with the Guide for
the Care and Use of Laboratory Animals of the National Institute of
Health (NIH publication no. 85–23, 1985) (7). Experiments were approved by the
Tongji Medical College Council on the Animal Care Committee of
Huazhong University of Science and Technology (Wuhan, China).
Surgeries were performed under sodium pentobarbital anesthesia, and
every effort was made to minimize suffering.
RNA isolation
Kidneys were removed, washed in several volumes of
RNase-free water, decapsulated, and stored overnight at 4°C in 5
volumes of RNAwait (Beijing Solarbio Science and Technology, Co.,
Ltd., Beijing, China). Samples were preserved at −80°C. RNA was
extracted using the miRNeasy Mini kit (Qiagen, GmbH, Hilden,
Germany) according to the manufacturer's instructions. RNA quality
was determined using a NanoDrop ND-1000 Spectrophotometer (NanoDrop
Technologies; Thermo Fisher Scientific, Inc., Waltham, MA,
USA).
miRNA microarray analysis
The Affymetrix GeneChip miRNA 4.0 array (Affymetrix,
Inc., Santa Clara, CA, USA), which contains 728 rat miRNAs, was
employed for the purposes of this study (Genminix Informatics Co.
Ltd., Shanghai, China). Total RNA (1 µg) from each sample was
labeled with biotin using the Genisphere FlashTag™ Biotin HSR RNA
Labeling for Affymetrix GeneChip miRNA array kit (Genisphere, Inc.,
Hatfield, PA, USA). Labeled miRNA was hybridized to the array for
16 h at 48°C using a plate shaker at 60 rpm. The GeneChip was
scanned using the Hewlett-Packard GeneArray Scanner G3000 7G
(Hewlett-Packard, Palo Alto, CA, USA). Expression data were
analyzed using the Affymetrix Expression Console software (version,
1.3.1; Affymetrix, Inc.) and normalized with the robust multiarray
averaging method (8). In order to
compare miRNA expression levels between EXP and CON groups, the
random variance model (RVM) t-test was applied to identify
differentially expressed genes. This is due to the fact that the
RVM t-test increases the degrees of freedom when there is a
small sample size. Following significant difference and false
discovery rate (FDR) analyses, the differentially expressed genes
were selected according to the P-value threshold, where P<0.05
was considered to indicate a significant difference (9,10).
The results of the miRNA microarray analysis were deposited in the
NCBI Gene Expression Omnibus data repository (GEO; series accession
number, GSE72135).
RT-qPCR analysis
The expression of differentially expressed miRNAs
identified by the microarray analysis, was verified using RT-qPCR
analysis. Pre-designed stem-loop miRNA RT-qPCR primer sets that
detect miR-214-3p, miR-146b-5p, miR-31a-5p, miR-369-5p and
miR-141-5p expression levels, were purchased from Invitrogen
(Thermo Fisher Scientific, Inc.; Table
I). Total RNA was reverse transcribed using the RevertAid First
Strand cDNA Synthesis kit (cat. no. K1622; Thermo Fisher
Scientific, Inc.) according to the manufacturer's instructions.
qPCR was performed using SYBR Green I (Invitrogen; Thermo Fisher
Scientific, Inc.) and the CFX96™ Real-Time System (Bio-Rad
Laboratories, Inc., Hercules, CA, USA). Target miRNA expression
levels were quantified relative to U6 expression levels. qPCR was
performed in a reaction volume of 20 µl consisting of 10 µl SYBR
green mix (Beijing Novogene Bioinformatics Technology Co., Ltd.,
Beijing, China), 2 µl cDNA, 0.8 µl primers and 7.2 µl
diethylpyrocarbonate double-distilled H2O. Reaction mixtures were
incubated in eight-strip tubes for 10 min at 95°C, followed by 40
cycles of 90°C for 5 sec, 60°C for 30 sec and 4°C indefinitely.
Target miRNA levels were quantified using the 2-ΔΔCq method
(11). For each target gene,
samples were analyzed in triplicate.
 | Table I.Primer sequences. |
Table I.
Primer sequences.
| Gene ID | Primer | Sequence
(5′→3′) |
|---|
| rno-miR-212-3p |
rno-miR-212-3p-R |
CTCAACTGGTGTCGTGGAGTCGGCAATTCAGTTGAGTGGCCGTG |
|
|
rno-miR-212-3p-F |
TAACAGTCTCCAGTCACGGCCA |
| rno-miR-212-5p |
rno-miR-212-5p-R |
CTCAACTGGTGTCGTGGAGTCGGCAATTCAGTTGAGCAGTAAGC |
|
|
rno-miR-212-5p-F |
GGACCTTGGCTCTAGACTGCTTACTG |
| rno-miR-34c-5p |
rno-miR-34c-5p-R |
CTCAACTGGTGTCGTGGAGTCGGCAATTCAGTTGAGGCAATCAG |
|
|
rno-miR-34c-5p-F |
GGAGGCAGTGTAGTTAGCTGATTGC |
| rno-miR-369-5p |
rno-miR-369-5p-R |
CTCAACTGGTGTCGTGGAGTCGGCAATTCAGTTGAGGCGAATAT |
|
|
rno-miR-369-5p-F |
CTGGGAGATCGACCGTGTTATATTCGC |
| rno-miR-187-3p |
rno-miR-187-3p-R |
CTCAACTGGTGTCGTGGAGTCGGCAATTCAGTTGAGCCGGCTGC |
|
|
rno-miR-187-3p-F |
TCGTGTCTTGTGTTGCAGCCGG |
| rno-miR-672-3p |
rno-miR-672-3p-R |
CTCAACTGGTGTCGTGGAGTCGGCAATTCAGTTGAGTCGAAGAT |
|
|
rno-miR-672-3p-F |
GGACACACAGTCGCCATCTTCGA |
| rno-miR-141-5p |
rno-miR-141-5p-R |
CTCAACTGGTGTCGTGGAGTCGGCAATTCAGTTGAGCAACACTG |
|
|
rno-miR-141-5p-F |
CTGGGTCCATCTTCCAGTGCAGTGTTG |
| U6 | U6-R |
CGCTTCACGAATTTGCGTGTCAT |
|
| U6-F |
GCTTCGGCAGCACATATACTAAAAT |
Target prediction and function
analysis
GO terms (www.geneontology.org) and the Kyoto Encyclopedia of
Genes and Genomes (KEGG; www.genome.jp/kegg/) pathway annotation databases were
employed to identify potential miRNA target genes and provide an
insight into the function of miRNAs. GO analysis was conducted to
organize genes into hierarchical categories and determine the
miR-gene regulatory network (12).
GOs with a P-value of <0.001 and with a FDR of <0.05 were
selected Fisher's exact test was then used to provide the P-value
for each GO term, which represented the probability that the
observed counts may have been due to chance. In addition, pathway
analysis was utilized to identify potential pathways of the
differentially expressed genes, using the KEGG database. In order
to identify enriched pathways, Fisher's exact test and the χ2-test
were performed, and the threshold for significance was defined by
P<0.001 and FDR<0.05 (13,14).
miRNA-gene network analysis
Differentially expressed miRNA target genes in
significant GO and pathway categories were analyzed using miRNA
target gene network analysis. In order to establish a miRNA-gene
network, the association between miRNAs and potential target genes
was determined by their differential expression values and
predicted interactions using the Sanger miRBase database
(http://www.mirbase.org/). If a potential
correlation between a miRNA and specific target genes existed, the
results were classified as ‘a miRNA targets a gene’ or ‘a gene
contains a predicted binding site for a miRNA’. ‘Degree’
represented the association between ‘a miRNA and target genes’ or
‘a gene and miRNAs’ in the network. Briefly, a high degree
indicated a more important role in the network. The center of the
network was represented by the degree of contribution of one miRNA
to the surrounding genes or the contribution of one gene to the
surrounding miRNAs. Critical miRNAs in the network invariably had
the highest degrees (15–17).
Results
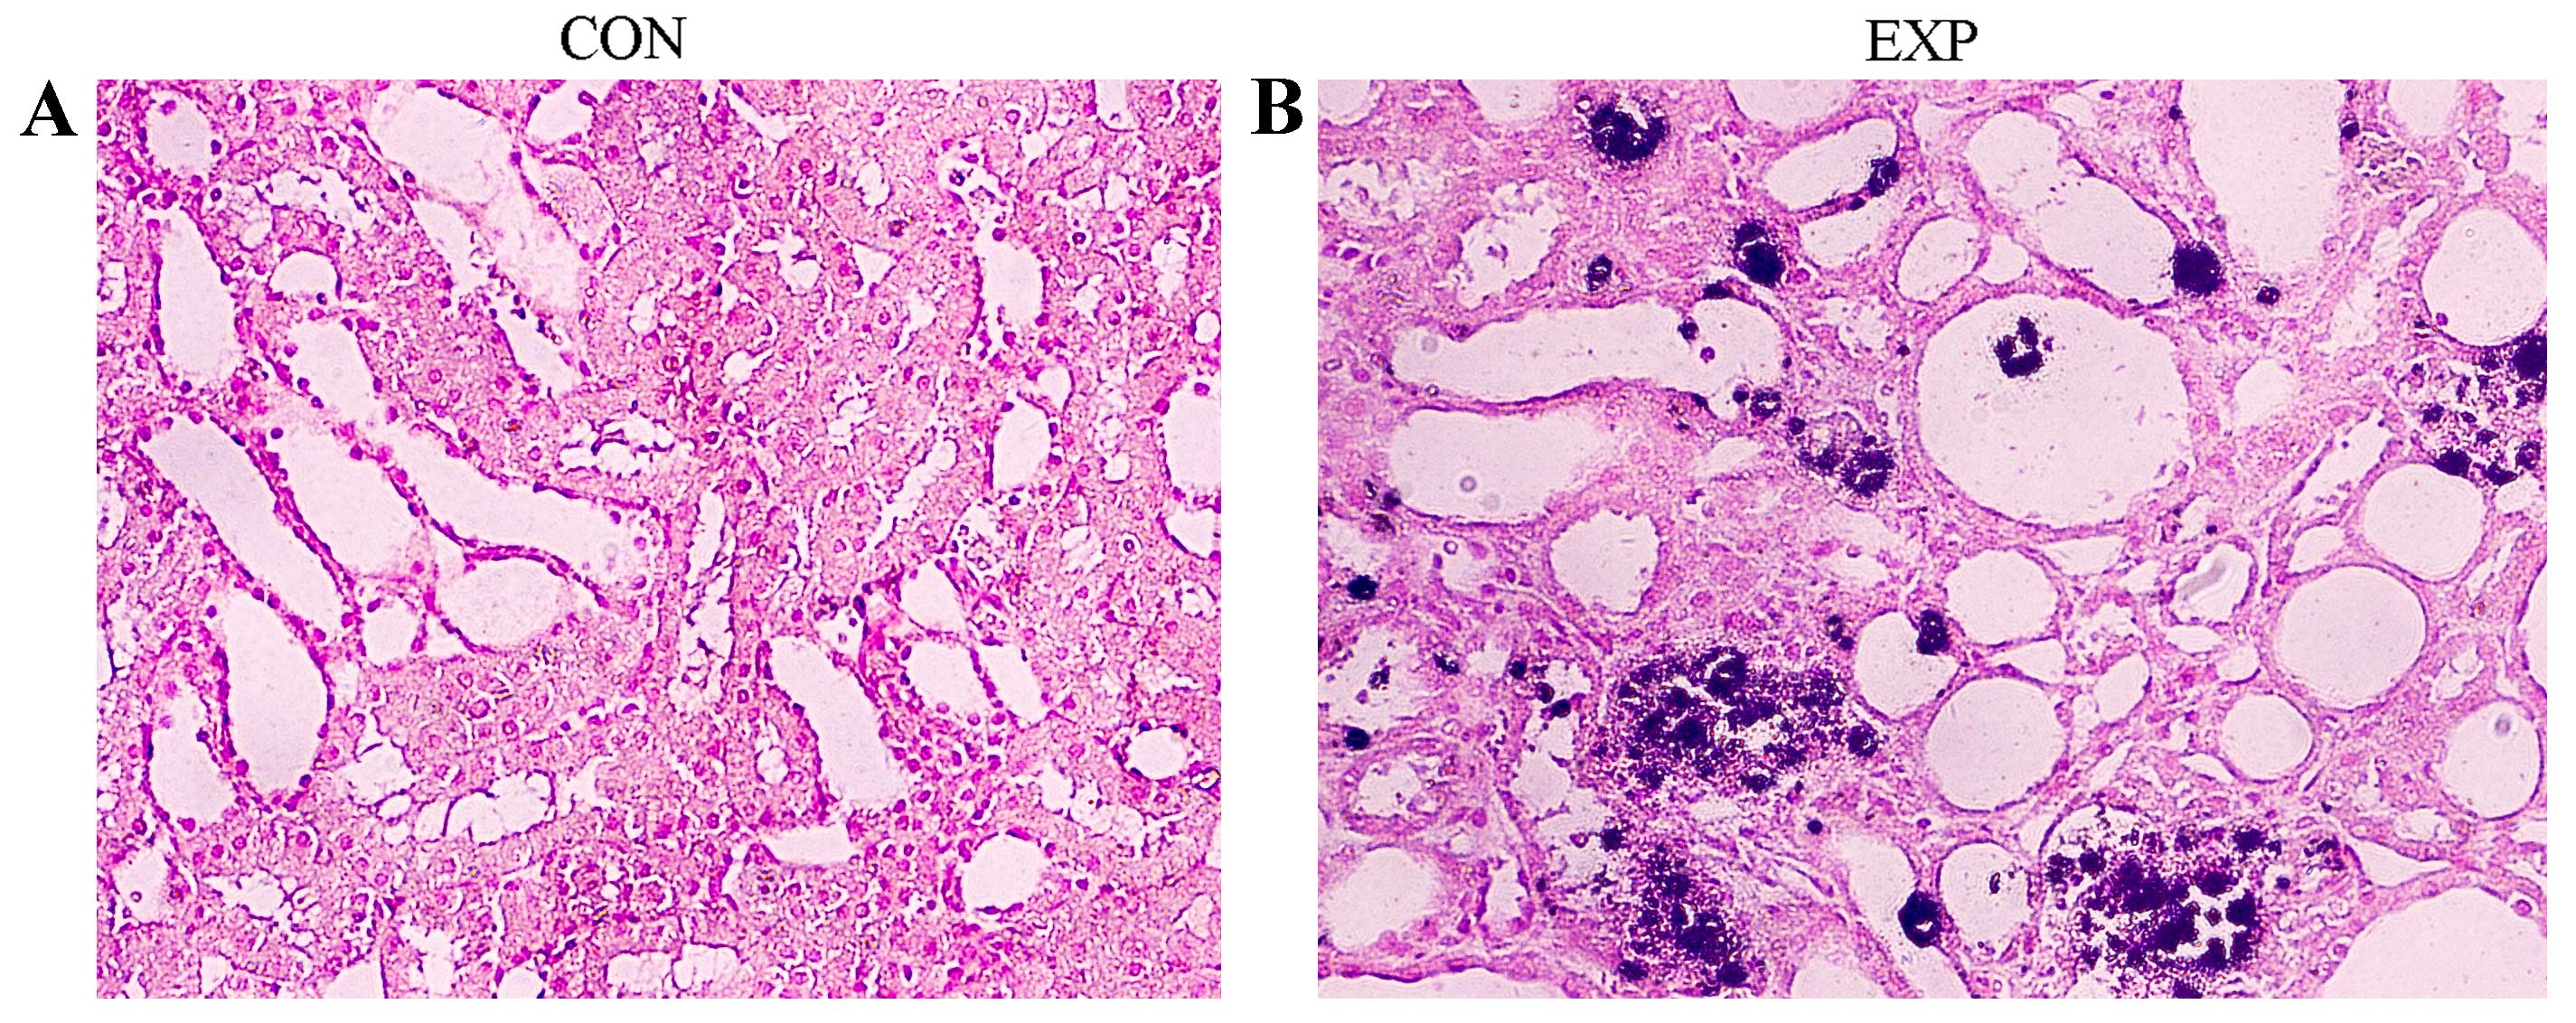
Renal tissue samples from the CON
group indicated higher levels of oxalate
As presented in Fig.
1, the renal tissues derived from rats in the EXP group were
pale with numerous visible calcium oxalate deposits. Rat renal
tissues from EXP and CON groups were stained using the von Kossa
method and calculus crystals were stained brown-black. Microscopic
examination revealed that crystals were more abundant in the EXP
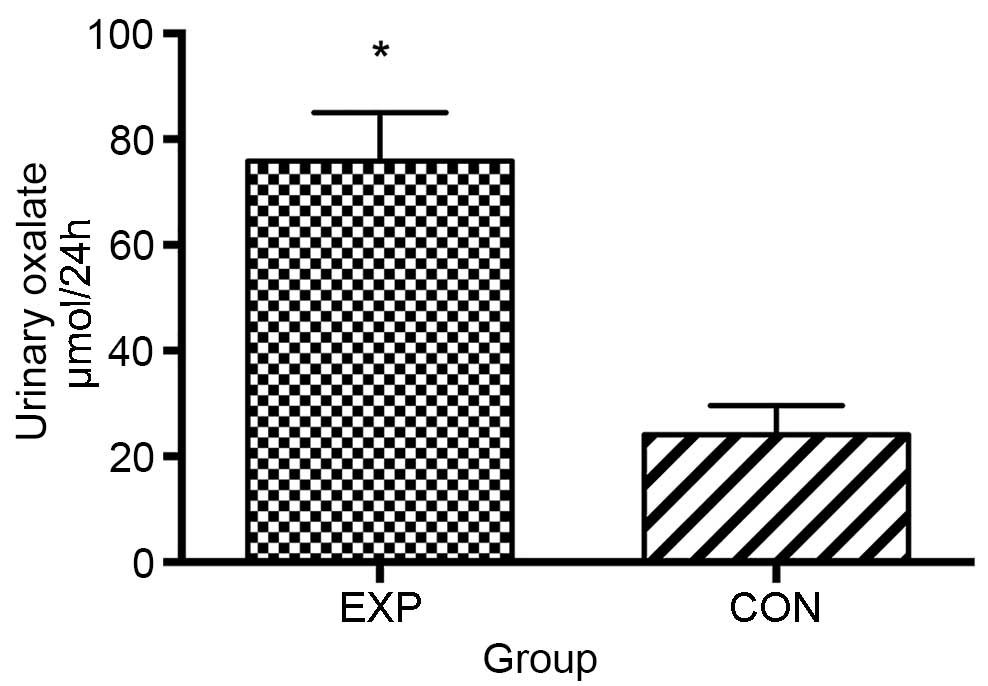
group compared with the CON group (Fig. 1). In addition, rats from the EXP
group exhibited significantly higher levels of oxalate in the urine
compared with those from the CON group (P<0.01; Fig. 2).
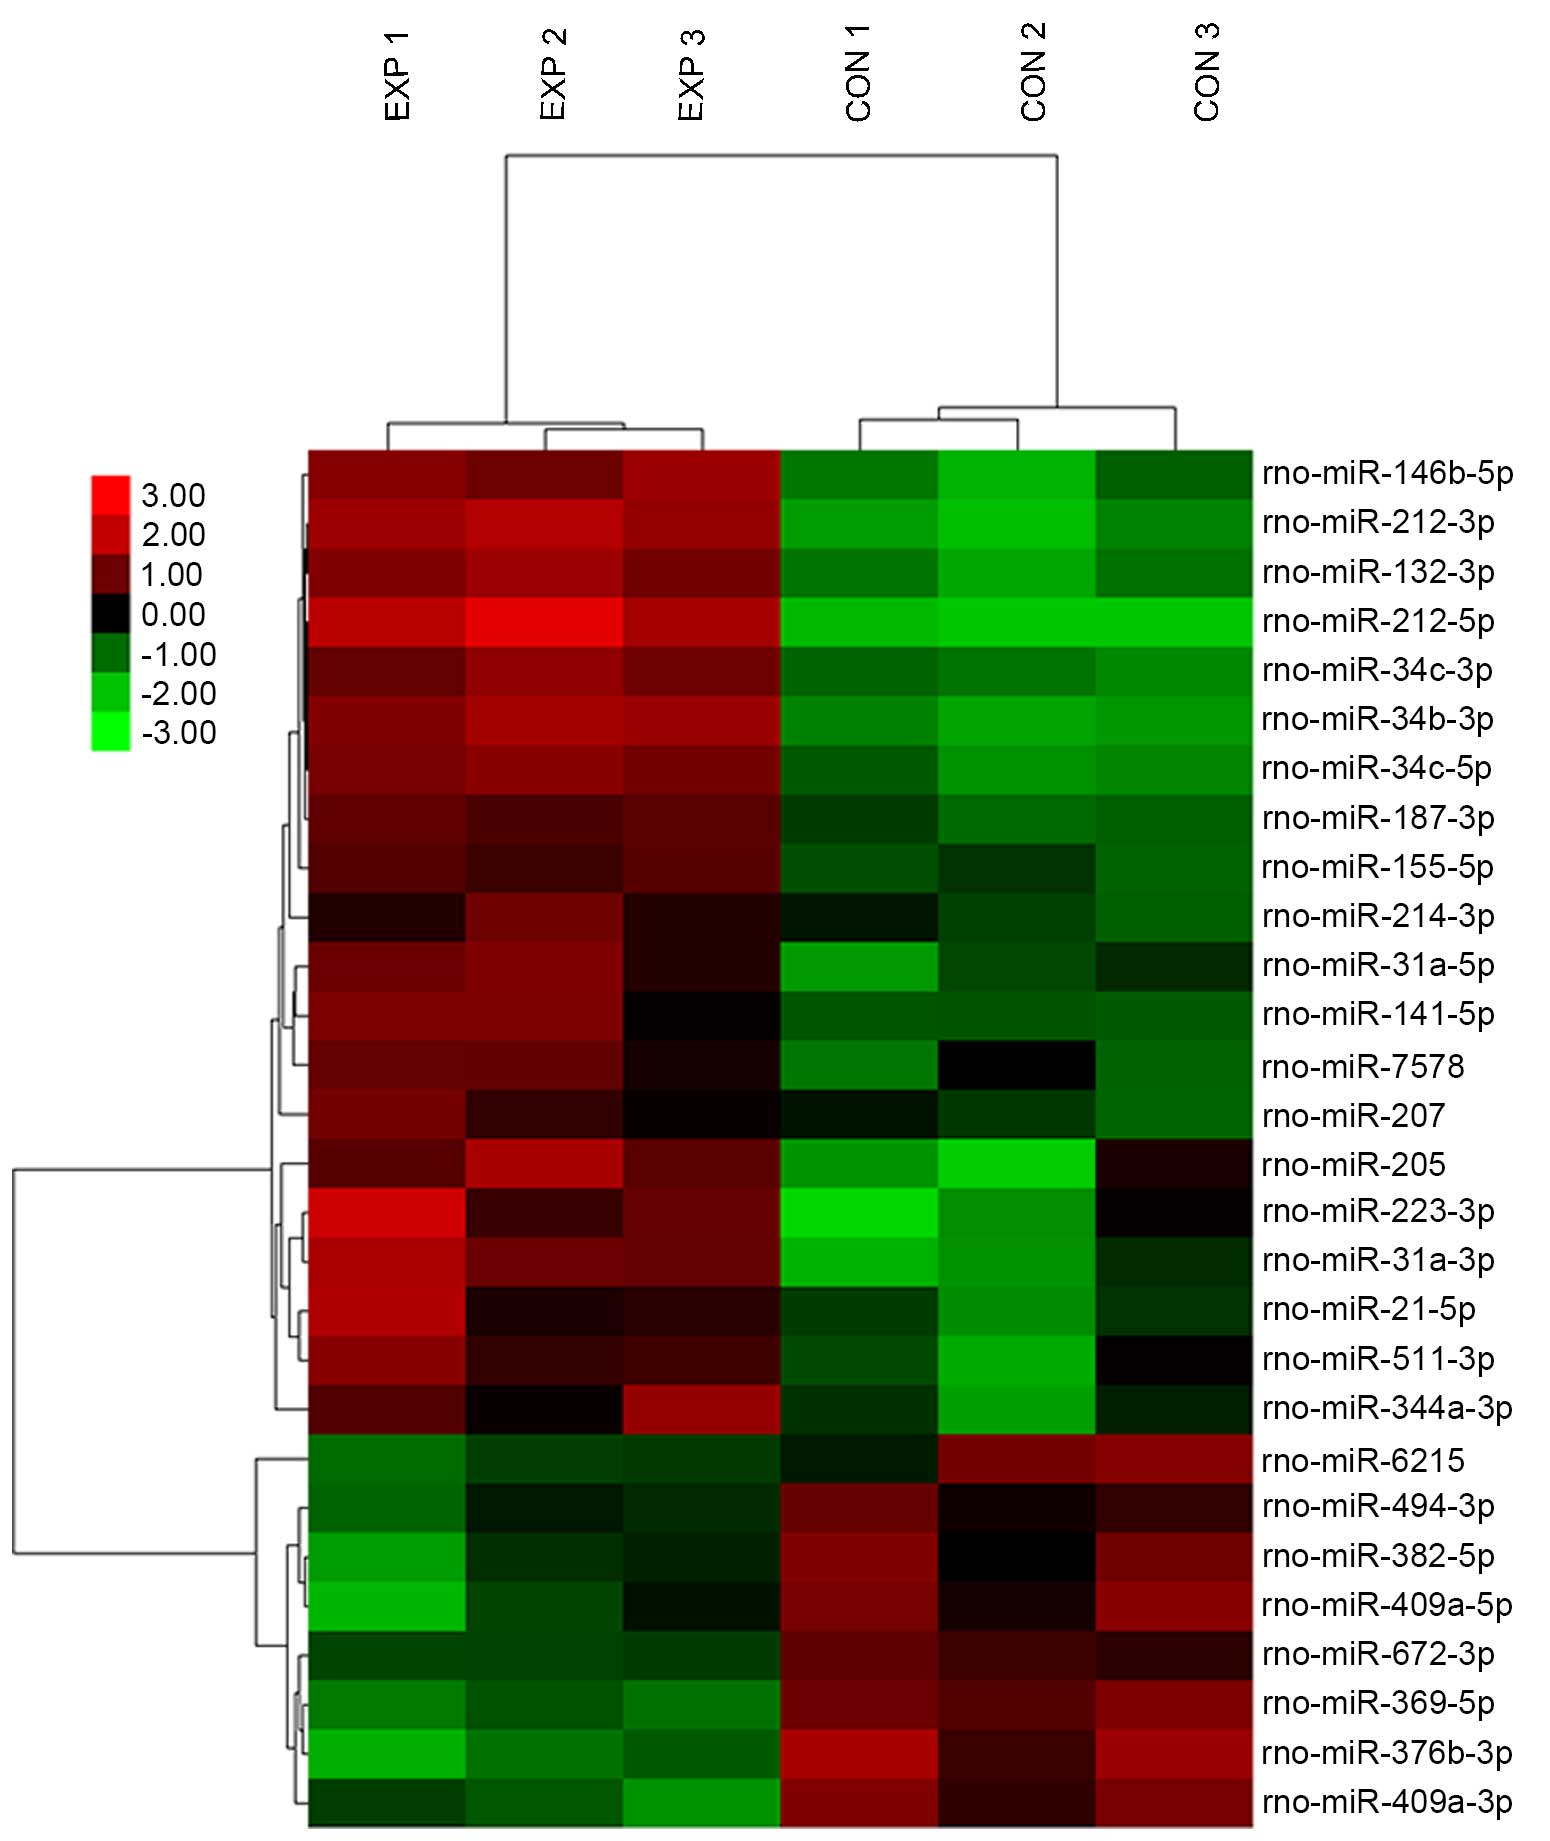
The miRNA expression profiles in the
renal tissues of hyperoxaluric rats were altered
Hyperoxaluric rats following treatment with 1%
ethylene glycol and 0.5% ammonium chloride, exhibited markedly
altered expression profiles of miRNA in renal tissues compared with
the normal controls (Fig. 3). A
total of 28 miRNAs were differentially expressed, with a >2-fold
change in expression between EXP and CON groups (Table II). Out of these, 20 miRNAs were
upregulated (>0.5–2-fold change) and 8 miRNAs were downregulated
(≤0.5-fold change). The results of the hierarchical cluster
analysis of differentially expressed miRNAs between EXP and CON
groups are presented in Fig.
3.
| Table II.miRNAs that were differentially
expressed with a >2-fold change. |
Table II.
miRNAs that were differentially
expressed with a >2-fold change.
| Probe ID | Fold-change
(EXP/CON) |
|---|
| Upregulated |
|
|
rno-miR-212-5p | 15.54 |
|
rno-miR-212-3p |
8.75 |
|
rno-miR-34b-3p |
7.28 |
|
rno-miR-132-3p |
5.82 |
|
rno-miR-146b-5p |
5.77 |
|
rno-miR-223-3p |
5.28 |
|
rno-miR-31a-3p |
5.19 |
|
rno-miR-34c-5p |
5.02 |
|
rno-miR-34c-3p |
4.64 |
|
rno-miR-205 |
4.56 |
|
rno-miR-31a-5p |
3.19 |
|
rno-miR-187-3p |
3.05 |
|
rno-miR-141-5p |
3.01 |
|
rno-miR-21-5p |
2.96 |
|
rno-miR-511-3p |
2.92 |
|
rno-miR-344a-3p |
2.83 |
|
rno-miR-155-5p |
2.66 |
|
rno-miR-7578 |
2.54 |
|
rno-miR-214-3p |
2.17 |
|
rno-miR-207 |
2.10 |
| Downregulated |
|
|
rno-miR-494-3p |
0.48 |
|
rno-miR-672-3p |
0.43 |
|
rno-miR-6215 |
0.37 |
|
rno-miR-382-5p |
0.35 |
|
rno-miR-409a-5p |
0.30 |
|
rno-miR-409a-3p |
0.27 |
|
rno-miR-369-5p |
0.25 |
|
rno-miR-376b-3p |
0.18 |
RT-qPCR analysis verified the array
results
In order to validate the results obtained from the
miRNA microarray analysis, RT-qPCR analysis was conducted to
determine the expression of five differentially expressed miRNAs,
including miR-214-3p, miR-146b-5p, miR-31a-5p, miR-369-5p and
miR-141-5p, and the results from microarray and RT-qPCR were
subsequently compared. RT-qPCR analysis demonstrated that
miR-214-3p, miR-146b-5p, miR-31a-5p were upregulated, while
miR-369-5p and miR-141-5p were downregulated. These results were
comparable to those obtained by microarray analysis (Table II).
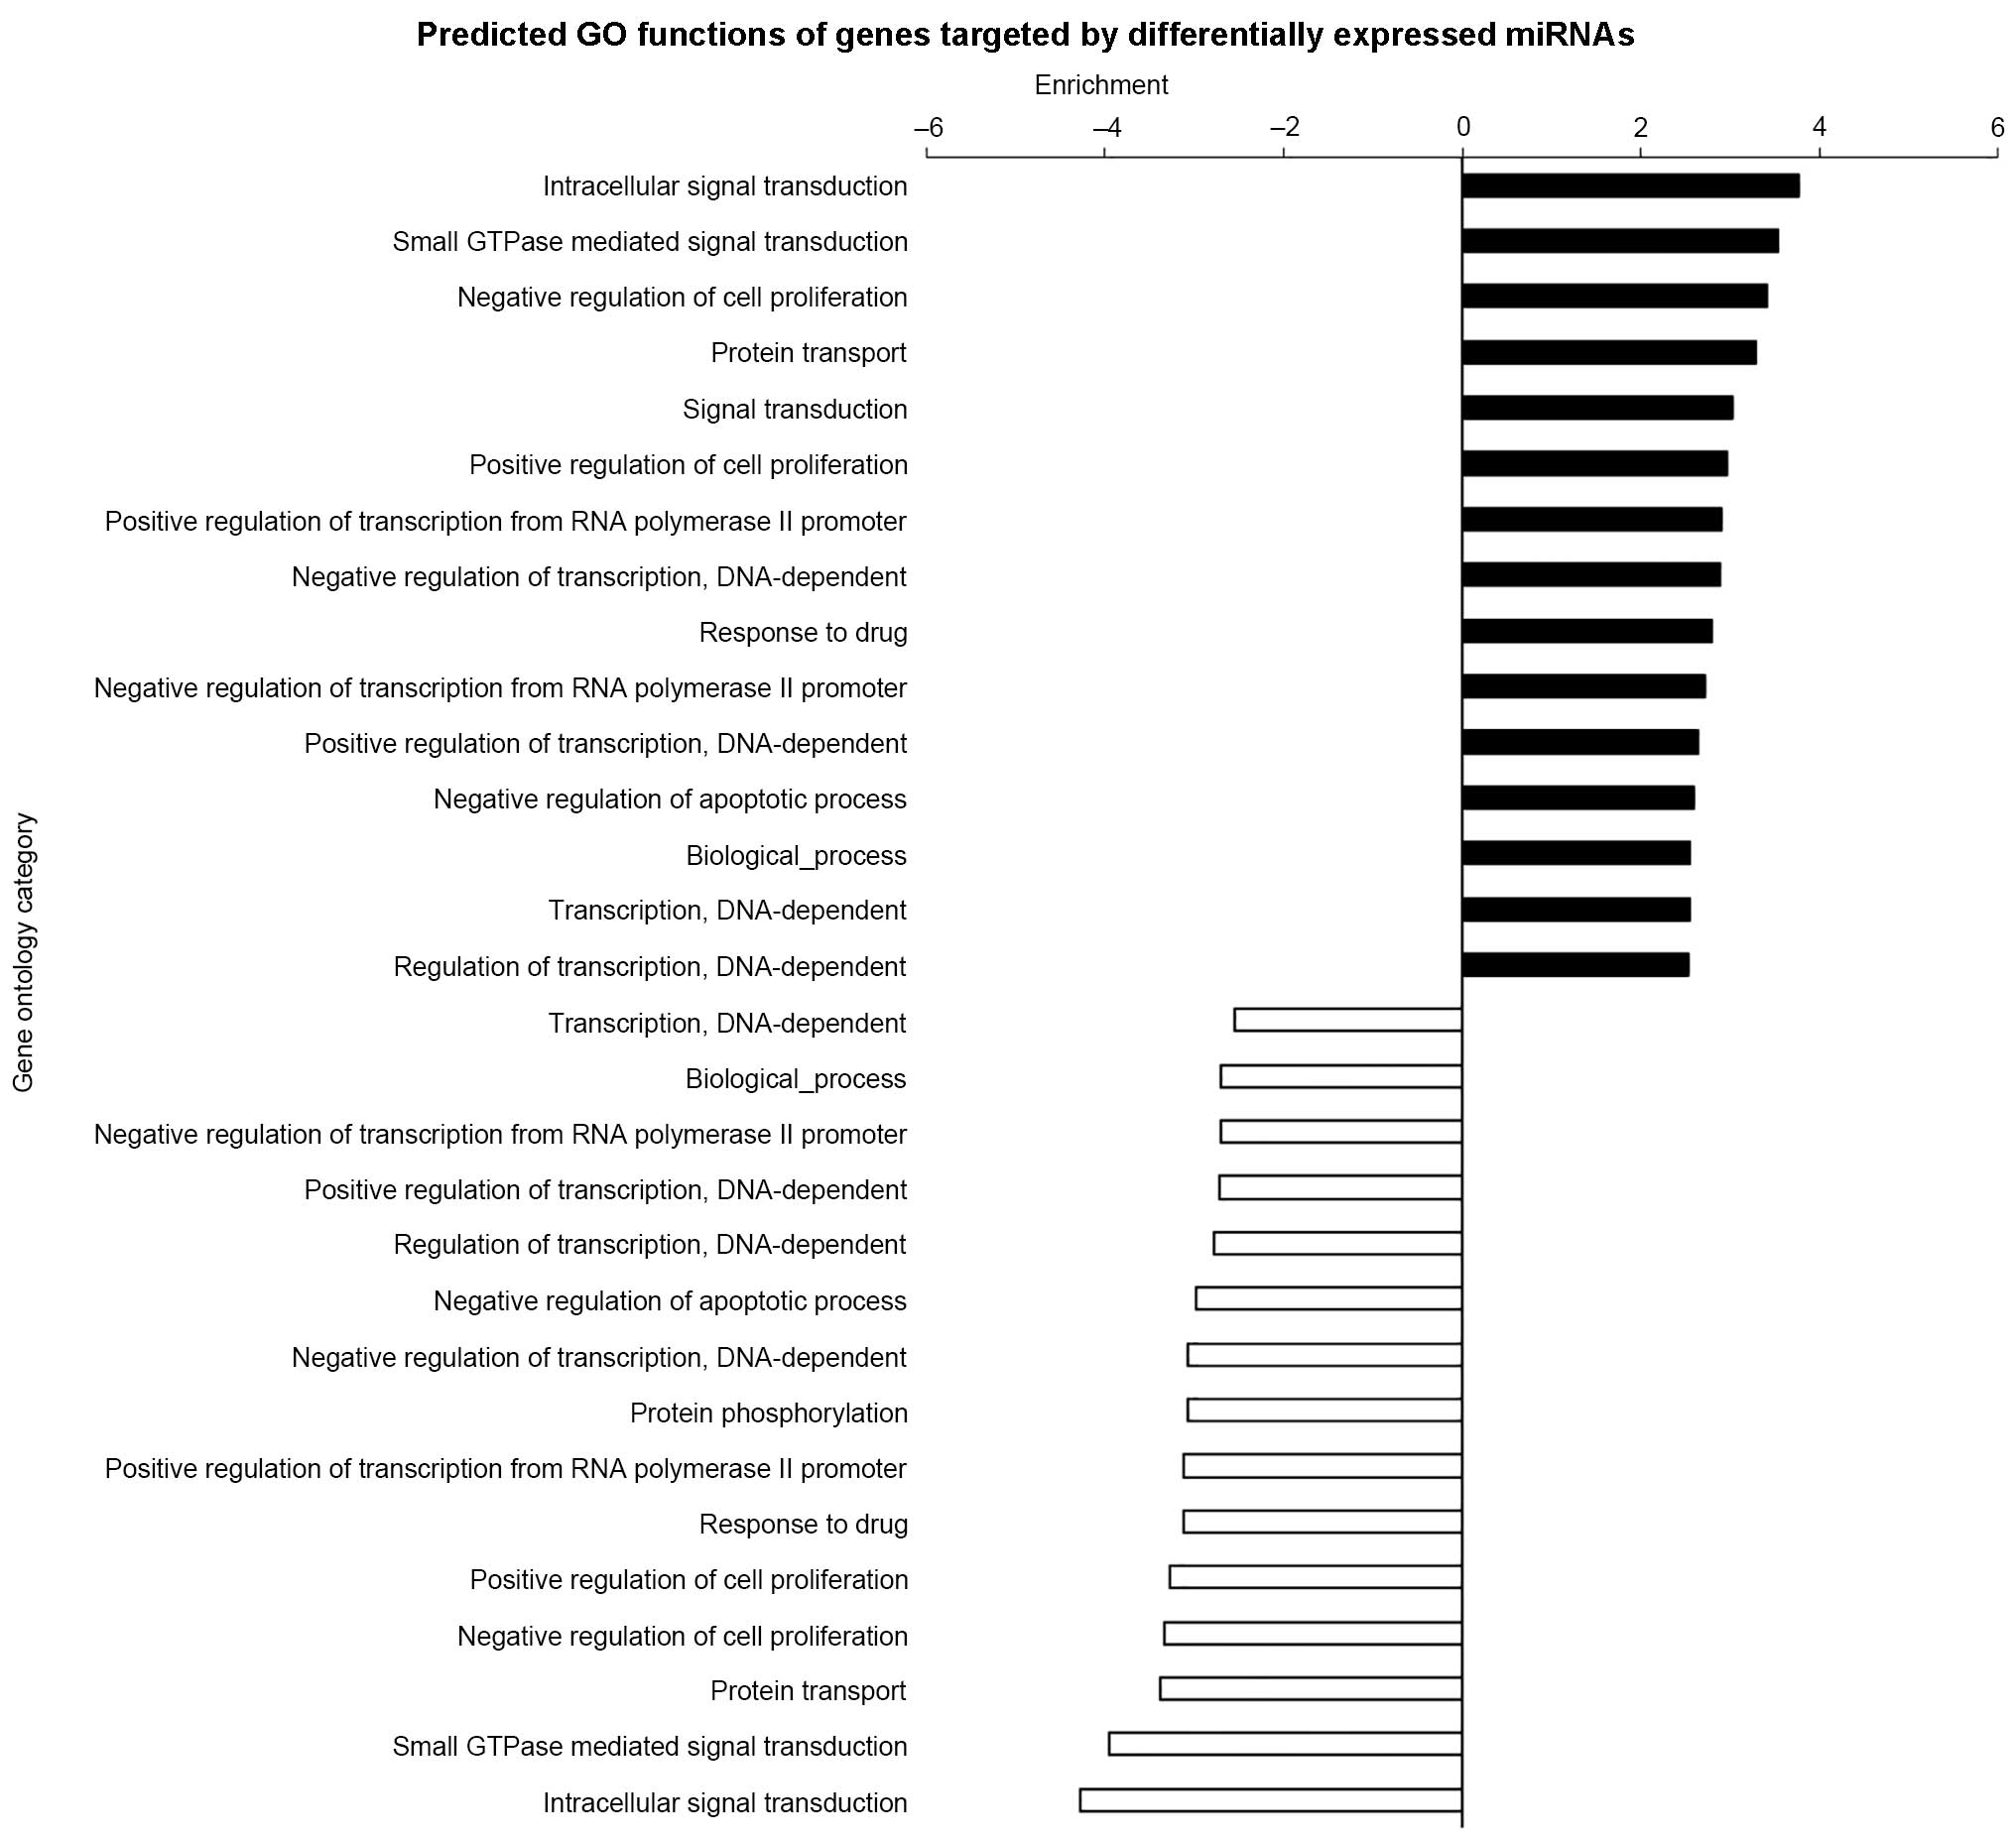
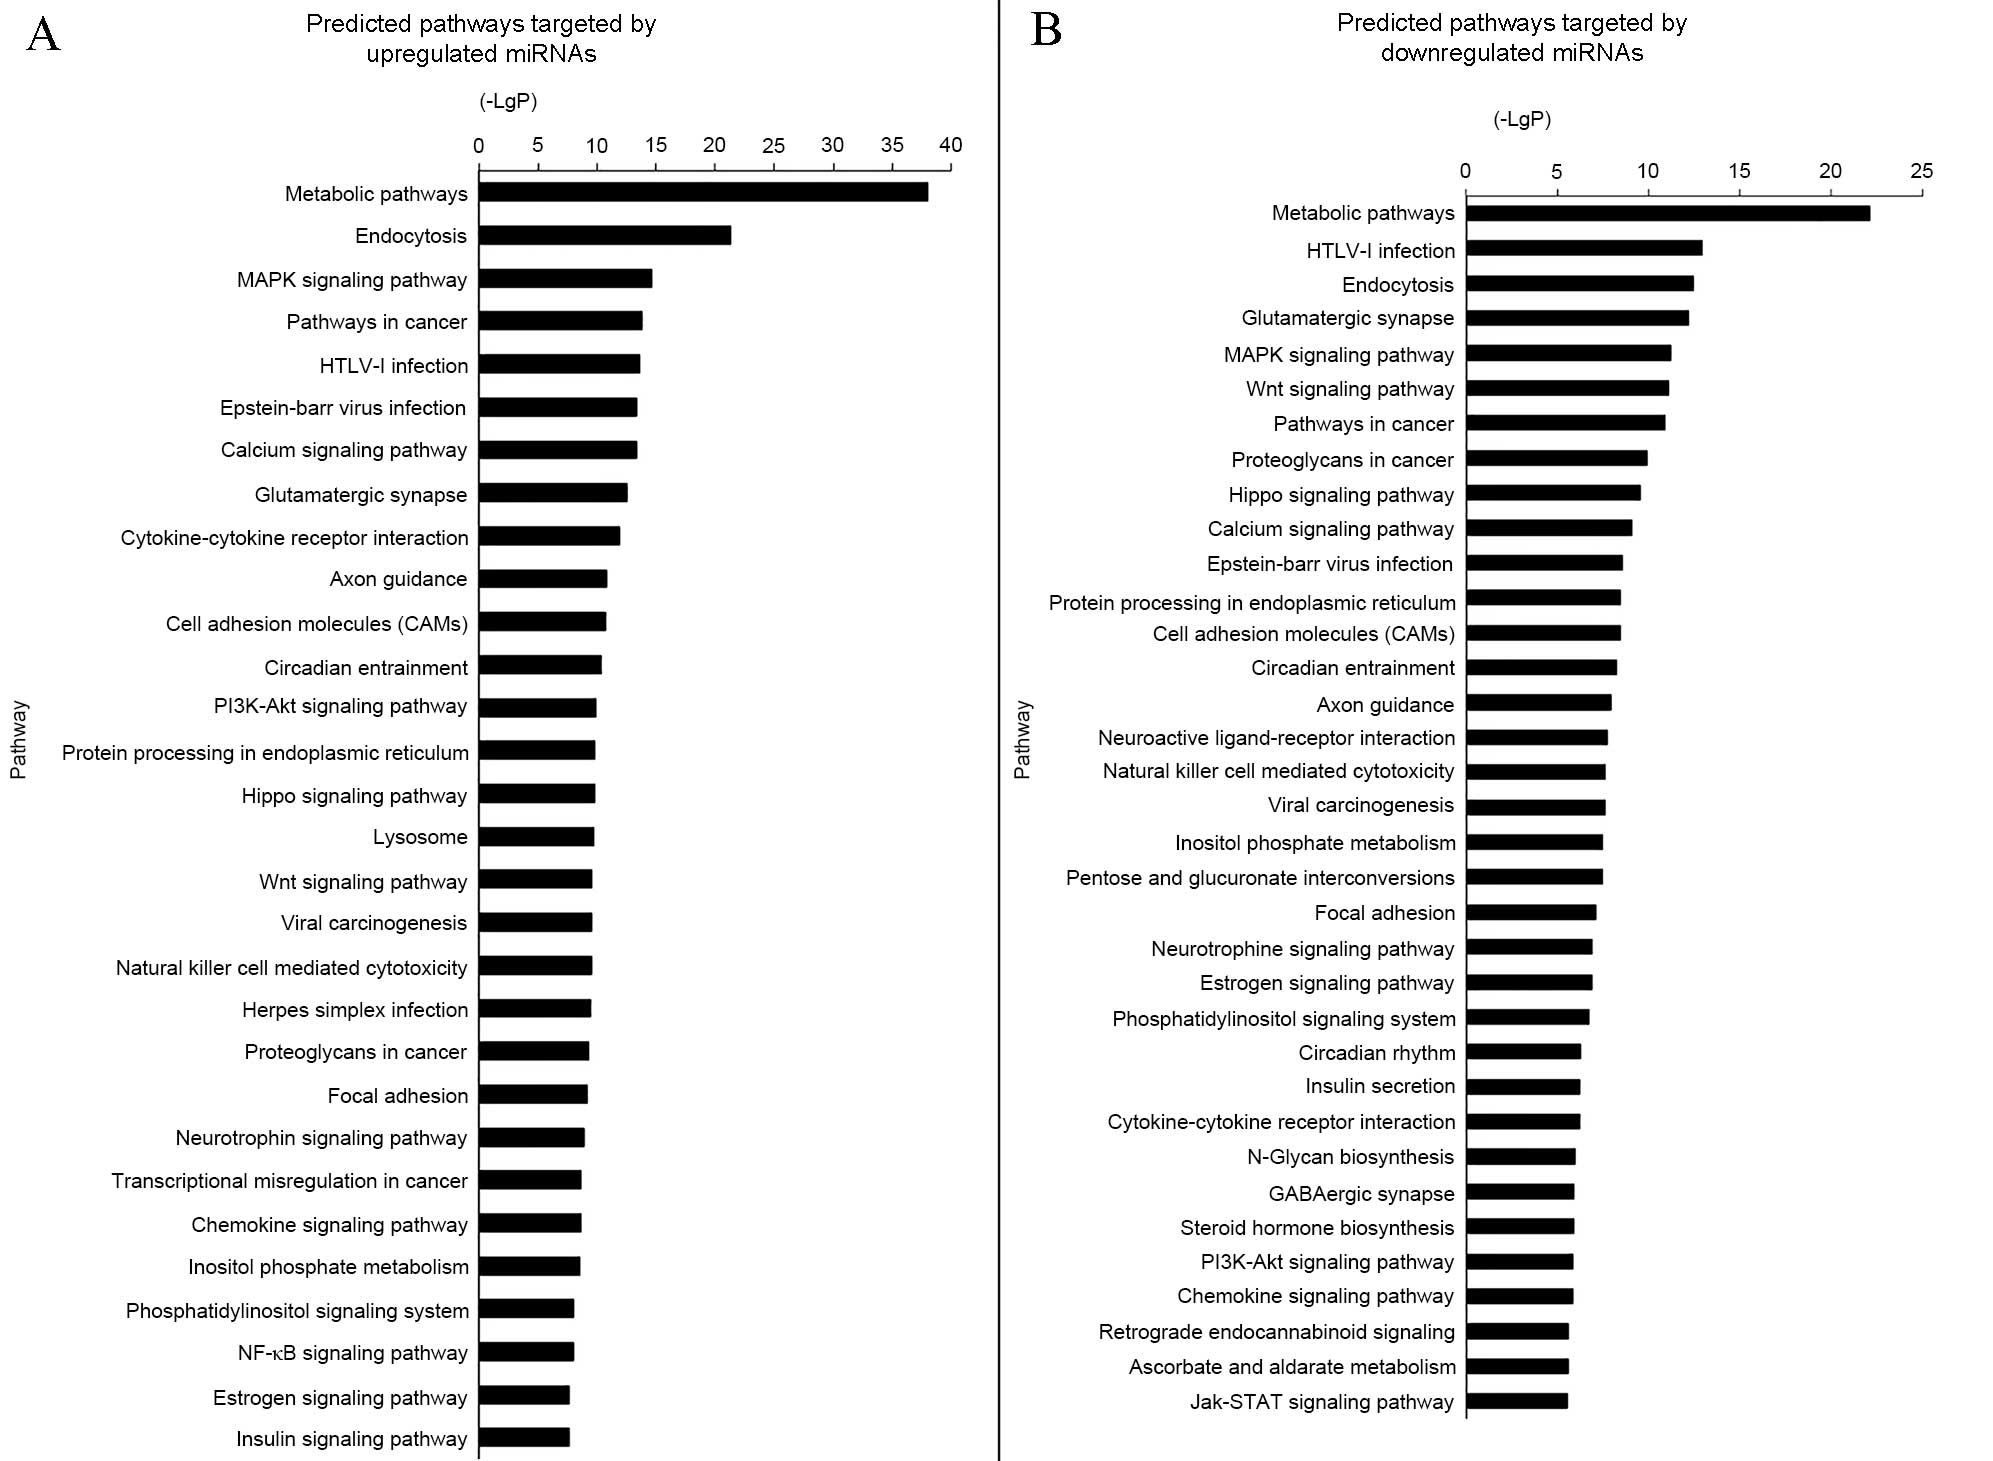
GO and pathway analysis demonstrated
miRNAs were involved in numerous functions
The GO threshold of significance was defined as
P<0.001 and FDR<0.05. A total of 1,070 GO enriched terms were
identified as predicted functions of overexpressed miRNAs and
included positive regulation of cell proliferation, cytokine
production, and apoptotic processes. By contrast, the 863
significant GO terms that were associated with downregulated miRNAs
included intracellular signal transduction and regulation of cell
proliferation. The significant functions and pathways are presented
in Figs. 5 and 6. According to the target analysis, a
number of critical biological functions, including intracellular
signal transduction, regulation of apoptotic processes and
regulation of cell proliferation, were observed to involve miRNAs.
Furthermore, the results of the pathway analysis suggest that these
miRNAs serve important roles in distinct biological processes, such
as the insulin signaling, mitogen-activated protein kinase (MAPK)
and phosphatidylinositol-3 kinase (PI3K)/Akt serine-threonine
kinase 1 (AKT) signaling pathways.
miRNA-gene network analysis
demonstrated 12 key miRNAs
A total of 12 miRNAs (Table III) demonstrated a high degree
score, which represents an important role in the miRNA-gene
network. These miRNAs were predicted to regulate Lipin 2, which is
a metabolism-associated gene, as well as and 17 additional genes
[degree ≥4; potassium inwardly-rectifying channel, subfamily J,
member 6 (Kcnj6), Tnf receptor-associated factor 3
(Traf3), transducin (β)-like 1 X-linked receptor 1,
serine/threonine kinase 4, Sp1 transcription factor, Dishevelled,
dsh homolog 1, Lim domains containing 1, transforming growth
factor-α, Elk4, ETS-domain protein (SRF accessory protein 1),
chemokine (C-X-C motif) ligand 12, adenosylmethionine decarboxylase
1, Slingshot protein phosphatase 2, cannabinoid receptor 2
(macrophage), inhibin β-B, glutamate receptor, ionotropic, AMPA 2,
and laminin γ3; Table IV]. Among
these genes, Kcnj6 was the most highly regulated target
gene.
| Table III.Key miRNAs (degree ≥59) in the miRNA
target gene network. |
Table III.
Key miRNAs (degree ≥59) in the miRNA
target gene network.
| Gene symbol | Degree | Regulation |
|---|
| rno-miR-207 | 202 | Up |
| rno-miR-214-3p | 179 | Up |
| rno-miR-212-5p | 131 | Up |
| rno-miR-34c-5p | 129 | Up |
| rno-miR-7578 | 95 | Up |
| rno-miR-672-3p | 92 | Down |
| rno-miR-205 | 75 | Up |
| rno-miR-141-5p | 75 | Up |
|
rno-miR-146b-5p | 72 | Up |
| rno-miR-212-3p | 68 | Up |
| rno-miR-31a-5p | 65 | Up |
| rno-miR-187-3p | 59 | Up |
| Table IV.Highest degree of target genes in the
miRNA target gene network (degree ≥4). |
Table IV.
Highest degree of target genes in the
miRNA target gene network (degree ≥4).
| Gene symbol | Definition | Degree |
|---|
| Kcnj6 | Potassium
inwardly-rectifying channel, subfamily J, member 6 | 7 |
| Traf3 | Tnf
receptor-associated factor 3 | 5 |
| Tbl1xr1 | Transducin (β)-like
1 X-linked receptor 1 | 5 |
| Stk4 | Serine/threonine
kinase 4 | 5 |
| Lpin2 | Lipin 2 | 4 |
| Sp1 | Sp1 transcription
factor | 4 |
| Dvl1 | Dishevelled, dsh
homolog 1 (Drosophila) | 4 |
| Limd1 | LIM domains
containing 1 | 4 |
| Tgfa | Transforming growth
factor-α | 4 |
| Elk4 | ELK4, ETS-domain
protein (SRF accessory protein 1) | 4 |
| Cxcl12 | Chemokine (C-X-C
motif) ligand 12 | 4 |
| Amd1 | Adenosylmethionine
decarboxylase 1 | 4 |
| Ssh2 | Slingshot protein
phosphatase 2 | 4 |
| Cnr2 | Cannabinoid
receptor 2 (macrophage) | 4 |
| Inhbb | Inhibin β-B | 4 |
| Gria2 | Glutamate receptor,
ionotropic, AMPA 2 | 4 |
| Lamc3 | Laminin γ3 | 4 |
Discussion
Urolithiasis is a multifactorial disease that
comprises a large proportion of urinary tract diseases. A number of
hypotheses have been investigated in previous studies in order to
understand the mechanisms of oxalate stone formation (18–21).
The results demonstrate that stone formation may be the result of
interactions between epithelial cells, matrix cells and
macrophages, as well as additional cell types, in a hyperoxaluric
microenvironment. Thus, the aim of the present study was to
investigate whether alterations in miRNA expression occur in an
in vivo model of hyperoxaluria are a potential process that
underlies calcium oxalate stone formation. Ethylene glycol and
ammonium chloride, which are typically used to generate rat models
of hyperoxaluria (22), were used
to induce crystal stone formation. In a previous study, a stable
experimental model was established using 1% (v/v) ethylene glycol
and 0.5% ammonium chloride (23).
Previous studies have demonstrated that kidney
stones form as a result of interactions between genetic and
environmental factors (24,25).
High concentrations of urine oxalate may result in tubular
epithelial cell injury, which may subsequently induce gene
expression and protein synthesis, ultimately leading to
nephrolithiasis (26,27). In order to elucidate this process,
numerous in vivo and in vitro studies have
investigated the role of genes, mRNA and proteins in the
pathogenesis of hyperoxaluria (28–30).
These studies demonstrated that PAT1, also known as solute carrier
family 26, member 1, is important in oxalate transportation and
that p38 MAPK mediates calcium oxalate crystal-induced disruption
of the distal renal tubular epithelial tight junctions (31–33).
However, only a limited number of studies have investigated the
role of miRNAs in the pathogenesis of hyperoxaluria and
urolithiasis. Wang et al (28) demonstrated that 25 miRNAs were
differentially expressed in the HK-2 immortalized proximal tubule
epithelial cell line following exposure to oxalate monohydrate
crystals, and the majority of these were associated with apoptosis
and mitochondrial and metabolic processes. In order to investigate
the upregulation and downregulation of miRNAs in vivo in the
present study, the miRNA expression profiles of hyperoxaluric rats
were examined and compared with wild-type controls, and 28
differentially expressed miRNAs were identified. These
differentially expressed miRNAs were associated with multiple
biological processes, including response to insulin, apoptosis,
intracellular signaling cascade and the inflammatory response.
RT-qPCR analysis of miRNA levels between wild-type rats and those
with hypoxaluria were largely consistent with the microarray
analysis. In order to identify potential target genes and the
functions of differentially expressed miRNAs, GO and pathway
analyses were performed following microarray analysis. The results
demonstrated that 1,059 genes were predicted to be targets of the
28 identified miRNAs, which were differentially expressed with a
>2-fold change. In addition, miRNA-target gene-network analyses
were used to determine the degree of interaction between miRNAs and
predicted target genes. To generate a miRNA-target gene-network
diagram, the putative association between miRNAs and target genes
was determined by their differential expression values, and based
on their interactions according to the Sanger miRNA database. The
results revealed 17 highly regulated target genes and 12 key miRNAs
in the miRNA target gene network. The most highly regulated target
gene was Kcnj6, which encodes a potassium channel that
belongs to subfamily J. Rno-miR-214-3p, rno-miR-212-5p and
rno-miR-7578 were associated with multiple biological processes,
including the regulation of apoptosis, negative regulation of
nuclear factor-κB (NF-κB) transcription factor activity, the innate
immune response, regulation of cytokine production, and the
Toll-like receptor signaling pathway. In addition, rno-miR-7578,
rno-miR-141-5p, rno-miR-146b-5p and rno-miR-187-3p were associated
with the positive regulation of transcription via the RNA
polymerase II promoter, protein dephosphorylation and lipid
metabolism. Furthermore, rno-miR-141-5p, rno-miR-207,
rno-miR-34c-5p and rno-miR-31a-5p were associated with the positive
regulation of cell proliferation and the regulation of calcium ion
transport.
According to the GO analysis, rno-miR-132-3p,
rno-miR-146b-5p, rno-miR-187-3p, rno-miR-205, rno- miR-207,
rno-miR-212-3p, rno-miR-214-3p, rno-miR-21-5p and rno-miR-34b-3p
were predicted to be associated with the upregulation of the
protein kinase B signaling cascade, whereas rno-miR-214-3p,
rno-miR-212-5p, rno-miR-7578 and rno-miR-207 were predicted to be
involved in the downregulation of NF-кB transcription factor
activity. Traf3 is important role in cell function and in the
upregulation of NF-кB transcription factor-associated genes, the
regulation of biological and apoptotic processes, the negative
regulation of NF-кB transcription factor activity, the regulation
of cytokine production, and the Toll-like receptor-signaling
pathway. Several studies have implicated interleukin-1 in calcium
oxalate stone formation through the stimulation of multiple TLR
ligands, and Oganesyan et al (35) demonstrated that a Traf3-null cell
line is unable to produce interleukin-1 (34–37).
In the present study, induction of apoptosis was predicted to be an
important feature that involves rno-miR-132-3p, rno-miR-146b-5p,
rno-miR-187-3p, rno-miR-205, rno-miR-207, rno-miR-212-3p,
rno-miR-214-3p, rno-miR-21-5p, rno-miR-223-3p and rno-miR-34c-5p.
Interestingly, Fujii et al (38) reported that the preventive effect
of adiponectin treatment in kidney crystal formation occurs due to
the inhibition of inflammation and apoptosis.
Pathway analysis revealed that the differentially
expressed miRNAs identified in the present study may serve a role
in multiple crucial pathways, including porphyrin and chlorophyll
metabolism, the PI3K-AKT signaling pathway, insulin secretion and
the insulin signaling pathway. The PI3K-AKT signaling pathway is
associated with metabolic syndrome, and it has been reported that
PI-3Kp85 mRNA expression decreased in rats with metabolic syndrome
(39). Metabolic syndrome is a
disorder of energy utilization and storage, which is characterized
by high serum triglycerides, elevated fasting plasma glucose,
abdominal obesity, elevated blood pressure, and low high-density
lipoprotein cholesterol levels (40). In previous studies, urolithiasis
was demonstrated to be associated with a history of metabolic
syndrome and specific metabolic syndrome traits, particularly
dyslipidemia [odds ratio (OR)=1.36], and any one of the five
metabolic syndrome traits was associated with increased oxalate
excretion (OR=2.10) (41,42). Kabeya et al (43) recently demonstrated that a fasting
plasma glucose level of ≥126 mg/dl was significantly associated
with a risk of kidney stones (OR=1.83). However, it remains unknown
how kidney stone disease is connected with metabolic syndrome. A
recent study suggested that the production of reactive oxygen
species, and the progression of oxidative stress and inflammation
may be associated with these shared pathways (44). In the present study, differentially
expressed miRNAs were predicted to be involved in insulin and
PI3K-AKT signaling pathways as indicated by the pathway analysis.
However, additional research is needed to investigate the molecular
mechanism of hyperoxaluria further.
To the best of our knowledge, the present study is
the first to investigate the role of miRNA expression profiles in
calcium oxalate stone formation in vivo. The differentially
expressed miRNAs identified in the kidney tissues of rats with
hyperoxaluria, may provide a novel perspective on the pathogenic
mechanisms of kidney stone formation. However, it should be noted
that even though the miRNAs were differentially expressed in this
setting, not all miRNAs may serve a key role in kidney stone
formation. In addition, the miRNAs identified in rat kidney tissues
may not be involved in the same process in humans. Therefore, miRNA
and targeted gene studies should be performed in human cells or
samples to confirm the results of the current study.
In conclusion, the expression of multiple miRNAs was
demonstrated to be altered in the kidneys of rats with ethylene
glycol-induced hyperoxaluria. Thus, the mechanistic pathways of
hyperoxaluria in kidneys may be due to alterations in the
expression of several of these identified miRNAs. Furthermore, the
functional significance of these expression alterations in
hyperoxaluria remains unknown. Future studies should aim to clarify
this and determine the adaptive responses that occur in tissues
during hyperoxaluria, which may lead to a better understanding of
the molecular mechanisms of urolithiasis.
Acknowledgements
The current study was supported by the National
Natural Science Foundation of China (grant no. 81400706).
References
|
1
|
Coe FL, Evan A and Worcester E: Kidney
stone disease. J Clin Invest. 115:2598–2608. 2005. View Article : Google Scholar : PubMed/NCBI
|
|
2
|
Ambros V: The functions of animal
microRNAs. Nature. 431:350–355. 2004. View Article : Google Scholar : PubMed/NCBI
|
|
3
|
Bartel DP: MicroRNAs: Genomics,
biogenesis, mechanism, and function. Cell. 116:281–297. 2004.
View Article : Google Scholar : PubMed/NCBI
|
|
4
|
Lewis BP, Burge CB and Bartel DP:
Conserved seed pairing, often flanked by adenosines, indicates that
thousands of human genes are microRNA targets. Cell. 120:15–20.
2005. View Article : Google Scholar : PubMed/NCBI
|
|
5
|
Lewis BP, Shih IH, Jones-Rhoades MW,
Bartel DP and Burge CB: Prediction of mammalian microRNA targets.
Cell. 115:787–798. 2003. View Article : Google Scholar : PubMed/NCBI
|
|
6
|
Xuehua C, Xiaojian G, Xizhao S, Li Z and
Yan X: The study of the determination of oxalate and citrate in
human urine by lon chromatography method. J Clin Urology (China).
28:437–439. 2013.
|
|
7
|
Institute of Laboratory Animal Resources
(US). Committee on Care, Use of Laboratory Animals, National
Institutes of Health (US), . Division of Research Resources. Guide
for the care and use of laboratory animals[M]. National Academies.
1985.
|
|
8
|
Wright GW and Simon RM: A random variance
model for detection of differential gene expression in small
microarray experiments. Bioinformatics. 19:2448–2455. 2003.
View Article : Google Scholar : PubMed/NCBI
|
|
9
|
Bolstad BM: Low-level analysis of
high-density oligonucleotide array data: Background, normalization
and summarization. University of California; Berkeley: 2004
|
|
10
|
Yang H, Crawford N, Lukes L, Finney R,
Lancaster M and Hunter KW: Metastasis predictive signature profiles
pre-exist in normal tissues. Clin Exp Metastasis. 22:593–603. 2005.
View Article : Google Scholar : PubMed/NCBI
|
|
11
|
Livak KJ and Schmittgen TD: Analysis of
relative gene expression data using real-time quantitative PCR and
the 2(−Delta Delta C(T)) method. Methods. 25:402–408. 2001.
View Article : Google Scholar : PubMed/NCBI
|
|
12
|
Gene Ontology Consortium, . The gene
ontology (GO) project in 2006. Nucleic Acids Res. 34:(Database
Issue). D322–D326. 2006. View Article : Google Scholar : PubMed/NCBI
|
|
13
|
Kanehisa M, Goto S, Kawashima S, Okuno Y
and Hattori M: The KEGG resource for deciphering the genome.
Nucleic Acids Res. 32:(Database Issue). D277–D280. 2004. View Article : Google Scholar : PubMed/NCBI
|
|
14
|
Yi M, Horton JD, Cohen JC, Hobbs HH and
Stephens RM: WholePathwayScope: A comprehensive pathway-based
analysis tool for high-throughput data. BMC Bioinformatics.
7:302006. View Article : Google Scholar : PubMed/NCBI
|
|
15
|
Enright AJ, John B, Gaul U, Tuschl T,
Sander C and Marks DS: MicroRNA targets in drosophila. Genome Biol.
5:R12003. View Article : Google Scholar : PubMed/NCBI
|
|
16
|
Joung JG, Hwang KB, Nam JW, Kim SJ and
Zhang BT: Discovery of microRNA-mRNA modules via population-based
probabilistic learning. Bioinformatics. 23:1141–1447. 2007.
View Article : Google Scholar : PubMed/NCBI
|
|
17
|
Shalgi R, Lieber D, Oren M and Pilpel Y:
Global and local architecture of the mammalian
microRNA-transcription factor regulatory network. PLoS Comput Biol.
3:e1312007. View Article : Google Scholar : PubMed/NCBI
|
|
18
|
Evan AP, Coe FL, Lingeman JE, Shao Y,
Matlaga BR, Kim SC, Bledsoe SB, Sommer AJ, Grynpas M, Philips CL
and Worcester EM: Renal crystal deposits and histopathology in
patients with cystine stones. Kidney Int. 69:2227–2235. 2006.
View Article : Google Scholar : PubMed/NCBI
|
|
19
|
Evan AP, Lingeman JE, Coe FL, Parks JH,
Bledsoe SB, Shao Y, Sommer AJ, Patterson RF, Kuo RL and Grynpas M:
Randall plaque of patients with nephrolithisis begins in basement
membranes of thin loops of Henle. J Clin Invest. 111:607–616. 2003.
View Article : Google Scholar : PubMed/NCBI
|
|
20
|
Verkoelen CF and Verhulst A: Proposed
mechanisms in renal tubular crystal retention. Kidney Int.
72:13–18. 2007. View Article : Google Scholar : PubMed/NCBI
|
|
21
|
Taylor ER and Stoller ML: Vascular theory
of the formation of Randall plaques. Urolithiasis. 43:(Suppl 1).
S41–S45. 2015. View Article : Google Scholar
|
|
22
|
de Bruijn WC, Boevé ER, van Run PR, van
Miert PP, de Water R, Romijn JC, Verkoelen CF, Cao LC and Schröder
FH: Etiology of calcium oxalate nephrolithiasis in rats. I. Can
this be a model for human stone formation? Scanning Microsc.
9:103–114. 1995.PubMed/NCBI
|
|
23
|
Cao Z and Liu J: Comparison of several
experimental renal calcium oxalate Calcalus ModelS in rats. J
Huazhong Univ Sci Tech. 31:556–559. 2002.
|
|
24
|
Wisener LV, Pearl DL, Houston DM,
Reid-Smith RJ and Moore AE: Risk factors for the incidence of
calcium oxalate uroliths or magnesium ammonium phosphate uroliths
for dogs in Ontario, Canada, from 1998 to 2006. Am J Vet Res.
71:1045–1054. 2010. View Article : Google Scholar : PubMed/NCBI
|
|
25
|
Halbritter J, Baum M, Hynes AM, Rice SJ,
Thwaites DT, Gucev ZS, Fisher B, Spaneas L, Porath JD, Braun DA, et
al: Fourteen monogenic genes account for 15% of
nephrolithiasis/nephrocalcinosis. J Am Soc Nephrol. 26:543–551.
2015. View Article : Google Scholar : PubMed/NCBI
|
|
26
|
Ouyang JM, Yao XQ, Tan J and Wang FX:
Renal epithelial cell injury and its promoting role in formation of
calcium oxalate monohydrate. J Biol Inorg Chem. 16:405–416. 2011.
View Article : Google Scholar : PubMed/NCBI
|
|
27
|
Sivalingam S, Nakada SY, Sehgal PD,
Crenshaw TD and Penniston KL: Dietary hydroxyproline induced
calcium oxalate lithiasis and associated renal injury in the
porcine model. J Endourol. 27:1493–1498. 2013. View Article : Google Scholar : PubMed/NCBI
|
|
28
|
Wang B, Wu B, Liu J, Yao W, Xia D, Li L,
Chen Z, Ye Z and Yu X: Analysis of altered microRNA expression
profiles in proximal renal tubular cells in response to calcium
oxalate monohydrate crystal adhesion: Implications for kidney stone
disease. PLoS One. 9:e1013062014. View Article : Google Scholar : PubMed/NCBI
|
|
29
|
Okumura N, Tsujihata M, Momohara C,
Yoshioka I, Suto K, Nonomura N, Okuyama A and Takao T: Diversity in
protein profiles of individual calcium oxalate kidney stones. PLoS
One. 8:e686242013. View Article : Google Scholar : PubMed/NCBI
|
|
30
|
Halbritter J, Baum M, Hynes AM, Rice SJ,
Thwaites DT, Gucev ZS, Fisher B, Spaneas L, Porath JD, Braun DA, et
al: Fourteen monogenic genes account for 15% of
nephrolithiasis/nephrocalcinosis. J Am Soc Nephrol. 26:543–551.
2015. View Article : Google Scholar : PubMed/NCBI
|
|
31
|
Jiang Z, Asplin JR, Evan AP, Rajendran VM,
Velazquez H, Nottoli TP, Binder HJ and Aronson PS: Calcium oxalate
urolithiasis in mice lacking anion transporter Slc26a6. Nat Genet.
38:474–478. 2006. View
Article : Google Scholar : PubMed/NCBI
|
|
32
|
Corbetta S, Eller-Vainicher C, Frigerio M,
Valaperta R, Costa E, Vicentini L, Baccarelli A, Beck-Peccoz P and
Spada A: Analysis of the 206M polymorphic variant of the SLC26A6
gene encoding a Cl-oxalate transporter in patients with primary
hyperparathyroidism. Eur J Endocrinol. 160:283–288. 2009.
View Article : Google Scholar : PubMed/NCBI
|
|
33
|
Alper SL and Sharma AK: The SLC26 gene
family of anion transporters and channels. Mol Aspects Med.
34:494–515. 2013. View Article : Google Scholar : PubMed/NCBI
|
|
34
|
Häcker H, Redecke V, Blagoev B,
Kratchmarova I, Hsu LC, Wang GG, Kamps MP, Raz E, Wagner H, Häcker
G, et al: Specificity in Toll-like receptor signalling through
distinct effector functions of TRAF3 and TRAF6. Nature.
439:204–207. 2006. View Article : Google Scholar : PubMed/NCBI
|
|
35
|
Oganesyan G, Saha SK, Guo B, He JQ,
Shahangian A, Zarnegar B, Perry A and Cheng G: Critical role of
TRAF3 in the Toll-like receptor-dependent and -independent
antiviral response. Nature. 439:208–211. 2006. View Article : Google Scholar : PubMed/NCBI
|
|
36
|
Mittal RD, Bid HK, Manchanda PK and Kapoor
R: Association of interleukin-1beta gene and receptor antagonist
polymorphisms with calcium oxalate urolithiasis. J Endourol.
21:1565–1570. 2007. View Article : Google Scholar : PubMed/NCBI
|
|
37
|
Reyes L, Reinhard M and Brown MB:
Different inflammatory responses are associated with Ureaplasma
parvum-induced UTI and urolith formation. BMC Infect Dis. 9:92009.
View Article : Google Scholar : PubMed/NCBI
|
|
38
|
Fujii Y, Okada A, Yasui T, Niimi K,
Hamamoto S, Hirose M, Kubota Y, Tozawa K, Hayashi Y and Kohri K:
Effect of adiponectin on kidney crystal formation in metabolic
syndrome model mice via inhibition of inflammation and apoptosis.
PLoS One. 8:e613432013. View Article : Google Scholar : PubMed/NCBI
|
|
39
|
Hu X, Wang M, Bei W, Han Z and Guo J: The
Chinese herbal medicine FTZ attenuates insulin resistance via IRS1
and PI3K in vitro and in rats with metabolic syndrome. J Transl
Med. 12:472014. View Article : Google Scholar : PubMed/NCBI
|
|
40
|
Kaur J: A comprehensive review on
metabolic syndrome. Cardiol Res Pract. 2014:9431622014.PubMed/NCBI
|
|
41
|
Sakhaee K, Capolongo G, Maalouf NM, Pasch
A, Moe OW, Poindexter J and Adams-Huet B: Metabolic syndrome and
the risk of calcium stones. Nephrol Dial Transplant. 27:3201–3209.
2012. View Article : Google Scholar : PubMed/NCBI
|
|
42
|
Kohjimoto Y, Sasaki Y, Iguchi M, Matsumura
N, Inagaki T and Hara I: Association of metabolic syndrome traits
and severity of kidney stones: Results from a nationwide survey on
urolithiasis in Japan. Am J Kidney Dis. 61:923–929. 2013.
View Article : Google Scholar : PubMed/NCBI
|
|
43
|
Kabeya Y, Kato K, Tomita M, Katsuki T,
Oikawa Y, Shimada A and Atsumi Y: Associations of insulin
resistance and glycemic control with the risk of kidney stones.
Intern Med. 51:699–705. 2012. View Article : Google Scholar : PubMed/NCBI
|
|
44
|
Khan SR: Is oxidative stress, a link
between nephrolithiasis and obesity, hypertension, diabetes,
chronic kidney disease, metabolic syndrome? Urol Res. 40:95–112.
2012. View Article : Google Scholar : PubMed/NCBI
|