Introduction
Diabetes mellitus (DM) has been identified as a
major contributor in several important diseases, including the
non-communicable diseases of cardiovascular disease and renal
disease (1). Diabetic nephropathy
(DN) is one of the most common microvascular complications of DM,
and the prevalence of DN is increasing rapidly with the diabetes
epidemic, due to the increase in obesity and the aging population
(2). DN is associated with
increased premature mortality rates, chronic kidney disease (CKD),
renal replacement therapy and cardiovascular diseases (2,3). As
an important cause of CKD, the proportion of DM in all causes of
CKD has continued to increase.
DN is defined as albuminuria (albumin excretion rate
>300 mg/24 h) and reduced renal function in a patient with known
diabetes, in the absence of urinary tract infection or other renal
disease (4). DN is a progressive,
proteinuric renal disorder in patients with DM. It is a common
cause of CKD worldwide, particularly in developed countries. DM is
the underlying cause of micro- and macrovascular disorders,
including DN, retinopathy, coronary artery disease and peripheral
vascular disease (4). DN is a
progressive disease in patients, which is functionally
characterized by differing degrees of albuminuria and CKD. The
early clinical manifestations of DN include high glomerular
filtration rate and increased urinary albumin excretion
(microalbumin) (5).
Microalbuminuria is the earliest and most commonly used clinical
index of DN, and is independently associated with cardiovascular
risk in diabetic patients. Microalbuminuria is always followed by
the appearance of clinical proteinuria (macroproteinuria), and
renal injury subsequently becomes visible (6–8).
Proteinuria is an independent risk factor for the
progression of several diseases, including DN, and structural and
functional alterations of podocytes are an important pathological
basis for proteinuria and glomerular sclerosis (9). Studies have suggested that an
important mechanism in DN proteinuria may be that certain protein
molecules in multiple podocyte slit diaphragms, including nephrin
and podocin, are abnormally expressed and distributed (10,11).
It has been reported that tacrolimus, a type of immunosuppressant,
can mitigate urinary protein excretion in DM rats (12,13);
however, few reports have discussed the association between the
action of decreased proteinuria and protection of podocytes. The
present study was designed to investigate the effect of tacrolimus,
and examine whether it can regulate the expression of nephrin,
reduce proteinuria and slow the progression of diabetes.
Materials and methods
Animals
A total of 38 healthy adult male Sprague-Dawley (SD)
rats (clean grade; 190–210 g; Beijing Vital River Company, Beijing,
China) were bred in the Animal Laboratory of Shandong University
(Jinan, China. The room was maintained at a temperature of 20±1°C,
relative humidity of 50–60% and 12-h light/dark cycle. All animal
experimental procedures were performed in accordance with the
Guidelines for Animal Experiments of Qilu Hospital of Shandong
University (Shandong, China) and were approved by the Institutional
Ethics Committee for the Laboratory Animal Care of Qilu Hospital,
Shandong University.
Drugs and reagents
The following were used in the present study:
Tacrolimus (FK506; batch no. J20090142; Astellas Pharma China,
Ltd., Beijing, China), benazepril (Lotensin; batch no. H20030514;
Beijing Novartis, Beijing, China), streptozotocin (STZ;
Sigma-Aldrich; Merck Millipore, Darmstadt, Germany), citrate buffer
(0.1 mol/l; pH 4.2), rabbit anti-rat nephrin polyclonal antibody
(Abcam, Cambridge, UK), horseradish peroxidase-labeled goat
anti-rabbit IgG (Beijing Zhongshan Golden Bridge Biotechnology Co.,
Ltd., Beijing, China).
Model establishment and treatment
groups
A total of 30 male SD rats, which were randomly
selected from the 38 male rats, were administered with STZ 60 mg/kg
by intraperitoneal injection following fasting for 12 h with access
to water. The remaining eight rats were included as the normal
control group (group N; n=8). After 72 h, the whole blood glucose
was measured using blood glucose meters from the rat tail vein
randomly. When glucose was >16.7 mmol/l and lasted 3 days, the
diabetic rat model was considered successfully established and
remained as a diabetic rat model got at least 4 weeks. In week 5,
when the 24-h urinary protein was >30 mg, establishment of the
standard DN rat model was considered successful (14).
When the DN model was successfully established, the
rats were randomly divided into a DN group (n=10), tacrolimus
(FK506) treatment group (group F; n=10) and benazepril (Lotensin)
treatment group (group L; n=10). The rats in group F were
administered with tacrolimus (1 mg/kg daily) by gavage. At the same
time, the rats in group L were administered with Lotensin (10 mg/kg
daily) by gavage. The rats in the normal control group (group N;
n=8) and group DN were administered with the same quantity of
vehicle. All rats were fed a standard diet with free access to
drinking water throughout the experiment, and without insulin or
other antihyperglycemic drugs.
Specimen collection
All rats were sacrificed under anesthetic following
8 weeks of drug intervention. The urine of the rats was collected
over the 24 h prior to sacrifice using metabolic cages, centrifuged
at 8,056.8 × g, 4°C for 5 min and stored at −80°C in aliquots prior
to protein measurement. Blood was collected from the inferior vena
cava of the anesthetized rats by intraperitoneal injection of 10%
chloral hydrate (4 ml/kg) to measure the blood sugar (BS), serum
creatinine (SCr) and blood urea nitrogen (BUN). Pre-cooling saline
(4°C) was used to rinse the kidneys through the duct of the right
common carotid artery until the kidneys became pale in color. The
left kidney was then removed, weighed and placed on ice to retain
the renal cortex kidney tissue in 1 mm3 blocks, which
were fixed using 2.5% glutaraldehyde for electron microscopy.
Kidney tissues in 8 mm3 blocks were fixed using 10%
paraformaldehyde, embedded in paraffin and cut into slices of 4-µm
thickness for HE, PAS and Masson staining. The remaining kidney
tissues were cut into small sections, placed in liquid nitrogen and
then transferred to −70°C prior to western blot analysis.
BS was measured from the tail vein using a glucose
meter (clofibrate; Abbott Laboratories, Abbott Park, IL, USA) at
the end of weeks 4, 8 and 12 of the experimental period. The 24
h-urinary protein was measured, and SCr and BUN were analyzed using
an automatic biochemical analyzer (Olympus, Tokyo, Japan).
Light microscopy
Left kidney tissues were fixed in 10%
paraformaldehyde, embedded in paraffin and then sliced into
sections for HE, PAS and Masson staining. A light microscope was
used (magnification, ×400) to perform the pathological analysis. In
addition, six similar-sized kidney pellets from each specimen were
measured for their glomerular area (GA) and glomerular
extracellular matrix (ECM) area, from which the ratio of ECM/GA was
calculated using Image-Pro Plus 5.1 image analysis software (Media
Cybernetics, Inc., Rockville, MD, USA).
Transmission electron microscopy
The left kidney cortex was cut into 1 mm3
sections and fixed in 2.5% glutaraldehyde to observe alterations in
the ultrastructure of podocytes under electron microscopy. The
average width of the foot processes, foot process fusion rate and
the average thickness of the glomerular basement membrane (GBM)
were calculated using Image-Pro Plus 5.1 image analysis software
following electron microscopy. The width of the foot processes was
determined as the average value of the distances between the
projections on either side of the membrane of podocytes (15). The foot process fusion rate was
calculated as follows: The total length of basement membrane was
measured and termed X, and the length of the total foot processes
fusion on the basement membrane was measured and termed Y. Finally,
Y/X was calculated as the foot process fusion rate (16). The average thickness of the GBM was
calculated using the following method: The basement membrane was
divided into a number of points every 1 cm and the basement
membrane thickness was measured at each point, with the sum of the
basement membrane thickness of each point termed X and the number
of points termed Y. Finally X/Y was calculated as the average
thickness of the GBM (17).
Western blot analysis
The kidney tissues (100 mg) were placed into
radioimmunoprecipitation assay lysis buffer, to which 1 ml
phenylmethanesulfonyl fluoride was added. The mixture was then
homogenized and centrifuged for 5 min at 4°C and 8,056.8 × g with a
centrifugal radius of 5 cm, and the supernatant was used to measure
protein concentration following the Bradford method. A 50 mg sample
of supernatant was boiled for 5 min and was subjected to sodium
dodecyl sulfate polyacrylamide gel electrophoresis (10% separation
gel, 6% stacking gel), followed by electrical transfer onto a
polyvinylidene fluoride membrane. The membrane was blocked for 1.5
h in 5% skim milk TBST solution at room temperature, following
which the membranes were washed three times in TBST (5 min each).
Subsequently, the membranes were incubated with rabbit-anti-mouse
nephrin polyclonal antibody (1:400) at 4°C in a shaker overnight.
The following day, the membrane was washed in TBST for 10 min five
times, and was incubated with HRP-labeled secondary antibody
(1:40,000) for 1.5 h at room temperature. Following washing of the
membrane using TBST for 10 min five times, Millipore brightening
agent (EMD Millipore, Billerica MA, USA) was added in a dark room,
followed by X-ray film exposure for 1–5 min, development and
fixing. The fixed hybridization signals were scanned using an
optical density scanning image analysis system. The housekeeping
gene β-actin was used as a protein loading control, which was
compared with the other groups to obtain the relative quantity, and
the average was calculated to analyze the results.
Statistical analysis
Values are presented as the mean ± standard
deviation. Statistical analysis was performed using GraphPad Prism
software (version 4.0; GraphPad Software, Inc., San Diego, CA,
USA). One-way analysis of variance was performed where appropriate.
Post-hoc Bonferroni pairwise comparisons were used to assess
significant differences between two groups. P<0.05 was
considered to indicate a statistically significant difference.
Results
General condition of the animals
The daily eating and drinking habits, mental status
and activities of the rats in group N were normal. However,
polyuria, polydipsia and increased food intake were observed in the
rats of groups DN, F and L from 4 weeks post-STZ injection. At week
4, the above symptoms became evident, and the symptoms were more
marked with extended duration in groups DN, F and L. At week 12,
the rats in the three groups exhibited darkened hair color,
listlessness and reduced activity, and seven rats succumbed to
mortality during the experiment, including three rats in group DN,
two in group F and two in group L.
Measured indicators
There was a significant increase in BS and decrease
in BW in the rats in groups DN, F and L, compared with group N
(P<0.05) at the end of weeks 4, 8 and 12. However, no
significant differences in BS or BW were found between groups F and
L and group DN at the end of weeks 4, 8 and 12. The 24 h-urinary
protein was significantly increased in the rats in groups DN, F and
L 4 weeks following DN model establishment, and there were
significant differences between groups DN, F and L and group N
(P<0.05). With increased duration, the 24 h-proteinuria
increased more markedly. Significant decreases in proteinuria were
found in groups F and L, compared with that than in group DN at the
same time point (P<0.05; Table
I).
 | Table I.Comparison of BS, BW and 24 h
proteinuria. |
Table I.
Comparison of BS, BW and 24 h
proteinuria.
| Group | Week | BS
(c/mmol·l−1) | BW (m/g) | Proteinuria/ 24 h
(mg) |
|---|
| N | 0 | – | 259.67±12.58 | – |
|
| 4 | 7.50±0.36 | 273.33±44.19 | 11.68±3.28 |
|
| 8 | 7.40±0.26 | 264.33±27.97 | 12.12±2.61 |
|
| 12 | 7.27±0.76 | 237.33±37.07 | 14.26±3.41 |
| DN | 0 | – | 257.00±20.66 | – |
|
| 4 |
22.13±5.10a |
196.67±17.47a |
32.74±5.36a |
|
| 8 |
21.60±5.40a |
176.67±18.50a |
59.79±4.24a |
|
| 12 |
19.17±2.94a |
163.67±11.93a |
123.16±7.96a |
| L | 0 | – | 251.33±17.16 | – |
|
| 4 |
25.67±3.70a |
185.00±23.58a |
33.57±2.38a |
|
| 8 |
24.93±3.74a |
158.33±22.50a |
45.03±1.37a,b |
|
| 12 |
25.53±1.97a |
148.00±10.39a |
96.47±6.87a,b |
| F | 0 | – | 252.00±21.21 | – |
|
| 4 |
26.72±2.15a |
188.50±13.53a |
31.59±6.43a |
|
| 8 |
23.62±3.45a |
187.00±33.64a |
43.82±0.95a,b |
|
| 12 |
20.82±1.97a |
161.25±25.46a |
94.39±8.04a,b |
There were marked increases in Scr, BUN and KW/BW in
groups DN, F and L, compared with group N at the end of week 12
(P<0.05); however, Scr, BUN and KW/BW in groups F and L were
significantly decreased, compared with those in group DN
(P<0.05; Table II).
| Table II.Comparison of Scr, BUN and KW/BW. |
Table II.
Comparison of Scr, BUN and KW/BW.
| Group | n | Scr
(c/µmol·l−1) | BUN
(c/mmol·l−1) | KW/BW (%) |
|---|
| N | 8 | 37.85±5.36 | 5.89±1.83 | 4.22±0.41 |
| DN | 7 |
99.19±4.25a |
20.11±3.15a |
7.47±0.07a |
| L | 8 |
75.54±6.13a,b |
11.88±3.26a,b |
6.36±0.10a,b |
| F | 8 |
77.07±3.62a,b |
13.07±2.15a,b |
6.28±0.13a,b |
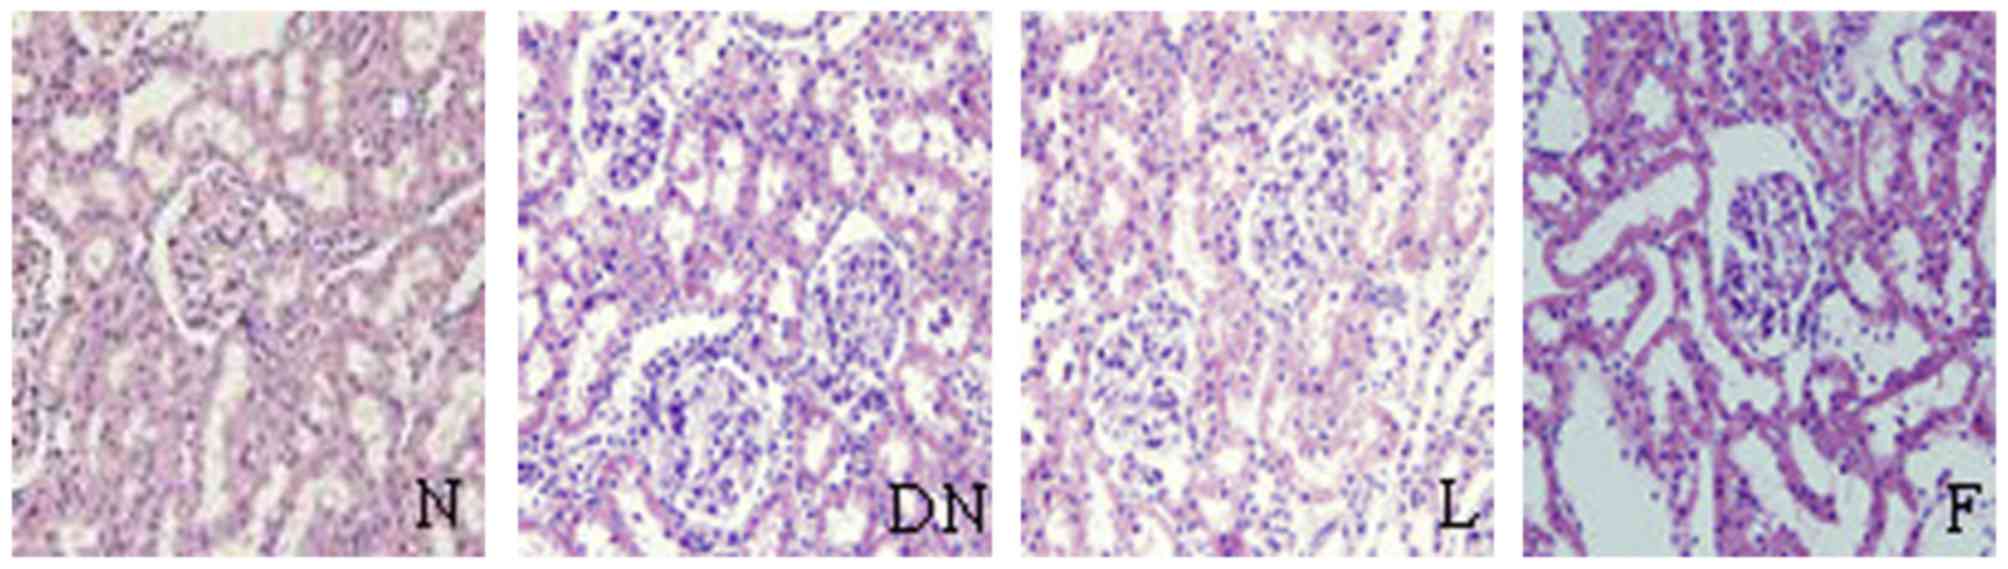
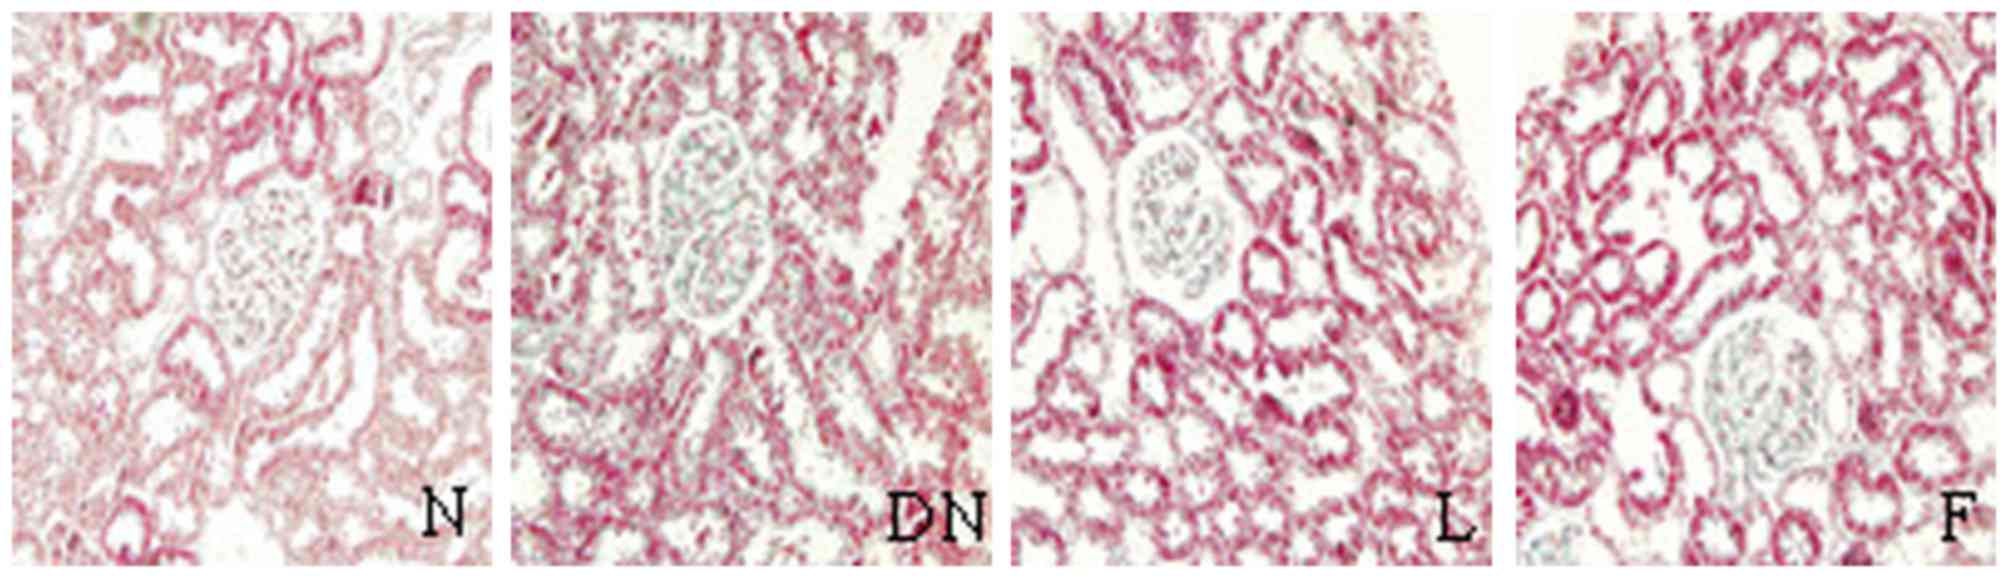
Pathological changes
There were no changes in the glomerular, tubular or
renal interstitium on evaluation of HE, PAS and Masson staining
under light microscopy. However, compared with group N, the kidney
pathology in the rats of group DN showed significantly increased
glomerular volume, expanded glomerular capillary loop,
proliferative mesangial cells, increased mesangial matrix,
thickened basement membrane, tubular cell hypertrophy, vacuolar
degeneration, tubular luminal narrowing and increased interstitial
inflammatory cells on evaluation of HE, PAS and Masson staining
under light microscopy.
In groups F and L, there were marginal pathological
changes of mesangial cell proliferation, increased mesangial
matrix, thickened GBM and interstitial inflammatory cell
infiltration, compared with group DN (Figs. 1–3). There were significant increases in
ECM area, GA and their ratios in groups DN, F and L, compared with
group N (P<0.05). These indices were significantly decreased in
groups F and L, compared with group DN (P<0.05; Table III).
| Table III.Comparison of renal pathology. |
Table III.
Comparison of renal pathology.
| Group | n | GA (x103
µm2) | ECM
(x103 µm2) | ECM/GA |
|---|
| N | 8 | 4.15±0.05 | 0.20±0.02 | 0.05±0.01 |
| DN | 7 |
7.11±0.02a |
0.92±0.01a |
0.13±0.01a |
| L | 8 |
5.24±0.04a,b |
0.49±0.01a,b |
0.09±0.02a,b |
| F | 8 |
5.68±0.03a,b |
0.55±0.02a,b |
0.10±0.01a,b |
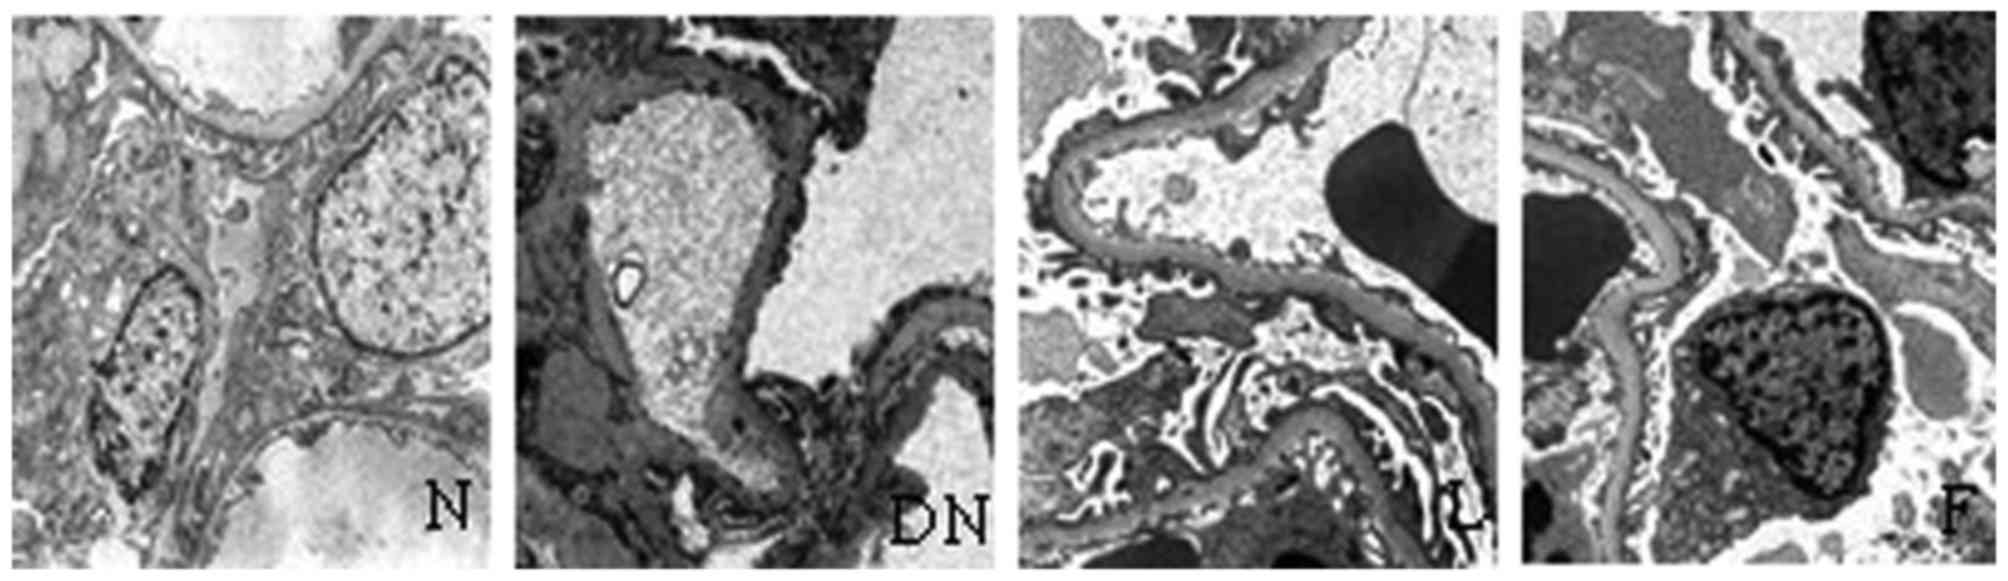
Ultrastructural changes
In the rats in group N, the podocyte structures were
complete and neatly arranged in foot processes, and the basement
membrane was uniform without widening when visualized under an
electron microscope. However, foot processes exhibited derangement,
widening and fusion or had disappeared, and the basement membrane
exhibited a degree of diffuse thickening in group DN. The above
changes were significantly reduced in groups F and L, compared with
group N (Table IV and Fig. 4).
| Table IV.Ultrastructural changes of
podocytes. |
Table IV.
Ultrastructural changes of
podocytes.
| Group | n | Width (µm) | Rate of fusion
(%) | Average thickness
of GBM (µm) |
|---|
| N | 8 | 0.27±0.02 | 2.14±0.34 | 0.24±0.05 |
| DN | 7 |
0.75±0.02a |
74.23±13.56a |
0.68±0.07a |
| L | 8 |
0.41±0.01a,b |
34.19±5.94a,b |
0.38±0.02a,b |
| F | 8 |
0.39±0.01a,b |
32.37±7.28a,b |
0.36±0.03a,b |
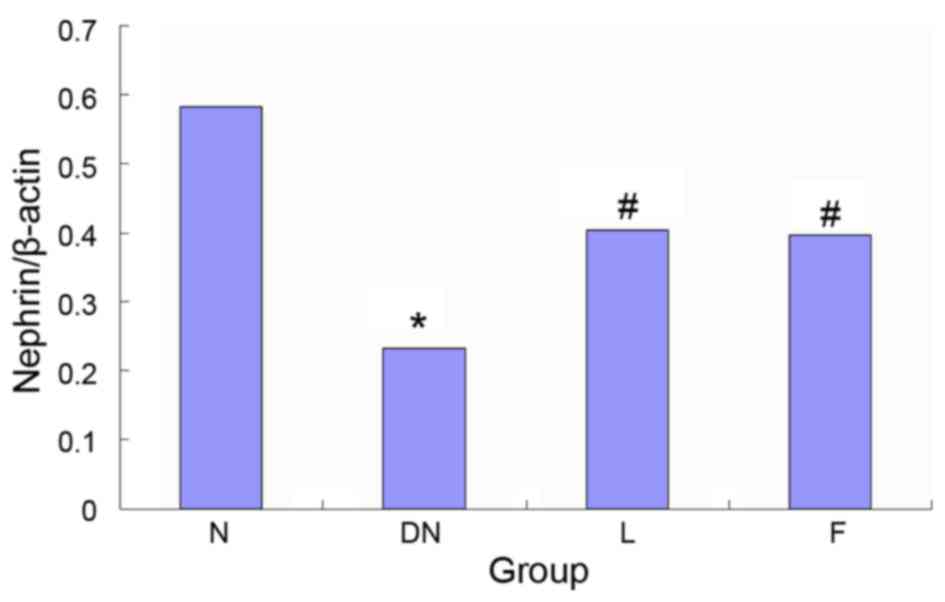
Protein expression of nephrin
The results of the western blot analysis, determined
by measuring the optical density of the tissue sections, showed
that the expression of nephrin decreased by 60.1% in group DN,
compared with group N (P<0.05) and significantly increased by
49.2 and 46.9% in groups L and F, compared with group DN
(P<0.05). No significant differences were found between groups L
and F (Fig. 5).
Discussion
DN is one of the common and serious chronic
complications of DM, and the early clinical manifestations of DN
are microalbuminuria followed by the appearance of clinical
proteinuria. Proteinuria is the primary clinical manifestations of
DN and is also an independent risk factor for kidney damage.
Therefore, it is particularly important to actively investigate the
mechanism of diabetic proteinuria. In previous years, studies
investigating the mechanism of proteinuria provided encouraging
results, and it was confirmed that podocyte lesions are important
in the development and progression of proteinuria (18). Lin et al (19) reported that two key factors of
proteinuria progression were a reduced number of podocytes and
decreased expression of nephrin in podocytes. In 1999, Tryggvason
(20) found that nephrin molecules
are expressed by kidney podocytes, are positioned in the slit
diaphragm of the membrane, belong to the immunoglobulin superfamily
transmembrane protein and are involved in cell signal transduction,
maintaining the normal morphology and function of podocytes.
Abnormalities in the gene and/or the protein expression of nephrin
are important in the pathogenesis of proteinuria. Previous reports
have shown that abnormal distribution and expression of nephrin is
involved in the pathogenesis of proteinuria in several glomerular
diseases, and a reduction in the protein expression of nephrin may
lead to loss of slit diaphragm holes in the membrane structure,
proteinuria and CKD (20,21).
Several studies have confirmed that nephrin is
significantly reduced in patients with DN, which is actively
involved in DN. Langham et al (22) observed that, in 14 diabetic
patients with proteinuria, the mRNA expression of nephrin was
decreased by 62%, compared with control group, and increased
linearly with proteinuria. Toyoda et al (23) confirmed that the mRNA expression of
nephrin is decreased in human DN, which causes structural and
functional damage to the podocyte slit diaphragm and can exacerbate
with the deterioration of kidney disease. Koop et al
(21) found that the expression of
nephrin and podocin protein were significantly decreased in
podocytes of patients with acquired renal disease, including DN.
The results of the present study showed that the expression of
nephrin were significantly decreased in the rats of group DN,
compared with those of group N, and 24 h-urinary protein excretion
was significantly higher in group DN, compared with group N
(P<0.05). These results were consistent with the above
findings.
Tacrolimus is a novel type of immunosuppressant,
isolated in 1984 from a novel soil microbial medium (24). Tacrolimus is a potent
immunosuppressant, and several animal experiments and clinical
applications have demonstrated that it has a similar
immunosuppressive effect to cyclosporin A (Cys A), with more potent
immunosuppressive effects, compared with CysA (10–100-fold higher)
and fewer side effects (25).
Previous studies have found that tacrolimus not only forms a basis
for immunosuppression to prevent kidney transplant rejection, but
also for the treatment of chronic allograft nephropathy and lupus
nephritis, which can significantly delay glomerulosclerosis and
tubulointerstitial damage (26,27).
Studies have shown that tacrolimus inhibits transforming growth
factor-β-induced kidney tubular epithelial cell
transdifferentiation, which may be an important mechanism of
tacrolimus in treating organ rejection post-transplantation, and
which also provides a theoretical basis for the prevention and
treatment of renal fibrosis (28).
According to previous reports, immunosuppressants
can reduce renal pathological damage and urinary albumin excretion
rates, and the mechanism may be associated with the inhibition of
renal macrophage infiltration (29). Gooch et al (30) found that Cys A, a type of
calcineurin (CaN) inhibitor, can significantly inhibit the protein
expression and activity of CaN, and reduce renal hypertrophy and
ECM accumulation in the diabetic kidney. It has been shown that, in
its application as a CaN inhibitor, tacrolimus also inhibits early
diabetic renal hypertrophy and increases urinary albumin excretion,
consistent with the results of Cys A (31). However, few studies have reported
on whether there is an association between the protective effect of
tacrolimus in renal tissues of a diabetic model and podocytes.
It has been confirmed that angiotensin converting
enzyme inhibitor (ACEI) drugs can lower blood pressure and reduce
significant proteinuria, protecting the kidneys and delaying the
progression of kidney disease (32). Clinically, benazepril, a type of
ACEI, is important in ameliorating diabetic kidney damage (33). In the present study, benazepril
treatment was used as a positive control, and the results showed
that tacrolimus and benazepril significantly reduced the levels of
urinary protein, Scr and BUN in groups F and L, compared with those
in group DN (P<0.05). The pathological changes observed under
light microscopy were also significantly reduced in groups F and L,
with no significant difference found between the therapeutic
effects of the two drugs. The above results showed that the
protective effect of tacrolimus on diabetic kidney tissue injury
was similar to that of benazepril.
In the present study, the results of the electron
microscopy and western blot analysis showed that the foot processes
of podocytes manifested derangement, widening, fusion and even
disappearance, and GBM showed diffuse thickening in DN. However, in
groups F and L, the above-mentioned pathological alterations were
significantly alleviated (P<0.05). The expression levels of
nephrin in the kidneys of DN rats were significantly lower,
compared with those in group N, however, the expression of nephrin
in groups F and L were increased, compared with those in group DN
(P<0.05). The results of the present study indicated that
tacrolimus improved renal podocyte ultrastructure in diabetic rats,
reduced DN renal damage and delayed the progression of kidney
disease by upregulating the expression of nephrin.
The results of the present study indicated that
tacrolimus may have partly regulated the expression of nephrin, and
had a protective effect on kidney injury in DN. This may provide a
novel theoretical basis for the treatment of DN with tacrolimus.
Tacrolimus has renal toxicity and islet cell toxicity properties,
which can lead to elevated BS. In the present study, no increase in
BS was observed following the application of tacrolimus, and this
was associated with the relatively short duration of
experimentation and low drug cincentrations. Although the
nephrotoxicity of tacrolimus is lower than that of CysA, caution is
required in using tacrolimus to treat non-renal transplant patients
with DN, and the nephrotoxicity of tacrolimus on diabetic renal
requires further investigation.
Acknowledgements
This study was supported by the Outstanding Young
Scientist Research Award Fund Project of Shandong Province (grant
no. BS2013YY042) and the Science and Technology Development Plan of
Shandong Provinc (grant no. 2014GSF121005).
References
|
1
|
Usluogullari CA, Balkan F, Caner S, Ucler
R, Kaya C, Ersoy R and Cakir B: The relationship between
microvascular complications and vitamin D deficiency in type 2
diabetes mellitus. BMC Endocr Disord. 15:332015. View Article : Google Scholar : PubMed/NCBI
|
|
2
|
Ghaderian SB, Hayati F, Shayanpour S and
Mousavi Beladi SS: Diabetes and end-stage renal disease; a review
article on new concepts. J Renal Inj Prev. 4:28–33. 2015.PubMed/NCBI
|
|
3
|
Palmer SC, Mavridis D, Navarese E, Craig
JC, Tonelli M, Salanti G, Wiebe N, Ruospo M, Wheeler DC and
Strippoli GF: Comparative efficacy and safety of blood
pressure-lowering agents in adults with diabetes and kidney
disease: A network meta-analysis. Lancet. 385:2047–2056. 2015.
View Article : Google Scholar : PubMed/NCBI
|
|
4
|
Tanaka N, Babazono T, Takagi M, Yoshida N,
Toya K, Nyumura I, Hanai K and Uchigata Y: Albuminuria and reduced
glomerular filtration rate for predicting the renal outcomes in
type 2 diabetic patients. Nephrology (Carlton). 20:531–538. 2015.
View Article : Google Scholar : PubMed/NCBI
|
|
5
|
Avogaro A and Fadini GP: The effects of
dipeptidyl peptidase-4 inhibition on microvascular diabetes
complications. Diabetes Care. 37:2884–2894. 2014. View Article : Google Scholar : PubMed/NCBI
|
|
6
|
Al-Mendalawi MD: Occurrence of
microalbuminuria among children and adolescents with
insulin-dependent diabetes mellitus. Saudi J Kidney Dis Transpl.
26:373–374. 2015. View Article : Google Scholar : PubMed/NCBI
|
|
7
|
Wang Y, Nie M, Lu Y, Wang R, Li J, Yang B,
Xia M, Zhang H and Li X: Fucoidan exerts protective effects against
diabetic nephropathy related to spontaneous diabetes through the
NF-κB signaling pathway in vivo and in vitro. Int J Mol Med.
35:1067–1073. 2015.PubMed/NCBI
|
|
8
|
Aggarwal J and Kumar M: Prevalence of
microalbuminuria among rural north indian population with diabetes
mellitus and its correlation with glycosylated haemoglobin and
smoking. J Clin Diagn Res. 8:CC11–CC13. 2014.PubMed/NCBI
|
|
9
|
Peng T, Hu Z, Wu L, Li D and Yang X:
Correlation between endothelial dysfunction and left ventricular
remodeling in patients with chronic kidney disease. Kidney Blood
Press Res. 39:420–426. 2014. View Article : Google Scholar : PubMed/NCBI
|
|
10
|
Yang X, Wang X, Nie F, Liu T, Yu X, Wang
H, Li Q, Peng R, Mao Z, Zhou Q and Li G: miR-135 family members
mediate podocyte injury through the activation of Wnt/β-catenin
signaling. Int J Mol Med. 36:669–677. 2015.PubMed/NCBI
|
|
11
|
Wu Y, Dong J, Yuan L, Liang C, Ren K,
Zhang W, Fang F and Shen J: Nephrin and podocin loss is prevented
by mycophenolate mofetil in early experimental diabetic
nephropathy. Cytokine. 44:85–91. 2008. View Article : Google Scholar : PubMed/NCBI
|
|
12
|
Qi XM, Wu YG, Liang C, Zhang P, Dong J,
Ren KJ, Zhang W, Fang F and Shen JJ: FK506 ameliorates renal injury
in early experimental diabetic rats induced by streptozotocin. Int
Immunopharmacol. 11:1613–1619. 2011. View Article : Google Scholar : PubMed/NCBI
|
|
13
|
Álamo JM, Olivares C, Barrera L, Marín LM,
Suarez G, Bernal C, Serrano J, Muntané J, Padillo FJ and Gómez MA:
Conversion from calcineurin inhibitors to mTOR inhibitors
stabilizes diabetic and hypertensive nephropathy after liver
transplant. World J Transplant. 5:19–25. 2015.PubMed/NCBI
|
|
14
|
Brouwers O, Niessen PM, Miyata T,
Østergaard JA, Flyvbjerg A, Peutz-Kootstra CJ, Sieber J, Mundel PH,
Brownlee M, Janssen BJ, et al: Glyoxalase-1 overexpression reduces
endothelial dysfunction and attenuates early renal impairment in a
rat model of diabetes. Diabetologia. 57:224–225. 2014. View Article : Google Scholar : PubMed/NCBI
|
|
15
|
Liu XJ, Zhang YM, Wang SX and Liu G:
Ultrastructural changes of podocyte foot processes during the
remission phase of minimal change disease of human kidney.
Nephrology (Carlton). 19:392–397. 2014. View Article : Google Scholar : PubMed/NCBI
|
|
16
|
Bohman SO, Jaremko G, Bohlin AB and Berg
U: Foot process fusion and glomerular filtration rate in minimal
change nephrotic syndrome. Kidney Int. 25:696–700. 1984. View Article : Google Scholar : PubMed/NCBI
|
|
17
|
Wu HS and Dikman S: Segmentation and
thickness measurement of glomerular basement membranes from
electron microscopy images. J Electron Microsc (Tokyo). 59:409–418.
2010. View Article : Google Scholar : PubMed/NCBI
|
|
18
|
Maestroni S, Maestroni A, Dell'Antonio G,
Gabellini D, Terzi S, Spinello A, Meregalli G, Castoldi G and
Zerbini G: Viable podocyturia in healthy individuals: Implications
for podocytopathies. Am J Kidney Dis. 64:1003–1005. 2014.
View Article : Google Scholar : PubMed/NCBI
|
|
19
|
Lin CL, Wang FS, Hsu YC, Chen CN, Tseng
MJ, Saleem MA, Chang PJ and Wang JY: Modulation of Notch-1
signaling alleviates VEGF-mediated diabetic nephropathy. Diabetes.
59:1915–1925. 2010. View Article : Google Scholar : PubMed/NCBI
|
|
20
|
Tryggvason K: Unraveling the mechanisms of
glomerular ultrafiltration: Nephrin, a key component of the slit
diaphragm. J Am Soc Nephrol. 10:2440–2445. 1999.PubMed/NCBI
|
|
21
|
Koop K, Eikmans M, Baelde HJ, Kawachi H,
De Heer E, Paul LC and Bruijn JA: Expression of podocyte-associated
molecules in acquired human kidney diseases. J Am Soc Nephrol.
14:2063–2071. 2003. View Article : Google Scholar : PubMed/NCBI
|
|
22
|
Langham RG, Kelly DJ, Cox AJ, Gow RM,
Holthofer H and Gilbert RE: Angiotensin II-induced proteinuria and
expression of the podocyte slit pore membrane protein, nephrin.
Nephrol Dial Transplant. 19:262–263. 2004. View Article : Google Scholar : PubMed/NCBI
|
|
23
|
Toyoda M, Suzuki D, Umezono T, Uehara G,
Maruyama M, Honma M, Sakai T and Sakai H: Expression of human
nephrin mRNA in diabetic nephropathy. Nephrol Dial Transplant.
19:380–385. 2004. View Article : Google Scholar : PubMed/NCBI
|
|
24
|
Wallemacq PE and Reding R: FK506
(tacrolimus), a novel immunosuppressant in organ transplantation:
Clinical, biomedical, and analytical aspects. Clin Chem.
39:2219–2228. 1993.PubMed/NCBI
|
|
25
|
Liu LS, Li J, Chen XT, Zhang HX, Fu Q,
Wang HY, Xiong YY, Liu S, Liu XM, Li JL, et al: Comparison of
tacrolimus and cyclosporin A in CYP3A5 expressing Chinese de novo
kidney transplant recipients: A 2-year prospective study. Int J
Clin Pract Suppl. 43–52. 2015. View Article : Google Scholar : PubMed/NCBI
|
|
26
|
Bechstein WO, Paczek L, Wramner L,
Squifflet JP and Zygmunt AJ: European Rapamune Tacrolimus Study
Group: A comparative, randomized trial of concentration-controlled
sirolimus combined with reduced-dose tacrolimus or standard-dose
tacrolimus in renal allograft recipients. Transplant Proc.
45:2133–2140. 2013. View Article : Google Scholar : PubMed/NCBI
|
|
27
|
Yap DY, Ma MK, Mok MM, Kwan LP, Chan GC
and Chan TM: Long-term data on tacrolimus treatment in lupus
nephritis. Rheumatology (Oxford). 53:2232–2237. 2014. View Article : Google Scholar : PubMed/NCBI
|
|
28
|
Bloch J, Hazzan M, Van der Hauwaert C,
Buob D, Savary G, Hertig A, Gnemmi V, Frimat M, Perrais M, Copin
MC, et al: Donor ABCB1 genetic polymorphisms influence
epithelial-to-mesenchyme transition in tacrolimus-treated kidney
recipients. Pharmacogenomics. 15:2011–2024. 2014. View Article : Google Scholar : PubMed/NCBI
|
|
29
|
Jiang S, Tang Q, Rong R, Tang L, Xu M, Lu
J, Jia Y, Ooi Y, Hou J, Guo J, et al: Mycophenolate mofetil
inhibits macrophage infiltration and kidney fibrosis in long-term
ischemia-reperfusion injury. Eur J Pharmacol. 688:56–61. 2012.
View Article : Google Scholar : PubMed/NCBI
|
|
30
|
Gooch JL, Barnes JL, Garcia S and Abboud
HE: Calcineurin is activated in diabetes and is required for
glomerul hypertrophy and ECM accumulation. Am J Physiol Renal
Physiol. 284:F144–F154. 2003. View Article : Google Scholar : PubMed/NCBI
|
|
31
|
Qi XM, Wu YG, Liang C, Zhang P, Dong J,
Ren KJ, Zhang W, Fang F and Shen JJ: FK506 ameliorates renal injury
in early experimental diabetic rats induced by streptozotocin. Int
Immunopharmacol. 11:1613–1691. 2011. View Article : Google Scholar : PubMed/NCBI
|
|
32
|
Peng T, Hu Z, Xia Q, Jiang B, Li X and
Yang X: A comparative study of the renoprotective effects of
benidipine and valsartan in primary hypertensive patients with
proteinuria. Arzneimittelforschung. 59:647–650. 2009.PubMed/NCBI
|
|
33
|
Jin H, Piao SG, Jin JZ, Jin YS, Cui ZH,
Jin HF, Zheng HL, Li JJ, Jiang YJ, Yang CW and Li C: Synergistic
effects of leflunomide and benazepril in streptozotocin-induced
diabetic nephropathy. Nephron Exp Nephrol. 126:148–156. 2014.
View Article : Google Scholar : PubMed/NCBI
|