Introduction
Selenium (Se) is a metalloid showing an intriguing
relation with human health, particularly with cancer (1,2) and
with other diseases (3,4). The main source of Se exposure is the
dietary intake, closely linked to Se content in soil. Conversely,
the contribution of other environmental sources is generally
negligible, although few studies outlined higher risk of neurologic
disease in areas with high levels of Se in drinking water (5–7) and
higher risk of cardiovascular hospitalization (8) and hematological malignancies
(9) due to higher exposure to Se
air levels. The primary dietary sources of Se in the Italian diet
is derived from meat, fish, cereals and dairy products (10,11).
Nevertheless, an accurate assessment of Se intake based on
individual food consumption is very difficult and dietary
assessment tools could fail to adequately measure Se intake because
foodstuff Se content changes according to the geographic variations
of soil Se concentration (10,12)
and the capacity of plants to absorb it (13). Furthermore, dietary supplements may
contribute substantially to Se intake and body tissue content
(14).
Se exposure has been assessed in epidemiologic
studies through several biomarkers, including its concentrations in
blood cells, serum or plasma, urine, hair and nails (15–19).
Toenail Se has been largely investigated as a surrogate of Se
intake (20,21) as toenail sample may represent a
useful biomarker for long-term Se exposure given the slow growth
rate (22) and has the advantage
to be easily collected being not invasive (23). Determinants of toenail Se levels
have been investigated in some studies (20,24–26),
but only a few assessed the influence of specific foodstuffs on
toenail Se content (10,27) and as far as we know no such study
examined its relation with circulating Se species.
In this study we assessed the levels of toenail Se
in a representative sample of Northern Italian population,
exploring the influence of demographic characteristics, lifestyles
and dietary intake of selected food and of serum Se species, and
finally environmental air Se levels.
Materials and methods
Study population
The methodology for the recruitment of the study
population was previously described (18,28).
Briefly, following the approval of local Ethics Committee, we
recruited a random sample of 50 subjects residing in Modena, using
the Stata ‘sample’ routine (Stata 11; Stata Corporation, College
Station, TX, USA) out of the list of eligible subjects from each
gender- and age-specific subgroup, by accessing the databases of
the Modena Municipality General Registry Office. We contacted these
subjects in 2011 by phone asking for their participation in the
study. Subjects who accepted to participate were invited to the
Modena Health Unit to give a venous blood sample in morning fasting
state. After the collection of their written consent, the blood
sample was collected in a plastic tube (BD 368815
Vacutainer® Plus plastic serum tube with red BD
Hemograd™ closure; Becton Dickinson SpA), immediately centrifuged
at 1,000 × g for 10 min and serum aliquots of 1 ml were stored at
−15°C until use. Moreover, we collected a sample of toenails using
the procedure already adopted in previous studies (29–31).
To summarize, we asked study subjects to yield a sample of their
toenails, after letting them grow for two weeks and avoiding the
use of chemical substances such as nail varnish or other specific
nail products.
We collected from all study participants general
information including smoking habits, education, occupational
history and use of dietary supplements. Secondly, we assessed their
dietary habits through a semi-quantitative food frequency
questionnaire used for the Central-Northern Italian population
within the EPIC study (32). This
questionnaire assessed the frequency and amount of consumption of
188 food items over the previous year, and allowed the frequency
and quantity of consumption of foodstuffs and the related intake of
nutrients and contaminants to be calculated using the Italian
version of the EPIC-Soft program (EPIC Project, Milan, Italy)
(33,34).
Laboratory analysis
Toenail sample
We stored the toenail clippings in a PPL tube (inert
polypropylene tubes with pressure cap; Incofar S.R.L., Modena,
Italy), and before analysis we washed the specimens using a 5%
Triton X-100 solution in deionized water (Sigma-Aldricht,
Darmstadt, Germany), we sonicated them for 15 min and after this we
rinsed and sonicated the samples again for 15 min in deionized
water. We dried the nails at 105°C for 3 h and we digested the
samples, weighing from 24.8 to 401.0 mg, in the Microwave
Laboratory system (Milestone ETHOS-TC, Shelton, CT, USA) using 7 ml
of HNO3 69% (nitric acid, 69%; Merck Suprapur™,
Darmstadt, Germany), 2 ml of H2O2 30%
(hydrogen peroxide, 30%; Merck Perhydrol, Darmstadt, Germany). We
finally transferred the cooled samples into a 25 ml flask
(polyethylene flask; Incofar S.R.L.) and diluted with Milli-Q water
(Millipore, Bedford, MA, USA).
We measured toenail Se content using a Zeeman-effect
corrected graphite furnace atomic absorption spectrometer (AAnalyst
600; Perkin-Elmer Inc., Waltham, MA, USA). A transversely-heated
graphite atomizer (THGA) graphite tube (Perkin-Elmer Inc., Waltham,
MA, USA) with end cap was used at atomization temperature of
1,900̊C, with electrodeless discharge lamp current set at 270 mA,
wavelength at 196 nm and a low slit of 2.0 nm. Matrix modifier used
was Pd+Mg(NO3)2. In order to overcome matrix
interference, we used the standard addition calibration technique,
by adding Se standard solutions to a pooled sample of digested
toenails. We used two reference materials for quality control in
each session, in both cases human hair, GBW 09101 (China National
Analysis Center for Iron and Steel, CSRI, China) and CRM 397
(European Community Bureau of Reference, Geel, Belgium).
Serum species
Se speciation methodology has been describe in
details elsewhere (18). To
summarize, a 1 ml serum aliquot for each study subject was
transported by air courier deep frozen in dry ice to the laboratory
of the Research Center for Environmental Health (Research Unit
Analytical BioGeoChemistry, Neuherberg, Germany), and kept
continuously frozen until use. We slowly thawed samples in a
refrigerator at 4̊C, vortexed and subsequently analyzed them.
Suprapure grade chemicals were used throughout. Selenite (Se-IV),
selenate (Se-VI), selenomethionine (Se-Met), selenocysteine
(Se-Cys), thioredoxin reductase (EC 1.8.1.9.)-bound selenium
(Se-TrxR), glutathione peroxidase (EC 232-749-6)-bound selenium
(Se-GpX), human serum albumin (HSA) and Tris buffer were from
Sigma-Aldrich (Deisenhofen, Germany). Working standards of Se
species were prepared daily from their stock standard solutions by
appropriate dilution with Milli-Q water. Selenoprotein P (SePP) is
not commercially available as a standard compound. We prepared SePP
from serum using affinity chromatography (AFC), and purified
AFC-SePP fraction by a mass-calibrated size exclusion
chromatography (SEC) column, where SePP eluted at an RT calculated
for 62 kDa. We analyzed total serum Se by graphite furnace atomic
absorption spectrometry based on the method of the MAK
collection-biomonitoring methods (35).
We determined Se species Se-IV, Se-VI, Se-Met,
Se-Cys, Se-TrxR, Se-GpX, SePP and HSA-Se in serum samples using
anion exchange chromatography (IEC) coupled with inductively
coupled plasma dynamic reaction cell mass spectrometry (ICP-DRC-MS;
NexION; Perkin-Elmer Inc., Sciex, Toronto, ON, Canada) according to
methodologies previously established for biological matrices
(36,37). In general the IEC separation
followed Xu et al (38),
but was slightly modified as previously described (18).
We connected a Knauer 1100 Smartline inert Series
gradient HPLC system (Knauer, Berlin, Germany) to an anion exchange
column AG 11 (precolumn, 50×4 mm) + AS 11 (analytical column, 250×2
mm I.D.) both from Thermo Fisher Scientific, Dionex (Idstein,
Germany) for species separation. The sample volume was 100 µl. The
mobile phases were: eluent A, 10 mM Tris-HAc, pH 8.0 and eluent B,
A + 500 mM NH4Ac, pH 8.0. Gradient elution expressed as %-eluent A:
0–3 min, 100%; 3–10 min, 100–60%; 10–23 min, 60–45%; 23–26 min,
45–43%; 26–28 min, 43–0%; 28–52 min, 0% and 52–60 min, 100%. The
flow rate was 0.70 ml/min. For internal standardization we mixed
the column effluent with 1 µg/l Rh (final concentration, Rh flow
rate: 0.1 ml/l) and directed to ICP-MS. The experimental settings
chosen for ICP-DRC-MS (NexION; Perkin-Elmer Inc., Sciex) after
optimization were: radio frequency power, 1250 W; plasma gas flow,
15 l Ar/min; auxiliary gas flow, 1.05 l Ar/min; nebulizer gas flow,
0.94 l Ar/min; daily optimized, dwell time 300 msec, ions montored:
78 Se, 80 Se, 103 Rh, DRC reaction gas: CH4 reaction at
0.58 ml/min, DRC rejection parameter, q=0.6.
We used the standard addition method for
standard-retention-time matched identification of Se species and as
QC means in quantification. Species identity was further confirmed
using a 2D approach of IEC-capillary electrophoresis (‘Biofocus
3000’ capillary electrophoresis system; BioRad, Munich, Germany)
equipped with an uncoated capillary (Chromatographie Service GmbH,
Langerwehe, Germany) 120 cm×50 µm ID was used for CE-ICP-DRC-MS
analysis as previously described (37). Species identification was regarded
as acceptable when the species matched the standard compounds with
both chromatography/electrophoretic techniques (match in first and
second technique). We performed peak quantification from
chromatograms by comparing peak areas with peak area calibration
curves using Peakfit™ software (Systat Software Inc., San Jose, CA,
USA). The limit of detection for all Se species in serum was 0.02
µg/l. Quality control, inter laboratory analytical comparison and
recovery determination of individual Se species have been reported
in detail (18).
Statistical analysis
Percentiles distribution, mean and standard
deviation were calculated for Se in toenails. As we found one
sample with very high toenail Se content (2.78 µg/g), we considered
it as an outlier probably due to contamination of the sample and we
removed the subjects from the entire data analyses. Mean comparison
t-test was performed according to specific subgroup categories,
namely, gender, age (<50 and ≥50 years), BMI (<25 and ≥25),
use of Se supplements and smoking habits (never, former and current
smokers). Pearsons coefficients along with 95% confidence intervals
(CIs) were calculated between Se and continuous variables (namely
age, BMI, serum Se species and food intake). Bivariate and
multivariate regress models were performed in order to test the
influence on toenail Se of serum Se species: i) a crude model; ii)
a partial model adjusted for gender, age and storage time; and iii)
a fully adjusted model adding Se supplement use.
All foodstuff were grouped according to INN-CA
patterns (39) in cereals, meat,
fish and seafood, dairy products, sweets, vegetables, legumes,
fruits and dry fruits. In order to reduce the influence of
measurement errors frequently associated with the use of food
frequency questionnaires, by decreasing artificial inter-individual
variation introduced by under and over-reporting of food intake, we
adjusted the estimates, for total energy intake, using the Willetts
residual method (40). Pearsons
correlation between toenail Se and residue of dietary intake and
estimated dietary Se intake were performed. Between toenail Se and
dietary products we performed also three regression models: i)
adjusted only for energy intake (crude); ii) partial adjusted for
energy intake, gender and age; and iii) fully adjusted, adding use
of Se supplement. Sensitivity analyses adding smoking habits (coded
as 0, 1 and 2 for never, former and current smokers, respectively)
and BMI were tested. Finally, the environmental source of Se
through air was tested using levels of particulate matter <10 µm
(PM10) estimated with a methodology previously reported
for other trace elements [i.e., cadmium (28) and manganese in this issue (41)].
Results
Characteristic of study subjects were described in
previous studies (18,28). To summarize, age ranged from 35 to
70 years, and males and females were almost equally represented.
Regarding occupational status, six were employed in the engineering
industry, half in tertiary sector (mainly workers in the health
system, education and business), while ten were retired and two
were housewives. Ten subjects reported a current ongoing
consumption of dietary supplements containing Se, corresponding to
an average Se daily additional intake of 28.6 µg. Twenty-six were
never smokers, fifteen were former smokers, all but one for over 10
years, while nine were current smokers. Pack-year mean (SD) values
were similar, namely 14.0 (10.2) and 13.9 (9.8) for former and
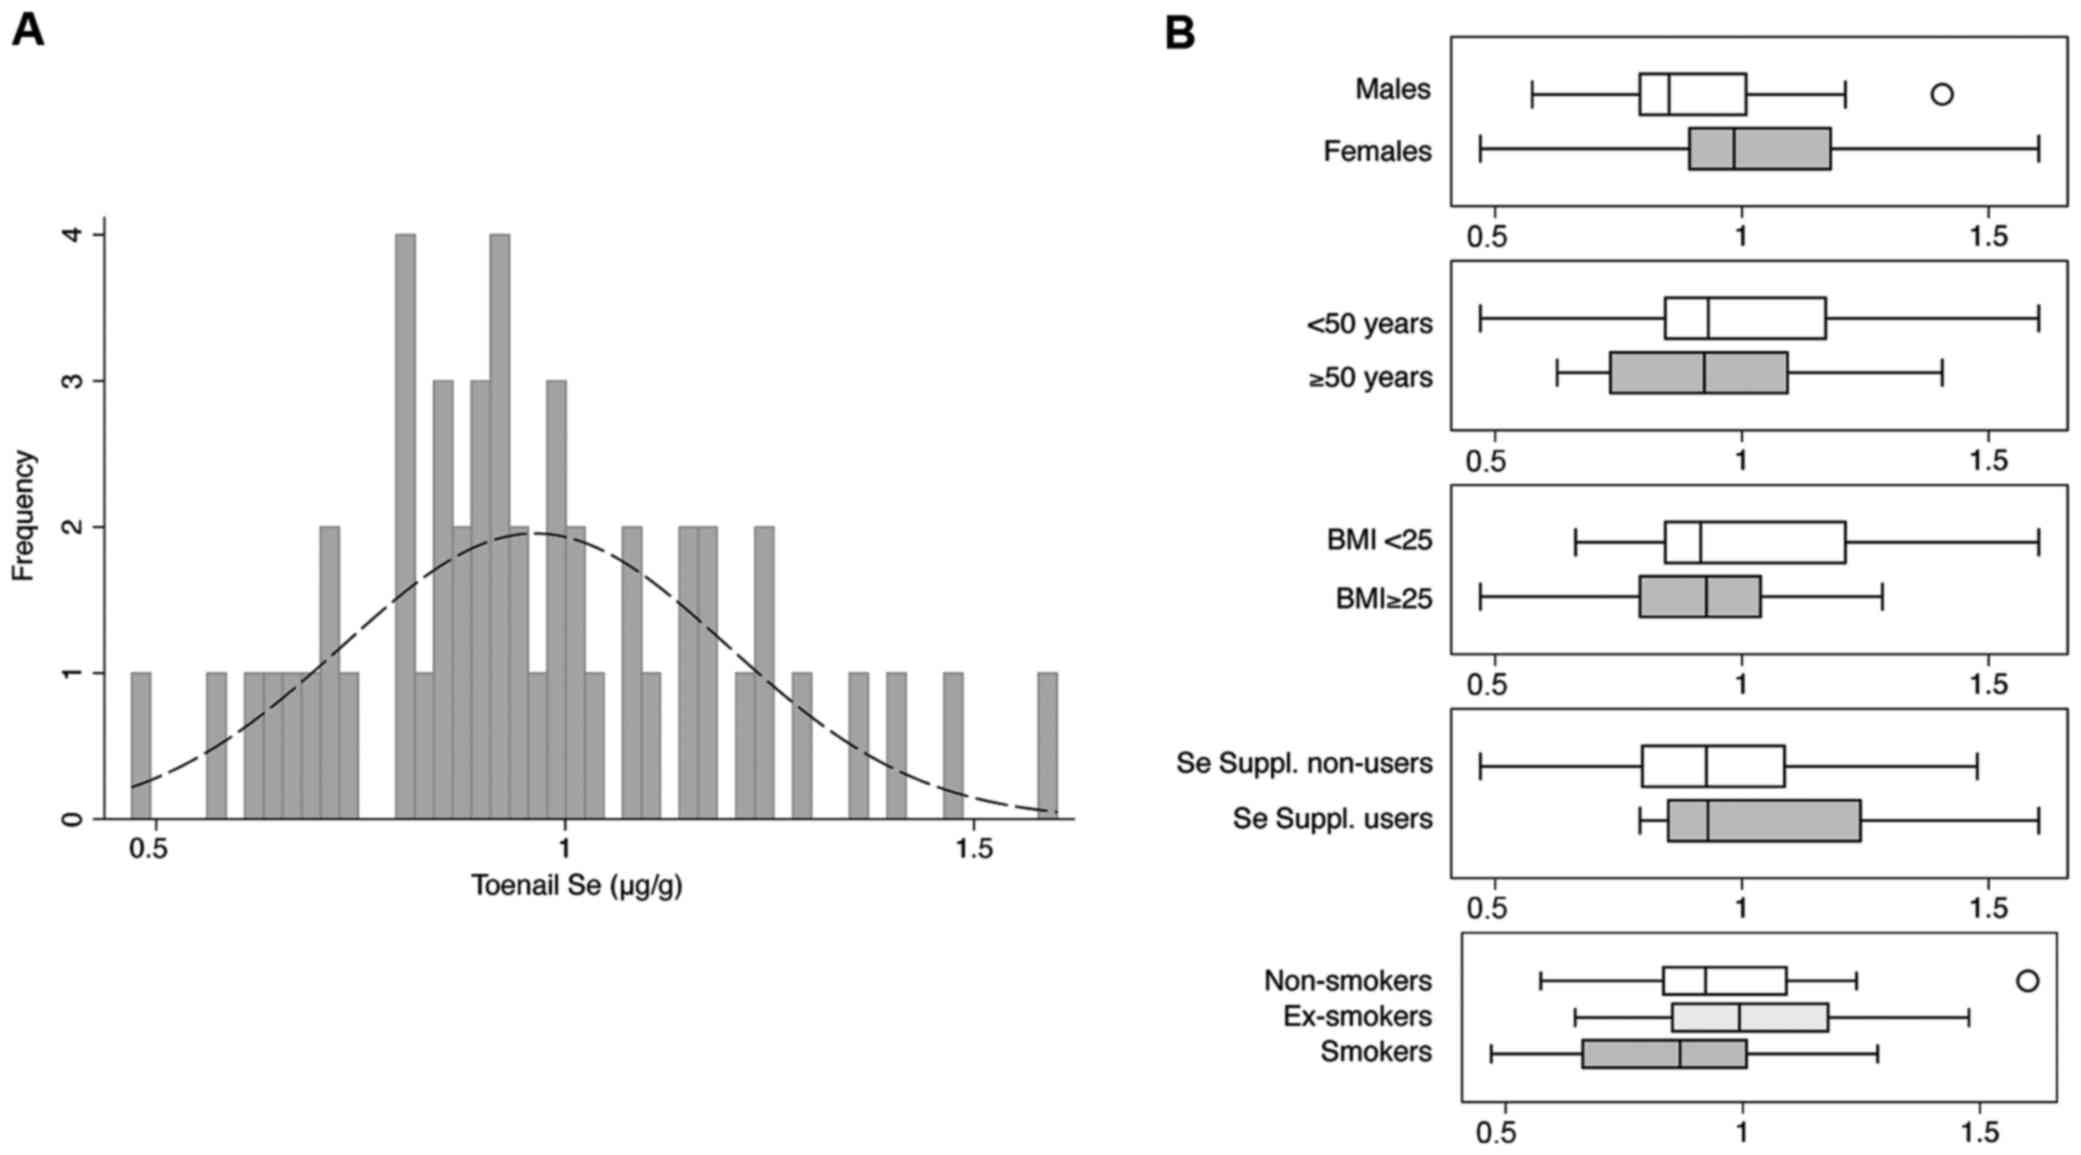
current smokers, respectively. Overall toenail Se mean was 0.96
µg/g, ranged from 0.47 to 1.60 µg/g, with slightly higher levels in
females, in normal weight subjects and in those taking supplements
containing Se (Table I and
Fig. 1). Pearsons coefficients
between toenail Se and age showed an inverse correlation as well
for BMI with coefficients of −0.169 (95% CI, −0.427 to 0.115;
P=0.241) for age and −0.139 (95% CI, −0.500 to −0.262; P=0.017) for
BMI, respectively. In smoking habits, former smokers showed higher
levels followed by never and current smokers.
 | Table I.Distribution of toenail Se (µg/g) in
total population and in selected group categories. |
Table I.
Distribution of toenail Se (µg/g) in
total population and in selected group categories.
| Variables | No. of
subjects | 5th | 25th | 50th | 75th | 95th | Mean (SD) |
P-valuea |
|---|
| Total | 50 | 0.63 | 0.82 | 0.93 | 1.11 | 1.48 | 0.96 (0.24) |
|
| Gender |
|
|
|
|
|
|
| 0.077 |
|
Male | 25 | 0.63 | 0.79 | 0.85 | 1.01 | 1.21 | 0.90 (0.20) |
|
|
Female | 25 | 0.66 | 0.89 | 0.98 | 1.18 | 1.48 | 1.02 (0.26) |
|
| Age |
|
|
|
|
|
|
| 0.463 |
| <50
years | 23 | 0.57 | 0.84 | 0.93 | 1.17 | 1.48 | 0.99 (0.26) |
|
| ≥50
years | 27 | 0.65 | 0.73 | 0.92 | 1.09 | 1.36 | 0.94 (0.22) |
|
| BMI |
|
|
|
|
|
|
| 0.102 |
|
<25 | 23 | 0.71 | 0.84 | 0.92 | 1.21 | 1.48 | 1.02 (0.26) |
|
|
≥25 | 27 | 0.57 | 0.79 | 0.93 | 1.04 | 1.24 | 0.91 (0.21) |
|
| Se suppl.
users |
|
|
|
|
|
|
| 0.147 |
| No | 40 | 0.60 | 0.80 | 0.93 | 1.09 | 1.32 | 0.94 (0.22) |
|
|
Yes | 10 | 0.79 | 0.85 | 0.93 | 1.24 | 1.60 | 1.06 (0.28) |
|
| Smoking
habitsb |
|
|
|
|
|
|
| 0.268 |
| Never
smokers | 26 | 0.71 | 0.83 | 0.92 | 1.09 | 1.24 | 0.96 (0.22) |
|
| Former
smokers | 15 | 0.65 | 0.85 | 0.99 | 1.18 | 1.48 | 1.03 (0.25) |
|
| Current
smokers | 9 | 0.47 | 0.66 | 0.87 | 1.01 | 1.28 | 0.86 (0.25) |
|
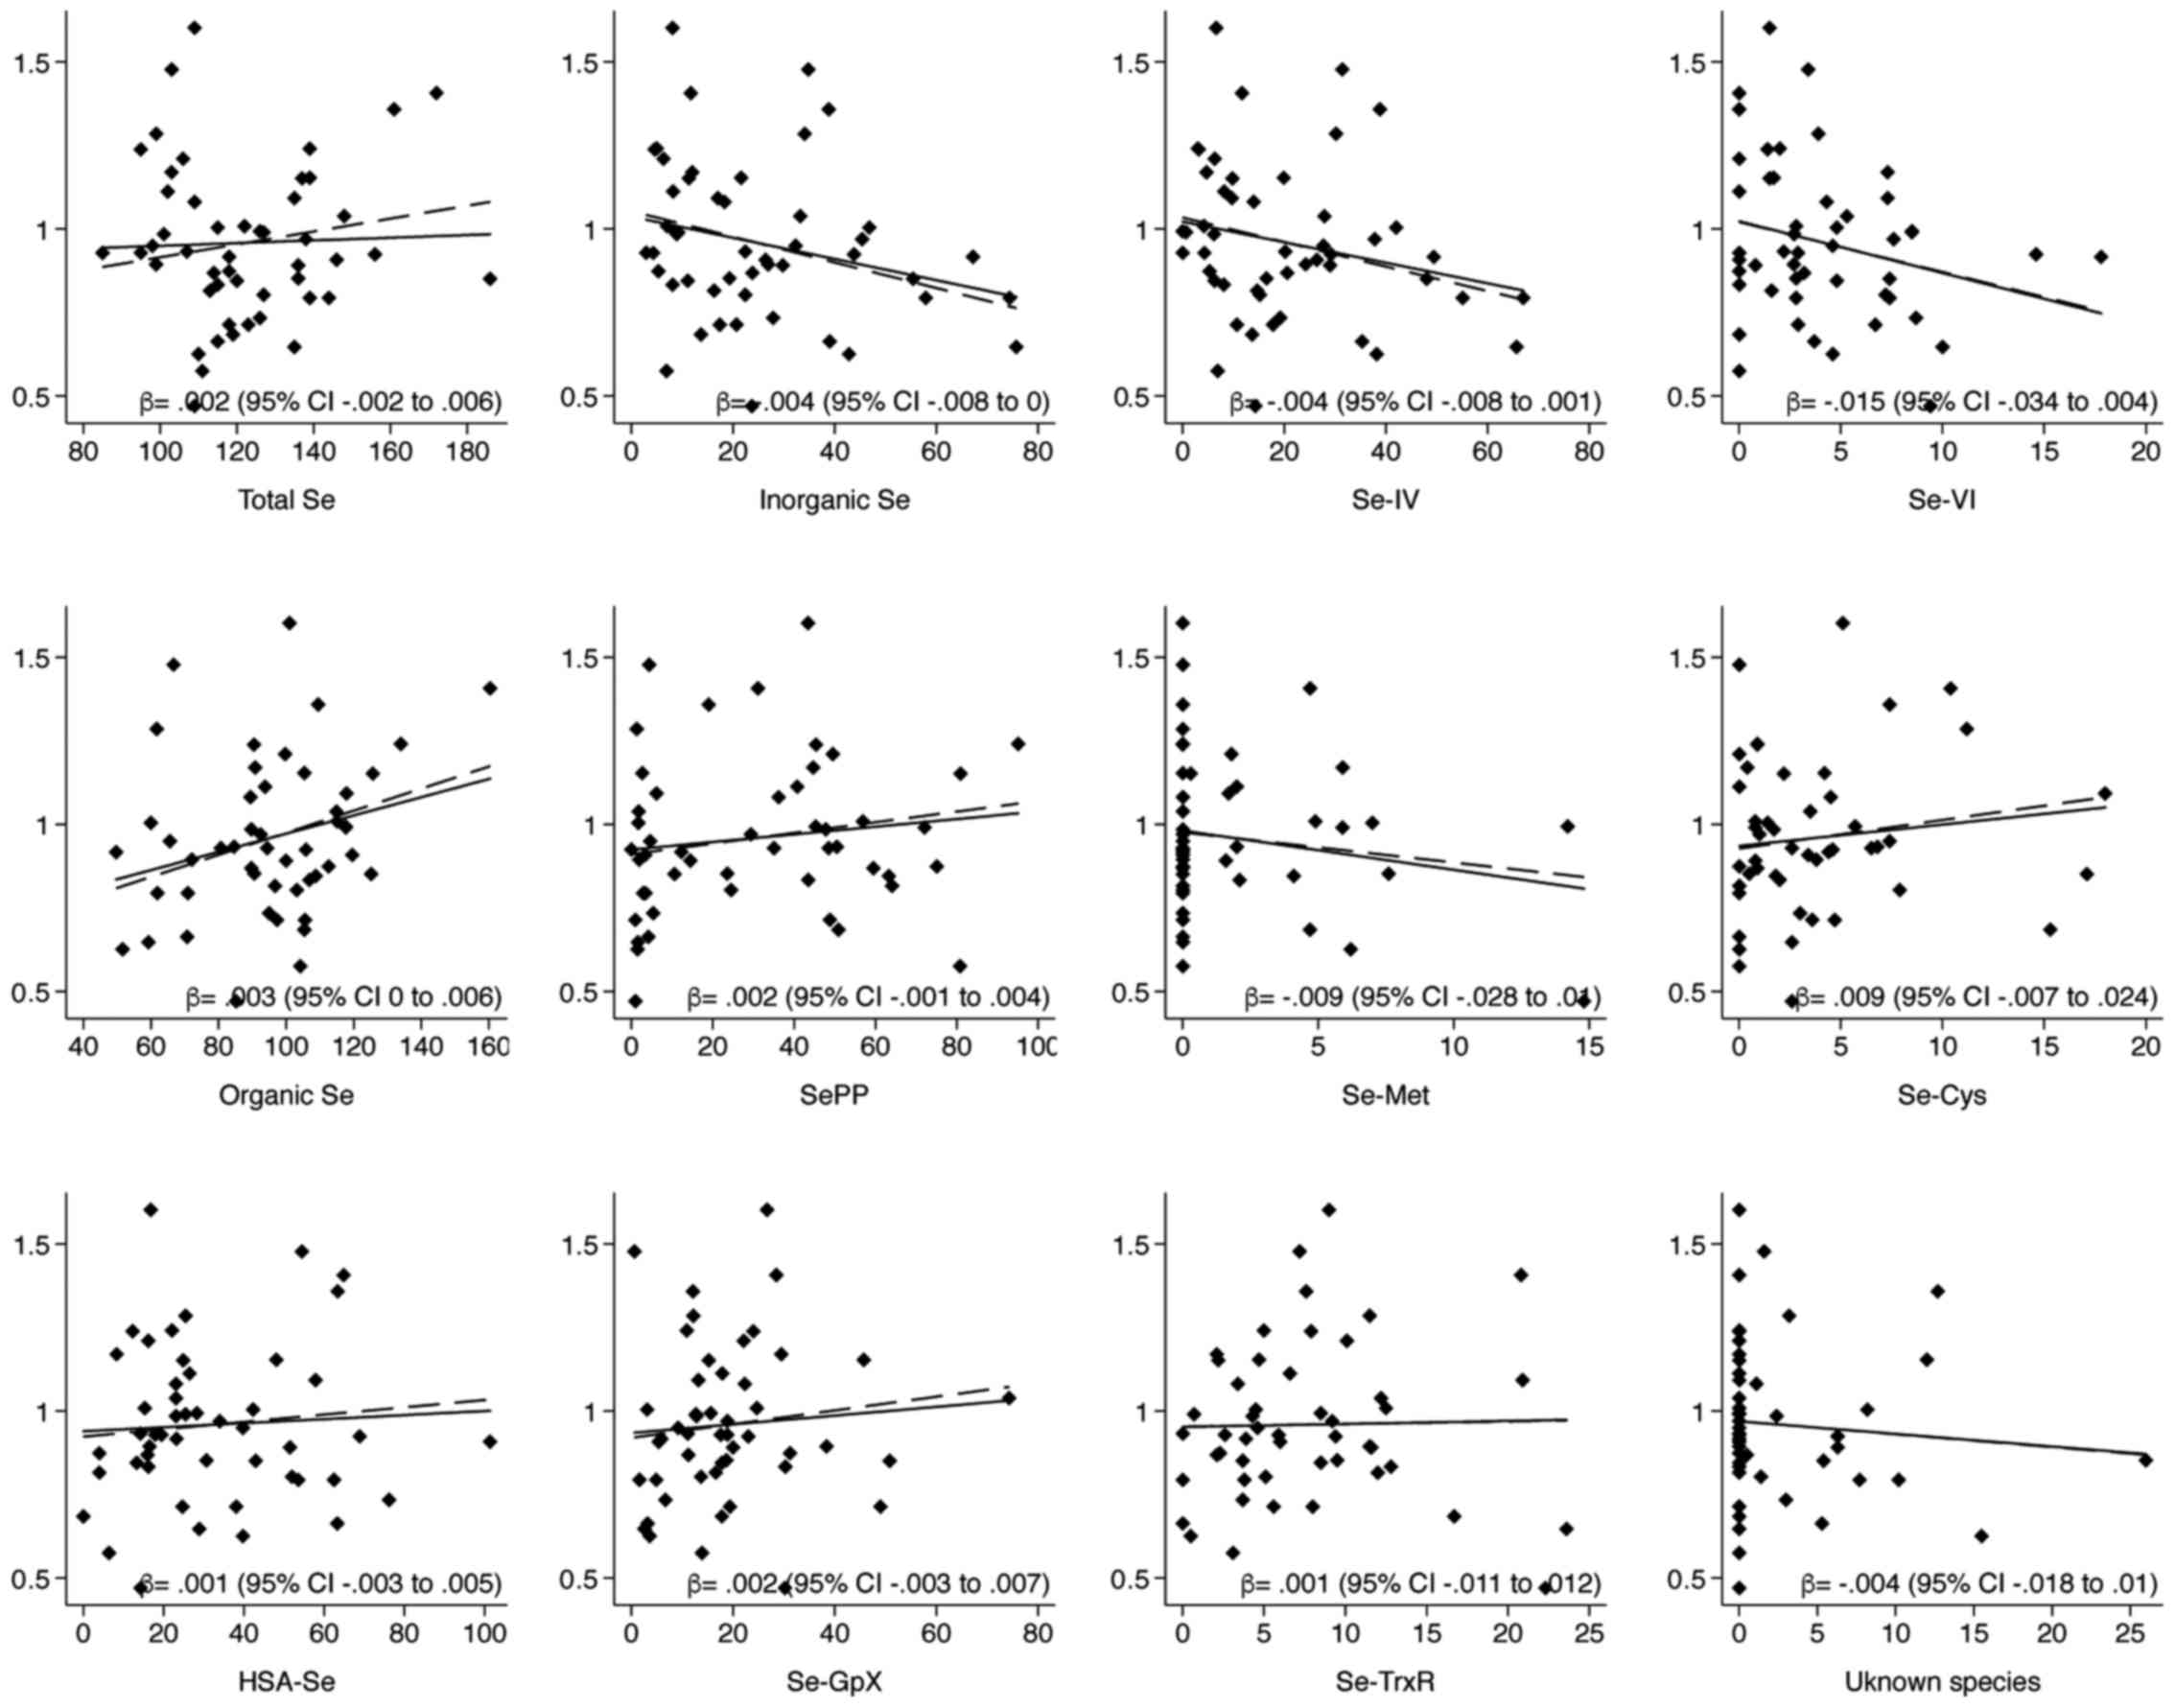
Pearson's correlations between toenail Se and serum
levels of total Se and its species (Table II) showed a positive relation with
organic Se species, mainly SePP and Se-Cys, while an inverse one
with inorganic forms. Results of Se-Met showed opposite results due
to high number of value below the detection limit. Linear
regression models demonstrated similar results, also adjusting for
possible confounders including use of Se supplements (Fig. 2). Alternatively, adding to the
presented models smoking habits did not substantially change the
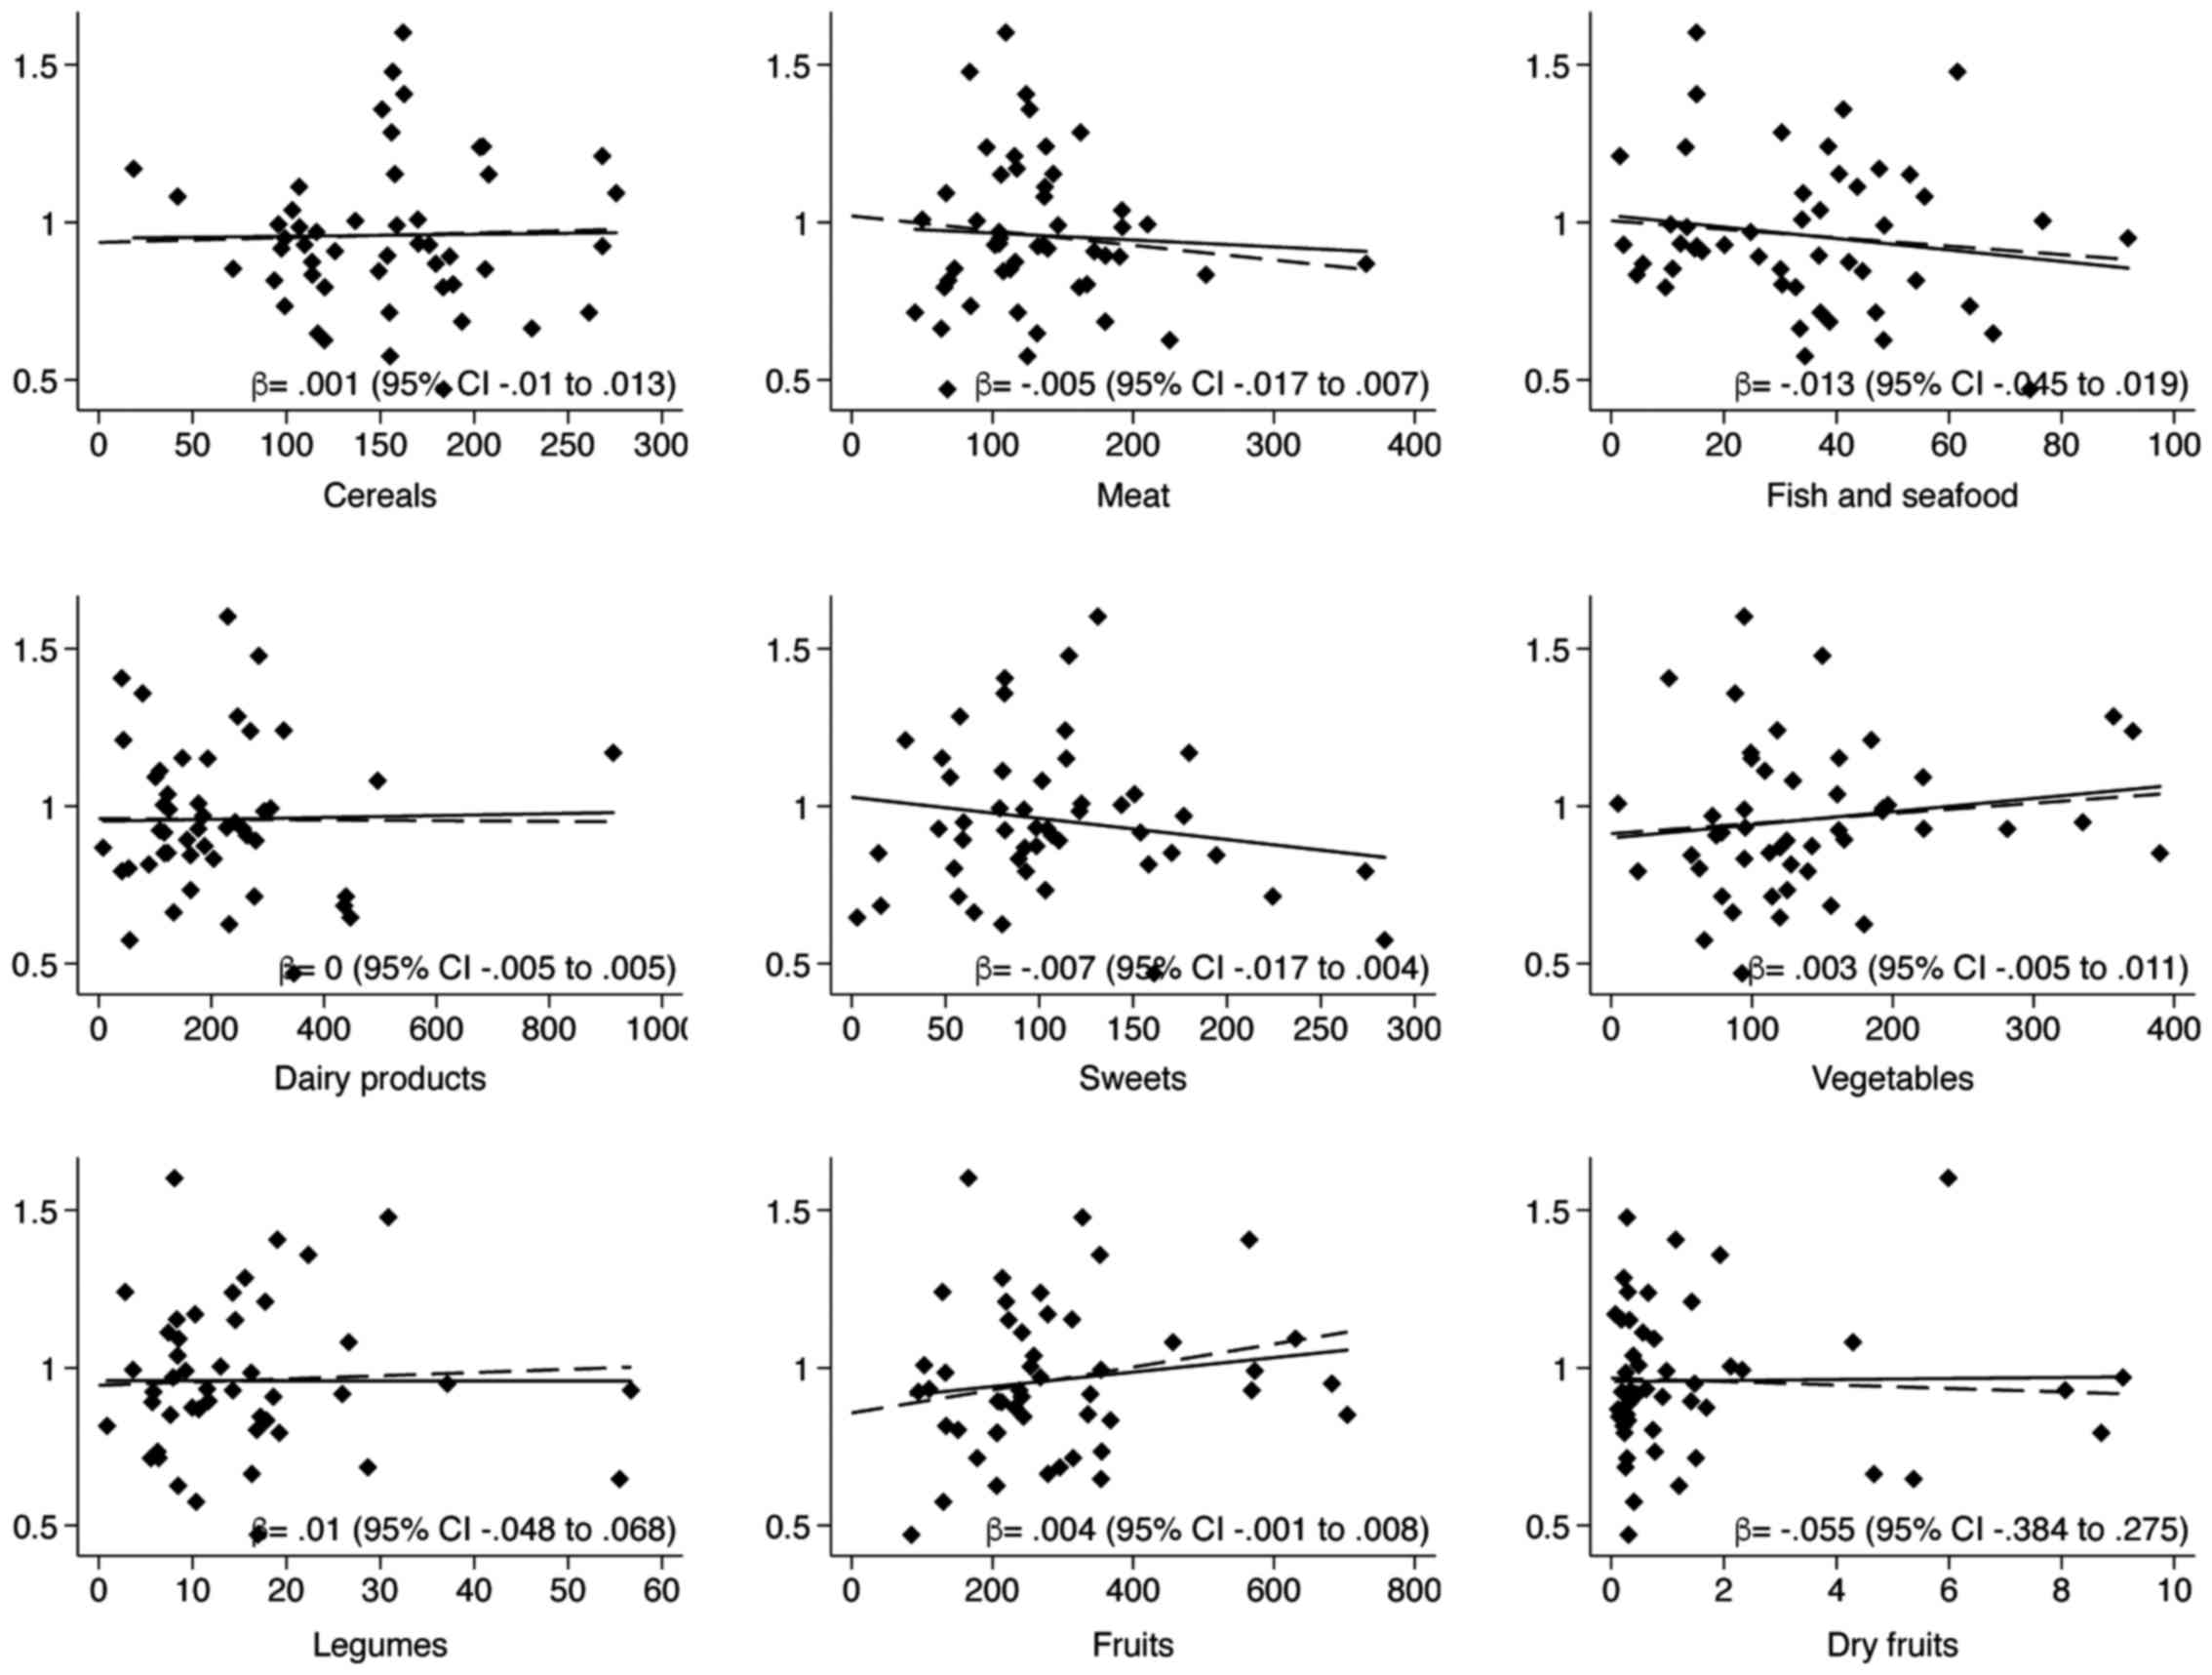
estimates (data not shown). Correlations with food items showed a
direct relation only with fruits and slightly with vegetables,
whilst a negative one with fish and sweets, and finally null for
all other foodstuff (Table III).
Linear regression models (crude and adjusted for energy intake,
age, gender and use of Se supplement) demonstrated similar results
(Fig. 3).
| Table II.Pearson's correlation coefficient (r)
between toenail Se and serum Se species. |
Table II.
Pearson's correlation coefficient (r)
between toenail Se and serum Se species.
| Species | r | 95% CI | P-value |
|---|
| Total Se | 0.036 | −0.248 to
0.314 | 0.809 |
| Inorganic Se | −0.254 | −0.499 to
0.030 | 0.079 |
| Se-IV | −0.222 | −0.474 to
0.063 | 0.125 |
| Se-VI | −0.255 | −0.500 to
0.028 | 0.077 |
| Organic Se | 0.262 | −0.020 to
0.506 | 0.069 |
| SePP | 0.131 | −0.156 to
0.398 | 0.370 |
| Se-Met | −0.171 | −0.432 to
0.115 | 0.239 |
| Se-Cys | 0.119 | −0.168 to
0.387 | 0.415 |
| Se-HSA | 0.056 | −0.229 to
0.332 | 0.703 |
| Se-GpX | 0.079 | −0.207 to
0.352 | 0.590 |
| Se-TrxR | 0.022 | −0.260 to
0.302 | 0.878 |
| Uknown species | −0.082 | −0.355 to
0.204 | 0.574 |
| Table III.Pearson's correlation coefficient (r)
between toenail Se and different food intake. |
Table III.
Pearson's correlation coefficient (r)
between toenail Se and different food intake.
| Categories | r | 95% CI | P-value |
|---|
| Cereals | 0.015 | −0.268 to
0.295 | 0.920 |
| Meat | −0.053 | −0.329 to
0.232 | 0.718 |
| Fish and
seafood | −0.161 | −0.423 to
0.126 | 0.270 |
| Dairy products | 0.020 | −0.263 to
0.299 | 0.893 |
| Sweets | −0.177 | −0.437 to
0.109 | 0.223 |
| Vegetables | 0.151 | −0.136 to
0.415 | 0.299 |
| Legumes | −0.001 | −0.282 to
0.280 | 0.993 |
| Fruits | 0.155 | −0.132 to
0.418 | 0.287 |
| Dry fruits | 0.015 | −0.267 to
0.295 | 0.917 |
Similarly, Pearsons correlation between toenail Se
and Se intake estimated using the Epic FFQ showed little relation,
a correlation coefficient of −0.164 (95% CI, −0.0426 to 0.123;
P=0.260), while linear regression coefficients were −0.002 (95% CI,
−0.004 to 0.001; P=0.236), −0.001 (95% CI, −0.004 to 0.001;
P=0.264) and −0.001 (95% CI, −0.004 to 0.002; P=0.520) in crude,
partial and fully adjusted models, respectively. Toenail Se was not
associated with personal exposure to outdoor air PM10,
as Pearsons correlation was 0.048 (95% CI, −0.233 to 0.322;
P=0.741).
Discussion
This study provided toenail Se levels in a
representative sample of Northern Italian population. Our results
are in line with previous findings conducted on healthy subjects as
we found higher levels of toenail Se in supplement users (14,20,26,27,42)
and in females (26,43,44),
although some studies did not show any gender difference (14,45)
or conversely pointed out elevated Se exposure in males (27). Similarly, lower Se content was
detected in current smokers respect to never and former smokers
(20,24–27,44,45),
while age demonstrated a slight inverse relation reported in some
(24,27) but not in all studies (20,25,26,45).
Gender and genetics factors could play a role in influence Se
toenail levels. A recent study carried out in different ethnic
groups pointed out a positive correlation within Caucasian males
but null in females, whilst inverse correlation was found in
African females and again null in African males (44), although stratified analysis in our
sample yielded similar negative correlation in both genders, with a
stronger effect in females (data not shown).
Generally, studies correlating Se content in toenail
with other biological indicators are performed comparing only total
Se content (14,21,45).
We carried out an innovative analysis as we explored the relation
between levels of toenail Se with total and individual Se serum
species. Our peculiar analysis pointed out a positive relation with
most of Se organic forms, mainly Se-PP and Se-Cys, while inverse
with the inorganic forms. These results were confirmed after
adjusting for possible confounders, including the use of Se
supplements (Fig. 2). A possible
explanation of the opposite behavior of organic and inorganic Se
forms could be related to toenail composition. In fact, human nails
are a modification of the skin, thus they are primary made of
keratins, a family of proteins with an amino acid composition
highly enriched in cysteine, thus they could accumulate Se either
by binding to or by replacement of sulfhydryl sulfur (46,47).
Interestingly, a recent study of fingernail organic elemental
composition found that females had higher levels of sulfur, while
sulfur content did not vary with ageing (48).
Correlation of toenail Se and intake of different
food expected to be major contributors of Se intake yielded
inconclusive results. We found a null correlation with meat, dairy
products and cereals, whilst an inverse correlation appeared for
fish and seafood intake. A slight positive correlation was found
with vegetable and fruit intake, but only the latter was confirmed
in the multivariate model adjusted for potential confounders. Even
in most human diets, the leading sources of Se are cereals, meats
and fish, food intake estimated with frequency questionnaires or
composition tables may have limited accuracy and reliability due to
the wide variation of Se contents in food depending on geographical
area (1,17). About different Se species in food,
the main form of Se in foods should be Se-Met which can be
synthesized only by plants, while both plants and animals can
incorporate Se-Met into proteins as a mimic for the correspondent
sulfur-amino acid methionine (49). Studies conducted on edible seafood
and canned tuna highlighted a higher fish content of Se-Met
(29–70%) and selenite/selenate (12–45%) (50,51).
A low fish intake in our sample is unlikely, as the median fish
intake in our sample was 35 g/day (IQR, 15.5–47.4 g/day), similarly
with those reported for other Italian populations (11,39).
Interestingly, a recent in vitro study by using a gastric
and intestinal digestion methods, pointed out a low bioavailability
of total Se and Se species from fish and seafood (52). Regarding milk and dairy products,
the main Se species appear to be both Se-Cys and selenite (53), thus this could have influenced the
null results. Finally, fruits and vegetables contain relatively
small amounts of Se, with the possible exception of garlic, onion
and cabbage (also defined ‘Se accumulator’). An analysis splitting
vegetables into Se accumulator and Se non-accumulator did not
yielded different estimates (data not shown) (13).
The strengths of our study consists of the
correlation toenail Se with the various Se serum species, yielding
a switch from evaluation of overall content a trace element to the
speciation analysis. The topic is of growing interest in medicine
and biology, due to the different, and in some cases, opposite
effects that could be carried by different species on target
tissues, as already demonstrated for Se itself and other trace
elements (18,54–56).
A few limitations of this study must be outlined.
First, the retention of organic Se forms in body tissues is
consistently higher than that of inorganic compounds (57), and therefore distribution of Se
species in human tissues may not necessarily reflect the relative
intake of these species through diet and other sources, nor their
toxicity and biological effects (58). Moreover, the limited sample size of
our study, which was a consequence of the difficulties in
recruiting volunteers from the general population, reduced the
statistical stability of the point estimates. However, despite this
limitation, our study population still seems to represent the
general Italian population as far as demographic characteristics
and lifestyle factors are concerned (59,60).
In conclusion, our cross-sectional analysis is to
our knowledge the first that assessed the relation between Se
levels in toenail with serum Se species, detecting an opposite
behavior depending on the type of Se forms considered. Furthermore,
it is one of the few studies that explored the influence of
different food on Se toenail content, showing a null relation with
cereals, meat and dairy products, a direct correlation only with
fruits and a little with vegetables intake, whilst inverse relation
with fish and seafood consumption, although more studies are
needed. Finally, air Se exposure assessed through PM10
estimate levels, seemed to barely influence the toenail Se
levels.
References
|
1
|
Vinceti M, Dennert G, Crespi CM, Zwahlen
M, Brinkman M, Zeegers MP, Horneber M, DAmico R and Del Giovane C:
Selenium for preventing cancer. Cochrane Database Syst Rev.
3:CD0051952014.
|
|
2
|
Vinceti M and Rothman KJ: More results but
no clear conclusion on selenium and cancer. Am J Clin Nutr.
104:245–246. 2016. View Article : Google Scholar : PubMed/NCBI
|
|
3
|
Jablonska E and Vinceti M: Selenium and
human health: witnessing a copernican revolution? J Environ Sci
Health C Environ Carcinog Ecotoxicol Rev. 33:328–368. 2015.
View Article : Google Scholar : PubMed/NCBI
|
|
4
|
Vinceti M, Burlingame B, Filippini T,
Naska A, Bargellini A and Borella P: The epidemiology of selenium
and human healthSelenium: Its Molecular Biology and Role in Human
Health. Hatfield DL, Schweizer U, Tsuji PA and Gladyshev VN:
Springer International Publishing; Cham: pp. 365–376. 2016,
View Article : Google Scholar
|
|
5
|
Tsongas TA and Ferguson SW: Human health
effects of selenium in a rural Colorado drinking water supply. In:
Trace Substances in Environmental Health-XIA Symposium. Hemphill
DD: University of Missouri; Columbia: pp. 30–35. 1977
|
|
6
|
Valentine JL: Environmental occurrence of
selenium in waters and related health significance. Biomed Environ
Sci. 10:292–299. 1997.PubMed/NCBI
|
|
7
|
Vinceti M, Ballotari P, Steinmaus C,
Malagoli C, Luberto F, Malavolti M and Rossi Giorgi P: Long-term
mortality patterns in a residential cohort exposed to inorganic
selenium in drinking water. Environ Res. 150:348–356. 2016.
View Article : Google Scholar : PubMed/NCBI
|
|
8
|
Ito K, Mathes R, Ross Z, Nádas A, Thurston
G and Matte T: Fine particulate matter constituents associated with
cardiovascular hospitalizations and mortality in New York City.
Environ Health Perspect. 119:467–473. 2011. View Article : Google Scholar : PubMed/NCBI
|
|
9
|
Heck JE, Park AS, Qiu J, Cockburn M and
Ritz B: Risk of leukemia in relation to exposure to ambient air
toxics in pregnancy and early childhood. Int J Hyg Environ Health.
217:662–668. 2014. View Article : Google Scholar : PubMed/NCBI
|
|
10
|
Mariottini E, Capel R and Grasso Bigazzi
C: Selenium content in foods. J Prev Med Hyg. 36:55–60. 1995.
|
|
11
|
Lombardi-Boccia G, Aguzzi A, Cappelloni M,
Di Lullo G and Lucarini M: Total-diet study: dietary intakes of
macro elements and trace elements in Italy. Br J Nutr.
90:1117–1121. 2003. View Article : Google Scholar : PubMed/NCBI
|
|
12
|
Shacklette HT and Boerngen JG: Element
concentrations in soils and other surficial materials of the
conterminous United States. U.S. Geological Paper 1270United States
Goverment Printing Office. Washington: 1984
|
|
13
|
Terry N, Zayed AM, De Souza MP and Tarun
AS: Selenium in higher plants. Annu Rev Plant Physiol Plant Mol
Biol. 51:401–432. 2000. View Article : Google Scholar : PubMed/NCBI
|
|
14
|
Satia JA, King IB, Morris JS, Stratton K
and White E: Toenail and plasma levels as biomarkers of selenium
exposure. Ann Epidemiol. 16:53–58. 2006. View Article : Google Scholar : PubMed/NCBI
|
|
15
|
Combs GF Jr, Watts JC, Jackson MI, Johnson
LK, Zeng H, Scheett AJ, Uthus EO, Schomburg L, Hoeg A, Hoefig CS,
et al: Determinants of selenium status in healthy adults. Nutr J.
10:752011. View Article : Google Scholar : PubMed/NCBI
|
|
16
|
EFSA Panel on Dietetic Products, Nutrition
and Allergies (NDA): Scientific opinion on dietary reference values
for selenium. EFSA. 12:1–67. 2014.
|
|
17
|
Vinceti M, Crespi CM, Malagoli C, Del
Giovane C and Krogh V: Friend or foe? The current epidemiologic
evidence on selenium and human cancer risk. J Environ Sci Health C
Environ Carcinog Ecotoxicol Rev. 31:305–341. 2013. View Article : Google Scholar : PubMed/NCBI
|
|
18
|
Vinceti M, Grill P, Malagoli C, Filippini
T, Storani S, Malavolti M and Michalke B: Selenium speciation in
human serum and its implications for epidemiologic research: a
cross-sectional study. J Trace Elem Med Biol. 31:1–10. 2015.
View Article : Google Scholar : PubMed/NCBI
|
|
19
|
Skalny AV, Simashkova NV, Klyushnik TP,
Grabeklis AR, Radysh IV, Skalnaya MG and Tinkov AA: Analysis of
hair trace elements in children with autism spectrum disorders and
communication disorders. Biol Trace Elem Res. Oct 26–2016.(Epub
ahead of print). View Article : Google Scholar
|
|
20
|
Ovaskainen ML, Virtamo J, Alfthan G,
Haukka J, Pietinen P, Taylor PR and Huttunen JK: Toenail selenium
as an indicator of selenium intake among middle-aged men in an area
with low soil selenium. Am J Clin Nutr. 57:662–665. 1993.PubMed/NCBI
|
|
21
|
Longnecker MP, Stram DO, Taylor PR,
Levander OA, Howe M, Veillon C, McAdam PA, Patterson KY, Holden JM,
Morris JS, et al: Use of selenium concentration in whole blood,
serum, toenails, or urine as a surrogate measure of selenium
intake. Epidemiology. 7:384–390. 1996. View Article : Google Scholar : PubMed/NCBI
|
|
22
|
Yaemsiri S, Hou N, Slining MM and He K:
Growth rate of human fingernails and toenails in healthy American
young adults. J Eur Acad Dermatol Venereol. 24:420–423. 2010.
View Article : Google Scholar : PubMed/NCBI
|
|
23
|
Krogh V, Pala V, Vinceti M, Berrino F,
Ganzi A, Micheli A, Muti P, Vescovi L, Ferrari A, Fortini K, et al:
Toenail selenium as biomarker: reproducibility over a one-year
period and factors influencing reproducibility. J Trace Elem Med
Biol. 17:(Suppl 1). 31–36. 2003.PubMed/NCBI
|
|
24
|
Hunter DJ, Morris JS, Chute CG, Kushner E,
Colditz GA, Stampfer MJ, Speizer FE and Willett WC: Predictors of
selenium concentration in human toenails. Am J Epidemiol.
132:114–122. 1990. View Article : Google Scholar : PubMed/NCBI
|
|
25
|
van den Brandt PA, Goldbohm RA, vant Veer
P, Bode P, Hermus RJ and Sturmans F: Predictors of toenail selenium
levels in men and women. Cancer Epidemiol Biomarkers Prev.
2:107–112. 1993.PubMed/NCBI
|
|
26
|
Morris JS, Spate VL and Ngwenyama RA:
Determinants of selenium in the toenail biomonitor. J Radioanal
Nucl Chem. 269:283–290. 2006. View Article : Google Scholar
|
|
27
|
Park K, Rimm E, Siscovick D, Spiegelman D,
Morris JS and Mozaffarian D: Demographic and lifestyle factors and
selenium levels in men and women in the U.S. Nutr Res Pract.
5:357–364. 2011. View Article : Google Scholar : PubMed/NCBI
|
|
28
|
Filippini T, Michalke B, Malagoli C, Grill
P, Bottecchi I, Malavolti M, Vescovi L, Sieri S, Krogh V, Cherubini
A, et al: Determinants of serum cadmium levels in a Northern Italy
community: a cross-sectional study. Environ Res. 150:219–226. 2016.
View Article : Google Scholar : PubMed/NCBI
|
|
29
|
Bergomi M, Vinceti M, Nacci G, Pietrini V,
Brätter P, Alber D, Ferrari A, Vescovi L, Guidetti D, Sola P, et
al: Environmental exposure to trace elements and risk of
amyotrophic lateral sclerosis: a population-based case-control
study. Environ Res. 89:116–123. 2002. View Article : Google Scholar : PubMed/NCBI
|
|
30
|
Vinceti M, Bassissi S, Malagoli C,
Pellacani G, Alber D, Bergomi M and Seidenari S: Environmental
exposure to trace elements and risk of cutaneous melanoma. J Expo
Anal Environ Epidemiol. 15:458–462. 2005. View Article : Google Scholar : PubMed/NCBI
|
|
31
|
Vinceti M, Venturelli M, Sighinolfi C,
Trerotoli P, Bonvicini F, Ferrari A, Bianchi G, Serio G, Bergomi M
and Vivoli G: Case-control study of toenail cadmium and prostate
cancer risk in Italy. Sci Total Environ. 373:77–81. 2007.
View Article : Google Scholar : PubMed/NCBI
|
|
32
|
Pala V, Sieri S, Palli D, Salvini S,
Berrino F, Bellegotti M, Frasca G, Tumino R, Sacerdote C, Fiorini
L, et al: Diet in the Italian EPIC cohorts: presentation of data
and methodological issues. Tumori. 89:594–607. 2003.PubMed/NCBI
|
|
33
|
Malavolti M, Malagoli C, Fiorentini C,
Longo C, Farnetani F, Ricci C, Albertini G, Lanzoni A, Reggiani C,
Virgili A, et al: Association between dietary vitamin C and risk of
cutaneous melanoma in a population of Northern Italy. Int J Vitam
Nutr Res. 83:291–298. 2013. View Article : Google Scholar : PubMed/NCBI
|
|
34
|
Malagoli C, Malavolti M, Agnoli C, Crespi
CM, Fiorentini C, Farnetani F, Longo C, Ricci C, Albertini G,
Lanzoni A, et al: Diet quality and risk of melanoma in an Italian
population. J Nutr. 145:1800–1807. 2015. View Article : Google Scholar : PubMed/NCBI
|
|
35
|
Heitland P: Selenium in serum. In: The MAK
Collection for Occupational Health and SafetyPart IV: Biomonitoring
Methods. 13. Wiley-VCH; Germany: pp. 249–263. 2013
|
|
36
|
Michalke B and Berthele A: Contribution to
selenium speciation in cerebrospinal fluid samples. J Anal At
Spectrom. 26:165–170. 2011. View Article : Google Scholar
|
|
37
|
Solovyev N, Berthele A and Michalke B:
Selenium speciation in paired serum and cerebrospinal fluid
samples. Anal Bioanal Chem. 405:1875–1884. 2013. View Article : Google Scholar : PubMed/NCBI
|
|
38
|
Xu M, Yang LM and Wang QQ: Quantification
of selenium-tagged proteins in human plasma using
species-unspecific isotope dilution ICP-DRC-qMS coupled on-line
with anion exchange chromatography. J Anal At Spectrom.
23:1545–1549. 2008. View Article : Google Scholar
|
|
39
|
Turrini A, Saba A, Perrone D, Cialfa E and
DAmicis A: Food consumption patterns in Italy: the INN-CA study
1994–1996. Eur J Clin Nutr. 55:571–588. 2001. View Article : Google Scholar : PubMed/NCBI
|
|
40
|
Willett W: Nutritional epidemiology. 3rd.
Oxford University Press; New York: 2013
|
|
41
|
Filippini T, Michalke B, Grill P, Malagoli
C, Malavolti M, Vescovi L and Sieri S: Determinants of serum
manganese levels in an Italian population. Mol Med Rep. (In
press).
|
|
42
|
Baskett CK, Spate VL, Mason MM, Nichols
TA, Williams A, Dubman IM, Gudino A, Denison J and Morris JS:
Long-term selenium status in humans. J Radioanal Nucl Chem.
249:429–435. 2001. View Article : Google Scholar
|
|
43
|
Kanabrocki EL, Kanabrocki JA, Greco J,
Kaplan E, Oester YT, Brar SS, Gustafson PS, Nelson DM and Moore CE:
Instrumental analysis of trace elements in thumbnails of human
subjects. Sci Total Environ. 13:131–140. 1979. View Article : Google Scholar : PubMed/NCBI
|
|
44
|
Xun P, Bujnowski D, Liu K, Morris JS, Guo
Z and He K: Distribution of toenail selenium levels in young adult
Caucasians and African Americans in the United States: the CARDIA
trace element study. Environ Res. 111:514–519. 2011. View Article : Google Scholar : PubMed/NCBI
|
|
45
|
Swanson CA, Longnecker MP, Veillon C, Howe
M, Levander OA, Taylor PR, McAdam PA, Brown CC, Stampfer MJ and
Willett WC: Selenium intake, age, gender, and smoking in relation
to indices of selenium status of adults residing in a seleniferous
area. Am J Clin Nutr. 52:858–862. 1990.PubMed/NCBI
|
|
46
|
Block RJ: The composition of keratins. The
amino acid composition of hair, wool, horn, and other eukeratins. J
Biol Chem. 128:181–186. 1939.
|
|
47
|
Magos L and Berg GG: SeleniumBiological
Monitoring of Toxic Metals. Clarkson TW, Friberg L, Nordberg GF and
Sager PR: Plenum Press; New York: pp. 383–405. 1988, View Article : Google Scholar
|
|
48
|
Dittmar M, Dindorf W and Banerjee A:
Organic elemental composition in fingernail plates varies between
sexes and changes with increasing age in healthy humans.
Gerontology. 54:100–105. 2008. View Article : Google Scholar : PubMed/NCBI
|
|
49
|
Schubert A, Holden JM and Wolf WR:
Selenium content of a core group of foods based on a critical
evaluation of published analytical data. J Am Diet Assoc.
87:285–299. 1987.PubMed/NCBI
|
|
50
|
Cappon CJ and Smith JC: Chemical form and
distribution of mercury and selenium in edible seafood. J Anal
Toxicol. 6:10–21. 1982. View Article : Google Scholar : PubMed/NCBI
|
|
51
|
Cappon CJ and Smith JC: Chemical form and
distribution of mercury and selenium in canned tuna. J Appl
Toxicol. 2:181–189. 1982. View Article : Google Scholar : PubMed/NCBI
|
|
52
|
Moreda-Piñeiro J, Moreda-Piñeiro A,
Romarís-Hortas V, Domínguez-González R, Alonso-Rodríguez E,
López-Mahía P, Muniategui-Lorenzo S, Prada-Rodríguez D and Barrera
Bermejo P: In vitro bioavailability of total selenium and selenium
species from seafood. Food Chem. 139:872–877. 2013. View Article : Google Scholar : PubMed/NCBI
|
|
53
|
Muñiz-Naveiro O, Domínguez-González R,
Bermejo-Barrera A, Bermejo-Barrera P, Cocho JA and Fraga JM:
Selenium speciation in cow milk obtained after supplementation with
different selenium forms to the cow feed using liquid
chromatography coupled with hydride generation-atomic fluorescence
spectrometry. Talanta. 71:1587–1593. 2007. View Article : Google Scholar : PubMed/NCBI
|
|
54
|
Vinceti M, Solovyev N, Mandrioli J, Crespi
CM, Bonvicini F, Arcolin E, Georgoulopoulou E and Michalke B:
Cerebrospinal fluid of newly diagnosed amyotrophic lateral
sclerosis patients exhibits abnormal levels of selenium species
including elevated selenite. Neurotoxicology. 38:25–32. 2013.
View Article : Google Scholar : PubMed/NCBI
|
|
55
|
Michalke B and Fernsebner K: New insights
into manganese toxicity and speciation. J Trace Elem Med Biol.
28:106–116. 2014. View Article : Google Scholar : PubMed/NCBI
|
|
56
|
Michalke B: Review about the manganese
speciation project related to neurodegeneration: an analytical
chemistry approach to increase the knowledge about manganese
related parkinsonian symptoms. J Trace Elem Med Biol. 37:50–61.
2016. View Article : Google Scholar : PubMed/NCBI
|
|
57
|
Fairweather-Tait SJ, Collings R and Hurst
R: Selenium bioavailability: current knowledge and future research
requirements. Am J Clin Nutr. 91:1484S–1491S. 2010. View Article : Google Scholar : PubMed/NCBI
|
|
58
|
Vinceti M, Maraldi T, Bergomi M and
Malagoli C: Risk of chronic low-dose selenium overexposure in
humans: insights from epidemiology and biochemistry. Rev Environ
Health. 24:231–248. 2009. View Article : Google Scholar : PubMed/NCBI
|
|
59
|
Gruppo Tecnico PASSI Emilia-Romagna:
Sovrappeso e obesità in Emilia-Romagna: dati del sistema di
sorveglianza PASSI (anni 2008–2011). 2012.(In Italian).
|
|
60
|
Ferrante G, Minardi V, Possenti V,
Quarchioni E, Masocco M, Salmaso S, Braggion M, Campostrini S and
Baldissera S: Gruppo Tecnico PASSI: Smoke: prevalence is
decreasing, but the gap between socioeconomic categories remains.
Epidemiol Prev. 36:3712012.(In Italian). PubMed/NCBI
|