Introduction
Thymus-derived T lymphocytes are involved in
adaptive immunity. According to the heterodimer isoform structure
of the T cell receptor (TCR) expressed on the surface of T cells,
it is possible to divide T lymphocytes into two subsets; αβ and γδ
T cells. αβ T cells express TCR α and β chains whereas γδ T cells
express TCR γ and δ chains (1,2). The
genes encoding TCR α and γ chains [T cell receptor α-locus
(TRA) and TRG, respectively) are composed of a
variable region (V), a joining region (J) and a constant region
(C). TCR β and δ chains are encoded by TRB and TRD
genes, respectively, which possess additional diversity regions (D)
(3,4). Thus, the TCR β chain is more diverse
than that of the α chain. A total of 3 hypervariable regions,
namely complementarity determining region (CDR) 1, CDR2 and CDR3,
have been defined, and collectively form the antigen binding sites.
CDR1 and CDR2 are encoded by the V region in germ-line DNA
segments, and primarily interact with major histocompatibility
complex (MHC) molecules. The CDR3 loop of the TCR α chain is
encoded by the terminal of the V region, the foreside of the J
region (CDR3 loop of the TCR β chain has an additional D region),
and the inserted and deleted sequences during the recombination
process, providing significant diversity, which is responsible for
the recognition of and interaction with various antigen peptides
presented by MHC molecules. As the sequence and length of CDR3
differs according to the type of T cell clone, the sequence of CDR3
determines the structure and specificity of the TCR, where one type
of CDR3 sequence represents a specific T cell clonotype (5,6).
When a specific TCR recognizes a particular antigen, reactive
recombination occurs, which generates a preferential TCR family
with the antigen-specific TCR. CDR3 recognizes and binds to a
specific antigen, which leads to the clonal expansion of T cells.
These antigen-specific T cell clones fulfill a unique immune
function (7). Previous studies
have revealed that antigen-specific T cells undergo clonal
expansion. A Vβ22 monoclonal expansion with an identical CDR3
sequence was detected in the spleen of patients with type 1
diabetes, and the same Vβ22 TCR was identified in peripheral blood
mononuclear cells (PBMCs) (8). The
brain-infiltrating T lymphocytes in mice infected with West Nile
virus dominantly expressed Vα1-1, Vα2-1, Vβ5-2 and Vβ8-2, which
exhibited oligoclonal expansions (9).
The immunoscope spectratyping technique has been
proven to be a simple, useful and visual method for detecting
polyclonal and oligoclonal expansion of T cells, by determining the
CDR3 repertoire in various infectious diseases, including human
immunodeficiency virus, viral hepatitis and Epstein-Barr virus
(10–12), tumors, including leukemia, colon
cancer and melanoma (13,14), transplantation, such as kidney and
bone marrow transplantation (15,16),
and autoimmune diseases, including systemic lupus erythematosus and
rheumatoid arthritis (7,17). The main principle of this technique
is to design specific forward TCR α variable region (AV), β
variable region (BV) primers, and fluorescence-labeled reverse TCR
α chain (AC) and β chain (BC) primers. Following amplification and
scanning of the fluorescent polymerase chain reaction (PCR)
products, it is possible to acquire the composition and expression
frequency of each gene family.
Miniature pigs have been selected as one of the
model animals used for medical research into allogeneic immune
reactions that occur during organ transplantation (18), due to the advantages of stable
heredity, microorganism control and feeding and management
(19). Furthermore, porcine
immunological studies provide the foundation for the control and
prevention of pig diseases. At present, although the molecular
structure of porcine TCR at the genomic and transcriptomic levels
has been elucidated (20–24), there is limited knowledge of
porcine TCR function. Therefore, further investigation of the
structure and function of swine TCR is necessary. Furthermore,
cluster of differentiation (CD) 4+ and CD8+ T
cells generate functional TCRs that recognize peptide-MHC
complexes, with CD4+ T cells responding to MHC-class II
and CD8+ T cells to MHC-class I; however, it is unclear
whether the CDR3 spectratype and sequence length of these T cell
subsets are distinct. Previous research has demonstrated that the
CDR3 expression frequency and length repertoire of the TCR AV and
BV gene families demonstrate specific utilization patterns in PBMCs
from healthy pigs and those pigs infected with the classical swine
fever virus (CSFV; Fang et al, unpublished data). However,
the expression frequency and CDR3 length repertoire in individual
CD4+ and CD8+ T cell populations remains
unknown. In the present study, the CDR3 spectratype of TCR α and β
chains was investigated in the two T cell subsets using the
immunoscope spectratyping analysis technique. The results of the
present study may provide a basis for further study of the
functional complexity and specificity of the porcine TCR
molecule.
Materials and methods
Animal selection
A total of 3 female healthy Hezuo miniature pigs
(age, 10 weeks) originating from the same litter, raised in
situ at the State Key Laboratory of Veterinary Etiological
Biology (Lanzhou, China) were included in the present study. The
weight of the animals ranged between 12 and 15 kg. Animals were
housed separately, with free access to food and water, and kept on
a 12 h light/dark cycle at a temperature of 22°C, 0.1%
CO2 (v/v) and a humidity of 60%. All pigs were
serologically negative for CSFV (cat. no. AP0000297), porcine
reproductive and respiratory syndrome (cat. no. KQ0007), the
porcine circovirus (cat. no. K703213), the porcine pseudorabies
virus (cat. no. AP0000296), the porcine parvovirus (cat. no.
K703214) and the foot and mouth disease virus (cat. no AP0001490),
as determined using a serological detection kit (Wuhan Keqian
Animal Biological Products Co., Ltd., Wuhan, China). All animals
were sacrificed in accordance with a protocol approved by the
Chinese Ministry of Public Health Guide for the Care and Use of
Laboratory Animals (25,26). All animals were euthanized on
predetermined days by intramuscular administration of
ketamine-xylazine (LGC Science Shanghai, Ltd., Shanghai, China)
sedative followed by intravenous administration of 5% sodium
pentobarbital solution (100 mg/kg). The present study was approved
by the Animal Ethics Committee of Lanzhou Veterinary Research
Institute, Chinese Academy of Agricultural Sciences (Lanzhou,
China; no. LVRIAEC2015-006).
Isolation of PBMCs
Peripheral blood (15 ml) was obtained from the
precaval vein of the healthy miniature pigs, heparinized, and PBMCs
were separated by horizontal gradient centrifugation at 400 × g and
20°C for 20 min using lymphocyte separation medium (Sigma-Aldrich;
Merck KGaA, Darmstadt, Germany).
Sorting of CD4+ and
CD8+ T cells using magnetic beads
The T cells were first enriched by nylon wool
purification (27). This was
followed by indirect immunomagnetic positive sorting of
CD4+ and CD8+ T cells using a specific
combination of magnetic beads (Miltenyi Biotec GmbH, Bergisch
Gladbach, Germany) labeled with phycoerythrin-conjugated
CD4+ and CD8+ monoclonal antibodies (cat.
nos. 559586 and 559584, respectively; BD Biosciences, Franklin
Lakes, NJ, USA). T cells were incubated with 1:2 diluted
phycoerythrin-conjugated CD4+ and CD8+
monoclonal antibodies for 20 min at 4°C in the dark, buffer [0.5%
bovine serum albumin (BD Biosciences) and 2 mM EDTA in PBS, pH 7.2]
was used to wash the cells twice prior to incubation with the
microbeads. After 15 min incubation in the dark with the microbeads
at 4°C, the cells were washed with the buffer and centrifuged at
300 × g for 10 min at 4°C. Cells (1×10⁸) were loaded
onto a MiniMACS Column (Miltenyi Biotec GmbH), and CD4+
and CD8+ T cells were separated according to the
manufacturer's protocol. To determine the purity of the separated
cells, cells were subsequently centrifuged at 300 × g for 5 min at
4°C and washed twice with RPMI-1640 medium (Gibco; Thermo Fisher
Scientific, Inc., Waltham, MA, USA). Following counting,
1×10⁶ cells were resuspended in 100 µl FACS buffer [2%
fetal calf serum (Gibco; Thermo Fisher Scientific, Inc.) and 0.1%
sodium azide in PBS], and incubated with fluorescein
isothiocyanate-conjugated anti-CD3 antibody (1:100; cat. no.
559582; BD Biosciences, Franklin Lakes, NJ, USA) for 30 min at 4°C,
the cells were washed twice with cold FACS buffer and fixed in PBS
containing 2% formaldehyde for 30 min at room temperature prior to
flow cytometry analysis with a FACS Calibur flow cytometer (BD
Biosciences), and the results were analyzed using BD CellQuest
software (BD Biosciences).
Extraction of RNA and synthesis of
cDNA
Total RNA was extracted from the sorted T cell
subsets using TRIzol reagent (Invitrogen; Thermo Fisher Scientific,
Inc.) according to the manufacturer's protocol. RNA quality was
determined by separating total RNA by 1% agarose gel
electrophoresis, followed by staining with 10 µg/ml ethidium
bromide. Total RNA concentrations were determined using a NanoDrop
2000 Spectrophotometer (Thermo Fisher Scientific, Inc.) and the
260/280 optical density ratio of the RNA was between 1.8 and 2.0.
RQ1 RNase-Free DNase (Promega Corporation, Madison, WI, USA) was
used to degrade double-stranded and single-stranded DNA according
to the manufacturer's instructions.
First strand synthesis of cDNA was performed using
the PrimeScript™ 1st strand cDNA Synthesis kit (Takara
Biotechnology Co., Ltd., Dalian, China) in a 20 µl reaction mixture
according to the manufacturers protocol. A total of 1 µg RNA was
combined with 0.5 µl oligo-dT primer (50 µM), 0.5 µl random
hexamers (50 µM), 1 µl dNTP mixture (10 mM) and an appropriate
volume of RNase free water (up to 10 µl), mixed gently, heated to
65°C for 5 min, then immediately chilled on ice. This mixture was
then mixed with a reverse transcription (RT) mixture containing 4
µl PrimeScript Buffer (5X), 0.5 µl RNase inhibitor (40 U/µl), 1 µl
PrimeScript RTase (200 U/µl) and 4.5 µl RNase free water. The
reaction mixture was incubated at 30°C for 10 min, 42°C for 50 min
and 95°C for 5 min to inactivate the RTase. The samples were
subsequently stored at −80°C for downstream PCR amplification of
TCR gene families.
Normalization of TCR AC and
BC-specific cDNA concentrations
The TCR BC-specific cDNA concentration was
normalized by amplifying a specific segment of the gene encoding
the C region of TCR BC by PCR. Briefly, forward and reverse BC
primers (Table I), specific to TCR
BC1 and TCR BC2 genes, and Ex Taq DNA polymerase (Takara
Biotechnology Co., Ltd.) were used to amplify the specific segment
with serial twofold dilutions of cDNA (1:1, 1:2, 1:4, 1:8 and
1:16). Following an initial denaturation step at 95°C for 5 min,
PCR was performed with 30 cycles of denaturation at 94°C for 50
sec, annealing at 60°C for 15 sec and extension at 72°C for 30 sec,
with a final extension step at 72°C for 5 min. The PCR products
were then electrophoresed on a 1.5% agarose gel, stained with 10
µg/ml ethidium bromide and photographed using an AlphaImager HP gel
imaging system (ProteinSimple, San Jose, CA, USA). The TCR BC
specific segment was then quantified using Quantity One 1-D
software (version, 4.6.9; Bio-Rad Laboratories, Inc., Hercules, CA,
USA). Based on the scanned data, equal quantities of TCR β chain
cDNA were estimated and used in the subsequent TCR BV PCR
amplification. The TCR AC-specific cDNA concentration was
normalized using the same aforementioned methods and specific AC
forward and reverse primers were used to amply a specific segment
of TCR AC (Table I).
 | Table I.Primer sequences used for TCR
AV/BV-specific amplifications. |
Table I.
Primer sequences used for TCR
AV/BV-specific amplifications.
| A, TCR AV
family |
|---|
|
|---|
| Variable
region | Primer sequence
(5′-3′) | Expected size
(bp) |
|---|
| DV1 |
TGGCTGGAATGCAAAGGAAGA | 220 |
| AV2S |
TCAGGTGCAGGTGGCAGATG | 150 |
| AV3S |
CCAGCTGTCCTAGGGAGCGACT | 150 |
| AV4S |
GGCCACCCTGAAAGACACTGC | 210 |
| AV5S |
AAAATCACAGCAGCCCAACCTG | 153 |
| AV6S |
GAGCACCACCTTTGACACCAGAG | 200 |
| AV8-3S |
TCCAGTACCCCAGCCAAGGA | 280 |
| AV8-4S |
CAGAGGCTTTGGGGCTGAAT | 270 |
| AV12S |
GCAAGCATGTCTCCCTGCTCA | 170 |
| AV13S |
CTCCCTGCACATCGCAGTCA | 170 |
| AV14 |
TCTCAGATGCACAGGTGGAGGA | 160 |
| AV16S |
CCTCGACAAGAAAGAGGCATCC | 200 |
| AV18S |
TCTTCCAGAGGAGGCACCTATGAC | 350 |
| AV21S |
CGAGAGGGAGACGGCTTGGT | 340 |
| AV22 |
GGCGGCCTCATCAATCTGTTT | 250 |
| AV25S |
GGACAGCTCCCTGCACATCA | 160 |
| AV26 |
TCGGCAAAATCCCAATCAGA | 280 |
| AV38 |
AGCTTCCCAACGGGGAGATG | 270 |
| AV39 |
ACCAAAGCCCATTGCAGCAC | 180 |
| AVX |
TCGACAGTATCCAAATCAGGCACT | 280 |
| AC-FAM |
TTTGGGGCCTTTCAGCTGGT |
|
| AC forward |
CTGTGATGCCAAGTTGGTAG | 135 |
| AC reverse |
CACAGCCGCAGTGTCATGAG |
|
|
| B, TCR BV
family |
|
| Variable
region | Primer sequence
(5′-3′) | Expected size
(bp) |
|
| BV2S |
GGCACGTACCTGACTCTGAA | 190 |
| BV3S |
ACAGTTCCACGTCGCTTCTT | 220 |
| BV4S |
CAGATACCTGGTCCTGGGAA | 370 |
| BV5S |
CACCGAGACATCTGATTAAAGC | 380 |
| BV6S |
TGGCATCACTGACAAAGGAG | 250 |
| BV7S |
TCTGAGCTGAAATTGCTCTCC | 190 |
| BV9S |
AGCTTTTGTCTCCACAGGTCA | 400 |
| BV10S |
CCTGTGATGTTGGCATCCTT | 260 |
| BV11S |
TGTTTCTCAGTTGCCCCAGA | 210 |
| BV12S |
CACCCAGACACGAGGTGA | 340 |
| BV12A |
CAACAACGGGTCTCCTGTG | 230 |
| BV15S |
CGGCCTAACCCTTCTTTCTG | 210 |
| BV19S |
CATTGACGCAGAAGAACCAG | 200 |
| BV20 |
ACAGCGCCAAGTTTCTCATC | 230 |
| BV21 |
ACAGCGATTTACAGCCGAGT | 210 |
| BV24a |
CTTTGTGGCCTTTTGCATCC | 420 |
| BV25 |
CACCAGCCCTTCACAGACAT | 180 |
| BV27 |
AGCCGAATTTCCCCTTGAT | 190 |
| BV29 |
ACCGTCAGCTTCTAGGACAAAG | 390 |
| BV30 |
TGACCAGAAAGATCCTGAAAAG | 400 |
| BVXS |
ATCCCTTCCTGGAGCAGATT | 220 |
| BC-FAM |
ATCTCCGCTTCCGATGGT |
|
| BC forward |
GGACCTGCAGCAGGTGAGAC | 110 |
| BC reverse |
GTAGAAGCCTGTGGCCAGGC |
|
Primers
The primers used for the specific amplification of
19 TCR AV families and 20 TCR BV families were synthesized
according to previous studies (28), and are listed in Table I.
PCR amplification of TCR AV and BV
families
PCR amplification of TCR AV CDR3 was conducted in a
total volume of 25 µl, containing 2 µl first strand cDNA, 0.4 µl
5′-AV primer (100 µM), 0.4 µl carboxyfluorescein (FAM) -labeled
reverse AC primer (100 µM), 2.5 µl Taq PCR buffer (10X), 2 µl dNTP
mixture (2.5 mM), 0.25 µl Taq DNA polymerase (Takara Biotechnology
Co., Ltd.) and 17.45 µl diethylpyrocarbonate (DEPC) water. Primers
are listed in Table I. Following
an initial denaturation step at 95°C for 5 min, PCR was conducted
with 35 cycles of denaturation at 94°C for 50 sec, annealing at
60°C for 15 sec and extension at 72°C for 30 sec, with a final
extension step at 72°C for 5 min. An aliquot of 8 µl of each PCR
product was electrophoresed on a 1.5% agarose gel, stained with 10
µg/ml ethidium bromide and analyzed using an AlphaImager HP gel
imaging system (ProteinSimple) and AlphaView software (version,
3.0; ProteinSimple). PCR amplification of TCR BV CDR3 was performed
using the identical procedure, except for the use of 5′-BV primer
and FAM-labeled reverse BC primers in the PCR reaction mixture
(Table I).
GeneScan analysis of the CDR3
spectratype
An aliquot of 2 µl fluorescent PCR product was mixed
with 2 µl formamide, 0.5 µl loading dye (25 mM ethylene diamine
tetraacetic acid and 50 ng/ml blue dextran) and 0.5 µl GeneScan-500
TAMRA dye-labeled size standards (Applied Biosystems; Thermo Fisher
Scientific, Inc.). The mixture was denatured at 95°C for 2 min, and
2 µl was loaded onto a 6% acrylamide sequencing gel and run for 2 h
in a 50-lane Applied Biosystems 373A DNA Sequencer (Applied
Biosystems; Thermo Fisher Scientific, Inc.). The data were analyzed
using GeneMapper software (version, 4.1; Applied Biosystems; Thermo
Fisher Scientific, Inc.).
Sequencing CDR3 in TCR AV and BV
families
The PCR amplification mixtures of the TCR gene
families with in-frame and out-of-frame CDR3 lengths were amplified
in a final volume of 50 µl, containing 4 µl first-stand cDNA, 0.8
µl forward AV or BV primer (100 µM), 0.8 µl unlabeled reverse AC or
BC primer (100 µM), 5 µl Taq PCR buffer (10X), 4 µl dNTP mixture
(2.5 mM), 0.5 µl Taq DNA polymerase (Takara Biotechnology Co.,
Ltd.) and 34.9 µl DEPC water. Primer sequences are listed in
Table I. The thermal cycling
parameters used were the same as those described for the PCR
amplification of TCR AV and BV gene families. The PCR products were
electrophoresed on a 1.5% agarose gel, stained with 10 µg/ml
ethidium bromide, and analyzed under ultraviolet light. They were
then purified using a gel extraction kit (Axygen; Corning
Incorporated, Corning, NY, USA). The purified PCR products were
ligated into the pGEM-T easy vector (Promega Corporation) under the
conditions of a 16°C water-bath overnight according to the
manufacturer's protocol. Ligation products (10 ng/µl; 5 µl) were
gently added to 50 µl (5×10⁷ cells) competent DH5α
Escherichia coli (Takara Biotechnology Co., Ltd.) and were
chilled on ice for 30 min, incubated at 42°C for 90 sec and chilled
on ice for 3 min. SOC medium (800 µl; Takara Biotechnology Co.,
Ltd.) was added to the competent cells and cells were cultured at
37°C in a constant temperature incubator with a speed of 150
rpm/min for 50 min. The bacterium solution was centrifuged at 2,500
× g for 5 min at room temperature, 900 µl supernatant was discarded
and the bacteria were resuspended using the rest of medium, added
evenly to the LB plate (10 g/l tryptone; 5 g/l yeast extract; 10
g/l NaCl; 15 g/l agar power; all from Beijing Solarbio Science
&Technology Co., Ltd., Beijing, China) containing 100 µg/ml
ampicillin (Sigma-Aldrich; Merck KGaA) and cultured at 37°C for 15
h. Positive clones were selected using ampicillin and nucleotide
sequences were determined by Genescript Co., Ltd (Nanjing,
China).
Statistical analysis
The average fluorescence intensity of each gene
family in the T cell subsets was calculated, and the nonparametric
two-tailed Mann-Whitney-Wilcoxon rank sum test was used for the
comparison of independent variables using SPSS software (version,
18.0; SPSS, Inc., Chicago, IL, USA). P<0.05 was considered to
indicate a statistically significant difference.
Results
RT-PCR amplifications of TCR AV and
TCR BV gene families in CD4+ and CD8+ T
cells
RT-PCR products of 19 TCR AV families (including one
subfamily, AV8-4S) and 20 TCR BV families (including one subfamily,
BV12A) in sorted CD4+ and CD8+ T cells were
separated by 1.5% agarose gel electrophoresis and stained with 10
µg/ml ethidium bromide (Fig. 1A and
B). The majority of gene families demonstrated clear, specific
and expected ~250 bp fragment sizes when separated by 1.5% agarose
gel electrophoresis (Fig. 1A and
B), which indicated that detection of the expression of
specific TCR AV and TCR BV families is possible. Compared with
other PCR products, the PCR products of the TCR AV39 gene family
presented an obscure band (lower intensity), of the expected size,
indicating that AV39 may adopt a relatively low level of expression
compared with other TCR gene families. In total, ~8 bands differing
in length by 3 bp were observed for each TCR AV or BV gene family
in the sequencing gels (Fig. 1C and
D).
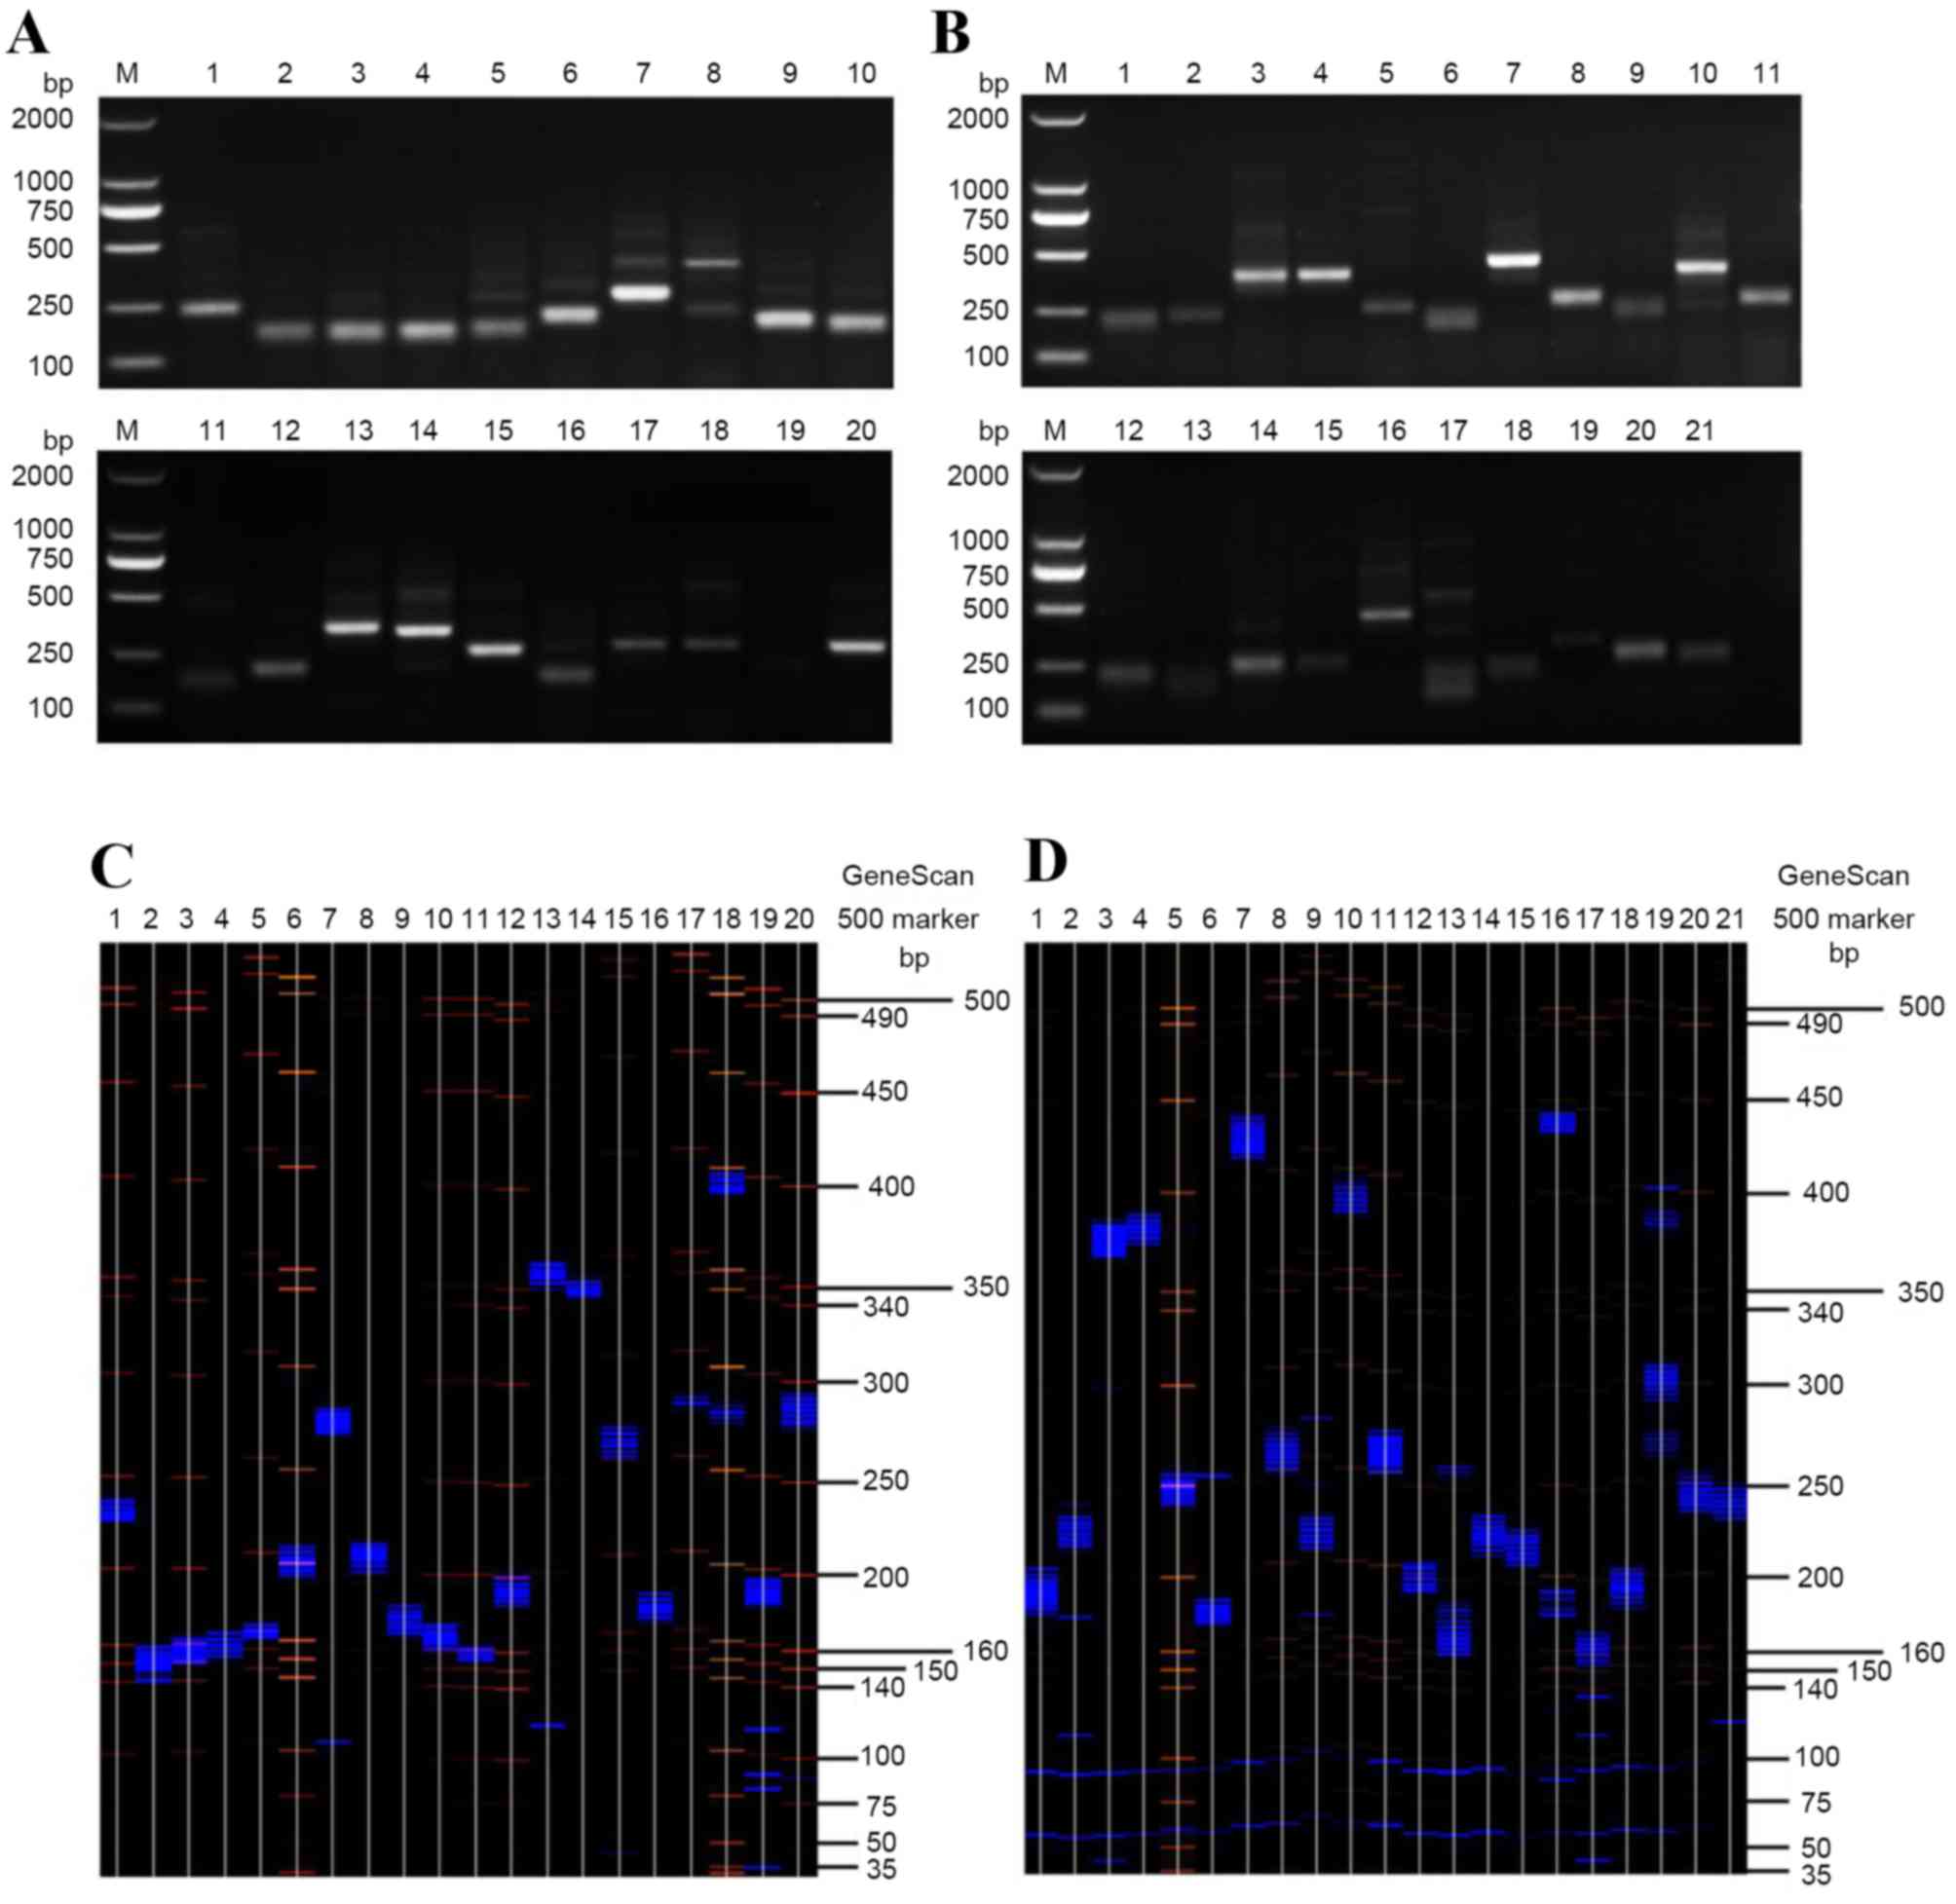 | Figure 1.The distribution profile of
complementarity determining region 3 length in 19 TCR AV families
and 20 TCR BV families from healthy miniature pigs. (A) RT-PCR
products of 19 TCR AV gene families in separated CD4+ T
cells. Lane M represents the DNA ladder, and lanes 1–20 represent
the following TCR AV families: DV1, AV2S, AV3S, AV4S, AV5S, AV6S,
AV8-3S, AV8-4S, AV12S, AV13S, AV14, AV16S, AV18S, AV21S, AV22,
AV25S, AV26, AV38, AV39 and AVX, respectively. (B) RT-PCR products
of 20 TCR BV gene families in separated CD4+ T cells.
Lane M represents the DNA ladder and lanes 1–21 represent the
following TCR BV families: BV2S, BV3S, BV4S, BV5S, BV6S, BV7S,
BV9S, BV10S, BV11S, BV12S, BV12A, BV15S, BV19S, BV20, BV21, BV24,
BV25, BV27, BV29, BV30 and BVXS, respectively. (C) Numbers 1–20
denote the corresponding RT-PCR products of TCR AV families from
DV1 to AVX, separated on a 6% acrylamide sequencing gel. (D)
Numbers 1–21 denote the corresponding RT-PCR products of TCR BV
families from BV2S to BVXS, separated on a 6% acrylamide sequencing
gel. The blue bands represent the PCR products of the TCR gene
families. TCR AV, T cell receptor α variable region; TCR BV, T cell
receptor β variable region; CD, cluster of differentiation; RT-PCR,
reverse transcription-polymerase chain reaction. |
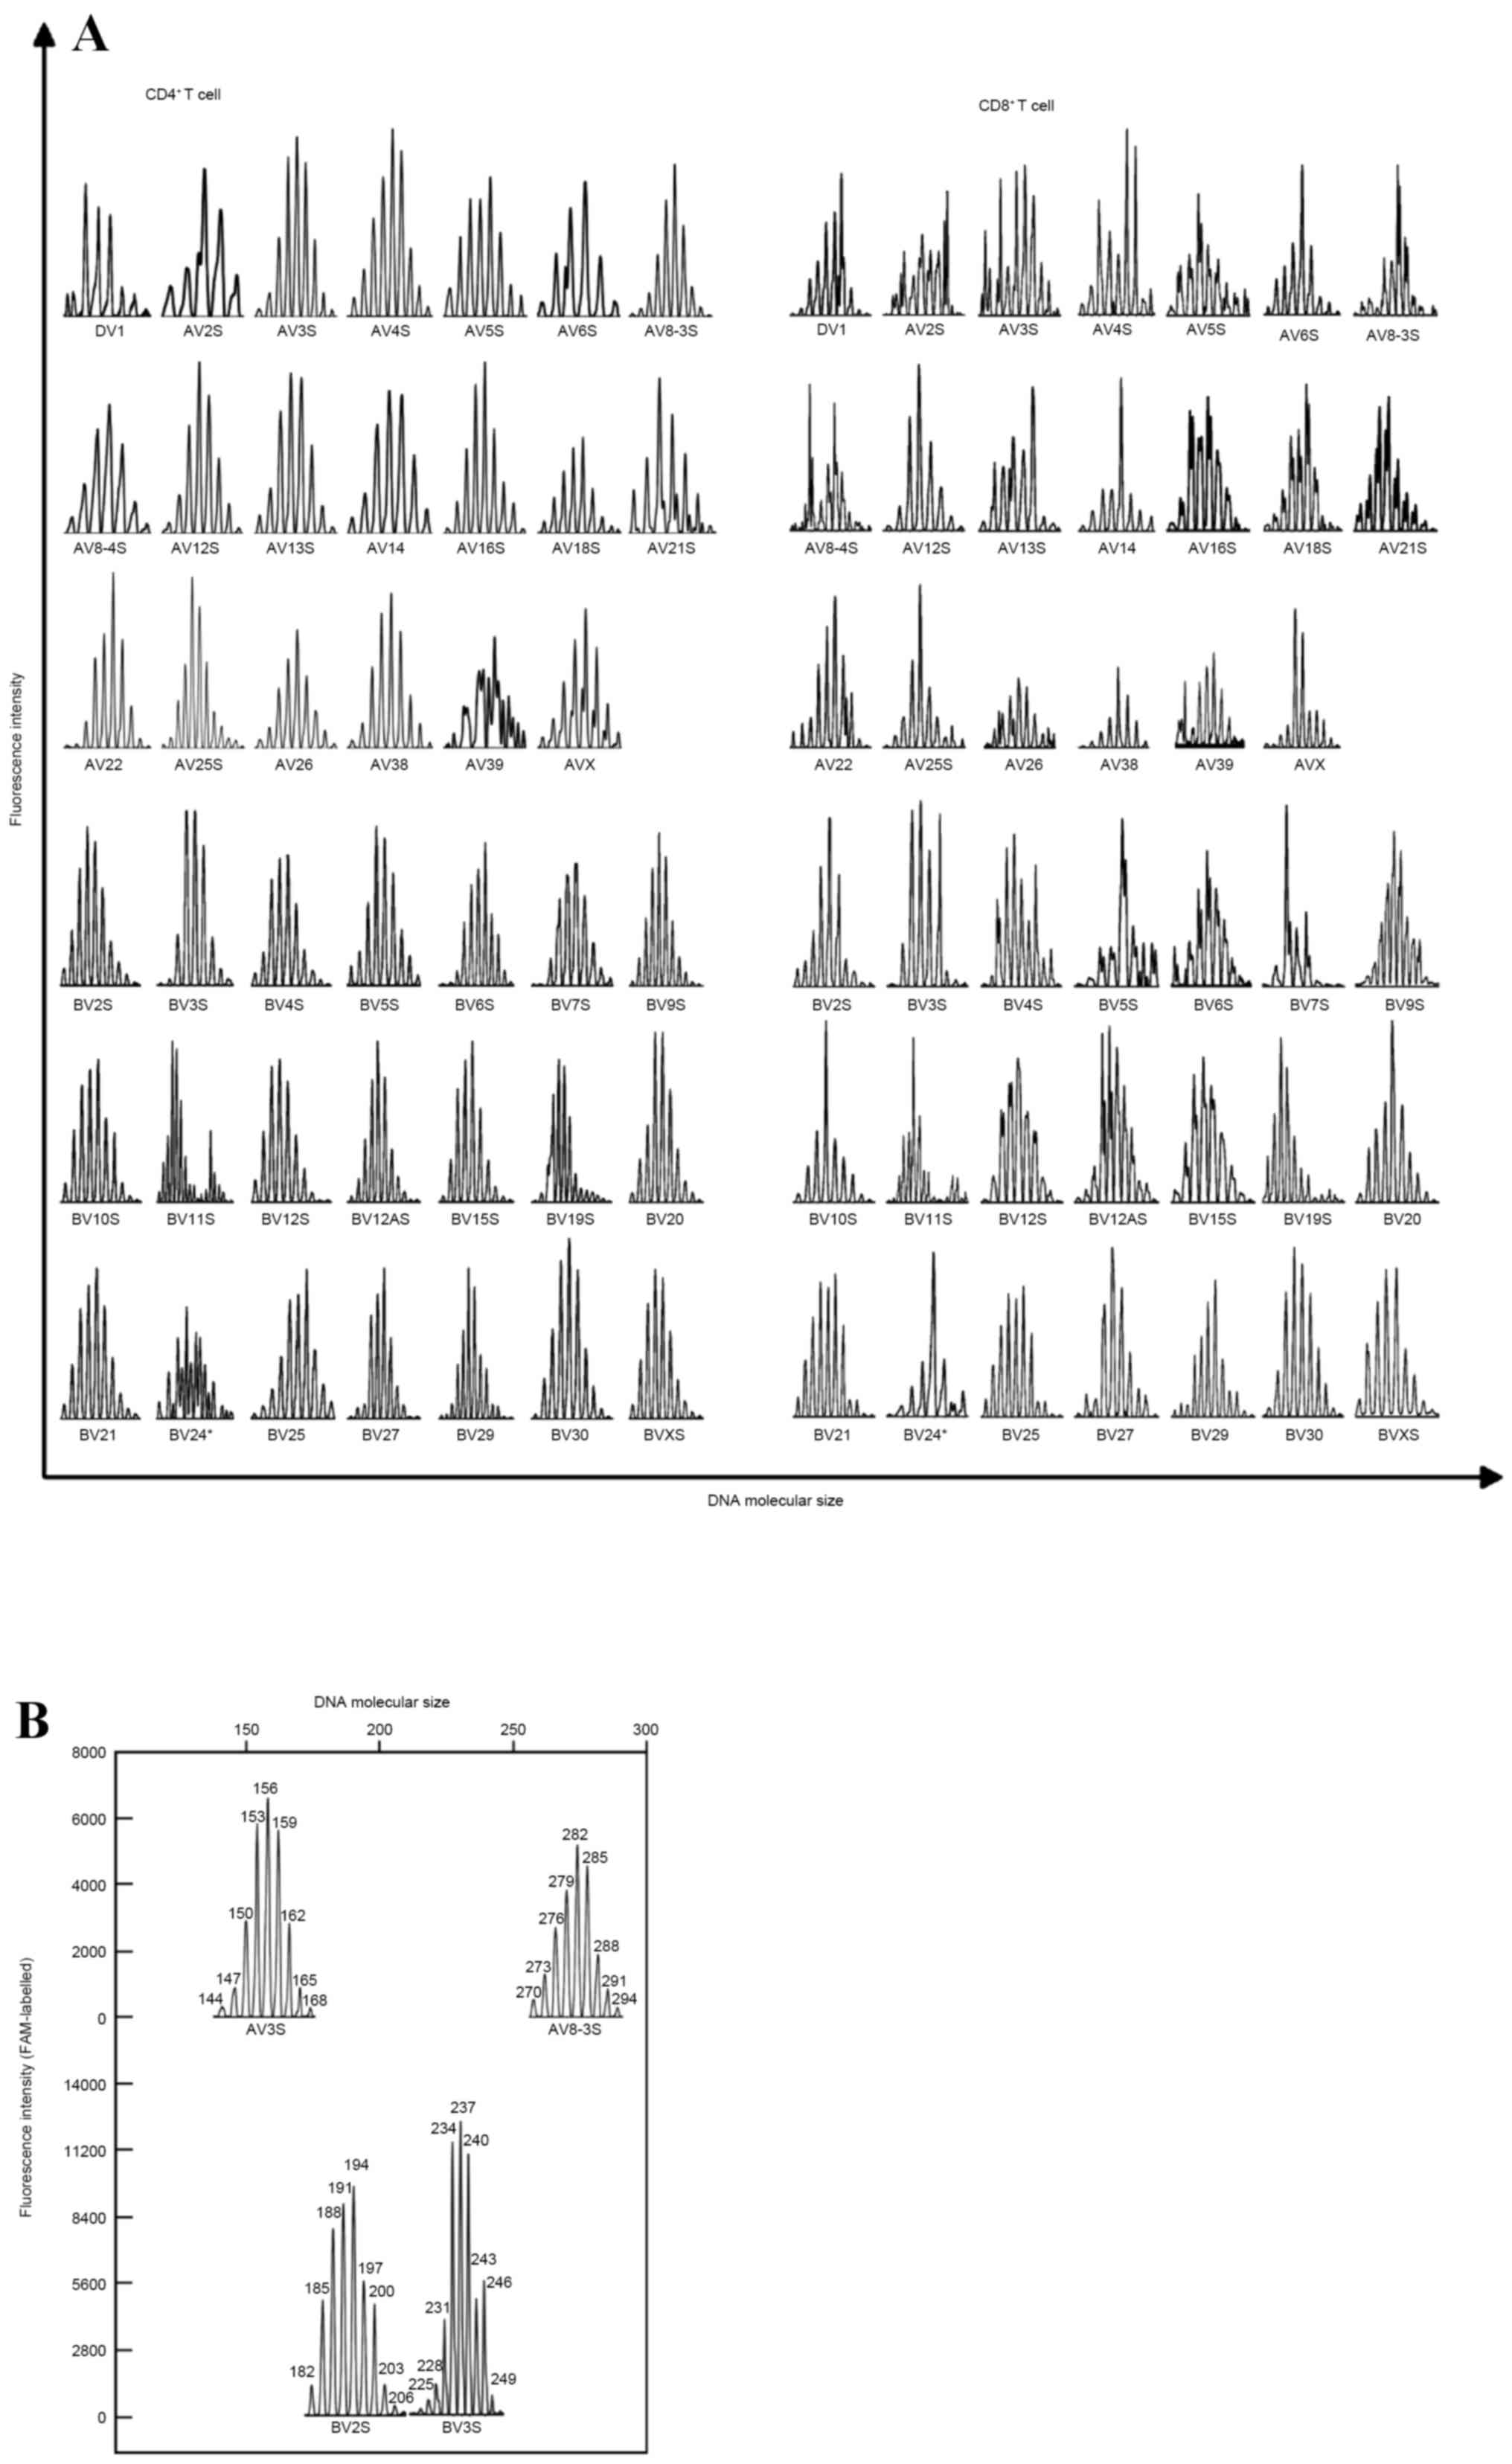
GeneScan analysis of the CDR3
spectratype of TCR Vα and Vβ chains
The results were analyzed using GeneMapper 4.1
software, which transforms the size, type and quantity of different
fragments into a visual waveform graph. The length repertoire and
diversity of CDR3 in 19 TCR AV families and 20 TCR BV families is
shown in Fig. 2A. The peak map of
CDR3 length of all the TCR AV and BV gene families demonstrated a
Gaussian distribution, indicating polyclonal T cell proliferation.
At least eight peaks with different DNA fragment sizes and
fluorescence intensities were observed in each family (Fig. 1). TCR BV11S demonstrated a dual
Gaussian distribution pattern profile in CD4+ and
CD8+ T cell subpopulations, which is in accordance with
results observed in PBMCs in previous studies (19,28).
Two TCR AV gene families (AV3S and AV8-3S) and 2 TCR BV gene
families (BV2S and BV3S) were selected at random in the present
study to clearly demonstrate the Gaussian distribution of CDR3
spectratypes and 3 bp sequence discrepancy between two adjacent
peaks (Fig. 2B).
Length analysis of the CDR3
sequence
The sequence length of the CDR3 region was then
examined, and the majority of CDR3 in the TCR AV and TCR BV
families of CD4+ and CD8+ T cell subsets were
revealed to be recombined in frame, with a 3-bp gap between two
adjacent CDR3 products (Tables II
and III). However, specific CDR3
sequences were identified to be out-of-frame, demonstrating 1–2 or
≥4 bp unconformity. This same discrepancy between adjacent CDR3
sequences was observed in the CD4+ and CD8+ T
cell subsets. In addition, CDR3 length discrepancy between the
shortest and the longest sequences in all families were between 15
and 42 bp, with the largest 30 bp gap (10 amino acids) in TCR AV
observed in CD4+ T cells and 27 bp (9 amino acids) in
CD8+ T cells (Table
II). The largest 33 bp discrepancy (11 amino acids) between the
shortest and the longest CDR3 sequence within the same gene family
in TCR BV was observed in CD4+ T cells, and 42 bp (14
amino acids) in CD8+ T cells (Table III).
| Table II.GeneScan analysis of CDR3 length in
CD4+ and CD8+ T cells of TCR AV families. |
Table II.
GeneScan analysis of CDR3 length in
CD4+ and CD8+ T cells of TCR AV families.
| A, CD4+
T cells, bp |
|---|
|
|---|
| DV 1 | AV 2S | AV 3S | AV 4S | AV 5S | AV 6S | AV 8-3S | AV 8-4S | AV 12S | AV 13S | AV 14S | AV 16S | AV 18S | AV 21 | AV 22 | AV 25 | AV 26 | AV 38 | AV 39 | AV XS |
|---|
| 223 | 141 | 144 | 138 | 135 | 194 | 270 | 203 | 171 | 158 | 149 | 182 | 345 | 337 | 252 | 158 | 264 | 267 | 184 | 272 |
| 226 | 144 | 147 | 141 | 138 | 197 | 273 | 206 | 174 | 161 | 152 | 185 | 348 | 340 | 255 | 161 | 267 | 270 | 185 | 275 |
| 229 | 147 | 150 | 144 |
142 | 200 | 276 | 209 | 177 | 164 | 155 | 188 | 351 | 343 | 258 | 164 | 270 | 273 | 186 | 278 |
| 232 |
151 | 153 |
148 | 145 | 203 | 279 | 212 | 180 | 167 | 158 | 191 | 354 | 346 |
260 | 167 | 273 | 276 | 187 | 281 |
| 235 | 154 | 156 | 151 | 148 | 206 | 282 | 215 | 183 | 170 | 161 | 194 | 356 | 349 | 263 | 170 | 276 | 279 | 188 | 284 |
| 238 | 157 | 159 | 154 | 151 | 209 | 284 | 218 | 186 | 173 | 164 | 197 | 359 | 352 | 266 | 173 | 279 | 282 | 189 | 287 |
| 241 | 160 | 162 | 157 | 154 | 212 | 287 | 221 | 189 | 176 | 167 | 200 | 362 |
| 269 | 176 | 282 | 284 | 190 | 289 |
| 244 | 163 | 165 | 160 | 157 | 215 | 290 | 224 |
|
| 170 | 203 | 365 |
|
| 179 | 284 | 287 |
194 | 292 |
|
|
| 168 | 163 | 160 |
|
|
|
|
|
|
|
|
|
| 182 | 287 |
|
| 295 |
|
|
|
|
| 163 |
|
|
|
|
|
|
|
|
|
| 185 |
|
|
|
|
|
|
|
|
| 166 |
|
|
|
|
|
|
|
|
|
| 188 |
|
|
|
|
|
|
|
|
| 169 |
|
|---|
| B, CD8+
T cells, bp |
|
|---|
| DV 1 | AV 2S | AV 3S | AV 4S | AV 5S | AV 6S | AV 8-3S | AV 8-4S | AV 12S | AV 13S | AV 14S | AV 16S | AV 18S | AV 21 | AV 22 | AV 25 | AV 26 | AV 38 | AV 39 | AV XS |
| 225 | 144 | 140 | 138 | 153 | 194 | 266 | 198 | 168 | 158 | 149 | 182 | 339 | 337 | 246 | 164 | 268 | 267 | 192 | 275 |
| 228 | 147 | 143 | 141 | 156 | 197 | 269 | 201 | 171 | 161 | 152 | 185 | 342 | 340 | 249 | 167 | 271 | 270 | 195 | 278 |
| 231 | 150 |
147 | 144 | 159 | 200 | 272 | 204 | 174 | 164 | 155 | 188 | 345 | 343 | 252 | 170 | 274 | 273 | 198 | 281 |
| 234 | 153 | 150 |
148 | 160 | 203 | 275 | 207 | 177 | 167 | 158 | 191 | 348 | 346 | 255 | 173 | 276 | 276 | 201 | 284 |
| 237 | 154 | 153 | 151 | 163 | 206 | 278 | 210 | 180 | 170 | 161 | 194 | 351 | 349 | 258 | 176 | 279 | 279 | 204 | 287 |
| 240 | 157 | 156 | 154 | 166 | 209 | 281 | 211 | 183 | 173 | 164 | 197 | 354 | 352 | 260 | 179 | 282 | 282 | 207 | 289 |
|
| 160 | 159 | 157 | 169 |
| 284 | 214 | 186 | 176 | 167 | 200 | 357 | 355 | 263 | 182 | 285 | 285 |
| 292 |
|
|
| 162 | 160 | 172 |
| 287 | 217 | 189 | 179 | 170 | 203 | 360 | 358 | 266 |
| 288 |
|
| 295 |
|
|
| 165 | 163 |
|
| 290 |
|
|
|
| 206 | 363 |
| 269 |
|
|
|
|
|
|
|
|
|
|
|
|
|
|
|
|
|
| 366 |
| Table III.GeneScan analysis of CDR3 length in
the CD4+ and CD8+ T cells of TCR BV
families. |
Table III.
GeneScan analysis of CDR3 length in
the CD4+ and CD8+ T cells of TCR BV
families.
| A, CD4+
T cells, bp |
|---|
|
|---|
| BV2S | BV3S | BV4S | BV5S | BV6S | BV7S | BV9S | BV10S | BV11S | BV12S | BV12AS | BV15S | BV19S | BV20 | BV21 | BV24 | BV25 | BV27 | BV29 | BV30 | BVXS |
|---|
| 182 | 215 | 369 | 372 | 238 | 176 | 415 | 248 | 199 | 376 | 248 | 190 | 157 | 211 | 207 | 430 | 150 | 181 | 291 | 235 | 217 |
| 185 | 218 | 372 | 375 | 241 | 179 | 418 | 251 | 202 | 379 | 251 | 193 | 160 | 214 | 210 | 433 | 153 | 184 | 294 | 238 | 220 |
| 188 | 221 |
376 | 378 | 244 | 181 | 421 | 254 | 205 | 381 | 254 | 196 | 163 | 217 |
214 | 436 | 156 | 187 | 297 | 241 | 223 |
| 191 | 224 | 380 | 381 | 247 | 184 | 424 | 257 | 208 | 384 | 257 | 199 | 166 | 220 | 217 | 438 | 159 | 190 | 300 | 244 | 226 |
| 194 | 227 | 383 | 383 | 250 | 187 | 427 | 260 | 211 | 387 | 259 | 202 | 169 | 223 | 220 | 441 | 162 | 193 | 303 | 247 | 229 |
| 196 |
231 | 386 | 386 | 253 | 190 | 430 | 262 | 214 | 390 | 262 | 205 | 172 | 226 | 223 |
445 | 165 | 196 | 306 | 250 | 232 |
| 199 | 234 | 389 | 389 | 256 | 193 | 433 | 265 | 217 | 393 | 265 |
209 | 175 |
230 | 226 | 448 | 168 | 199 | 309 | 253 | 235 |
| 202 | 237 | 392 | 392 | 259 | 196 | 436 | 268 |
224 | 396 | 268 | 212 | 178 | 233 | 229 | 451 | 171 | 202 | 312 | 256 | 238 |
|
| 240 | 395 | 395 |
|
| 439 | 271 | 227 |
| 271 | 215 | 181 | 236 | 232 |
455 | 174 |
| 315 |
| 241 |
|
|
|
|
|
|
| 442 |
|
233 |
|
|
| 184 | 239 | 235 | 458 |
|
|
|
|
|
|
|
|
|
|
|
|
|
| 236 |
|
|
| 187 |
|
| 461 |
|
|
|
|
|
|
|
|
|
|
|
|
|
| 239 |
|
|
| 190 |
|
| 464 |
|
|
|
|
|
|
|
|
|
|
|
|
|
| 242 |
|
|
|
|
|
|
|
|
|
|
|
|
|
|
|
|
|
|
|
|
| 245 |
|
|
|
|
|
|
|
|
|
|
|
|
|
|---|
| B, CD8+ T-cells,
bp |
|
|
|
|
|
|
|
|
|
|
|
|
|
|
|
|
|
|
|
|
|
|---|
| BV2S | BV3S | BV4S | BV5S | BV6S | BV7S | BV9S | BV10S | BV11S | BV12S | BV12AS | BV15S | BV19S | BV20 | BV21 | BV24 | BV25 | BV27 | BV29 | BV30 | BVXS |
|
|---|
| 182 | 225 | 370 | 377 | 241 | 178 | 415 | 248 | 202 | 372 | 248 | 193 | 160 | 211 | 211 | 430 | 153 | 181 | 286 | 232 | 217 |
| 185 | 228 | 373 | 380 | 244 | 181 | 418 | 251 | 205 | 375 | 251 | 196 | 163 | 214 | 214 | 433 | 156 | 184 | 289 | 235 | 220 |
| 188 | 231 | 376 | 383 | 246 | 184 | 421 | 254 | 208 | 378 | 254 | 199 | 166 | 217 | 217 | 436 | 159 | 187 | 292 | 238 | 223 |
| 190 | 234 | 379 | 386 | 247 | 186 | 424 | 257 | 210 | 381 | 257 | 202 | 169 | 220 | 220 | 439 | 162 | 190 | 295 | 241 | 226 |
| 193 | 237 | 382 | 389 | 250 | 189 | 427 | 260 | 211 | 384 | 259 | 205 | 172 | 223 | 223 | 442 | 165 | 193 | 297 | 244 | 229 |
|
197 | 240 | 385 | 392 | 253 |
| 430 | 262 |
215 | 387 | 262 | 208 | 175 |
227 | 226 |
448 | 168 | 196 | 300 | 247 | 232 |
| 200 | 243 | 388 |
| 256 |
| 433 | 265 | 217 | 390 | 265 | 211 | 178 | 230 | 229 | 451 | 171 | 199 | 303 | 250 | 265 |
| 203 |
| 391 |
| 259 |
| 436 | 268 | 220 | 393 | 268 | 214 |
| 233 | 232 |
| 174 | 202 | 306 | 253 | 268 |
| 206 |
|
|
|
|
| 439 |
|
235 |
| 271 | 217 |
| 236 | 235 |
|
179 |
| 309 | 256 | 241 |
| 209 |
|
|
|
|
|
|
| 238 |
|
|
|
|
| 238 |
|
|
| 312 | 259 |
|
|
|
|
|
|
|
|
|
| 241 |
|
|
|
|
|
|
|
|
| 315 |
|
|
|
|
|
|
|
|
|
|
| 244 |
Following sequencing of CDR3 in the TCR gene
families with in-frame and out-of-frame CDR3 lengths, the
out-of-frame CDR3 sequence was revealed to be present in TCR AV and
BV gene families of CD4+ and CD8+ T
cells.
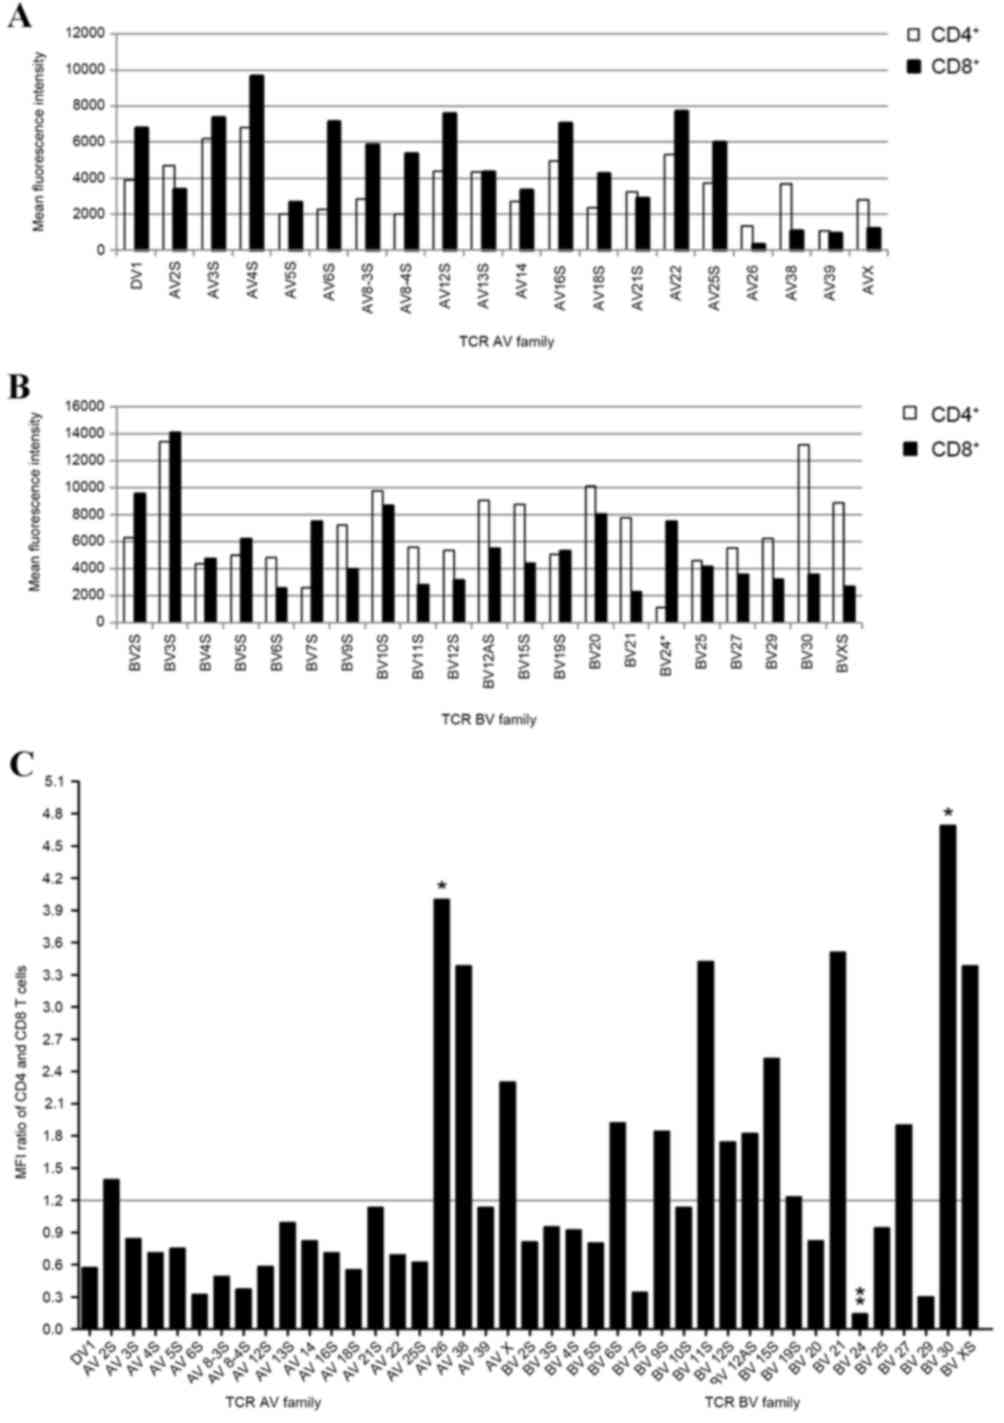
Expression frequency of CDR3
The average fluorescence intensity of each TCR AV
and BV gene family was then determined. The results demonstrated
that the expression frequencies of CDR3 in gene families of the
same subset were different, as was the CDR3 expression frequency in
same gene family between CD4+ and CD8+ T cell
subpopulations (Fig. 3A and B).
The CD4+/CD8+ mean fluorescence intensity
ratio among the different gene families is shown in Fig. 3C. A significantly higher mean
fluorescence intensity of AV26 (P=0.039) and BV30 (P=0.01), and a
significantly lower mean fluorescence intensity of BV24 (P=0.007)
was observed in the CD4+ population when compared with
the CD8+ population (Fig.
3C). The majority of the CD4+/CD8+ ratios
in the TCR AV gene families were <1.2, except for AV2S, AV26,
AV38 and AVX. In addition, the ratios in 11 TCR BV gene families
(BV6S, BV9S, BV11S, BV12S, BV12AS, BV15S, BV19S, BV21, BV27, BV30
and BVXS) were >1.2 (Fig. 3C).
The ratios were close to 1 in the TCR AV5S, AV13S, AV14, AV21S and
AV39 gene families, as well as the TCR BV3S, BV4S, BV10S, BV19S and
BV25 gene families, indicating similar fluorescence intensity
values of CDR3 in these families in CD4+ and
CD8+ T cells.
Discussion
The present study elucidated the patterns and length
distributions of the CDR3 repertoire of TCR AV and BV gene families
in separated CD4+ and CD8+ T cell populations
from miniature pigs using the immunoscope spectratyping technique.
In addition, the expression frequencies of CDR3 in the sorted T
cells were compared. The CD4+ and CD8+ T cell
populations demonstrated specific expression of all TCR AV and BV
gene families, and a typical Gaussian distribution model was
observed for each gene family. The majority of CDR3 was observed to
recombine in-frame, and the expression frequency of CDR3 in the
same family was different between CD4+ and
CD8+ T cell populations. The results of the present
study revealed the abundant diversity of CDR3 in CD4+
and CD8+ T cells.
The CDR3 PCR products of the 19 TCR AV and 20 TCR BV
gene families exhibited a clear, specific band of the expected size
on the 1.5% agarose gel electrophoretogram, suggesting that the TCR
gene families demonstrated specific expression patterns in the T
cell subsets. In the sequencing gel, >8 bands with a 3-bp gap
were observed in the majority of the gene families.
Theoretically, spectratypes of the CDR3 region
demonstrate a Gaussian distribution in immune homeostasis (27). In the present study, the majority
of CDR3 length distributions followed this pattern, and >8 peaks
in each gene family were observed. However, in CD4+ and
CD8+ T cells, TCR BV11S exhibited a dual Gaussian
distribution profile, which was consistent with the results of
previous studies involving PBMCs from healthy pigs (19,28).
In the present study, the detailed size of CDR3
sequences in various families was investigated, and >8 different
sequence lengths in each family were observed, implying the
polyclonal proliferation of TCR αβ T cells in normal pigs.
According to clonal selection theory, abortion rearrangement is
conceivable during VDJ recombination, and P/N insertion (29) increases this probability (19). However, all CDR3 genes in mature T
cells following positive and negative selection in peripheral blood
should be in-frame. The results of the present study demonstrated
that the majority of the CDR3 genes were recombined in-frame, with
a 3-bp gap between two adjacent CDR3 lengths; whereas the remaining
demonstrated 1, 2, 4 or >4-bp discrepancies. Meanwhile, those
gene families with out-of-frame CDR3 lengths were cloned and
sequenced, and these out-of-frame CDR3 sequences were revealed to
exist in both CD4+ and CD8+ T cells. A
previous study investigating CDR3 TCR β chain diversity in porcine
PBMCs additionally observed this phenomenon (19). These specific characteristics of
CDR3 have been demonstrated in the present study, as well as a
number of previous studies (28,30).
Specific TCR BV CDR3 lengths between two adjacent CDR3 products in
the PBMCs of miniature pigs revealed a 1-bp gap (28). The same 1–2 bp or ≥6 bp discrepancy
was observed in four normal volunteers following the analysis of
the CDR3 length repertoire and diversity of TCR α chains in human
peripheral blood T lymphocytes (30). To the best of our knowledge, there
are currently no reports regarding in-frame/out-of-frame
rearrangements of CDR3 at the mRNA level in peripheral T cells.
These out-of-frame CDR3 features may be derived from individual
germ-line gene sequences or belong to the pseudogene family
(31). In addition, 10 amino acid
residue discrepancies were observed in specific TCR AV gene
families between the longest and shortest CDR3 sequence, and 14
amino acid residues in several TCR BV gene families in the present
study. A comparison of antigenic peptides in a previous study
revealed that the TCR CDR3 segments were more diverse in length,
potentially due to the weaker association of antigenic peptides
with the TCR than with the MHC (32). Although the CDR3 length repertoire
is determined during thymic selection and maintained in the
peripheral blood, it differed between CD4+ and
CD8+ T cells in the present study. Pannetier et
al (33) observed that
different TCR BV subsets prefer different CDR3 lengths. However,
whether there is a clear difference between CD4+ and
CD8+ T cells remains to be verified.
Average fluorescence intensity analysis of CDR3 in
the present study, revealed that different gene families exhibited
variable expression frequencies, and that the same gene family
demonstrated different expression frequencies between the two T
cell subsets. Mean fluorescence intensity analysis revealed that
AV26 and BV30 families displayed significantly higher levels of
expression frequency, and BV24 exhibited significantly lower levels
of expression frequency in CD4+ T cells when compared
with CD8+ T cells. From the overall levels of expression
frequency, the majority of TCR AV families in CD4+ T
cells demonstrated relatively low expression levels, whereas
>50% of the TCR BV gene families were overexpressed when
compared with CD8+ T cells. Unlike a previous study
involving PBMCs (19), BV9S, BV21
and BV3S families were the most frequently expressed, and the
expression frequency of BV24 was low in all experimental
animals.
In conclusion, the present study demonstrated the
length and expression frequency of the CDR3 repertoire of the TCR
AV and TCR BV gene families in separated CD4+ and
CD8+ T cells. All detected TCR AV and TCR BV gene
families were universally expressed in the two T cell subsets, and
presented with a standard Gaussian distribution pattern, except for
TRBV11S that exhibited a dual Gaussian distribution profile.
Knowledge of the diversity of CDR3 sequence lengths and the
nonuniform patterns of expression, may provide a more detailed
understanding of porcine TCR gene recombination, and provide an
explanation for the high number of CDR3 polymorphisms and TCR CDR3
repertoire drift that occur under a pathogenic status. However, the
mechanisms of restrictive use of the TCR gene families and the CDR3
length diversity in the T cell subsets under pathological
conditions require further clarification.
Acknowledgements
The present study was supported by the National
Natural Science Foundation of China (grant no. 31372423).
References
|
1
|
Davis MM, Boniface JJ, Reich Z, Lyons D,
Hampl J, Arden B and Chien Y: Ligand recognition by alpha beta T
cell receptors. Ann Rev Immunol. 16:523–544. 1998. View Article : Google Scholar
|
|
2
|
Davis MM: T cell receptor gene diversity
and selection. Ann Rev Biochem. 59:475–496. 1990. View Article : Google Scholar : PubMed/NCBI
|
|
3
|
Rowen L, Koop BF and Hood L: The complete
685-kilobase DNA sequence of the human betaT cell receptor locus.
Science. 272:1755–1762. 1996. View Article : Google Scholar : PubMed/NCBI
|
|
4
|
Allison TJ, Winter CC, Fournié J-J,
Bonneville M and Garboczi DN: Structure of a human gammadelta
T-cell antigen receptor. Nature. 411:820–824. 2001. View Article : Google Scholar : PubMed/NCBI
|
|
5
|
Gorski J, Yassai M, Zhu X, Kissela B,
Kissella B [corrected to Kissela B], Keever C and Flomenberg N:
Circulating T cell repertoire complexity in normal individuals and
bone marrow recipients analyzed by CDR3 size spectratyping.
Correlation with immune status. J Immunol. 152:5109–5119.
1994.PubMed/NCBI
|
|
6
|
Höhn H, Neukirch C, Freitag K, Necker A,
Hitzler W, Seliger B and Maeurer MJ: Longitudinal analysis of the
T-cell receptor (TCR)-VA and-VB repertoire in CD8+ T cells from
individuals immunized with recombinant hepatitis B surface antigen.
Clin Exp Immunol. 129:309–317. 2002. View Article : Google Scholar : PubMed/NCBI
|
|
7
|
Luo W, Ma L, Wen Q, Wang N, Zhou MQ and
Wang XN: Analysis of the interindividual conservation of T cell
receptor alpha- and beta-chain variable regions gene in the
peripheral blood of patients with systemic lupus erythematosus.
Clin Exp Immunol. 154:316–324. 2008. View Article : Google Scholar : PubMed/NCBI
|
|
8
|
Codina-Busqueta E, Scholz E, Muñoz-Torres
PM, Roura-Mir C, Costa M, Xufré C, Planas R, Vives-Pi M,
Jaraquemada D and Martí M: TCR bias of in vivo expanded T cells in
pancreatic islets and spleen at the onset in human type 1 diabetes.
J Immunol. 186:3787–3797. 2011. View Article : Google Scholar : PubMed/NCBI
|
|
9
|
Kitaura K, Fujii Y, Hayasaka D, Matsutani
T, Shirai K, Nagata N, Lim CK, Suzuki S, Takasaki T, Suzuki R and
Kurane I: High clonality of virus-specific T lymphocytes defined by
TCR usage in the brains of mice infected with West Nile virus. J
Immunol. 187:3919–3930. 2011. View Article : Google Scholar : PubMed/NCBI
|
|
10
|
González-Serna A, Abad-Fernández M,
Soriano-Sarabia N, Leal M and Vallejo A: CD8 TCR β chain repertoire
expansions and deletions are related with immunologic markers in
HIV-1-infected patients during treatment interruption. J Clin
Virol. 58:703–709. 2013. View Article : Google Scholar : PubMed/NCBI
|
|
11
|
Maru Y, Yokosuka O, Imazeki F, Saisho H
and Omata M: Analysis of T cell receptor variable regions and
complementarity determining region 3 of infiltrating T lymphocytes
in the liver of patients with chronic type B hepatitis.
Intervirology. 46:277–288. 2003. View Article : Google Scholar : PubMed/NCBI
|
|
12
|
Gras S, Wilmann PG, Chen Z, Halim H, Liu
YC, Kjer-Nielsen L, Purcell AW, Burrows SR, McCluskey J and
Rossjohn J: A structural basis for varied αβ TCR usage against an
immunodominant EBV antigen restricted to a HLA-B8 molecule. J
Immunol. 188:311–321. 2012. View Article : Google Scholar : PubMed/NCBI
|
|
13
|
Rezvany M-R, Jeddi-Tehrani M, Wigzell H,
Osterborg A and Mellstedt H: Leukemia-associated monoclonal and
oligoclonal TCR-BV use in patients with B-cell chronic lymphocytic
leukemia. Blood. 101:1063–1070. 2003. View Article : Google Scholar : PubMed/NCBI
|
|
14
|
Luo W, Liao WJ, Huang YT, Shi M, Zhang Y,
Wen Q, Zhou MQ and Ma L: Normalization of T cell receptor
repertoire diversity in patients with advanced colorectal cancer
who responded to chemotherapy. Cancer Sci. 102:706–712. 2011.
View Article : Google Scholar : PubMed/NCBI
|
|
15
|
Hirokawa M, Matsutani T, Saitoh H,
Ichikawa Y, Kawabata Y, Horiuchi T, Kitabayashi A, Yoshioka T,
Tsuruta Y, Suzuki R, et al: Distinct TCRAV and TCRBV repertoire and
CDR3 sequence of T lymphocytes clonally expanded in blood and GVHD
lesions after human allogeneic bone marrow transplantation. Bone
Marrow Transplant. 30:915–923. 2002. View Article : Google Scholar : PubMed/NCBI
|
|
16
|
Gorski J, Yassai M, Keever C and
Flomenberg N: Analysis of reconstituting T cell receptor
repertoires in bone marrow transplant recipients. Arch Immunol Ther
Exp (Warsz). 43:93–97. 1995.PubMed/NCBI
|
|
17
|
Kim G, Tanuma N and Matsumoto Y:
Stage-dependent usage of TCR alpha chains with different CDR3
motifs by spinal cord T cells in autoimmune encephalomyelitis. J
Neuroimmunol. 96:66–72. 1999. View Article : Google Scholar : PubMed/NCBI
|
|
18
|
Gianello P, Fishbein JM and Sachs DH:
Tolerance to primarily vascularized allografts in miniature swine.
Immunol Rev. 133:19–44. 1993. View Article : Google Scholar : PubMed/NCBI
|
|
19
|
Yao WJ, Fang YX, Jia HJ, He XB, Zeng S,
Chen GH, Liu TA and Jing ZZ: Diversity and molecular genetic
characteristics of porcine T cell receptor β chain. Vet Sci Chi.
44:641–649. 2014.
|
|
20
|
Yamamoto R, Uenishi H, Hatsuse H, Sato E,
Awata T, Yasue H and Takagaki Y: TRAV gene usage in pig T-cell
receptor alpha cDNA. Immunogenetics. 57:219–225. 2005. View Article : Google Scholar : PubMed/NCBI
|
|
21
|
Baron C, Sachs DH and LeGuern C: A
particular TCR beta variable region used by T cells infiltrating
kidney transplants. J Immunol. 166:2589–2596. 2001. View Article : Google Scholar : PubMed/NCBI
|
|
22
|
Butler JE, Wertz N, Sun J and Sacco RE:
Comparison of the expressed porcine Vbeta and Jbeta repertoire of
thymocytes and peripheral T cells. Immunology. 114:184–193. 2005.
View Article : Google Scholar : PubMed/NCBI
|
|
23
|
Watanabe M, Iwasaki Y, Mita Y, Ota S,
Yamada S, Shimuzu M and Takagaki Y: Porcine T-cell receptor
beta-chain: A genomic sequence covering Dbeta1. 1 to Cbeta2 gene
segments and the diversity of cDNA expressed in piglets including
novel alternative splicing products. Mol Immunol. 44:2332–2343.
2007. View Article : Google Scholar : PubMed/NCBI
|
|
24
|
Eguchi-Ogawa T, Toki D and Uenishi H:
Genomic structure of the whole D-J-C clusters and the upstream
region coding V segments of the TRB locus in pig. Dev Comp Immunol.
33:1111–1119. 2009. View Article : Google Scholar : PubMed/NCBI
|
|
25
|
Li T, He X, Jia H, Chen G, Zeng S, Fang Y,
Jin Q and Jing Z: Molecular cloning and functional characterization
of murine toll-like receptor 8. Mol Med Rep. 13:1119–1126.
2016.PubMed/NCBI
|
|
26
|
Chen G, Zeng S, Jia H, He X, Fang Y, Jing
Z and Cai X: Adjuvant effect enhancement of porcine interleukin-2
packaged into solid lipid nanoparticles. Res Vet Sci. 96:62–68.
2014. View Article : Google Scholar : PubMed/NCBI
|
|
27
|
Luo W, Liao WJ, Ma L, Huang YT, Shi M, Wen
Q and Wang XN: Dynamic monitoring the TCR CDR3 spectratypes in
patients with metastatic CRC treated with a combination of
bevacizumab, irinotecan, fluorouracil, and leucovorin. Cancer
Immunol Immunother. 59:247–256. 2010. View Article : Google Scholar : PubMed/NCBI
|
|
28
|
Yao WJ: Dynamic changes of T cell receptor
α and β chain variable regions in the peripheral blood mononuclear
cells of the infected pigs by C-strain classical swine fever virus
(unpublished PhD thesis). Chinese Academy of Agricultural Sciences.
2014.
|
|
29
|
Fazilleau N, Cabaniols JP, Lemaître F,
Motta I, Kourilsky P and Kanellopoulos JM: Valpha and Vbeta public
repertoires are highly conserved in terminal deoxynucleotidyl
transferase-deficient mice. J Immunol. 174:345–355. 2005.
View Article : Google Scholar : PubMed/NCBI
|
|
30
|
Yao XS, Diao Y, Sun WB, Luo JM, Qin M and
Tang XY: Analysis of the CDR3 length repertoire and the diversity
of TCR alpha chain in human peripheral blood T lymphocytes. Cell
Mol Immunol. 4:215–220. 2007.PubMed/NCBI
|
|
31
|
Nemazee D: Receptor editing in lymphocyte
development and central tolerance. Nat Rev Immunol. 6:728–740.
2006. View Article : Google Scholar : PubMed/NCBI
|
|
32
|
Nishio J, Suzuki M, Nanki T, Miyasaka N
and Kohsaka H: Development of TCRB CDR3 length repertoire of human
T lymphocytes. Int Immunol. 16:423–431. 2004. View Article : Google Scholar : PubMed/NCBI
|
|
33
|
Pannetier C, Cochet M, Darche S, Casrouge
A, Zöller M and Kourilsky P: The sizes of the CDR3 hypervariable
regions of the murine T-cell receptor beta chains vary as a
function of the recombined germ-line segments. Proc Natl Acad Sci
USA. 90:4319–4323. 1993. View Article : Google Scholar : PubMed/NCBI
|