Introduction
Gastric cancer (GC) is the fourth most common cancer
and the second leading cause of cancer-associated mortality
worldwide (1). As 5-year survival
rates of GC remain <30% (2,3),
further understanding of GC is urgently required.
Epithelial-mesenchymal transition (EMT) is an
essential early step in tumor metastasis (4). During EMT, tumor cells lose their
epithelial characteristics and obtain mesenchymal traits (5–8). It
has been demonstrated that EMT is correlated with poor tumor
staging, an increased risk of cancer recurrence and decreased
survival in various cancer types, including breast (9,10),
colorectal (11), bladder
(12,13), lung (14) and GC (15).
Stromal interaction molecule 1 (STIM1) is
responsible for the activation of store-operated Ca2+
entry (16). Previous studies have
reported that STIM1 is important in the growth and migration of
cancer cells, and for angiogenesis and progression of cancer
(17–20). Furthermore, STIM1 is a key molecule
in the process of EMT in various cancer types. Ectopic STIM1
expression induced EMT in colorectal cancer cells (20), and STIM1 silencing reversed EMT
initiated by downregulation of the POU class 5 homeobox 1
transcription factor in breast cancer cells (19). Casas-Rua et al (21) demonstrated that STIM1
overexpression increased migration and EMT in endometrial
adenocarcinoma cells. However, the role of STIM1 in GC progression
and metastasis and its association with EMT remains to be
elucidated.
In the present study, immunohistochemistry was
performed to detect STIM1, E-cadherin, β-catenin and matrix
metalloproteinase-9 (MMP-9) in 170 GC and 35 adjacent healthy
gastric tissue samples. STIM1 was overexpressed in GC samples and
associated with poor survival of GC patients. STIM1 expression was
significantly associated with abnormal cytoplasmic and nuclear
expression of E-cadherin and β-catenin in GC cells, which suggested
that STIM1 may promote EMT in GC.
Materials and methods
Patients and tissue samples
GC and adjacent healthy tissue samples were obtained
from 170 GC patients with histologically confirmed gastric
adenocarcinoma between June 2009 and October 2011 at The Fourth
Affiliated Hospital of Hebei Medical University (Shijiazhuang,
China). All patients underwent surgical resection of the stomach
with lymph node dissection, with no chemotherapy or radiotherapy
preoperation; no other cancers were diagnosed simultaneously. The
present study was approved by the Ethics Committees of The Fourth
Affiliated Hospital of Hebei Medical University, and written
consent was obtained from all patients. Follow-up data were
primarily obtained by telephone and out-patient review. Patients
with inadequate follow-up were excluded from the study.
Of the 170 GC patients enrolled in the present
study, 127 were male (74.7%) and 43 were female (25.3%), with an
average age of 57.85 years (range, 33–81 years). In total, 57
(33.5%) cases were stage I and II tumors at diagnosis, and 113
(66.5%) were stage III and IV. Tumors were evaluated according to
the tumor-node-metastasis (TNM) staging system for carcinoma of the
stomach (22). A total of 106
patients (62.4%) had regional lymph node metastasis (LNM), whereas
64 (37.6%) had no regional LNM. Tumors were located in the cardia
of 54.1% of patients, and in the antrum of 39.4%. Tumors ranged
from 2 to 12 cm in size, with a mean size of 7.12 cm. A total of 79
tumors (46.5%) were poorly differentiated and 91 (53.5%) were
moderately or well differentiated, according to the criteria
proposed by the World Health Organization Classification of Tumors
(3rd Edition) (23). The
clinicopathological characteristics of patients are presented in
Table I.
 | Table I.Association of STIM1, E-cadherin,
β-cadherin and MMP-9 expression with characteristics of 170 gastric
cancer patients. |
Table I.
Association of STIM1, E-cadherin,
β-cadherin and MMP-9 expression with characteristics of 170 gastric
cancer patients.
|
| STIM1 |
|
| E-Cadherin |
|
| β-cadherin |
|
| MMP-9 |
|
|
|---|
|
|
|
|
|
|
|
|
|
|
|
|
|
|
|---|
|
| Positive | Negative |
|
| Positive | Negative |
|
| Positive | Negative |
|
| Positive | Negative |
|---|
| Characteristic | (74) | (96) | χ2 | P-value | (89) | (81) | χ2 | P-value | (105) | (65) | χ2 | P-value | (88) | (82) | χ2 | P-value |
|---|
| Sex |
| Male
(127) | 54 (42.5) | 73 (57.5) | 0.208 | 0.648 | 63 (49.6) | 64 (50.4) | 1.52 | 0.218 | 76 (59.8) | 51 (40.2) | 0.79 | 0.375 | 68 (53.5) | 59 (46.5) | 0.64 | 0.43 |
| Female
(43) | 20 (46.5) | 23 (53.5) |
|
| 26 (60.5) | 17 (39.5) |
|
| 29 (67.4) | 14 (32.6) |
|
| 20 (46.5) | 23 (53.5) |
|
| Age (years) |
| ≤60
(96) | 45 (46.9) | 51 (53.1) | 1.004 | 0.316 | 48 (50.0) | 48 (50.0) | 0.49 | 0.484 | 55 (57.3) | 41 (42.7) | 1.87 | 0.171 | 45 (46.9) | 51 (53.1) | 2.11 | 0.15 |
| >60
(74) | 29 (39.2) | 45 (60.8) |
|
| 41 (55.4) | 33 (44.6) |
|
| 50 (67.6) | 24 (32.4) |
|
| 43 (58.1) | 31 (41.9) |
|
|
| Tumor location |
| Cardia
(92) | 43 (46.7) | 49 (79.0) | 1.010 | 0.603 | 44 (47.8) | 48 (52.2) | 1.70 | 0.428 | 58 (63.0) | 34 (37.0) | 0.20 | 0.904 | 49 (53.3) | 43 (46.7) | 5.37 | 0.07 |
| Body
(11) | 5 (45.5) | 6 (54.5) |
|
| 6 (54.5) | 5 (45.5) |
|
| 7 (63.6) | 4 (36.4) |
|
| 2 (18.2) | 9 (81.8) |
|
|
| Antrum
(67) | 26 (38.8) | 41 (61.2) |
|
| 39 (58.2) | 28 (41.8) |
|
| 40 (59.7) | 27 (40.3) |
|
| 37 (55.2) | 30 (44.8) |
|
|
| Tumor
differentiation |
|
Poor/undifferentiated
(79) | 32 (40.5) | 47 (59.5) | 0.549 | 0.459 | 37 (46.8) | 42 (53.2) | 1.80 | 0.180 | 54 (68.4) | 25 (31.6) | 2.71 | 0.099 | 45 (57.0) | 34 (43.0) | 1.60 | 0.21 |
|
High/moderate (91) | 42 (46.2) | 49 (53.8) |
|
| 52 (57.1) | 39 (42.9) |
|
| 51 (56.0) | 40 (44.0) |
|
| 43 (47.3) | 48 (52.7) |
|
|
| Tumor size |
| <5
cm (74) | 34 (45.9) | 40 (54.1) | 0.311 | 0.577 | 36 (48.6) | 38 (51.4) | 0.72 | 0.399 | 48 (64.9) | 26 (35.1) | 25.84b | <0.001 | 32 (43.2) | 42 (56.8) | 3.81 | 0.05 |
| ≥5 cm
(96) | 40 (41.7) | 56 (58.3) |
|
| 53 (55.2) | 43 (44.8) |
|
| 57 (59.3) | 39 (40.6) |
|
| 56 (58.3) | 40 (41.7) |
|
|
| Lymphatic
metastasis |
|
Negative (64) | 10 (15.6) | 54 (84.4) | 32.513b | <0.001 | 22 (34.4) | 42 (65.6) | 13.30b | <0.001 | 16 (25.0) | 48 (75.0) | 58.75b | <0.001 | 16 (25.0) | 48 (75.0) | 29.45b | <0.001 |
|
Positive (106) | 64 (60.4) | 42 (39.6) |
|
| 67 (63.2) | 39 (36.8) |
|
| 89 (84.0) | 17 (16.0) |
|
| 72 (67.9) | 34 (32.1) |
|
|
|
Tumor-node-metastasis stage |
| I–II
(57) | 17 (29.8) | 40 (70.2) | 6.552a | 0.010 | 18 (31.6) | 39 (68.4) | 14.84b | <0.001 | 20 (35.1) | 37 (64.9) | 25.84b | <0.001 | 27 (47.4) | 30 (52.6) | 0.66 | 0.42 |
| III–IV
(113) | 57 (50.4) | 56 (49.6) |
|
| 71 (62.8) | 42 (37.2) |
|
| 85 (75.2) | 28 (24.8) |
|
| 61 (54.0) | 52 (46.0) |
|
|
170 GC tumor tissues were analyzed in the present
study, with 35 adjacent healthy gastric mucosa tissues as negative
controls. All tissue samples were fixed in 10% neutral formalin,
embedded in paraffin blocks, cut into 4-µm thick serial sections,
and placed on glass slides for immunohistochemical staining.
Immunohistochemical staining of STIM1,
E-cadherin, β-catenin and MMP-9
Immunohistochemistry was performed using rabbit
anti-human STIM1 (ab108994; 1:100; Abcam, Cambridge, UK), mouse
anti-human E-cadherin (ab1416; 1:100; Abcam), rabbit anti-human
anti-β-catenin (ab32572; 1:500; Abcam) and rabbit anti-human MMP-9
(ab73734; 1:200; Abcam) primary antibodies. Sections were
deparaffinized, rehydrated, rinsed in phosphate-buffered saline
(PBS; pH 7.4) and autoclaved in EDTA buffer (pH 8.0) for antigen
retrieval. Following cooling to room temperature for 20 min,
sections were rinsed in PBS and incubated in 3%
H2O2 for 15 min to block endogenous
peroxidase activity. Sections were again rinsed with PBS and
incubated with normal goat serum (Beijing Zhongshan Jinqiao
Biological Technology Co., Ltd., Beijing, China) at 37°C for 15 min
to block nonspecific antibody binding. Following incubation with
primary antibodies at 37°C for 2 h, sections were rinsed in PBS,
incubated with a biotinylated secondary antibody (biotinylated goat
anti-mouse/rabbit IgG; SP-9000; Beijing Zhongshan Jinqiao
Biological Technology Co., Ltd.) at room temperature for 15 min and
rinsed with PBS. Following incubation with streptavidin-horseradish
peroxidase (Beijing Zhongshan Jinqiao Biological Technology Co.,
Ltd.) and further rinsing with PBS, proteins were visualized using
3,3′-diaminobenzidine (Beijing Zhongshan Jinqiao Biological
Technology Co., Ltd.) and sections were counterstained with
hematoxylin. Finally, sections were dehydrated, cleared, covered
with coverslips and sealed with neutral gum.
All slides were assessed by two pathologists who
were blinded to the patient details. The intensity of STIM1
staining was graded on a 0–3 scale: 0, no staining; 1, weak
immunoreactivity; 2, moderate immunoreactivity; 3, strong
immunoreactivity. The percentage of immunoreactivity was scored on
a 0–3 scale: 0, no positive cells; 1, 0–25% positive cells; 2,
26–50% positive cells; 3, >50% positive cells (24). E-cadherin, β-catenin and MMP-9
staining were classified as abnormal according to the degree of
cytoplasmic and nuclear staining and the proportion of positive
cells. Abnormal staining intensity was graded on a 0–3 scale: 0, no
staining; 1, weak immunoreactivity; 2, moderate immunoreactivity;
3, strong immunoreactivity. The percentage of abnormal
immunoreactivity was scored on a 0–4 scale: 0, 0–20% positive
cells; 1, 21–40% positive cells; 2, 41–60% positive cells; 3,
61–80% positive cells; 4, >80% positive cells (25). The staining intensity score was
multiplied by the percentage immunoreactivity score to obtain a
composite score. The composite score was considered the overall
expression level: 0–4, negative; 5–6, positive; 6–12, strongly
positive.
Statistical analysis
All data were processed with SPSS software version
19.0 (IBM SPSS, Armonk, NY, USA). P<0.05 was considered to
indicate a statistically significant difference. The chi-square
test was used to analyze the association between STIM1 expression
and patient characteristics. A binary logistical regression model
was applied to identify factors associated with STIM1 positive
expression. Cohen's kappa statistic was used to determine the
association between STIM1 expression and abnormal E-cadherin and
β-catenin expression. The Kaplan-Meier method was used to calculate
patient survival rate, and the Cox proportional hazards models were
employed to identify independent factors associated with patient
survival. In this model, X1, Age; X2, Sex; X3, Tumor location; X4,
Tumor differentiation; X5, Tumor size; X6, Lymphatic metastasis;
X7, Tumor-node-metastasis; and X8, STIM1 expression were used as
independent variables; and Y, Survival as a dependent variable.
Results
STIM1 expression and its association
with clinicopathological characteristics of GC patients
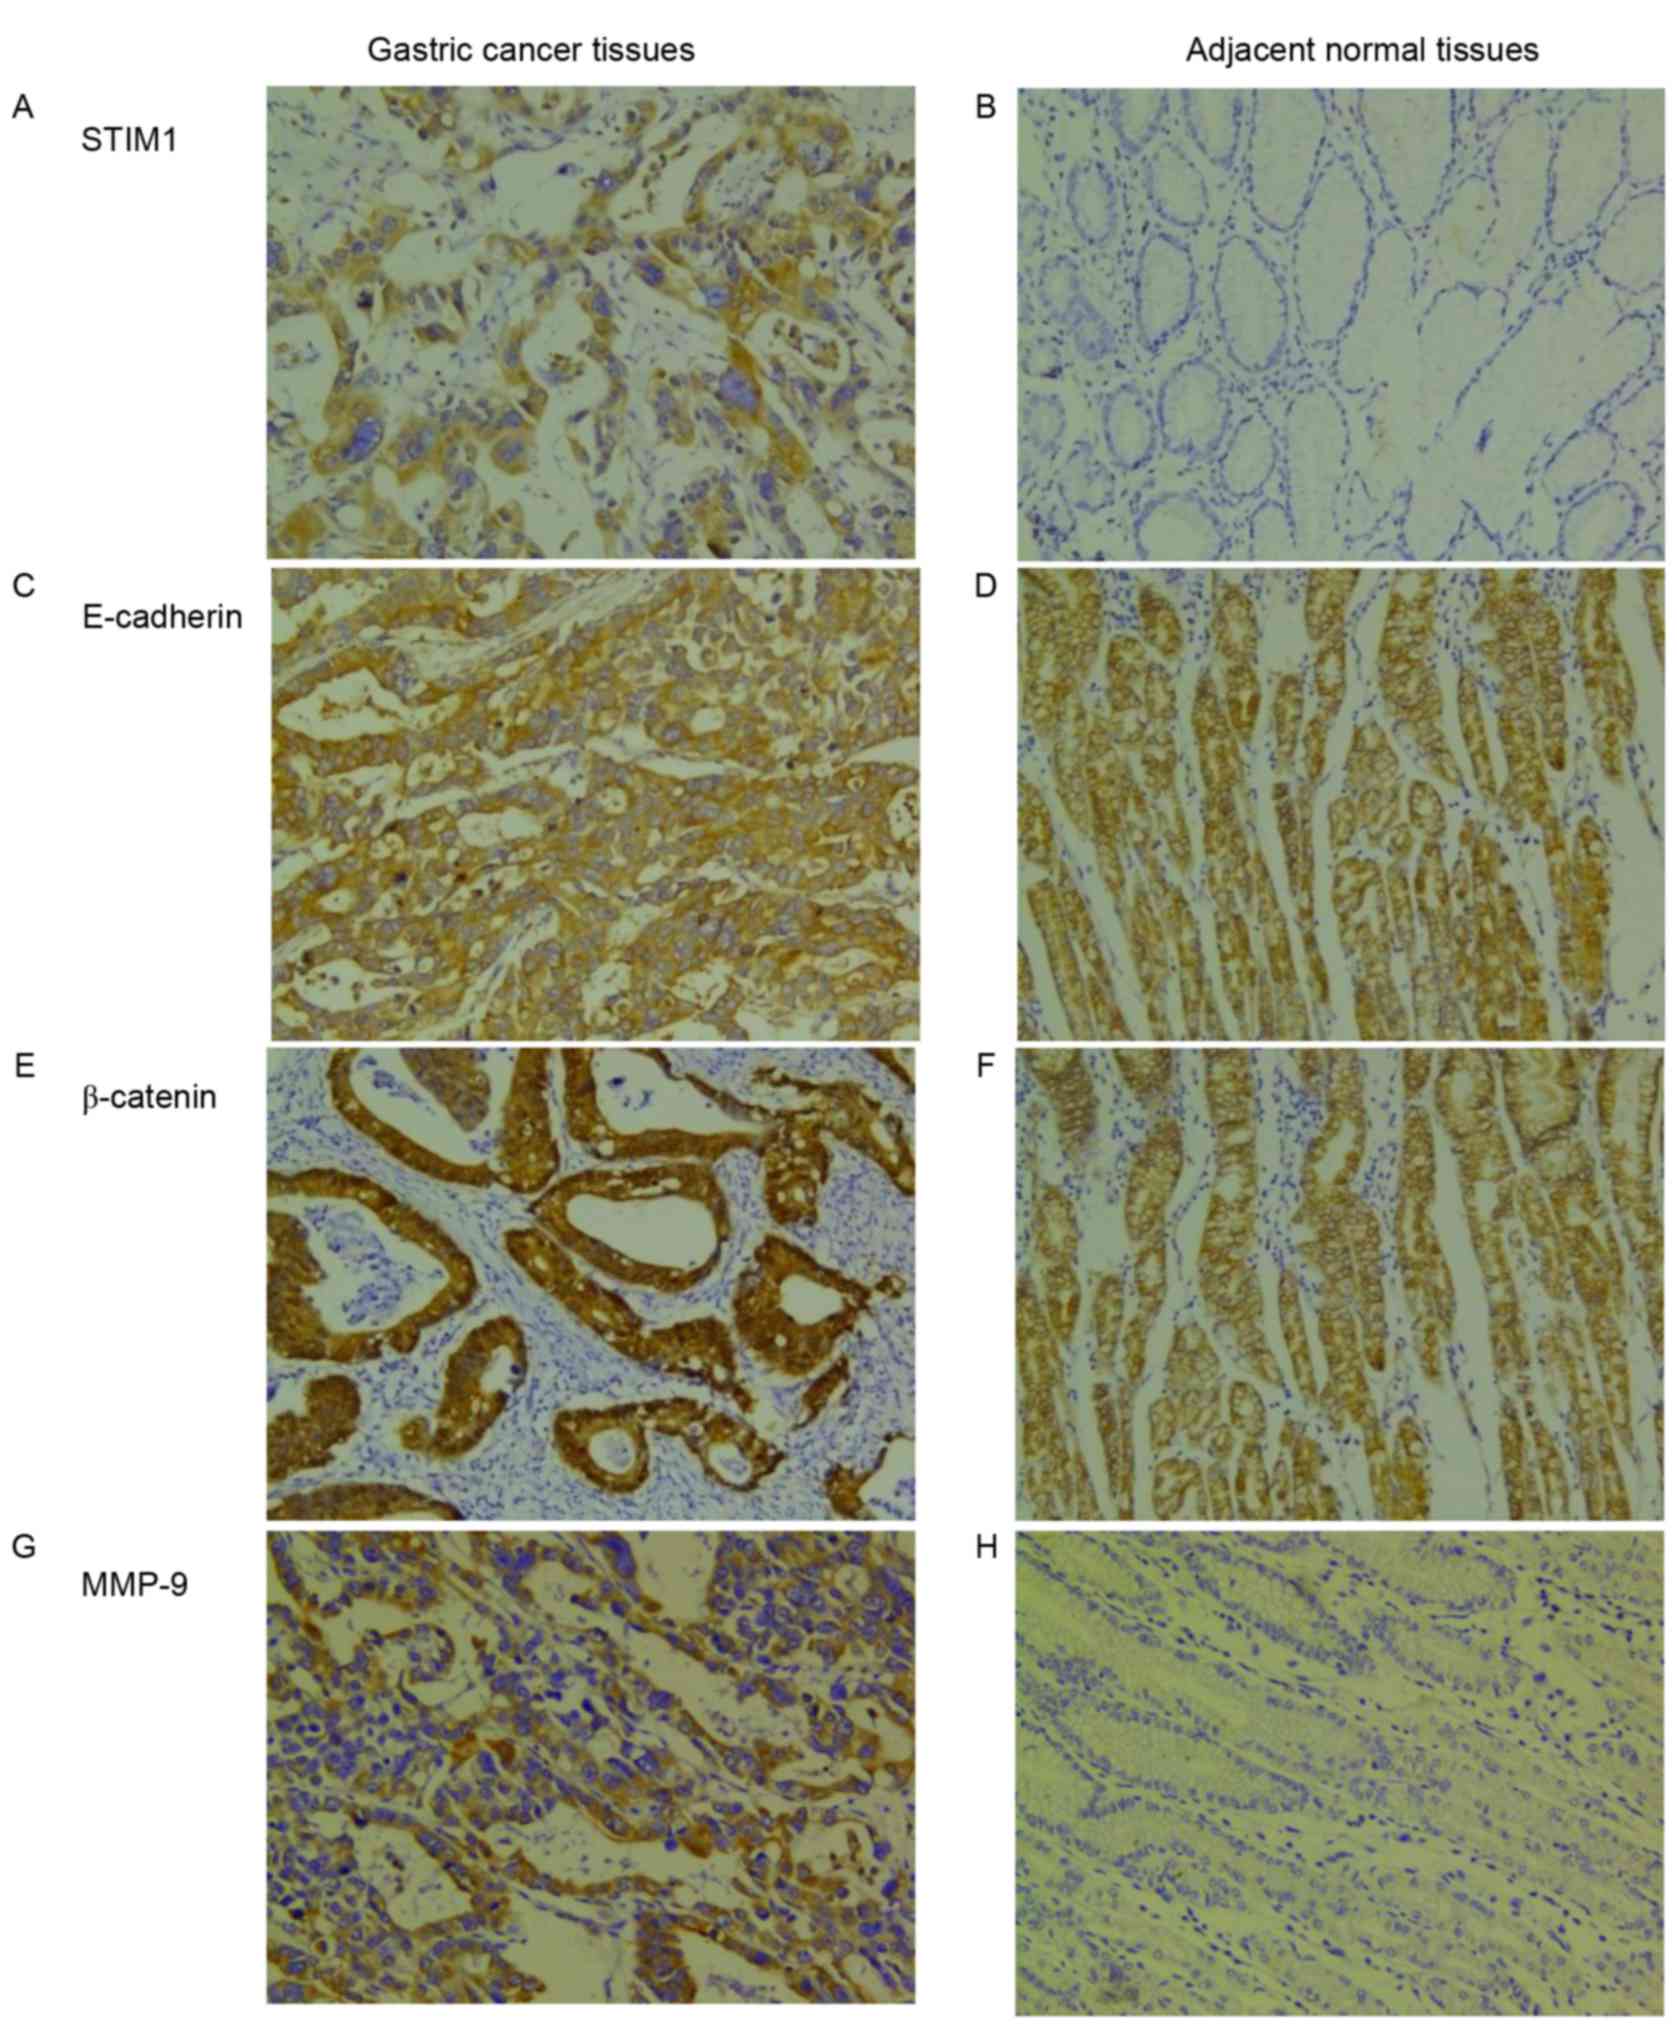
STIM1 expression in GC tissues was predominantly
cytoplasmic (Fig. 1A). The STIM1
positive expression rate in GC tissues was 43.5% (74/170), which
was significantly greater compared with adjacent healthy tissues
(8.60%; 3/35; χ2=15.12; P<0.001; Table II; Fig. 1B). The STIM1 expression rate in GC
patients with LNM was significantly greater compared with patients
without LNM (P<0.001). STIM1 expression in stage I–II GC tissues
was 33.5% (17/57), which was significantly reduced compared with
stage III–IV tumors (66.5%; 57/113; P=0.01; Table I). However, STIM1 expression in GC
tissues did not correlate with sex, age, the degree of histologic
differentiation, location of the tumor or tumor size (P>0.05).
Cox risk regression analysis indicated that lymphatic metastasis
was the only independent risk factor for STIM1 expression in GC
patients (Table III).
| Table II.STIM1, E-cadherin, β-catenin and
MMP-9 expression in GC tissues and adjacent healthy gastric
tissues. |
Table II.
STIM1, E-cadherin, β-catenin and
MMP-9 expression in GC tissues and adjacent healthy gastric
tissues.
|
| STIM1 |
|
| E-cadherin |
|
| β-catenin |
|
| MMP-9 |
|
|
|---|
|
|
|
|
|
|
|
|
|
|
|
|
|
|
|---|
| Tissue | Positive | Negative | χ2 | P-value | Positive | Negative | χ2 | P-value | Positive | Negative | χ2 | P-value | Positive | Negative | χ2 | P-value |
|---|
| GC | 74 (43.5) | 96 (56.5) | 15.12b | <0.001 | 105 (61.8) | 65 (38.2) | 29.53b | <0.001 | 89 (52.4) | 81 (47.6) | 12.20b | <0.001 | 88 (51.8) | 82 (48.2) | 6.26a | 0.012 |
| Adjacent healthy
gastric | 3 (8.60) | 32 (91.4) |
|
| 4 (11.4) | 31 (88.6) |
|
| 7 (20.0) | 28 (80.0) |
|
| 10 (28.6) | 25 (71.4) |
|
|
| Table III.Multivariate analysis of factors
associated with stromal interaction molecule 1 expression in
gastric carcinoma. |
Table III.
Multivariate analysis of factors
associated with stromal interaction molecule 1 expression in
gastric carcinoma.
|
|
|
|
|
|
|
| 95.0% CI for Exp
(B) |
|
|
|---|
|
|
|
|
|
|
|
|
|
|---|
| Parameter | B | SE | Wald | df | Sig. | Exp (B) | Lower | Upper |
|---|
| Sex | 0.690 | 0.429 | 2.584 | 1 | 0.108 | 1.994 | 0.860 | 4.626 |
| Age | −0.403 | 0.359 | 1.256 | 1 | 0.262 | 0.669 | 0.331 | 1.352 |
| Tumor location | −0.028 | 0.190 | 0.023 | 1 | 0.881 | 0.972 | 0.670 | 1.410 |
| Tumor
differentiation | 0.162 | 0.358 | 0.205 | 1 | 0.651 | 1.176 | 0.583 | 2.371 |
| Tumor size | −0.126 | 0.361 | 0.121 | 1 | 0.728 | 0.882 | 0.434 | 1.790 |
| Lymphatic
metastasis | 2.171 | 0.446 | 23.734 | 1 | 0.000 | 8.767 | 3.660 | 20.998 |
|
Tumor-node-metastasis | 0.238 | 0.411 | 0.336 | 1 | 0.562 | 1.269 | 0.567 | 2.840 |
| Constant | −2.666 | 1.154 | 5.335 | 1 | 0.021 | 0.070 |
|
|
E-cadherin, β-catenin and MMP-9
expression, and their association with clinicopathological features
of GC patients
In the present study, E-cadherin (Fig. 1C and D) and β-catenin (Fig. 1E and F) were abnormally expressed
in the cytoplasm or nucleus of GC cells. The positive expressions
of E-cadherin and β-catenin were observed in 61.8% (105/170) and
52.4% (89/170), respectively, of GC tissue samples, and in 11.4%
(4/35) and 20.0% (7/35), respectively, of adjacent healthy gastric
tissues. Differences in the rates of abnormal E-cadherin and
β-catenin expression between GC tissues and adjacent healthy
gastric tissues were significant (P<0.001; Table II). MMP-9 expression in GC tissues
was additionally predominantly cytoplasmic (Fig. 1G). Greater expression of MMP-9 was
observed in GC tissues compared with adjacent healthy gastric
tissues (P<0.05; Table II;
Fig. 1H). In addition, expression
of E-cadherin was positively associated with LNM and a more
advanced clinical stage (P<0.001; Table I). β-catenin expression correlated
significantly with tumor size, LNM and the clinical stage of GC
tissues (P<0.001; Table I);
however, there was no correlation between β-catenin expression and
other clinicopathological parameters (P>0.05; Table I). Expression of MMP-9 was
positively associated with LNM (P<0.001; Table I); however, there was no
correlation between MMP-9 expression and other clinicopathological
parameters (P>0.05; Table
I).
Associations between STIM1,
E-cadherin, β-catenin and MMP-9 expression in GC tissues
Potential associations between STIM1, E-cadherin and
β-catenin expression patterns in GC were evaluated. Of
STIM1-positive tumors, 78.4% (58/74) were E-cadherin positive and
90.5% (67/74) were positive for β-catenin. Chi-square tests
revealed that STIM1 expression correlated significantly with
abnormal E-cadherin expression (χ2=34.555; P<0.001;
κ=0.447) and with abnormal β-catenin expression
(χ2=45.947; P<0.001; κ=0.486; Table IV), whereas no correlation was
observed between STIM1 and MMP-9 (χ2=1.420; P=0.233;
κ=−0.616; Table IV). Furthermore,
79.8% (71/89) of E-cadherin-positive tumors were additionally
positive for β-catenin, and this association was statistically
significant (P<0.05; Table
V).
| Table IV.STIM1, E-cadherin, β-catenin and
MMP-9 expression in 170 gastric cancer samples. |
Table IV.
STIM1, E-cadherin, β-catenin and
MMP-9 expression in 170 gastric cancer samples.
|
| E-cadherin |
|
| β-cadherin |
|
| MMP-9 |
|
|
|---|
|
|
|
|
|
|
|
|
|
|
|
|---|
| Parameter | Positive | Negative | χ2 | P-value | Positive | Negative | χ2 | P-value | Positive | Negative | χ2 | P-value |
|---|
| STIM1 (+) | 58 (78.4) | 16 (21.6) | 34.555a | <0.001 | 67 (90.5) | 7 (9.5) | 45.947a | <0.001 | 12 (16.2) | 62 (83.8) | 1.420 | 0.233 |
| STIM1 (−) | 31 (32.3) | 65 (67.7) |
|
| 38 (39.6) | 58 (60.4) |
|
| 76 (79.2) | 20 (20.8) |
|
|
| Table V.E-cadherin and β-catenin expression
in 170 gastric cancer samples. |
Table V.
E-cadherin and β-catenin expression
in 170 gastric cancer samples.
|
| β-cadherin |
|
|
|---|
|
|
|
|
|
|---|
| Parameter | Positive | Negative | χ2 | P-value |
|---|
| E-cadherin (+) | 71 (79.8) | 18 (20.2) | 4.92a | 0.03 |
| E-cadherin (−) | 34 (42.0) | 47 (58.0) |
|
|
Association between STIM1 expression
and survival
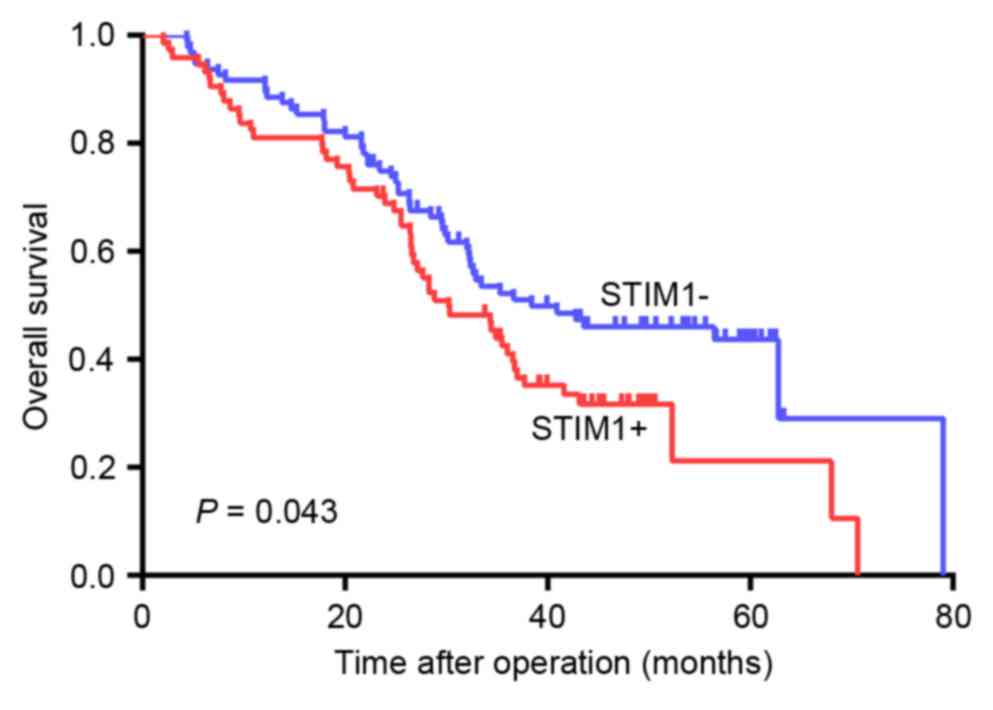
Using Kaplan-Meier analysis, it was demonstrated
that the overall survival rate was significantly reduced in
patients with STIM1-expressing GC tumors compared with patients
with GC tumors without STIM1 expression (P=0.043; Fig. 2). Factors that significantly
correlated with patient survival rate, including STIM1 expression,
LNM and a high TNM stage, were identified by univariate analysis
(Table VI). Cox risk regression
analysis indicated that STIM1 expression and LNM were independent
prognostic factors for GC patients (Table VII).
| Table VI.Univariate analysis of prognostic
factors for gastric carcinoma. |
Table VI.
Univariate analysis of prognostic
factors for gastric carcinoma.
| Characteristic | Succumbed to
disease (104) | Survival rate at 80
months (66) | χ2 | P-value |
|---|
| Sex |
|
Male | 79 (76.0) | 48 (72.7) | 0.224 | 0.636 |
|
Female | 25 (24.0) | 18 (27.3) |
|
|
| Age (years) |
|
|
|
|
|
≤60 | 58 (55.8) | 38 (57.6) | 0.054 | 0.817 |
|
>60 | 46 (44.2) | 28 (42.4) |
|
|
| Tumor location |
|
Cardia | 58 (55.8) | 34 (51.5) | 0.400 | 0.819 |
|
Body | 6 (5.8) | 5 (5.8) |
|
|
|
Antrum | 40 (38.5) | 27 (40.9) |
|
|
| Tumor
differentiation |
|
Poor/undifferentiated | 49 (47.1) | 30 (45.5) | 0.045 | 0.832 |
|
High/moderate | 55 (52.9) | 36 (54.5) |
|
|
| Tumor size |
| <5
cm | 47 (45.2) | 27 (40.9) | 0.301 | 0.583 |
| ≥5
cm | 57 (54.8) | 39 (59.1) |
|
|
| Lymphatic
metastasis |
|
Negative | 15 (14.4) | 49 (74.2) | 61.549b | <0.001 |
|
Positive | 89 (85.6) | 17 (25.8) |
|
|
|
Tumor-node-metastasis stage |
|
I–II | 14 (13.5) | 43 (65.2) | 48.404b | <0.001 |
|
III–IV | 90 (86.5) | 23 (34.8) |
|
|
| STIM1
expression |
|
Positive | 52 (50.0) | 22 (33.3) | 4.563a | 0.033 |
|
Negative | 52 (50.0) | 44 (66.7) |
|
|
| Table VII.Multivariate analysis of prognostic
factors for gastric carcinoma. |
Table VII.
Multivariate analysis of prognostic
factors for gastric carcinoma.
|
|
|
|
|
|
|
| 95.0% CI for
HR |
|---|
|
|
|
|
|
|
|
|
|
|---|
| Parameter | B | SE | Wald | df | Sig. | HR | Lower | Upper |
|---|
| Age | 0.292 | 0.209 | 1.950 | 1 | 0.163 | 1.339 | 0.889 | 2.018 |
| Sex | −0.221 | 0.259 | 0.728 | 1 | 0.394 | 0.802 | 0.483 | 1.331 |
| Tumor location | −0.030 | 0.107 | 0.079 | 1 | 0.778 | 0.970 | 0.786 | 1.197 |
| Tumor
differentiation | 0.047 | 0.208 | 0.050 | 1 | 0.823 | 1.048 | 0.696 | 1.577 |
| Tumor size | 0.017 | 0.211 | 0.006 | 1 | 0.936 | 1.017 | 0.672 | 1.539 |
| Lymphatic
metastasis | 1.699 | 0.328 | 26.797 | 1 | 0.000 | 5.468 | 2.874 | 10.403 |
|
Tumor-node-metastasis | 1.307 | 0.311 | 17.651 | 1 | 0.000 | 3.695 | 2.008 | 6.799 |
| STIM1
expression | 0.095 | 0.286 | 0.111 | 1 | 0.039 | 1.100 | 1.020 | 1.328 |
Discussion
Various studies have demonstrated that STIM1 protein
is involved in adhesion, invasion, metastasis and proliferation of
cancer cells (17,18,26–29).
STIM1 expression has been reported to correlate with lymphatic
invasion in colon adenocarcinomas (30). Ectopic STIM1 overexpression in
colorectal cancer was revealed to significantly associate with
tumor size, depth of invasion and LNM status, and to promote
colorectal cancer cell motility (24). It has been reported that STIM1 is
upregulated during hepatocarcinoma growth (31), and STIM1 has been suggested to be
critical for breast cancer cell migration and metastasis (18). However, certain studies have
demonstrated that STIM1 protein serves an opposing role in various
cancers. For example, in vitro overexpression of STIM1 in
G401 rhabdomyosarcoma cells resulted in morphological alterations
and, ultimately, cell death (32,33).
Suyama et al (34) revealed
that STIM1 has an antimetastatic function. Weidinger et al
(35) reported that patients with
loss-of-function mutations in the STIM1 gene were
immunodeficient and prone to developing virus-associated tumors.
The present study demonstrated that STIM1 was highly expressed in
GC compared with adjacent healthy tissues, and that STIM1
expression was associated with LNM, TNM stage and poor overall
survival rate. Furthermore, LNM was the only independent risk
factor for STIM1 expression in GC patients. The results of the
present study indicated that STIM1 may serve an important role in
the initiation and development of GC, and may contribute to the
diagnosis and treatment of GC as a prognostic marker. These results
therefore provide novel information on the function of STIM1 in GC
progression.
The molecular mechanisms underlying the effect of
STIM1 on the process of EMT in GC remain to be fully elucidated. A
previous study by Hu et al (19) suggested that STIM1 may be involved
in EMT, which is a critical step in immune evasion and metastasis
of tumor cells. In addition, STIM1 overexpression has been reported
to induce EMT in colorectal cancer cells, whereas STIM1
silencing had the opposite effect (20). Casas-Rua et al (21) demonstrated that STIM1
phosphorylation at extracellular signal-regulated kinase 1/2 target
sites mediates EMT triggered by epidermal growth factor in Ishikawa
cells. However, the role of STIM1 in cancer cell progression and
metastasis and its association with EMT in GC remain to be
investigated. In the present study, the association between the
expression of STIM1, E-cadherin, β-catenin and MMP-9 proteins in GC
tissues was analyzed by immunohistochemical staining. The results
of the present study revealed that STIM1 overexpression in GC
tissues correlated significantly with abnormal E-cadherin and
β-catenin expression in the cytoplasm and nucleus, whereas no
association was observed between STIM1 and MMP-9 expression.
Therefore, STIM1 may increase GC motility and invasiveness by
promoting EMT via E-cadherin and β-cadherin; however, MMP-9 does
not appear to be involved in this process.
In conclusion, the results of the present study
demonstrated that STIM1 is significantly upregulated in GC and that
STIM1 overexpression is associated with a poor prognosis in GC
patients with LNM and an advanced TNM stage. Therefore, STIM1 may
be a useful prognostic marker for GC.
References
|
1
|
Ferlay J, Soerjomataram I, Dikshit R, Eser
S, Mathers C, Rebelo M, Parkin DM, Forman D and Bray F: Cancer
incidence and mortality worldwide: Sources, methods and major
patterns in GLOBOCAN 2012. Int J Cancer. 136:E359–E386. 2015.
View Article : Google Scholar : PubMed/NCBI
|
|
2
|
Suzuki R, Yamamoto E, Nojima M, Maruyama
R, Yamano HO, Yoshikawa K, Kimura T, Harada T, Ashida M, Niinuma T,
et al: Aberrant methylation of microRNA-34b/c is a predictive
marker of metachronous gastric cancer risk. J Gastroenterol.
49:1135–1144. 2014. View Article : Google Scholar : PubMed/NCBI
|
|
3
|
Bria E, De Manzoni G, Beghelli S,
Tomezzoli A, Barbi S, Di Gregorio C, Scardoni M, Amato E, Frizziero
M, Sperduti I, et al: A clinical-biological risk stratification
model for resected gastric cancer: Prognostic impact of Her2, Fhit,
and APC expression status. Ann Oncol. 24:693–701. 2013. View Article : Google Scholar : PubMed/NCBI
|
|
4
|
Kraljevic Pavelic S, Sedic M, Bosnjak H,
Spaventi S and Pavelic K: Metastasis: New perspectives on an old
problem. Mol Cancer. 10:222011. View Article : Google Scholar : PubMed/NCBI
|
|
5
|
Thiery JP, Acloque H, Huang RY and Nieto
MA: Epithelial-mesenchymal transitions in development and disease.
Cell. 139:871–890. 2009. View Article : Google Scholar : PubMed/NCBI
|
|
6
|
Thiery JP and Sleeman JP: Complex networks
orchestrate epithelial-mesenchymal transitions. Nat Rev Mol Cell
Biol. 7:131–142. 2006. View
Article : Google Scholar : PubMed/NCBI
|
|
7
|
Savagner P, Boyer B, Valles AM, Jouanneau
J and Thiery JP: Modulations of the epithelial phenotype during
embryogenesis and cancer progression. Cancer Treat Res. 71:229–249.
1994. View Article : Google Scholar : PubMed/NCBI
|
|
8
|
Tam WL and Weinberg RA: The epigenetics of
epithelial-mesenchymal plasticity in cancer. Nat Med. 19:1438–1449.
2013. View
Article : Google Scholar : PubMed/NCBI
|
|
9
|
Liu J, Chen X, Ward T, Pegram M and Shen
K: Combined niclosamide with cisplatin inhibits
epithelial-mesenchymal transition and tumor growth in
cisplatin-resistant triple-negative breast cancer. Tumour Biol.
37:9825–9835. 2016. View Article : Google Scholar : PubMed/NCBI
|
|
10
|
Luo M, Hou L, Li J, Shao S, Huang S, Meng
D, Liu L, Feng L, Xia P, Qin T and Zhao X: VEGF/NRP-1axis promotes
progression of breast cancer via enhancement of
epithelial-mesenchymal transition and activation of NF-κB and
β-catenin. Cancer Lett. 373:1–11. 2016. View Article : Google Scholar : PubMed/NCBI
|
|
11
|
Ma J, Zhao J, Lu J, Wang P, Feng H, Zong
Y, Ou B, Zheng M and Lu A: Cadherin-12 enhances proliferation in
colorectal cancer cells and increases progression by promoting EMT.
Tumour Biol. 37:9077–9088. 2016. View Article : Google Scholar : PubMed/NCBI
|
|
12
|
Bruyere F, Namdarian B, Corcoran NM,
Pedersen J, Ockrim J, Voelzke BB, Mete U, Costello AJ and Hovens
CM: Snail expression is an independent predictor of tumor
recurrence in superficial bladder cancers. Urol Oncol. 28:591–596.
2010. View Article : Google Scholar : PubMed/NCBI
|
|
13
|
Chiu KY, Wu CC, Chia CH, Hsu SL and Tzeng
YM: Inhibition of growth, migration and invasion of human bladder
cancer cells by antrocin, a sesquiterpene lactone isolated from
Antrodia cinnamomea, and its molecular mechanisms. Cancer Lett.
373:174–184. 2016. View Article : Google Scholar : PubMed/NCBI
|
|
14
|
Lee SO, Yang X, Duan S, Tsai Y, Strojny
LR, Keng P and Chen Y: IL-6 promotes growth and
epithelial-mesenchymal transition of CD133+ cells of non-small cell
lung cancer. Oncotarget. 7:6626–6638. 2016.PubMed/NCBI
|
|
15
|
Huang L, Wu RL and Xu AM:
Epithelial-mesenchymal transition in gastric cancer. Am J Transl
Res. 7:2141–2158. 2015.PubMed/NCBI
|
|
16
|
Parekh AB: Store-operated CRAC channels:
Function in health and disease. Nat Rev Drug Discov. 9:399–410.
2010. View
Article : Google Scholar : PubMed/NCBI
|
|
17
|
Chen YF, Chiu WT, Chen YT, Lin PY, Huang
HJ, Chou CY, Chang HC, Tang MJ and Shen MR: Calcium store sensor
stromal-interaction molecule 1-dependent signaling plays an
important role in cervical cancer growth, migration, and
angiogenesis. Proc Natl Acad Sci USA. 108:15225–15230. 2011.
View Article : Google Scholar : PubMed/NCBI
|
|
18
|
Yang S, Zhang JJ and Huang XY: Orai1 and
STIM1 are critical for breast tumor cell migration and metastasis.
Cancer Cell. 15:124–134. 2009. View Article : Google Scholar : PubMed/NCBI
|
|
19
|
Hu J, Qin K, Zhang Y, Gong J, Li N, Lv D,
Xiang R and Tan X: Downregulation of transcription factor Oct4
induces an epithelial-to-mesenchymal transition via enhancement of
Ca2+ influx in breast cancer cells. Biochem Biophys Res Commun.
411:786–791. 2011. View Article : Google Scholar : PubMed/NCBI
|
|
20
|
Zhang Z, Liu X, Feng B, Liu N, Wu Q, Han
Y, Nie Y, Wu K, Shi Y and Fan D: STIM1, a direct target of
microRNA-185, promotes tumor metastasis and is associated with poor
prognosis in colorectal cancer. Oncogene. 34:4808–4820. 2015.
View Article : Google Scholar : PubMed/NCBI
|
|
21
|
Casas-Rua V, Tomas-Martin P,
Lopez-Guerrero AM, Alvarez IS, Pozo-Guisado E and Martin-Romero FJ:
STIM1 phosphorylation triggered by epidermal growth factor mediates
cell migration. Biochim Biophys Acta. 1853:233–243. 2015.
View Article : Google Scholar : PubMed/NCBI
|
|
22
|
Edge S, Byrd DR, Compton CC, Fritz AG,
Greene FL and Trotti A: AJCC Cancer Staging Handbook. Chicago:
Springer-Verlag New York; 2010
|
|
23
|
World Health Organization Classification
of Tumours: Pathology and genetics of tumours of the digestive
system. Lyon: IARC Press; 2000
|
|
24
|
Wang JY, Sun J, Huang MY, Wang YS, Hou MF,
Sun Y, He H, Krishna N, Chiu SJ, Lin S, et al: STIM1 overexpression
promotes colorectal cancer progression, cell motility and COX-2
expression. Oncogene. 34:4358–4367. 2015. View Article : Google Scholar : PubMed/NCBI
|
|
25
|
Chaw SY, Majeed AA, Dalley AJ, Chan A,
Stein S and Farah CS: Epithelial to mesenchymal transition (EMT)
biomarkers-E-cadherin, beta-catenin, APC and Vimentin-in oral
squamous cell carcinogenesis and transformation. Oral Oncol.
48:997–1006. 2012. View Article : Google Scholar : PubMed/NCBI
|
|
26
|
Ouadid-Ahidouch H, Dhennin-Duthille I,
Gautier M, Sevestre H and Ahidouch A: TRP channels: Diagnostic
markers and therapeutic targets for breast cancer? Trends Mol Med.
19:117–124. 2013. View Article : Google Scholar : PubMed/NCBI
|
|
27
|
Prevarskaya N, Skryma R and Shuba Y:
Calcium in tumour metastasis: New roles for known actors. Nat Rev
Cancer. 11:609–618. 2011. View
Article : Google Scholar : PubMed/NCBI
|
|
28
|
Bergmeier W, Weidinger C, Zee I and Feske
S: Emerging roles of store-operated Ca2+ entry through
STIM and ORAI proteins in immunity, hemostasis and cancer. Channels
(Austin). 7:379–391. 2013. View Article : Google Scholar : PubMed/NCBI
|
|
29
|
Liu H, Hughes JD, Rollins S, Chen B and
Perkins E: Calcium entry via ORAI1 regulates glioblastoma cell
proliferation and apoptosis. Exp Mol Pathol. 91:753–760. 2011.
View Article : Google Scholar : PubMed/NCBI
|
|
30
|
Wong HS and Chang WC: Correlation of
clinical features and genetic profiles of stromal interaction
molecule 1 (STIM1) in colorectal cancers. Oncotarget.
6:42169–42182. 2015.PubMed/NCBI
|
|
31
|
Li Y, Guo B, Xie Q, Ye D, Zhang D, Zhu Y,
Chen H and Zhu B: STIM1 Mediates Hypoxia-Driven
Hepatocarcinogenesis via Interaction with HIF-1. Cell Rep.
12:388–395. 2015. View Article : Google Scholar : PubMed/NCBI
|
|
32
|
Sabbioni S, Barbanti-Brodano G, Croce CM
and Negrini M: GOK: A gene at 11p15 involved in rhabdomyosarcoma
and rhabdoid tumor development. Cancer Res. 57:4493–4497.
1997.PubMed/NCBI
|
|
33
|
Sabbioni S, Veronese A, Trubia M,
Taramelli R, Barbanti-Brodano G, Croce CM and Negrini M: Exon
structure and promoter identification of STIM1 (alias GOK), a human
gene causing growth arrest of the human tumor cell lines G401 and
RD. Cytogenet Cell Genet. 86:214–218. 1999. View Article : Google Scholar : PubMed/NCBI
|
|
34
|
Suyama E, Wadhwa R, Kaur K, Miyagishi M,
Kaul SC, Kawasaki H and Taira K: Identification of
metastasis-related genes in a mouse model using a library of
randomized ribozymes. J Biol Chem. 279:38083–38086. 2004.
View Article : Google Scholar : PubMed/NCBI
|
|
35
|
Weidinger C, Shaw PJ and Feske S: STIM1
and STIM2-mediated Ca(2+) influx regulates antitumour immunity by
CD8(+) T cells. EMBO Mol Med. 5:1311–1321. 2013. View Article : Google Scholar : PubMed/NCBI
|