Introduction
Gastric cancer affects ~1 million people every year,
and 70–85% of them will die within 5 years following diagnosis
(1). Gastric adenocarcinoma is one
of the leading causes of cancer related death worldwide, even
though there is a rapid development of medical technology, with a
higher incidence in Asian countries, including China (2). A high-salt diet, infectious agents
and smoking are the environmental risk factors for gastric
adenocarcinoma (3). Although
resection could be curative, the prognosis of gastric
adenocarcinoma patients at advanced stage is still very poor
following radical resection and surgical treatment (4,5).
Therefore, it is urgently needed to identify the prognostic and
predictive biomarkers or models to develop the most effect methods
to improve the clinical outcome in gastric adenocarcinoma.
The contribution of genetic alterations to the
initiation and development of gastric cancer have been reported in
many studies. For example, TGR5 is overexpressed in most gastric
intestinal-type adenocarcinomas (6). The upregulation of CD24 is correlated
with venous invasion, lymphatic invasion and lymph node metastasis
of gastric carcinoma (7).
Expression levels of ABCB1, ABCG2 and CD133 are correlated with the
differentiation degree of gastric cancer (8). The connections between genetic
variation and the prognosis status of gastric adenocarcinoma
patients have also been explored, and the overexpression of HER2
and EGFR were identified as the prognostic factors in gastric
cancer (9). HER3 expression was
associated with the decreased survival of gastric cancer, acting as
a prognosis factor for patients at the advanced stage (10). Tumoral FOXP3 expression in gastric
adenocarcinomas is reported to be related with the favorable
clinicopathological variables (11). Although these studies have
identified some prognosis genes in stomach cancer, the demand for
more prognostic biomarkers remains to be met for developing
targeted therapies.
During the development of cancers, certain genetic
changes will lead to the functional abnormality of related
pathways, which may influence other pathways and result in a
progression of cancer. Cross talk genes refer to the genes that
connecting two or more pathways, in which the abnormality of one
pathway can be passed to another because of these genes. The cross
talk between EPAS-1/HIF-2α and the PXR signaling pathway were
reported as the regulatory factor for multi-drug resistance of
stomach cancer cell (12). The
SKP2 gene was demonstrated to regulate cancer progression by
participating in the cross talk with other major cancer signaling
pathways (13,14). Moreover, the STAT3 gene is reported
to interact with the SKP2/p27/p21 pathway to regulate the invasion
and motility of gastric cancer cells (15).
To explore potential novel biomarkers for the
treatment and prognosis of gastric adenocarcinoma, microarray data
of gastric adenocarcinomas were screened and downloaded from GEO
and TCGA databases, and the cross talk between genes was analyzed
in disease-related pathways.
Materials and methods
Microarray data
Gene expression microarray data (GSE13861) were
downloaded from GEO (Gene Expression Omnibus) database (https://www.ncbi.nlm.nih.gov/geo/), including 65
primary gastric adenocarcinomas samples, 16 interstitial gastric
adenocarcinoma samples and 19 surrounding normal fresh frozen
tissues. Gene annotation data were also downloaded from Illumina
HumanWG-6 v3.0 expression beadchip (https://www.ncbi.nlm.nih.gov/geo/query/acc.cgi?acc=GPL6884).
Only gastric adenocarcinomas samples and surrounding normal samples
were analyzed in following analysis.
Data normalization
Microarray data were transformed into gene symbols,
and the average expression values were used as the expression
levels of genes. The Z-score method (16) was applied for data normalization
and the expression variations of genes in cancer samples were also
extended by this method.
Differentially expressed genes
screening
The BioConductor version 1.6 (R-2.1) Limma package
(17) (http://www.bioconductor.org/packages/release/bioc/html/limma.html)
was utilized for the screening of differentially expressed genes
(DEGs) between gastric adenocarcinomas samples and surrounding
normal samples. False discovery rate (FDR) <0.01 and
|logfc|>1.2 were the cut-off criteria.
Protein-protein interaction
network
The protein-protein interaction (PPI) pairs were
downloaded from BioGrid (http://thebiogrid.org/) and HPRD (http://www.hprd.org/) database, which were then
overlapped to obtain the whole human PPI network. Next, the
proteins, which are correlated with at least 3 DEGs in the human
PPI network were screened, and these proteins and their
interactions were visualized in the PPI network of DEGs.
Topological analysis
The topological properties of both the human and DEG
PPI network were analyzed using the Cytoscape software version
3.4.0 (http://www.cytoscape.org/) (18), including nodes' degree, average
shortest path, network centrality, eccentricity and topological
factors. The topological property differences between these two PPI
network were compared.
Key gene selection in PPI interaction
network
Key genes among the DEGs were selected according to
the deviation score and degree in the PPI network. To calculate the
deviation score, the expression interval I (average expression
value + standard deviation (SD), average expression value-SD) of
each gene was firstly defined according to their expressions in
normal samples. If the expression of a gene is beyond the interval
of I, this gene will be considered to be key genes involved in
gastric adenocarcinomas. The extra expression value of the gene
will be next used for the calculation of deviation score. The
formula for the deviation computing is listed as below:
W=score×degreescore=∑1n(di–d)2
di represents the gene expression value
of sample i, and, if di is larger than average
expression value + SD, then the value of d will be recorded as
average expression value + SD; if di is lower than
average expression value-SD, then, the value of d will be recorded
as average expression value-SD. The score was normalized to the
range of 0–10 by using distance. Degree was normalized by using the
log2 value. Finally, W was calculated to get the rank of genes.
Genes with higher deviation score and node degree in
the PPI network have much more important roles in the gastric
adenocarcinoma samples, and they will be recognized as the key
genes. In this analysis, the genes with W rank of the top 100 and
last 100 will be selected at the key genes.
Pathway enrichment and hierarchical clustering. The
key genes with the top 50 W scores were conducted KEGG pathway
enrichment using DAVID (https://david.ncifcrf.gov/) (19). The KEGG pathway is a collection of
manually drawn pathway maps representing data regarding the
molecular interaction and reaction networks, including metabolism,
genetic information processing, environmental information
processing, cellular processes, organismal systems, human diseases
and drug development (www.genome.jp/kegg/pathway.html). The FISHER
hypergeometric distribution test (20) was applied, P<0.05 was the
threshold. The significant pathways were then performed
hierarchical clustering analysis, the changes of pathways (the
pathscore) in every sample was presented by gene expression in the
pathways. The pathscore was computed using the following
formula.
pathscore=log∑imω(di–di¯)2∑jnω(dj–d¯j)2
m represents the upregulated genes and n represents
the downregulated genes in pathway p, while represents the average
expression level of upregulated gene i or down-regulated gene j in
normal samples. The deviation of pathway in cancer samples was
calculated using Euclidean Distance, pathscore is the log value of
pathway deviation. Pathscores larger than 0 represent the
upregulation of the pathway, while the lower than 0 represents the
downregulation of the pathway. The hierarchical clustering of
pathways was conducted using the correlation center method, as
previously described (21).
Pathway correlation analysis and identification of
cross talk genes. The correlations between pathways were calculated
using the Spearman's rank correlation analysis, and the pathways
that were positively connected and negatively connected were
collected separately. Following that, the cross talk genes between
connected pathways were identified.
Prognosis gene screening. The cross talk genes among
connected pathways were used for the construction of prognosis
model via the Random Forests algorithm. For the testing of the
prognosis model, all samples were divided into 10 parts, in which
nine parts of samples were used as the training set, and the left
one part of samples was used for the validation set of the model.
After 10 times' testing and validation, the ROC (receiver operating
characteristic) curve was drawn to evaluate the ability of
classification and the robust of the prognosis model. The
precision, recall rate and F1-score were calculated to assessed the
accuracy of the model. The F1 score was computed using the
following formula: F1=2x (precision × recall)/(precision +
recall).
Prognosis gene validation in TCGA database. The
expression profiles of 287 gastric adenocarcinoma samples, along
with the clinical data were downloaded from the TCGA database
(tcga-data.nci.nih.gov) for the
validation of the prognosis model. The samples were considered as
high risk if at least one cross talk gene was differentially
expressed, whereas the samples with no differentially expressed
cross talk genes were considered as low risk. Finally, the
robustness and sensitivity of the cross talk genes were tested by
comparing the survival curves of the high-risk and low-risk gastric
adenocarcinoma samples.
Results
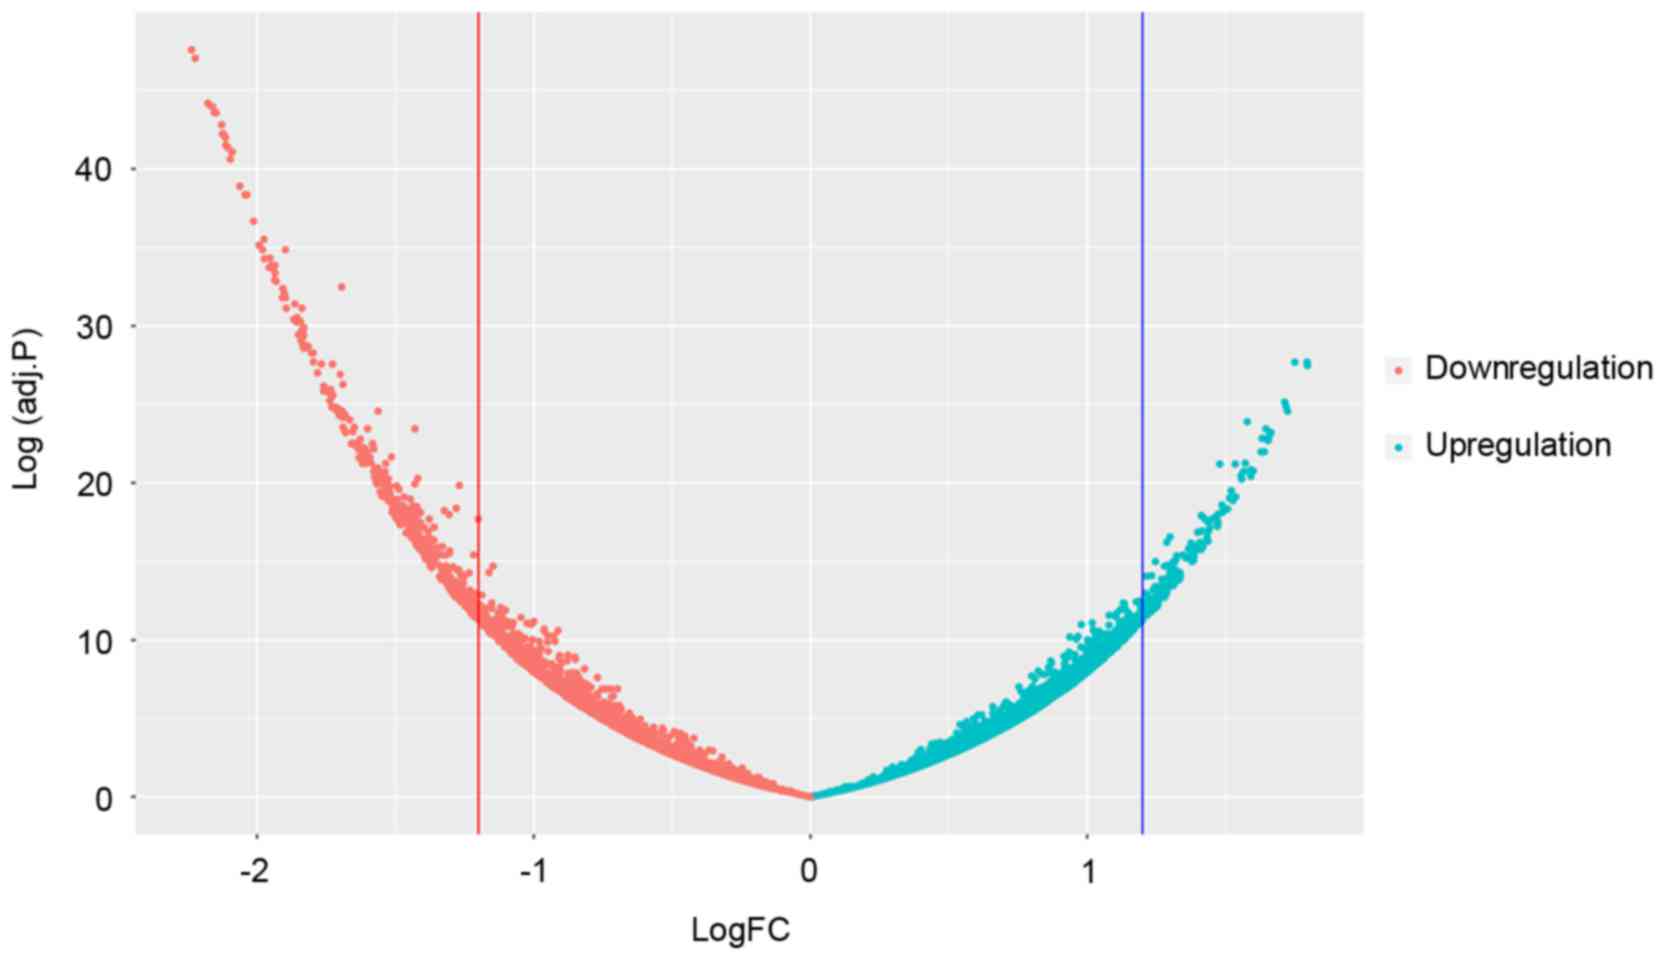
Differentially expressed genes
A total of 635 DEGs, including 432 downregulated and
203 upregulated ones were screened in gastric adenocarcinomas
samples comparing to surrounding normal samples. The distribution
of P-values and fold change was presented in Fig. 1.
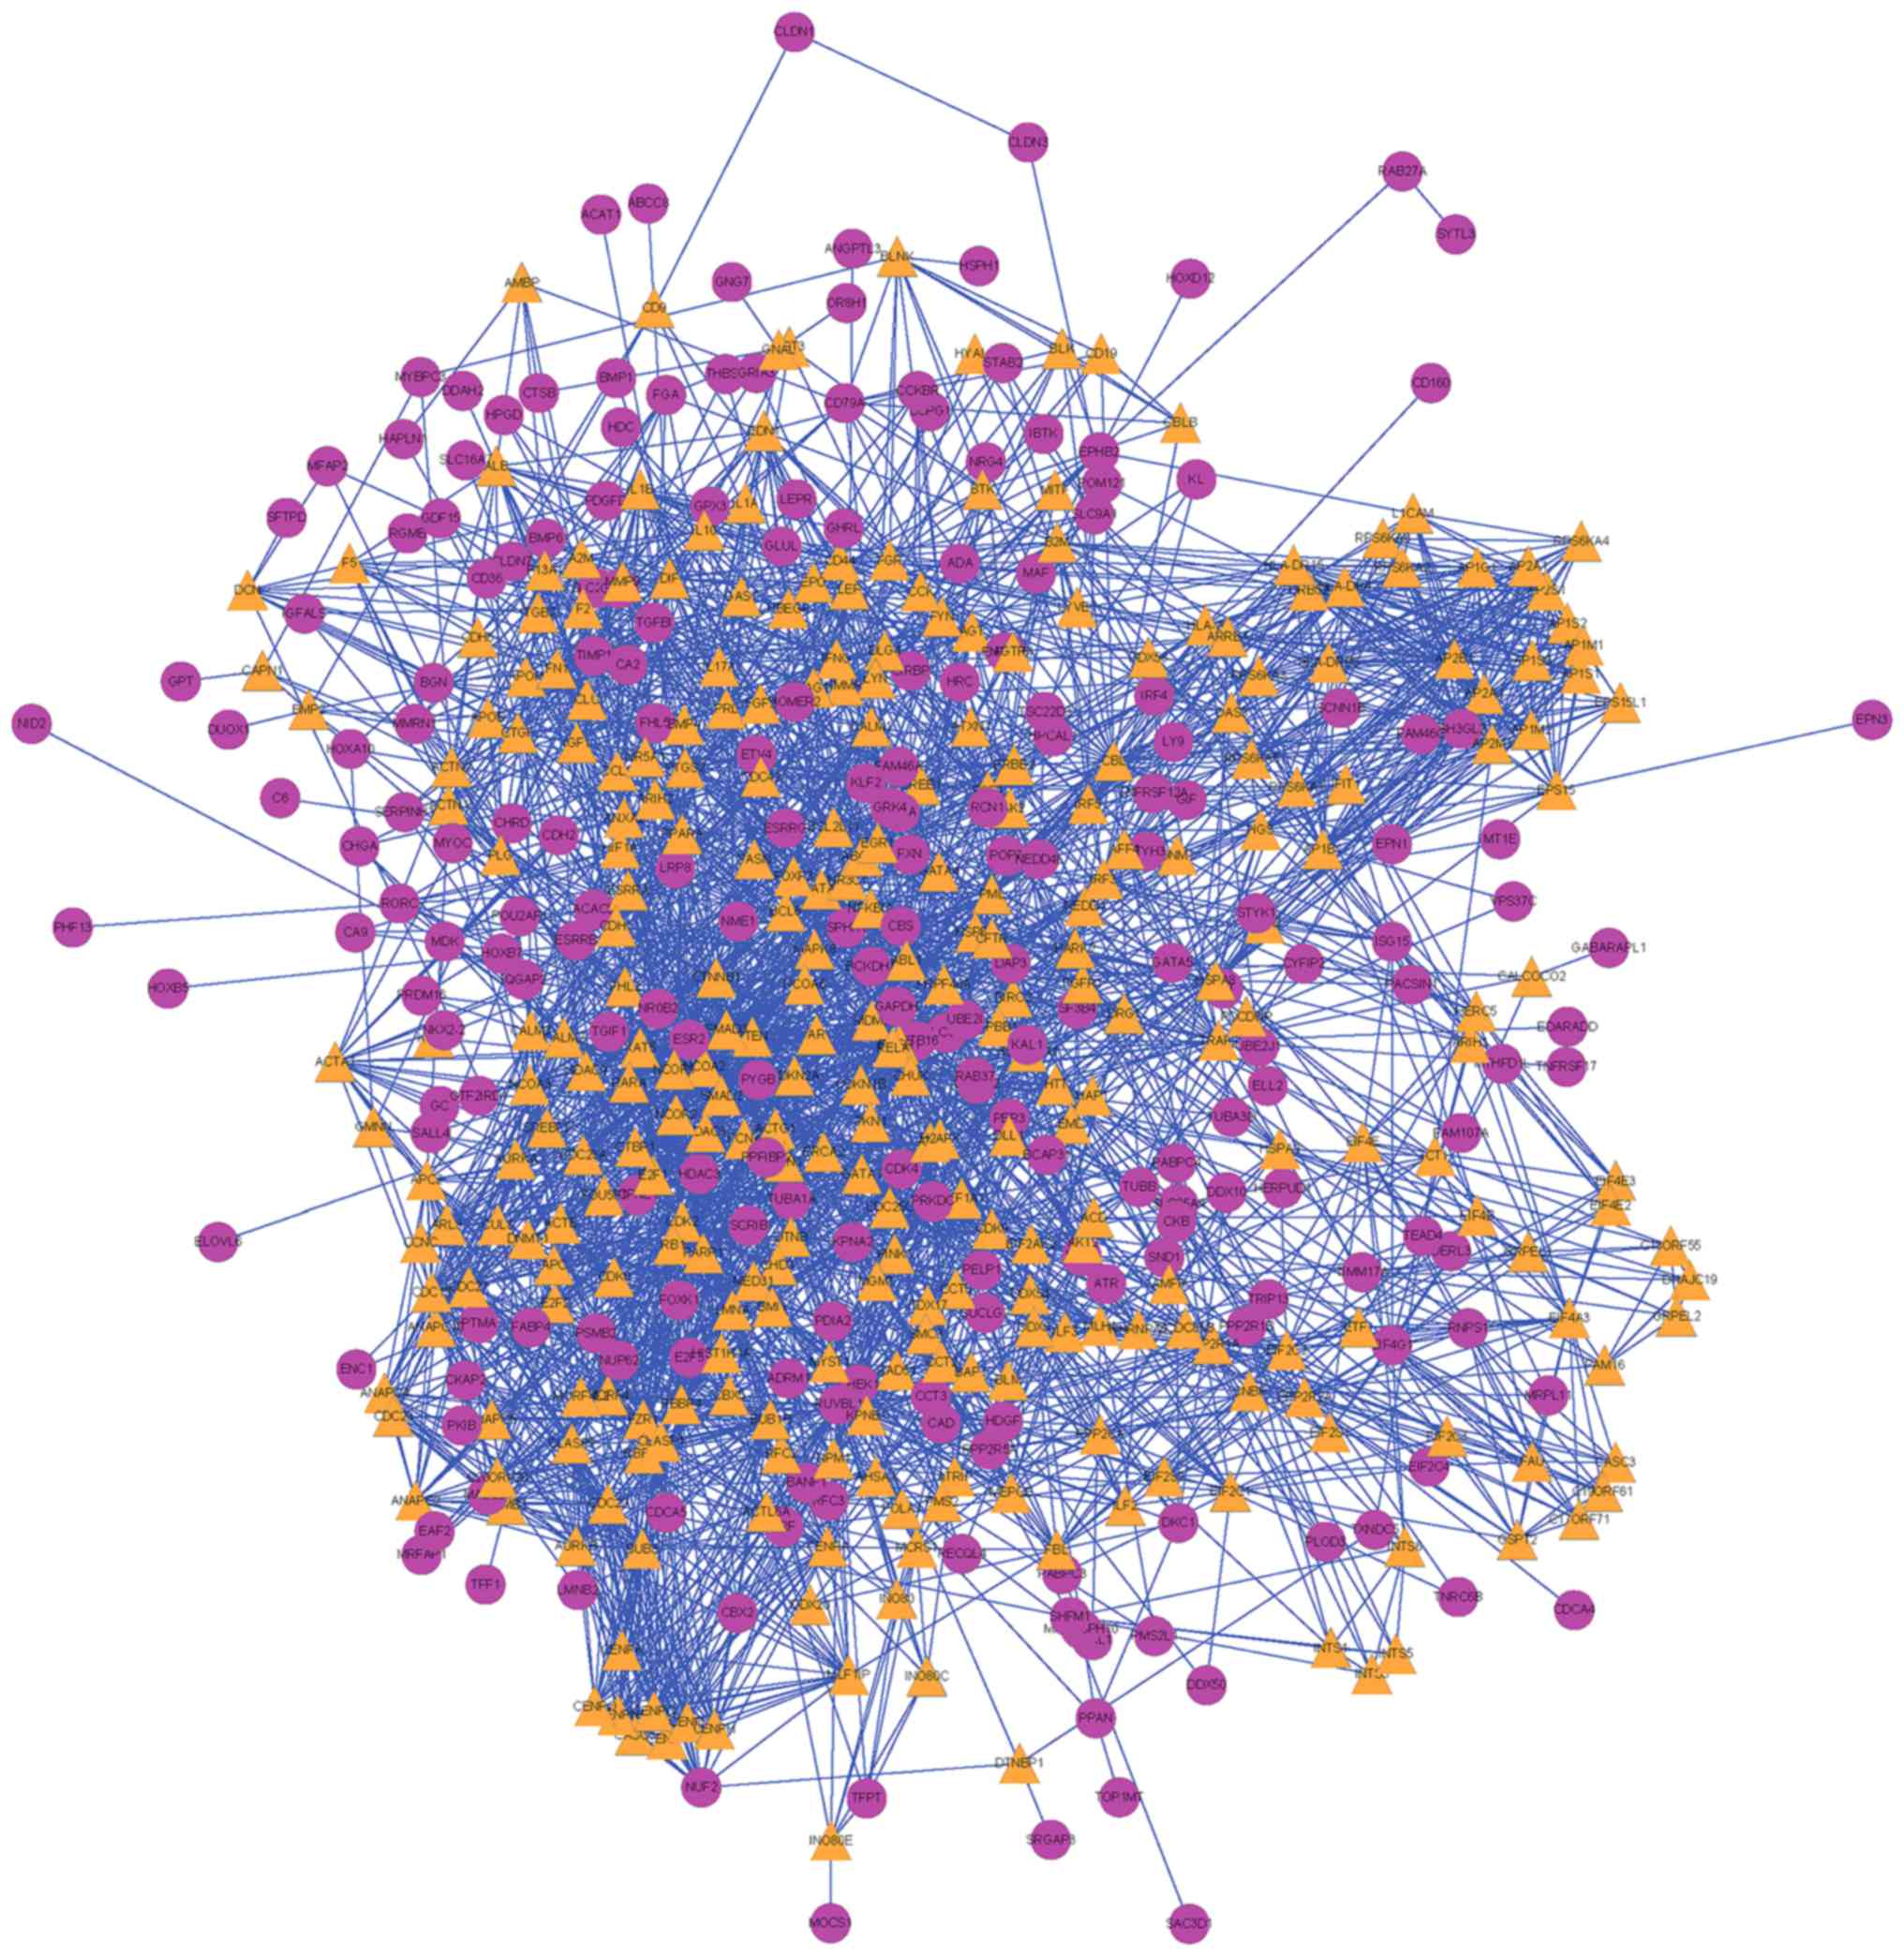
Protein-protein interaction
network
The human PPI network was composed of 14,553
proteins and 662,360 interacting pairs, and, in the PPI network of
DEGs there were 590 nodes (DEGs) and 4,299 lines (interactions)
(Fig. 2).
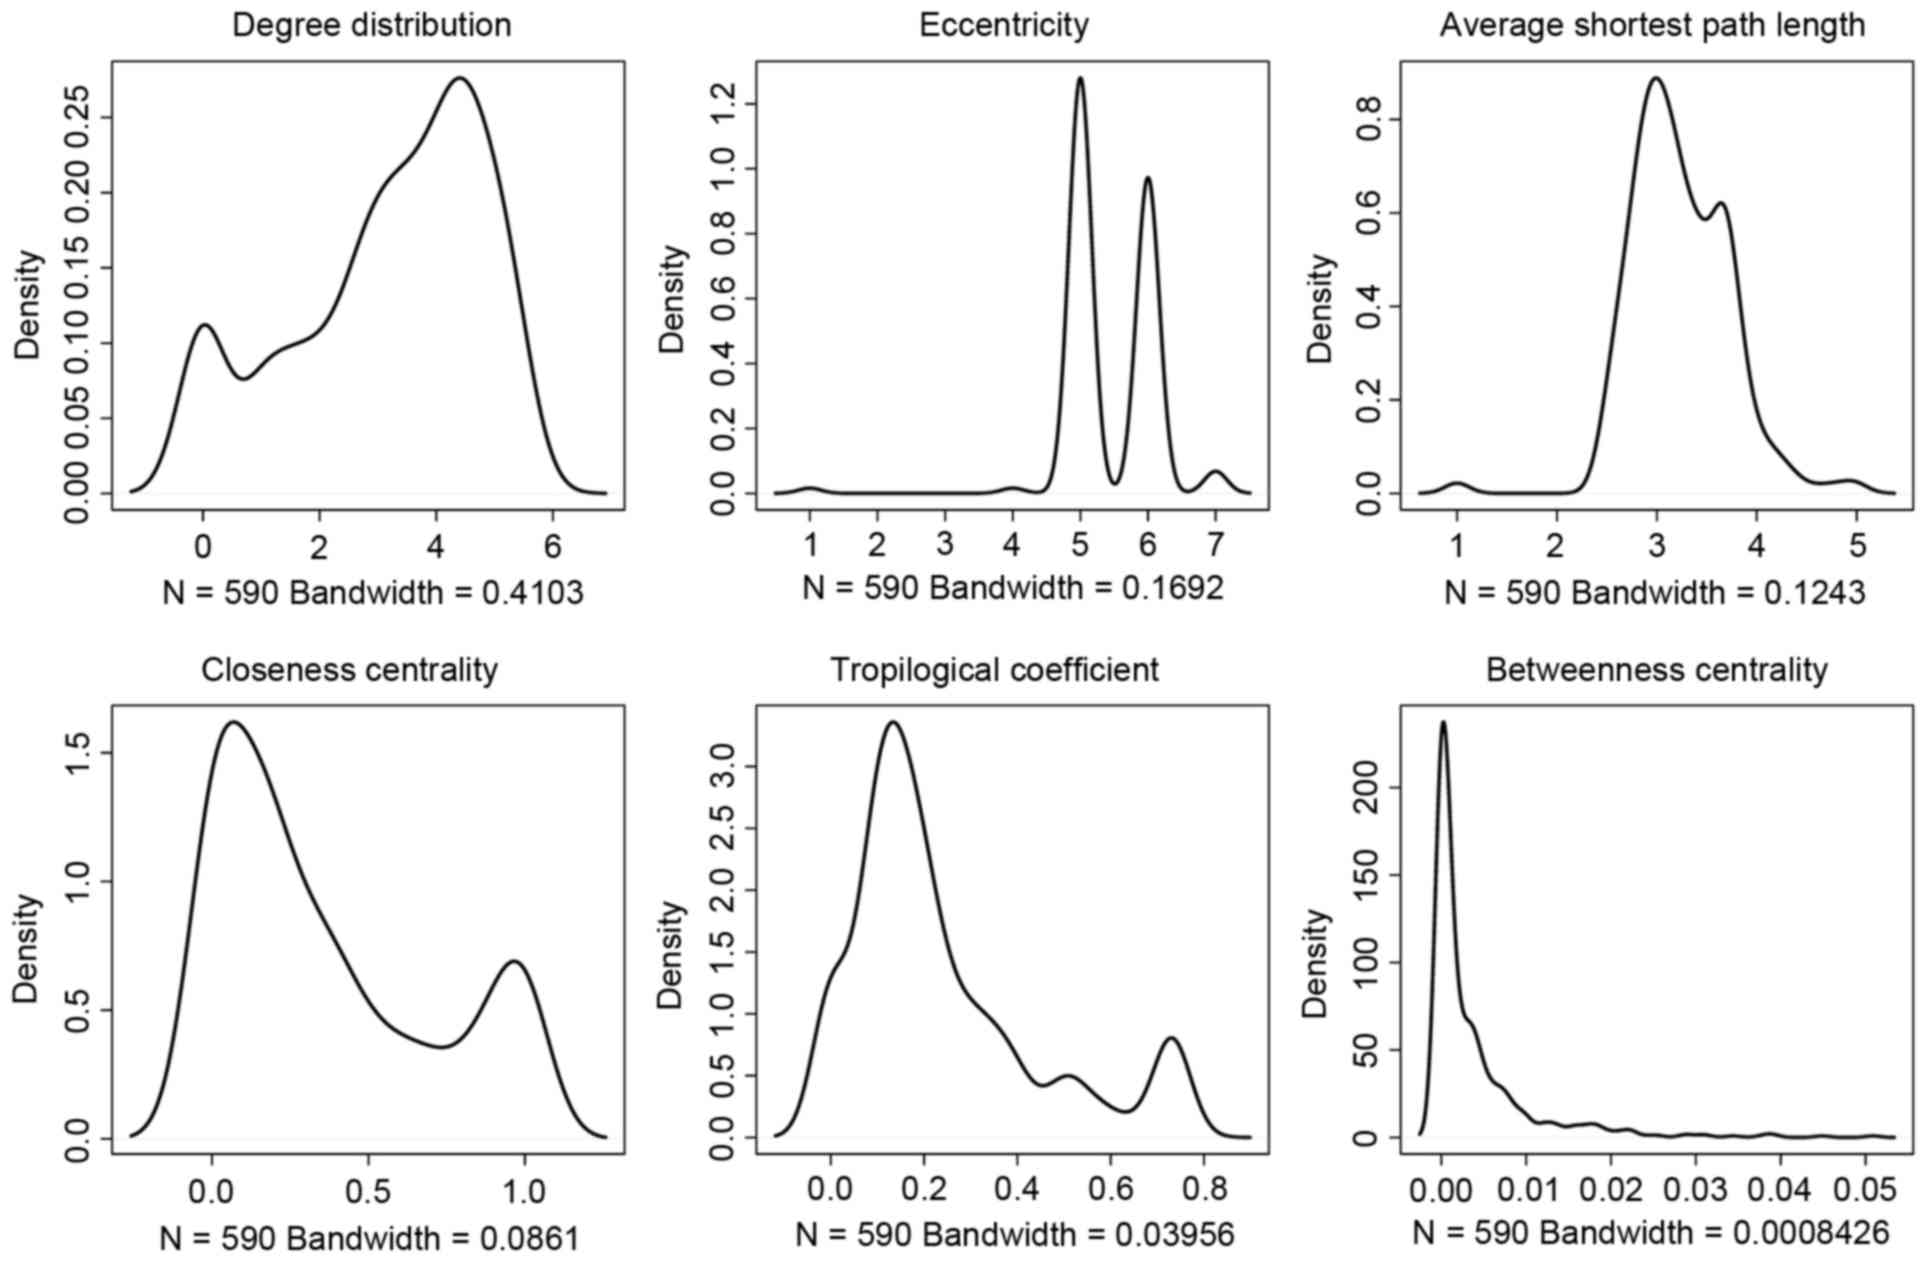
Topological properties of PPI
network
The distribution of node degree in the PPI network
is presented in Fig. 3. It was
observed that ‘4’ was the most common node degree. The curve of
average shortest path, network centrality, eccentricity and
topological coefficient presented >1 peak, indicating that there
are multiple functional modules in the PPI network.
The topological properties of the human PPI network
and DEG PPI network were compared (Table I), it is indicated that DEGs had a
lower degree (3.86 vs. 7.01), eccentricity (5.43 vs. 6.511) and
betweenness centrality (0.0038 vs. 0.0049), longer average shortest
path length (3.23 vs. 2.97) and topological coefficient (0.238 vs.
0.17), as well as equal closeness centrality (0.357 vs. 0.35)
compared to the normal human genes. All these changes suggested
that in the PPI network, i) the contribution of genes became lower;
ii) the specificity of the network was increased; iii) the signal
conducting power among genes became weak.
 | Table I.Topological properties comparison of
DEG PPI network and human PPI net-work. |
Table I.
Topological properties comparison of
DEG PPI network and human PPI net-work.
| Features | DEG PPI
network | Human PPI
network |
|---|
| Degree | 3.8600 |
7.0100 |
| Eccentricity | 5.4300 |
6.5100 |
| Average shortest
path length | 3.2300 | 2.970 |
| Closeness
centrality | 0.3600 |
0.3500 |
| Topological
coefficient | 0.2400 |
0.1700 |
| Betweenness
centrality | 0.0038 |
0.0049 |
Key genes and the enriched
pathways
In all, by calculating the deviation score and the
log2 transformation of the degree, 200 key genes were obtained.
These genes had significant expression deviation from normal
samples, while possessed higher degrees in the PPI network.
Pathway enrichment analysis reported six upregulated
pathways and six downregulated pathways, which had no crossovers.
The significant pathways were the cancer, cell cycle, cell
apoptosis, immunity and metabolism-related pathways, suggesting the
underlying mechanism of the initiation and progression of gastric
adenocarcinoma. The disorder of cell cycle may contribute the
development of cancer and the abnormality of metabolism may be
involved in the metastasis of cancer cells, disease recurrence and
apoptosis escape.
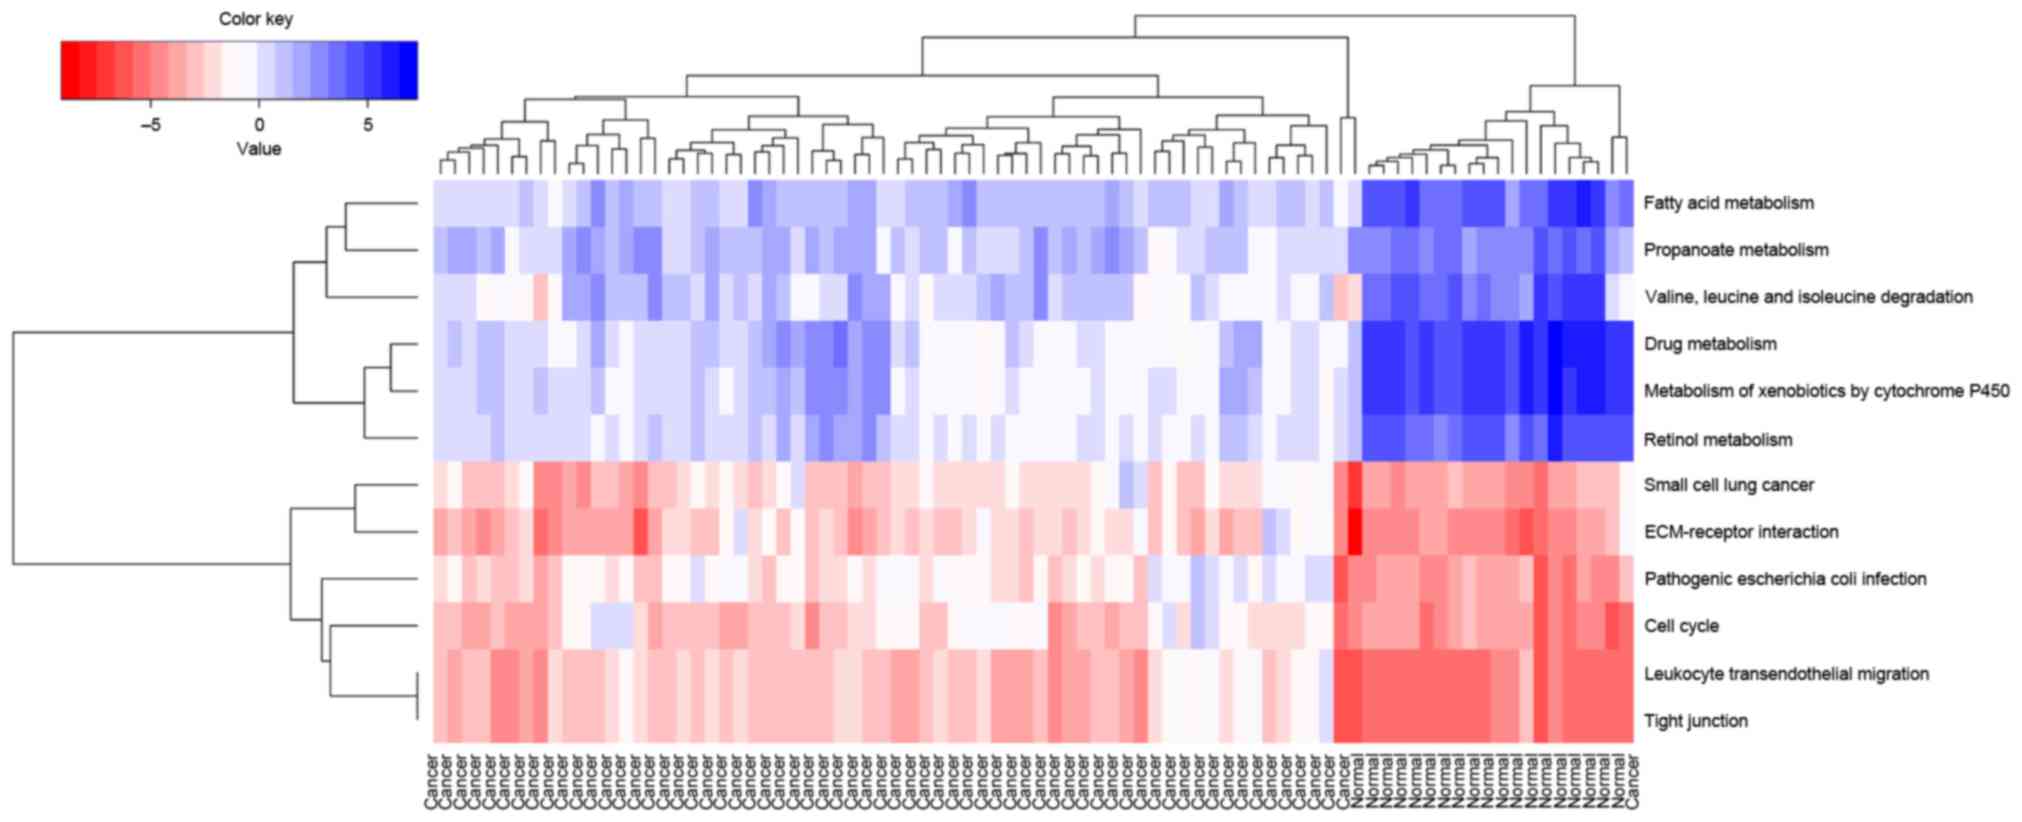
Hierarchy analysis discovered that the pathscore of
the 12 significant pathways could distinguish cancer samples from
normal samples. In addition, it is observed that the deviations of
each pathways in cancer samples and normal samples shared similar
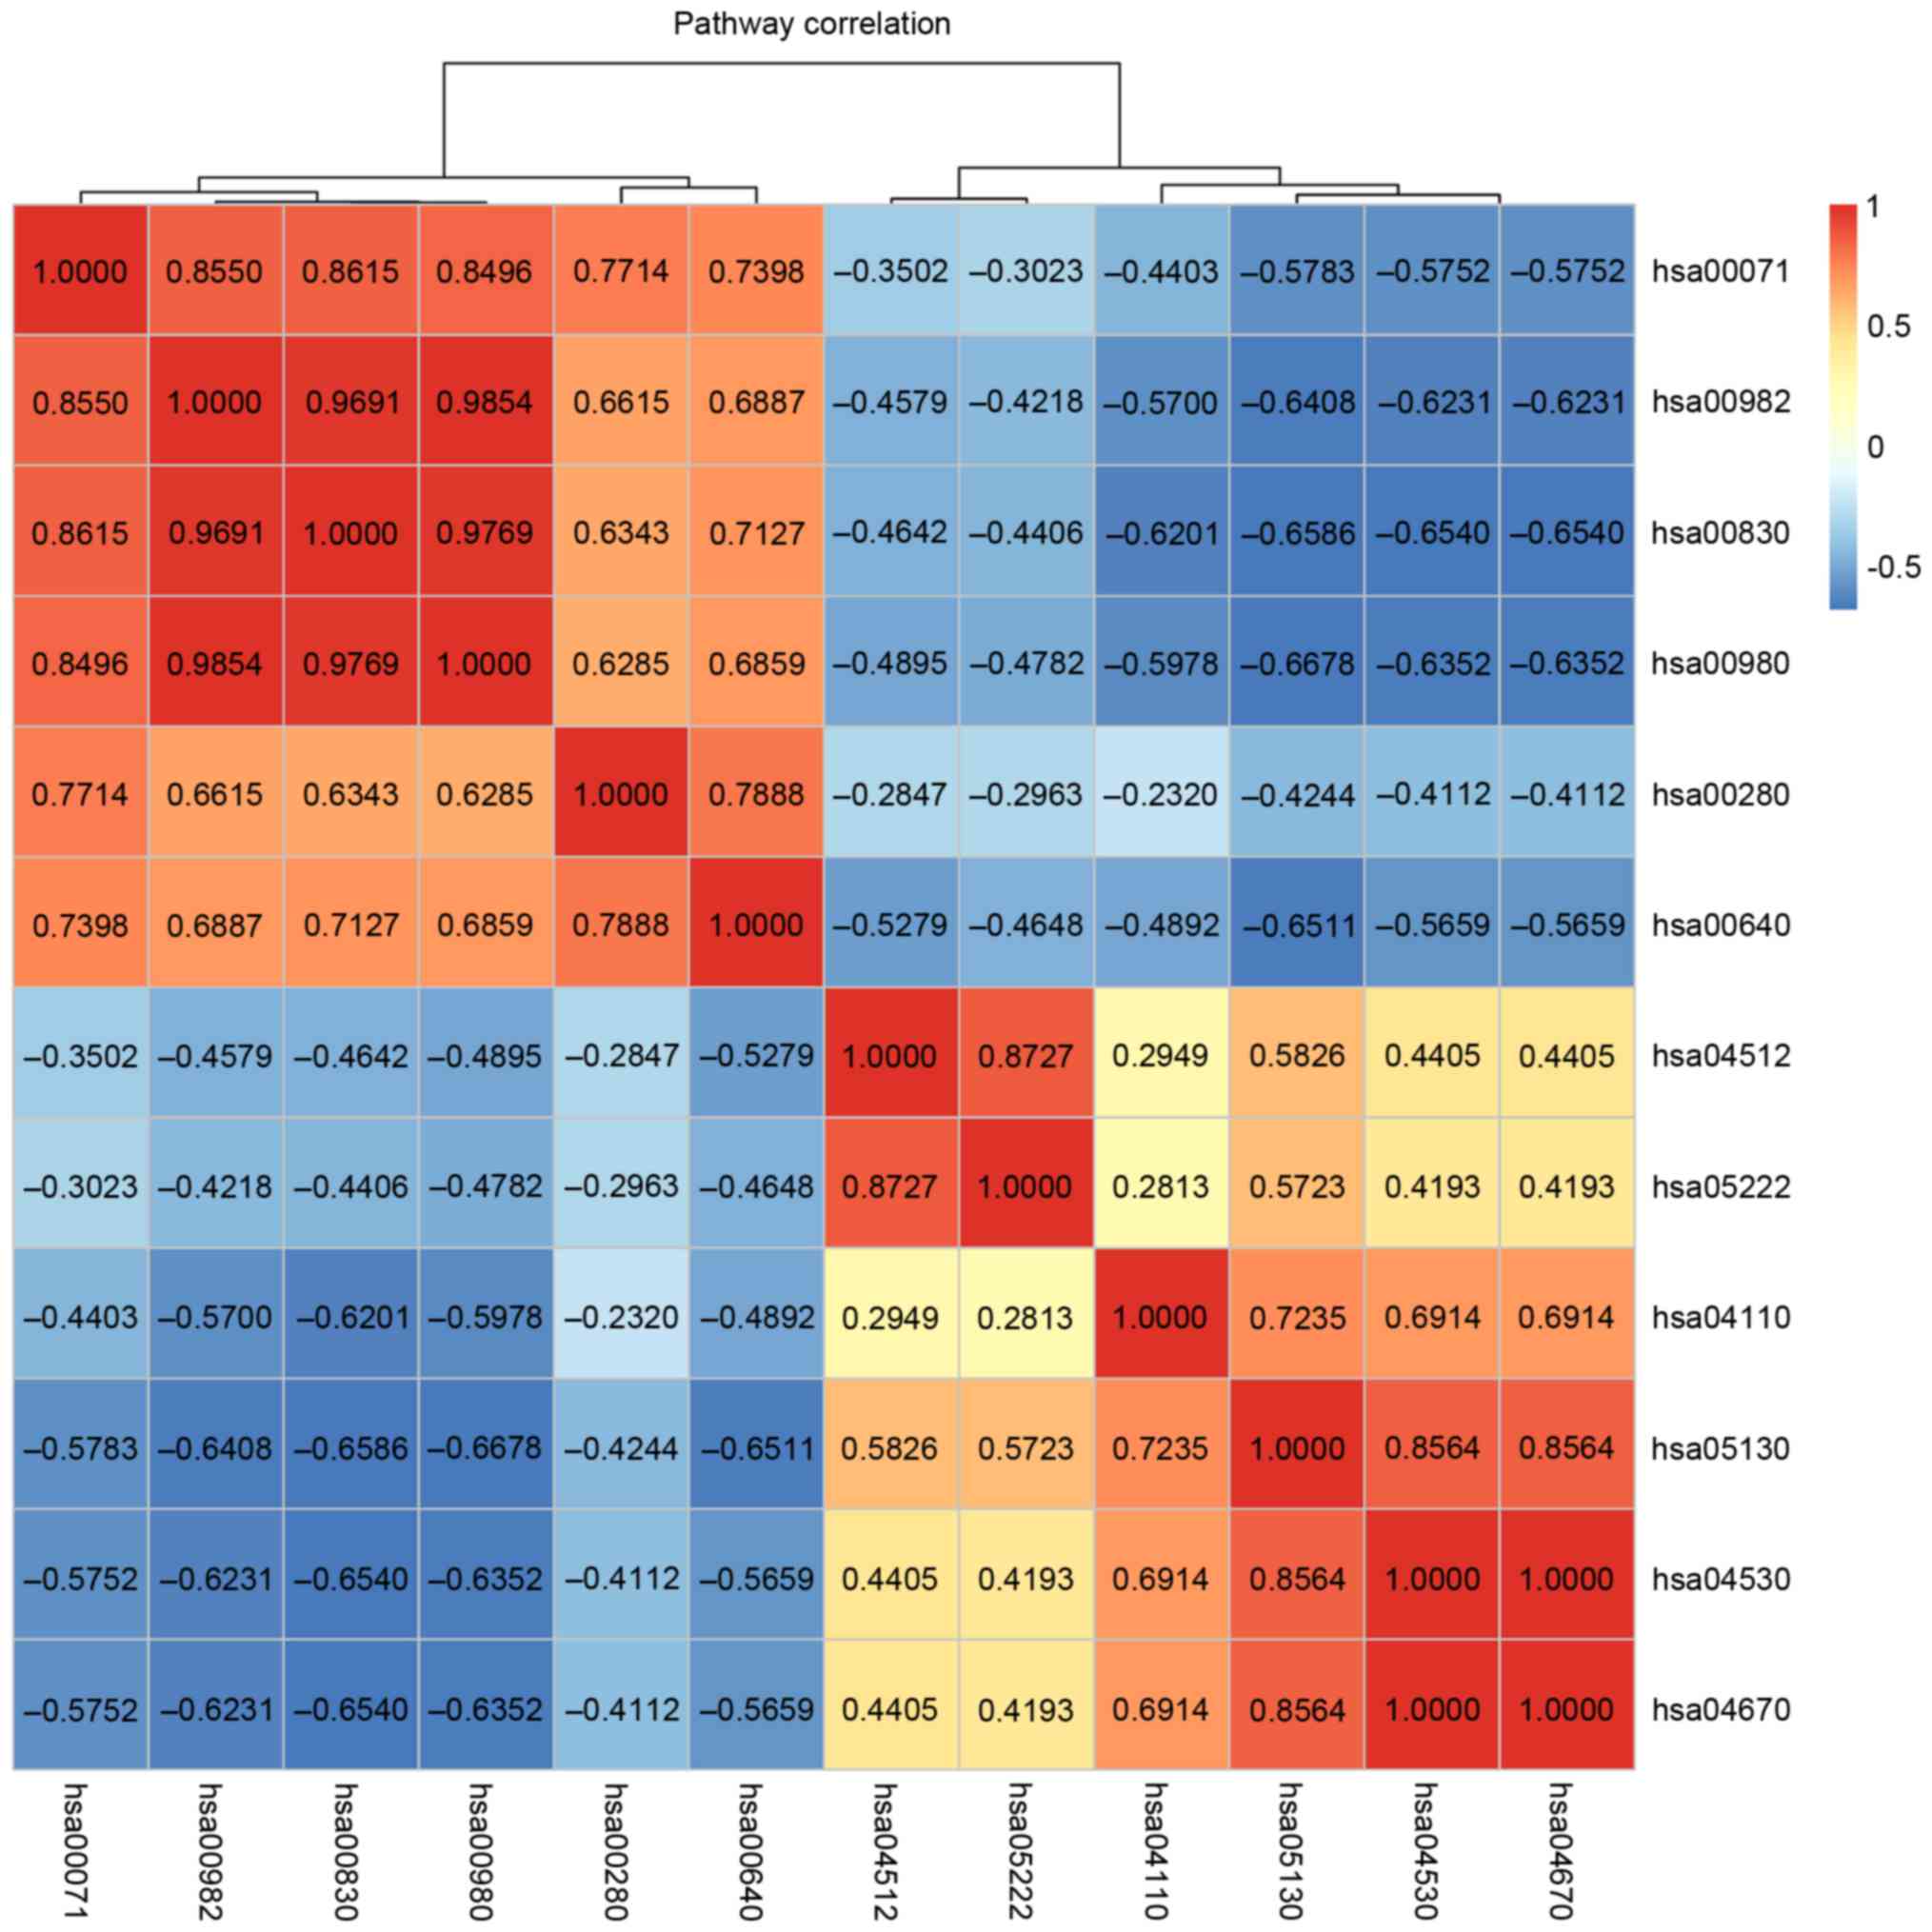
changing trends (Fig. 4). The
correlations between all these 12 pathways were visualized using a
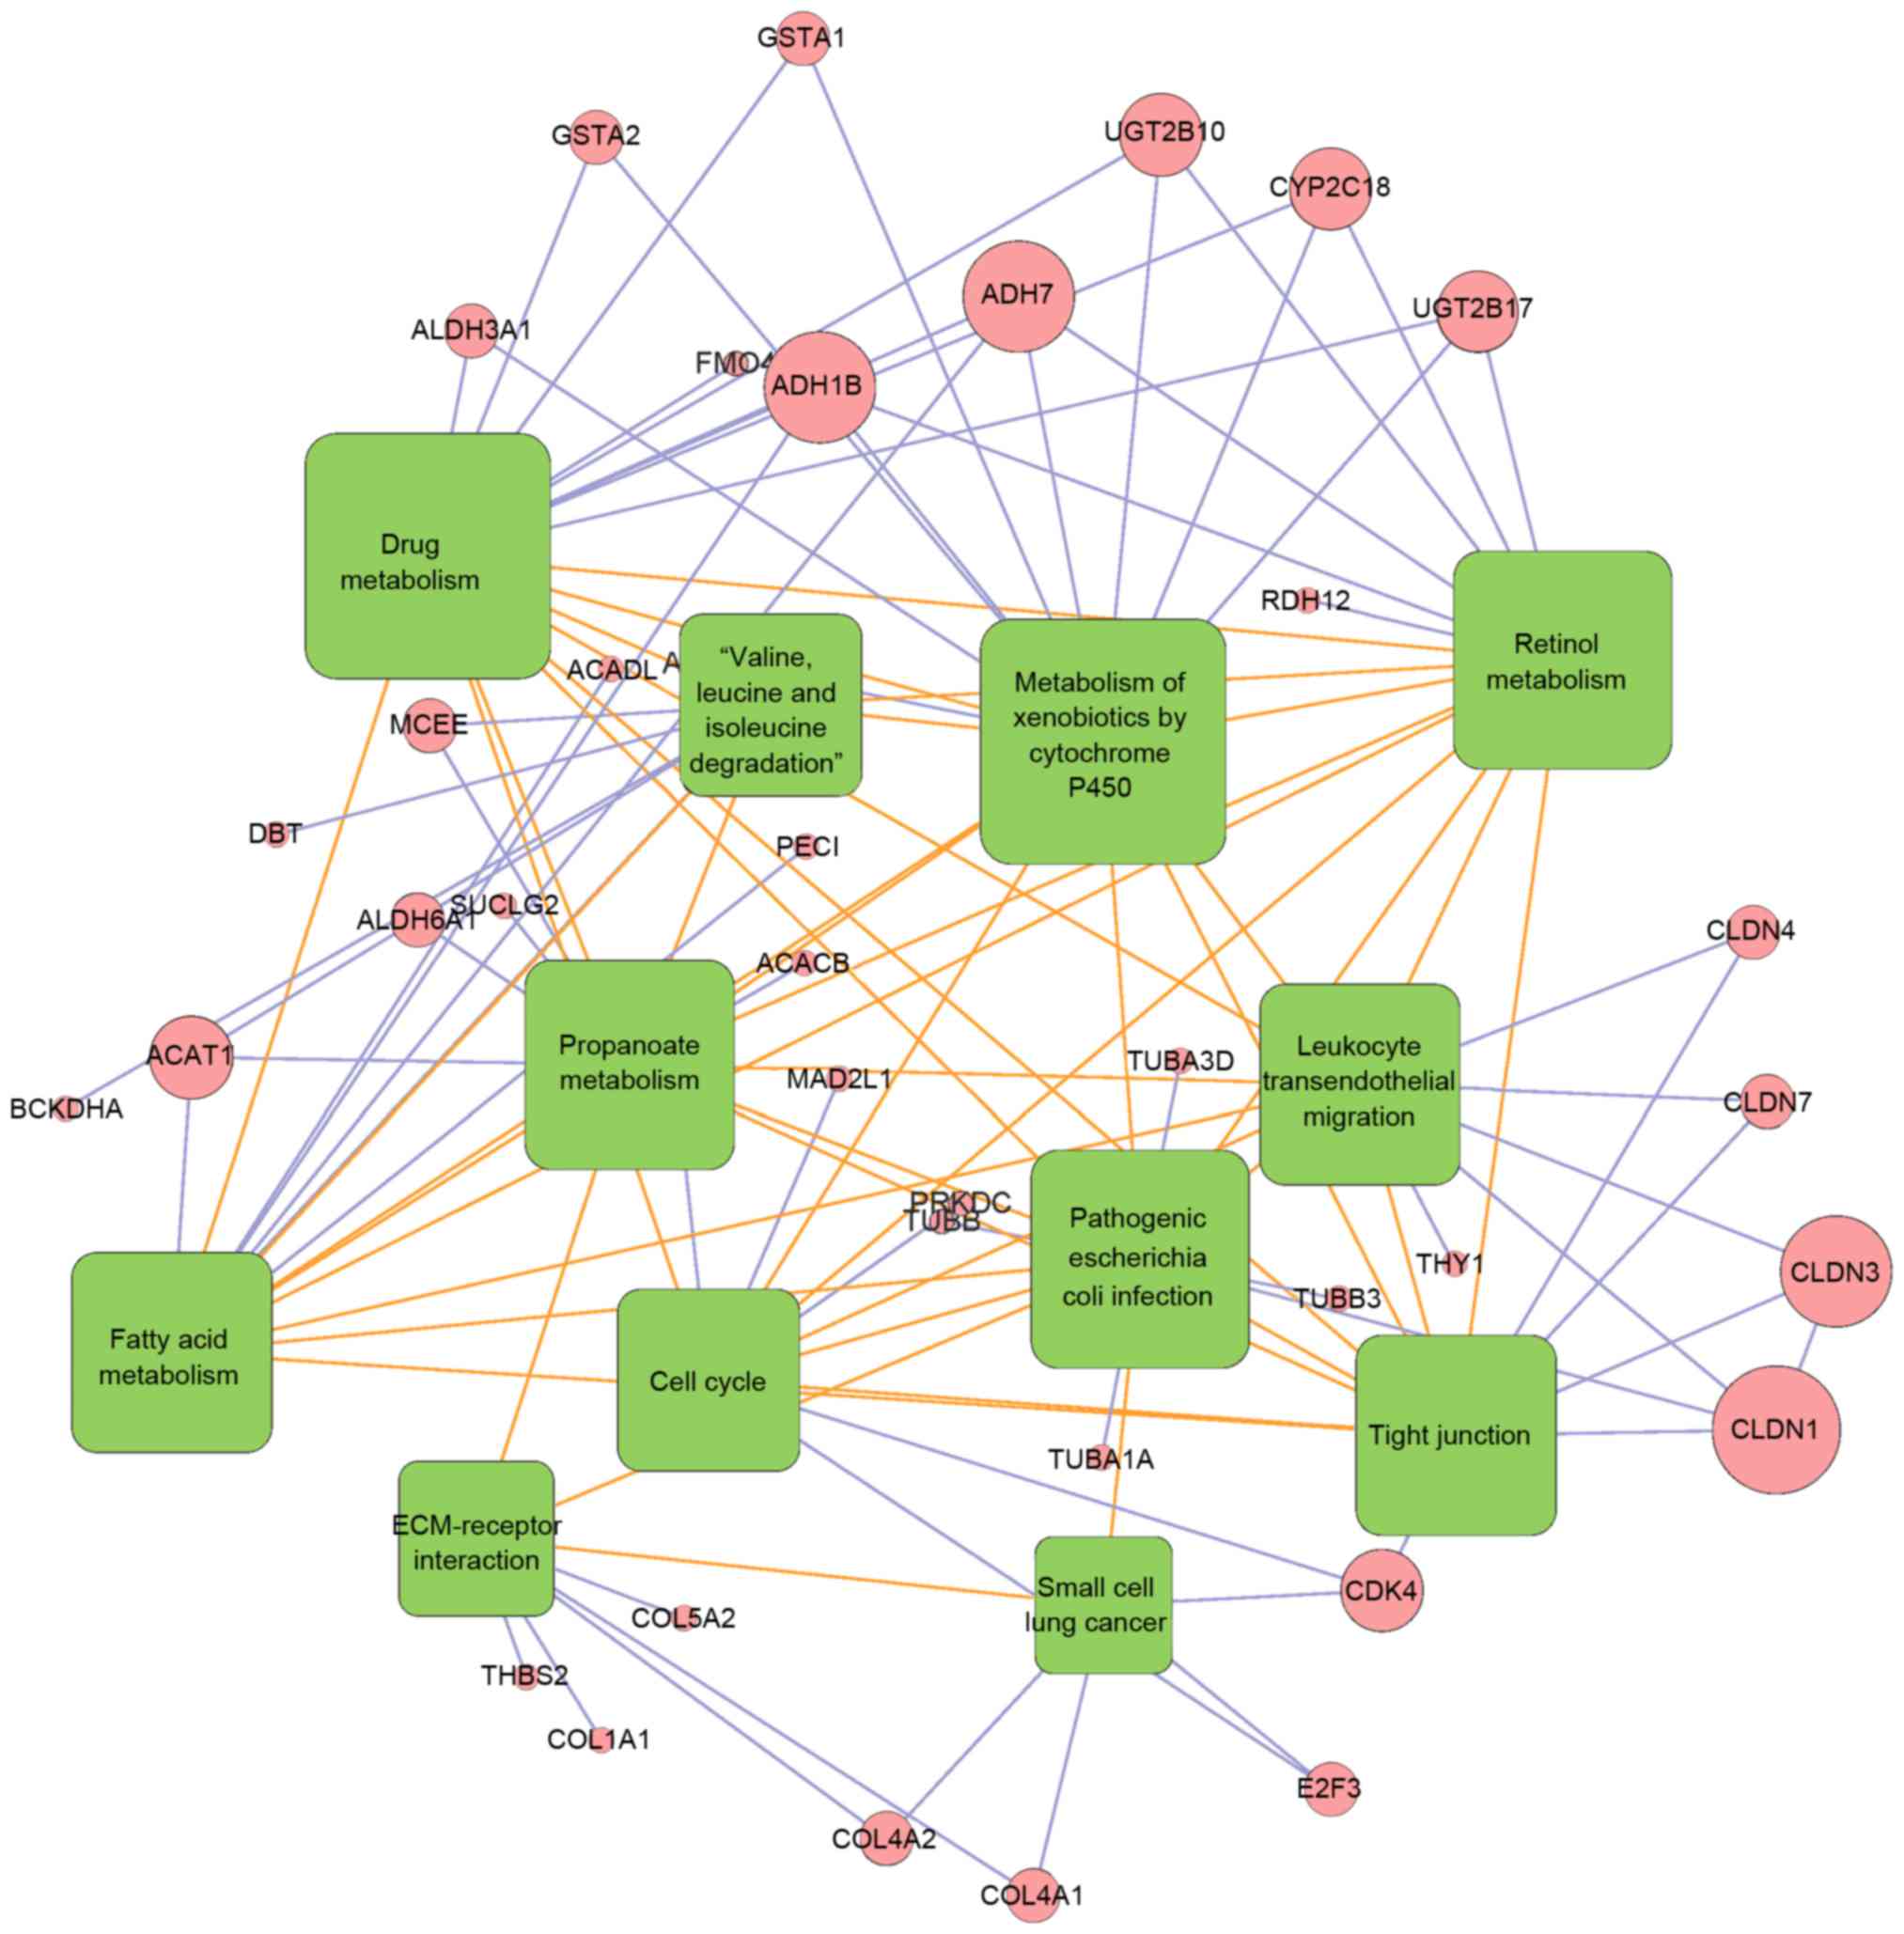
heatmap (Fig. 5). The genes
existing in >1 pathways were the cross talk genes, and the
differential expression of these genes imply the abnormality of the
related pathways. The complicated connections of pathway-gene and
gene-gene are displayed in Fig. 6,
which comprised 52 nodes (12 pathways/44 genes) and 111 lines (the
relationship). Among their connection pairs, the Kyoto Encyclopedia
of Genes and Genomes (KEGG) pathways hsa00980 (Metabolism of
xenobiotics by cytochrome P450) and hsa00982 (Drug metabolism)
shared eight cross talk genes: ADH7, ALDH3A1, GSTA1, GSTA2,
UGT2B17, UGT2B10, ADH1B and CYP2C18. There were 17 genes that are
involved in >1 pathway, including ADH7 (shared by four
pathways); UGT2B17, CLDN1, ADH1B, CYP2C18, and CDK4 (shared by
three pathways) (Table II).
| Table II.Connected pathway numbers of the
cross talk genes. |
Table II.
Connected pathway numbers of the
cross talk genes.
| Cross talk
gene | Pathway number | Cross talk
gene | Pathway number |
|---|
| GSTA2 | 2 | ADH1B | 3 |
| UGT2B17 | 3 | ALDH3A1 | 2 |
| UGT2B10 | 2 | COL4A1 | 2 |
| ACAT1 | 2 | CLDN3 | 2 |
| CLDN1 | 3 | ADH7 | 4 |
| MCEE | 2 | CLDN7 | 2 |
| E2F3 | 2 | ADH1B CYP2C18
CDK4 | 3 |
| CLDN4 | 2 | CDK4 | 3 |
Prognosis gene screening
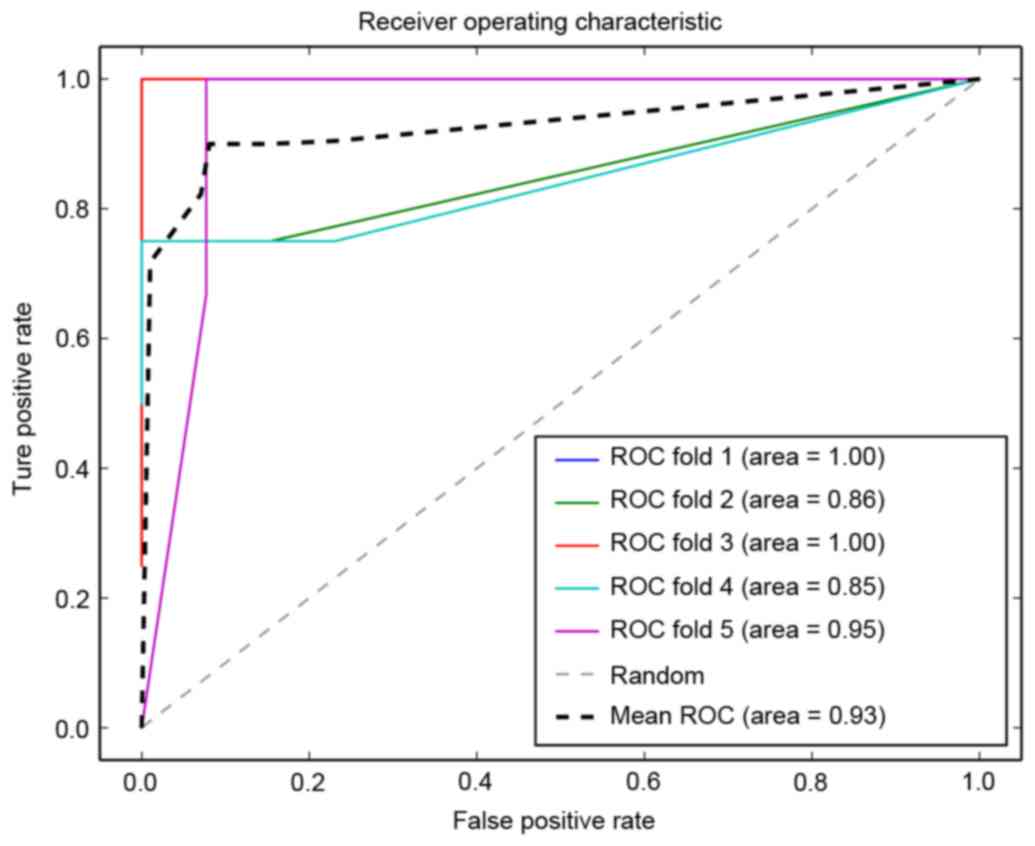
A support vector machine prognosis model was
constructed using the cross talk genes, and the ROC curve of
five-fold cross validation is presented in Fig. 7. It was observed that the lowest
precision of the prediction was 0.85, and the average precision was
0.94, indicating the robustness and precision of the prognosis
model. The model also exhibited a high recall rate and Fl-score
(Table III).
| Table III.Support vector machine model
report. |
Table III.
Support vector machine model
report.
|
| Precision | Recall | F1-score |
|---|
| Cancer sample | 0.97 |
0.94 | 0.95 |
| Normal samples | 0.82 | 0.9 | 0.86 |
| Average/total | 0.93 |
0.93 | 0.93 |
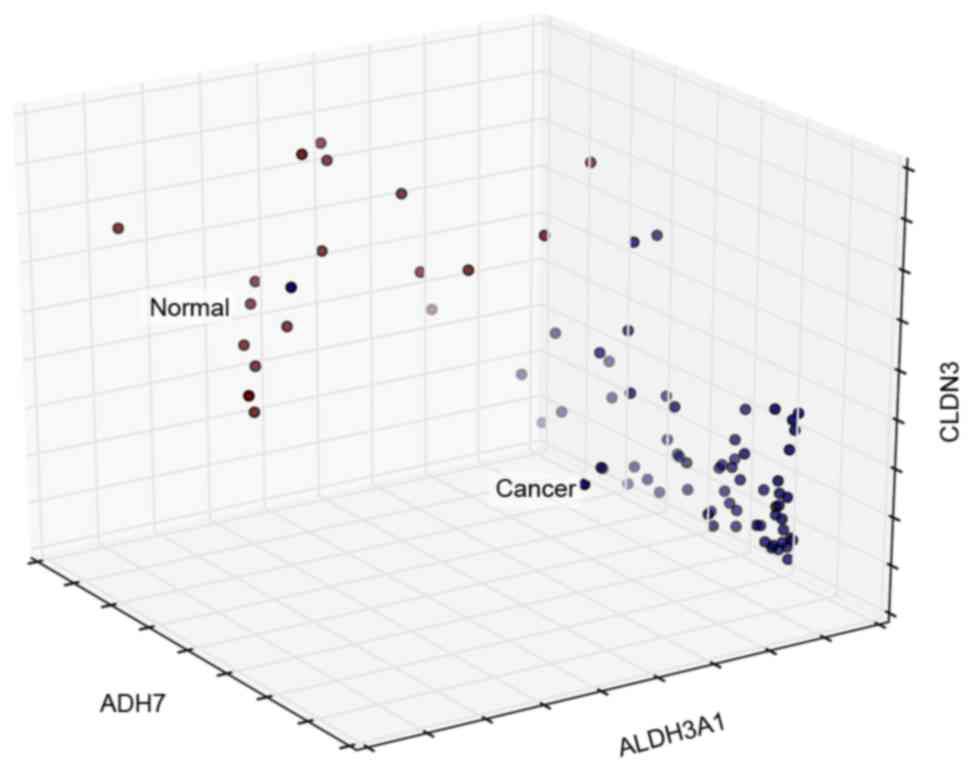
The classification ability of the cross talk genes
to normal and cancer samples was also presented using a 3D
visualization method (Fig. 8).
Among all cross talk genes, ADH7, ALDH3A1 and CLDN3 exhibited the
most specific classification characteristics.
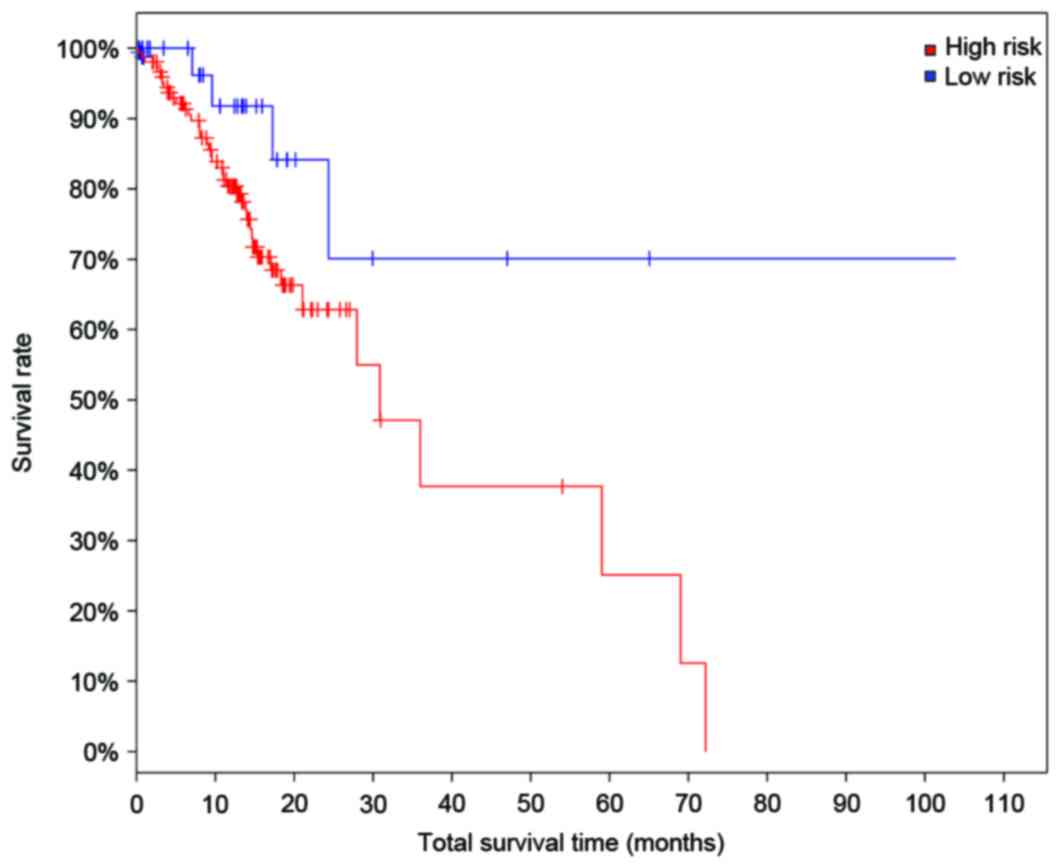
Moreover, the prognosis model was validated using
other independent expression profiles downloaded from TCGA. The
samples with at least one differentially expressed cross talk genes
were defined as the high-risk samples, while the samples with no
differentially expressed cross talk gene were defined as the
low-risk samples. The survival curve of the high-risk and low-risk
samples is presented in Fig. 9,
and the result indicated that these two groups of samples were
different significantly in total survival time (P=0.03), indicating
its robustness and sensitivity as the prognosis genes for gastric
adenocarcinoma.
Discussion
In the present study, a total of 635 DEGs were
screened in the gastric adenocarcinoma samples, including 432
downregulated ones and 203 upregulated ones. The PPI network of
DEGs were composed of 590 DEGs and 4,299 interaction pairs. A total
of 200 key genes were identified, which were significantly enriched
in six downregulated and six upregulated pathways. Cross talk genes
in the connected pathways were then analyzed, and KEGG pathways
hsa00980 (Metabolism of xenobiotics by cytochrome P450) and
hsa00982 (Drug metabolism) shared 8 cross talk genes: ADH7,
ALDH3A1, GSTA1, GSTA2, UGT2B17, UGT2B10, ADH1B and CYP2C18. Among
all cross talk genes, ADH7, ALDH3A1 and CLDN3 were the most
specific. The high- and low-risk samples identified by the
prognosis model established by cross talk genes presented a
remarkable difference in total survival time, indicating its
robustness and sensitivity.
Correlates between expression of various
metabolizing enzymes with risk of malignancies have been observed
for many years (22). It was
reported that the dysfunction of pathways hsa00980 (Metabolism of
xenobiotics by cytochrome P450) and hsa00982 (Drug metabolism)
would induce the drug resistance or adverse reaction during the
chemotherapy for gastric adenocarcinoma by interrupting drug
metabolism and promoting drug excretion (23–25).
These two pathways were demonstrated shared 8 cross talk genes, and
they are the nodes in the pathway-gene network with high degrees.
Considering their close connection with other key genes and
pathways involved in gastric adenocarcinoma, these genes and
pathways may be the potential targets for the treatment. The
prognostic roles of these 8 genes for normal samples and gastric
cancer samples have been validated in the current study. Of all
these genes, ADH7 and ADH1B belong to the alcohol dehydrogenase
family, ALDH3A1 is from aldehyde dehydrogenase family, GSTA1 and
GSTA2 are from the glutathione transferase family, UGT2B17 and
UGT2B10 are from the uridine diphosphate-glucuronosyltransferase 2B
family, and CYP2C18 is from the cytochrome P-450IIC family. There
are evidences proving the connections between these families and
gastric adenocarcinomas (26–30).
ADH7 (alcohol dehydrogenase 7), the gene expressed
primarily in the upper gastrointestinal tract, is proved to be
participated in the metabolism of xenobiotics by cytochrome P450:
It is implicated in the metabolism of ethanol occurred in
gastroesophageal tissues before the absorption in the blood
(31,32). Single nucleotide polymorphisms in
ADH7 are reported as a susceptible factor for cancer and drug
dependence (33). ALDH (aldehyde
dehydrogenase) is the enzyme responsible for the oxidation of
acetaldehyde, and it is reported that cancer cells exhibit a much
greater capability in ethanol oxidation but less ability for its
remove (26). A European study
indicated the genetic variants at the loci of ADH1 and ALDH2 may
influence GC risk (27). Jelski
et al (34) suggested ADH
and ALDH may be used as the candidate tumor markers in pancreatic
cancer. The ADH1B*1 allele is proven to be associated with an
increased risk of esophageal cancer (35). Besides the involvement in the
metabolism of xenobiotics by cytochrome P450 and drug metabolism
pathways, ADH7, ALDH3A1 and ADH1B were also the cross talk genes
with the higher connections with pathways, suggesting the
possibility for these genes to be used as the biomarkers for the
diagnosis and prognosis of gastric adenocarcinoma.
Claudins (CLDNs) are the major tight-junction
proteins, which expressed at the apical membrane of epithelial
cells. The main function of CLDNs is the control to paracellular
permeability and the maintenance of epithelial polarity (36). The expression reduction or loss of
CLDNs has been revealed to be able to promote the invasion and
metastasis of malignant tumor cells, including the tumor in
gastrointestinal tract (37,38).
CLDNs are good biomarkers for the determination of the
differentiation and aggressiveness of gastric cancer (39). CLDN3 belongs to the CLDNs family,
and it is expressed in metaplastic mucosa and gastric carcinomas
(40,41). Overexpression of CLDN3 has been
recognized as a prognostic indicator for ovarian serous carcinomas
(42). Jung et al (43) reported that CLDN3 is the most
important indicator for the lymphatic invasion process in gastric
cancer. Consistent with previous findings, CLDN3 was identified to
be a classification gene for gastric adenocarcinoma in the present
study.
The analysis on cross talk genes between
dysfunctional pathways is useful in finding the potential
biomarkers in cancer. ADH7, ALDH3A1, GSTA1, GSTA2, UGT2B17,
UGT2B10, ADH1B, and CYP2C18 and CLDN3 may be used as the prognosis
factors and target biomarkers for chemotherapies in gastric
adenocarcinoma.
References
|
1
|
Oliveira C, Pinheiro H, Figueiredo J,
Seruca R and Carneiro F: Familial gastric cancer: Genetic
susceptibility, pathology, and implications for management. Lancet
Oncol. 16:e60–e70. 2015. View Article : Google Scholar : PubMed/NCBI
|
|
2
|
Kang W, Tong JH, Lung RW, Dong Y, Zhao J,
Liang Q, Zhang L, Pan Y, Yang W, Pang JC, et al: Targeting of yap1
by microrna-15a and microrna-16-1 exerts tumor suppressor function
in gastric adenocarcinoma. Mol Cancer. 14:522015. View Article : Google Scholar : PubMed/NCBI
|
|
3
|
Ferlay J, Shin HR, Bray F, Forman D,
Mathers C and Parkin DM: Estimates of worldwide burden of cancer in
2008: Globocan 2008. Int J Cancer. 127:2893–2917. 2010. View Article : Google Scholar : PubMed/NCBI
|
|
4
|
Lin SJ, Gagnon-Bartsch JA, Tan IB, Earle
S, Ruff L, Pettinger K, Ylstra B, van Grieken N, Rha SY, Chung HC,
et al: Signatures of tumour immunity distinguish Asian and
non-Asian gastric adenocarcinomas. Gut. 64:1721–1731. 2015.
View Article : Google Scholar : PubMed/NCBI
|
|
5
|
Stewart B and Wild CP: World cancer report
2014. World Health Organization; 2015
|
|
6
|
Cao W, Tian W, Hong J, Li D, Tavares R,
Noble L, Moss SF and Resnick MB: Expression of bile acid receptor
TGR5 in gastric adenocarcinoma. Am J Physiol Gastrointest Liver
Physiol. 304:G322–G327. 2013. View Article : Google Scholar : PubMed/NCBI
|
|
7
|
Takahashi M, Nakajima M, Ogata H, Domeki
Y, Ohtsuka K, Ihara K, Kurayama E, Yamaguchi S, Sasaki K, Miyachi K
and Kato H: Cd24 expression is associated with progression of
gastric cancer. Hepatogastroenterology. 60:653–658. 2013.PubMed/NCBI
|
|
8
|
Jiang Y, He Y, Li H, Li HN, Zhang L, Hu W,
Sun YM, Chen FL and Jin XM: Expressions of putative cancer stem
cell markers ABCB1, ABCG2, and CD133 are correlated with the degree
of differentiation of gastric cancer. Gastric cancer. 15:440–450.
2012. View Article : Google Scholar : PubMed/NCBI
|
|
9
|
Yk W, Cf G, T Y, Z C, Xw Z, Xx L, Nl M and
Wz Z: Assessment of ERBB2 and EGFR gene amplification and protein
expression in gastric carcinoma by immunohistochemistry and
fluorescence in situ hybridization. Mol Cytogenet. 4:142011.
View Article : Google Scholar : PubMed/NCBI
|
|
10
|
Hayashi M, Inokuchi M, Takagi Y, Yamada H,
Kojima K, Kumagai J, Kawano T and Sugihara K: High expression of
HER3 is associated with a decreased survival in gastric cancer.
Clin Cancer Res. 14:7843–7849. 2008. View Article : Google Scholar : PubMed/NCBI
|
|
11
|
Suh JH, Won KY, Kim GY, Bae GE, Lim SJ,
Sung JY, Park YK, Kim YW and Lee J: Expression of tumoral FOXP3 in
gastric adenocarcinoma is associated with favorable
clinicopathological variables and related with hippo pathway. Int J
Clin Exp Pathol. 8:14608–14618. 2015.PubMed/NCBI
|
|
12
|
Zhao J, Bai Z, Feng F, Song E, Du F, Zhao
J, Shen G, Ji F, Li G and Ma X: Cross-talk between EPAS-1/HIF-2α
and PXR signaling pathway regulates multi-drug resistance of
stomach cancer cell. Int J Biochem Cell Biol. 72:73–88. 2016.
View Article : Google Scholar : PubMed/NCBI
|
|
13
|
Kitagawa M, Lee SH and McCormick F: Skp2
suppresses p53-dependent apoptosis by inhibiting p300. Mol Cell.
29:217–231. 2008. View Article : Google Scholar : PubMed/NCBI
|
|
14
|
Wang Z, Fukushima H, Inuzuka H, Wan L, Liu
P, Gao D, Sarkar FH and Wei W: Skp2 is a promising therapeutic
target in breast cancer. Front Oncol. 1:pii: 187022012. View Article : Google Scholar
|
|
15
|
Wei Z, Jiang X, Qiao H, Zhai B, Zhang L,
Zhang Q, Wu Y, Jiang H and Sun X: STAT3 interacts with skp2/p27/p21
pathway to regulate the motility and invasion of gastric cancer
cells. Cell Signal. 25:931–938. 2013. View Article : Google Scholar : PubMed/NCBI
|
|
16
|
Cheadle C, Vawter MP, Freed WJ and Becker
KG: Analysis of microarray data using z score transformation. J Mol
Diagn. 5:73–81. 2003. View Article : Google Scholar : PubMed/NCBI
|
|
17
|
Smyth GK: Limma: Linear models for
microarray dataBioinformatics and Computational Biology Solutions
using R and Bioconductor. Gentleman. Carey V..Dudoit S..Irizarry
R..Huber W.: Springer; New York: pp. 397–420. 2005, View Article : Google Scholar
|
|
18
|
Doncheva NT, Assenov Y, Domingues FS and
Albrecht M: Topological analysis and interactive visualization of
biological networks and protein structures. Nat Protoc. 7:670–685.
2012. View Article : Google Scholar : PubMed/NCBI
|
|
19
|
Dennis G Jr, Sherman BT, Hosack DA, Yang
J, Gao W, Lane HC and Lempicki RA: David: Database for annotation,
visualization, and integrated discovery. Genome biol. 4:P32003.
View Article : Google Scholar : PubMed/NCBI
|
|
20
|
Mao X, Cai T, Olyarchuk JG and Wei L:
Automated genome annotation and pathway identification using the
KEGG orthology (KO) as a controlled vocabulary. Bioinformatics.
21:3787–3793. 2005. View Article : Google Scholar : PubMed/NCBI
|
|
21
|
de Hoon MJ, Imoto S, Nolan J and Miyano S:
Open source clustering software. Bioinformatics. 20:1453–1454.
2004. View Article : Google Scholar : PubMed/NCBI
|
|
22
|
Singh MS and Michael M: Role of xenobiotic
metabolic enzymes in cancer epidemiology. Methods Mol Biol.
472:243–264. 2009. View Article : Google Scholar : PubMed/NCBI
|
|
23
|
Ding X and Kaminsky LS: Human extrahepatic
cytochromes p450: Function in xenobiotic metabolism and
tissue-selective chemical toxicity in the respiratory and
gastrointestinal tracts. Annu Rev Pharmacol Toxicol. 43:149–173.
2003. View Article : Google Scholar : PubMed/NCBI
|
|
24
|
González CA, Sala N and Capellá G: Genetic
susceptibility and gastric cancer risk. Int J Cancer. 100:249–260.
2002. View Article : Google Scholar : PubMed/NCBI
|
|
25
|
Shah MA, Khanin R, Tang L, Janjigian YY,
Klimstra DS, Gerdes H and Kelsen DP: Molecular classification of
gastric cancer: A new paradigm. Clin Cancer Res. 17:2693–2701.
2011. View Article : Google Scholar : PubMed/NCBI
|
|
26
|
Jelski W and Szmitkowski M: Alcohol
dehydrogenase (ADH) and aldehyde dehydrogenase (ALDH) in the cancer
diseases. Clin Chim Acta. 395:1–5. 2008. View Article : Google Scholar : PubMed/NCBI
|
|
27
|
Duell EJ, Sala N, Travier N, Muñoz X,
Boutron-Ruault MC, Clavel-Chapelon F, Barricarte A, Arriola L,
Navarro C, Sánchez-Cantalejo E, et al: Genetic variation in alcohol
dehydrogenase (ADH1A, ADH1B, ADH1C, ADH7) and aldehyde
dehydrogenase (ALDH2), alcohol consumption and gastric cancer risk
in the European prospective investigation into cancer and nutrition
(EPIC) cohort. Carcinogenesis. 33:361–367. 2012. View Article : Google Scholar : PubMed/NCBI
|
|
28
|
Saadat M: Genetic polymorphisms of
glutathione s-transferase T1 (GSTT1) and susceptibility to gastric
cancer: A meta-analysis. Cancer Sci. 97:505–509. 2006. View Article : Google Scholar : PubMed/NCBI
|
|
29
|
Babhadiashar N, Sotoudeh M, Azizi E,
Bashiri J, Didevar R, Malekzadeh R and Ghahremani MH: Correlation
between cigarette smoking and urine cotinine level in Gastric
cancer patients. Iran J Pharm Res. 13:313–318. 2014.PubMed/NCBI
|
|
30
|
Rodriguez-Antona C and Ingelman-Sundberg
M: Cytochrome P450 pharmacogenetics and cancer. Oncogene.
25:1679–1691. 2006. View Article : Google Scholar : PubMed/NCBI
|
|
31
|
Hurley TD, Edenberg HJ and Li TK: The
pharmacogenomics of alcoholismPharmacogenomics: The Search for
Individualized Therapies. Wiley-VCH; Weinheim: pp. 417–441. 2002,
View Article : Google Scholar
|
|
32
|
Vaglenova J, Martínez SE, Portí S, Duester
G, Farrés J and Parés X: Expression, localization and potential
physiological significance of alcohol dehydrogenase in the
gastrointestinal tract. Eur J Biochem. 270:2652–2662. 2003.
View Article : Google Scholar : PubMed/NCBI
|
|
33
|
Jairam S and Edenberg HJ:
Single-nucleotide polymorphisms interact to affect adh7
transcription. Alcohol Clin Exp Res. 38:921–929. 2014. View Article : Google Scholar : PubMed/NCBI
|
|
34
|
Jelski W, Kutylowska E, Laniewska-Dunaj M
and Szmitkowski M: Alcohol dehydrogenase (ADH) and aldehyde
dehydrogenase (ALDH) as candidates for tumor markers in patients
with pancreatic cancer. J Gastrointestin Liver Dis. 20:255–259.
2011.PubMed/NCBI
|
|
35
|
Yokoyama A and Omori T: Genetic
polymorphisms of alcohol and aldehyde dehydrogenases and risk for
esophageal and head and neck cancers. Jpn J Clin Oncol. 33:111–121.
2003. View Article : Google Scholar : PubMed/NCBI
|
|
36
|
Tsukita S and Furuse M: Pores in the wall:
Claudins constitute tight junction strands containing aqueous
pores. J Cell Biol. 149:13–16. 2000. View Article : Google Scholar : PubMed/NCBI
|
|
37
|
Hoevel T, Macek R, Swisshelm K and Kubbies
M: Reexpression of the TJ protein CLDN1 induces apoptosis in breast
tumor spheroids. Int J Cancer. 108:374–383. 2004. View Article : Google Scholar : PubMed/NCBI
|
|
38
|
Ueda J, Semba S, Chiba H, Sawada N, Seo Y,
Kasuga M and Yokozaki H: Heterogeneous expression of claudin-4 in
human colorectal cancer: Decreased claudin-4 expression at the
invasive front correlates cancer invasion and metastasis.
Pathobiology. 74:32–41. 2007. View Article : Google Scholar : PubMed/NCBI
|
|
39
|
Satake S, Semba S, Matsuda Y, Usami Y,
Chiba H, Sawada N, Kasuga M and Yokozaki H: Cdx2 transcription
factor regulates claudin-3 and claudin-4 expression during
intestinal differentiation of gastric carcinoma. Pathol Int.
58:156–163. 2008. View Article : Google Scholar : PubMed/NCBI
|
|
40
|
Hewitt KJ, Agarwal R and Morin PJ: The
claudin gene family: Expression in normal and neoplastic tissues.
BMC Cancer. 6:1862006. View Article : Google Scholar : PubMed/NCBI
|
|
41
|
Matsuda Y, Semba S, Ueda J, Fuku T, Hasuo
T, Chiba H, Sawada N, Kuroda Y and Yokozaki H: Gastric and
intestinal claudin expression at the invasive front of gastric
carcinoma. Cancer Sci. 98:1014–1019. 2007. View Article : Google Scholar : PubMed/NCBI
|
|
42
|
Choi YL, Kim J, Kwon MJ, Choi JS, Kim TJ,
Bae DS, Koh SS, In YH, Park YW, Kim SH, et al: Expression profile
of tight junction protein claudin 3 and claudin 4 in ovarian serous
adenocarcinoma with prognostic correlation. 22:1185–1195. 2007.
|
|
43
|
Jung H, Jun KH, Jung JH, Chin HM and Park
WB: The expression of claudin-1, claudin-2, claudin-3, and
claudin-4 in gastric cancer tissue. J Surg Res. 167:e185–e191.
2011. View Article : Google Scholar : PubMed/NCBI
|