Introduction
Diabetes mellitus is, an autoimmune metabolic
disorder disease with characteristics of high blood sugar over a
prolonged period, and manifests as weight loss, polyuria,
polydipsia and polyphagia. It is primarily classified as type I and
type II diabetes based on whether the pancreas produces enough
insulin or whether body cells respond appropriately to the insulin
produced (1–3). Based on an epidemiological survey,
all types of diabetes may combine to cause angiopathy
complications, including diabetic neuropathy (4–6),
diabetic encephalopathy (7,8),
diabetic retinopathy (9–11) and diabetic nephropathy (DN)
(12–14), and is a global health problem.
DN has become a leading cause of chronic kidney
disease, particularly in end-stage renal disease, and the incidence
continues to rise. DN is clearly recognized as a common long-term
complication of diabetes mellitus, and is characterized by
nephrotic syndrome and diffuse scarring of the glomeruli (12,15,16).
It is frequently a symptomatic during the early stage, and kidney
damage manifests after 5–10 years with symptoms of severe
tiredness, headaches, a general feeling of illness, nausea,
vomiting, frequent urination, lack of appetite, itchy skin and leg
swelling (17,18). The pathogenesis of DN has been well
documented, and involves glycometabolic disorder, renal hemodynamic
alterations, genetic susceptibility, activation of cytokines and
oxidative stress (19–21). Slowing the progression of kidney
damage and to control the associated complications of diabetes has
become a core objective, and angiotensin-converting-enzyme
inhibitor has been used as a treatment that reduces the proteinuria
levels; however, other therapeutic strategies are required
(22–24). In addition, defective apoptotic
processes have been implicated in a variety of diseases. However,
the involvement of apoptotic pathways in advanced stages of DN are
not well understood. Therefore, the streptozotocin-induced DN model
was established, and renal cell apoptosis levels were examined by
immunohistochemistry (IHC) and western blotting, and suggested that
apoptosis serves a significant role in the streptozotocin-induced
DN model, and is associated with increased oxidative stress and
inflammatory cytokines. Therefore, it may serve as a significant
diagnostic reference in the study of DN.
Materials and methods
Experimental animals and grouping
A total of 36 specific pathogen-free Sprague Dawley
rats (male, 200–220 g; age, 8–12 weeks) were purchased and raised
in the Laboratory Animal Center of the Academy of Military Medical
Sciences (Beijing, China) with at a temperature of 25±2°C, humidity
of 40–60% and 12 h light/dark cycle, with free access to food and
water, and were randomly divided into two groups: Sham (n=18) and
diabetes model group (n=18). Rat body weight and blood glucose was
examined at 0, 10, 20, 30, 40, 50 and 60 days. Furthermore, the
diabetes model group was further divided into sham (n=6), 1 month
model group (n=6), and 2 month model group (n=6). This experiment
was approved by the Experimental Ethics Committee of the Military
Medical Sciences (Beijing, China).
Establishment of rat
diabeticnephropathy model by gradual streptozotocin
Prior to modeling, 1.1% (w/v) streptozotocin was
prepared in citric acid buffer (0.1 mol/l; pH 4.4) on ice in the
dark. Following 12 h fasting of food and water, streptozotocin (55
mg/kg) was intraperitoneally injected. For booster injection, one
fifth of streptozotocin (11 mg/kg) was intraperitoneally injected
at 15 days and 30 days. During modeling, rat body weight and blood
glucose was examined at 0, 10, 20, 30, 40, 50 and 60 days.
Subsequent to modeling, rats were anesthetized with pentobarbital
sodium (40 mg/kg; Merck KGaA, Darmstadt, Germany), sacrificed by
cervical dislocation and then kidney tissues were collected for
further study.
Hematoxylin and eosin (HE)
staining
The aforementioned kidney tissues were fixed at room
temperature with 4% paraformaldehyde for at least 24 h, and sliced
(3–5 µm) for staining with HE. Slides were slightly over-stained
with hematoxylin for approximately 3–5 min, and any excess stain
was removed with tap water. Slides were incubated for a few sec in
acidic alcohol until they appeared red. Slides were then briefly
rinsed in tap water to remove the acid. Bicarbonate was applied for
2 min until the nuclei were stained blue. The hematoxylin-stained
slides were placed in 70% ethanol after a final rinse in tap water
for 3 min and were then exposed to eosin for 2 min. Subsequently,
the slides underwent three washes with 95% ethanol for 5 min, and
were transferred to absolute ethanol for clearing. Subsequent to
staining, images were captured with a light microscope and analyzed
using Image-Pro Plus v7.0 software (Media Cybernetics, Inc.,
Rockville, MD, USA) followed by histogram analysis using Origin
version 9.0 software (Origin Lab, Northampton, MA, USA).
Terminal deoxynucleotidyl transferase
mediated dUTP nick-end labeling method (TUNEL) staining
The aforementioned kidney tissues were fixed by 4%
paraformaldehyde at room temperature for at least 24 h, and sliced
(3–5 µm) prior to TUNEL staining using a TUNEL staining kit
(Beijing Zhongshan Golden Bridge Biotechnology Co., Ltd; OriGene
Technologies, Inc., Beijing, China), according to the
manufacturer's protocol. Slides were deparaffinized, rehydrated,
washed twice with phosphate-buffered saline (PBS; 5 min/wash) and
incubated with the kit proteinase K solution at 37°C for 20 min.
After a further two washes in PBS (5 min/wash), the slides were
treated with the kit bovine serum albumin (BSA) blocking buffer at
room temperature for 10 min, followed by two washes with PBS (5
min/wash). Slides were then incubated with a 50 µl TUNEL reaction
mixture for 1 h in a humid chamber in the dark, and slides were
subsequently rinsed 3 times (5 min/wash) with PBS. Then, 50 µl
streptavidin-horseradish peroxidase (HRP) solution was added to
slides for 37°C for 30 min, followed by three washes with PBS (5
min/wash). Finally, 100 µl diaminobenzidine (DAB) solution was
added for 10 min at room temperature, followed by three washes with
PBS (5 min/wash) and hematoxylin counter staining for 3 min at room
temperature. The sections were observed under a light microscope
(Olympus Corporation, Tokyo, Japan) and five specific areas in each
region were captured. Positive apoptotic cells were measured using
Image-Pro Plus version 7.0 software (Media Cybernetics, Inc.). The
ratio of positive apoptotic cells and total cells was calculated
using Origin version 9.0 software (Origin Lab).
IHC staining
Kidney tissues were fixed and sliced as
aforementioned. Endogenous peroxidase was inactivated by incubating
the sections in 3% H2O2 for 30 min at 37°C.
The sections were incubated with 10% normal goat serum (catalog no.
ZKP160724-1; Suzhou Zeke Biotech Co., Ltd., Suzhou, China) in 0.01
M PBS for 30 min at room temperature, and then incubated with a
rabbit anti-Bcl-2 antibody (catalog no. BA0412; 1:200; Wuhan Boster
Biological Technology, Ltd., Wuhan, China), rabbit anti-Bax
antibody (catalog no. BA0315; 1:200; Wuhan Boster Biological
Technology, Ltd.) and rabbit-anti-caspase-3 antibody (catalog no.
BA3968; 1: 200; Wuhan Boster Biological Technology, Ltd.) in PBS
containing 0.3% Triton X-100 overnight at 4°C. The sections were
washed three times for 5 min each with PBS and then incubated with
peroxidase-conjugated goat anti-rat IgG (catalog no. ZDR-5118,
1:200; Zymed; Thermo Fisher Scientific, Inc., Waltham, MA, USA) for
1 h at room temperature. Finally, the sections were developed with
DAB in 0.1 M TBS containing 0.001% H2O2 for
30 min at room temperature. The sections were observed under a
light microscope (Olympus Corporation) and five specific areas in
each region were captured. Integrated optical density of Bcl-2, Bax
and caspase-3 positive cells were measured using Image-Pro Plus
version 7.0 software (Media Cybernetics, Inc.) followed by
histogram analysis using Origin version 9.0 software (Origin
Lab).
Measurement of oxidative stress
indexes, including malondialdehyde (MDA), superoxide dismutase
(SOD) and glutathione peroxidase (GSH-Px) in rat kidneys by
ELISA
A total of 20 µg kidney tissue was rapidly frozen in
liquid nitrogen. After thawing, tissue was homogenized and
centrifuged at 13,400 × g at 4°C for 15 min, and the supernatant
was collected. Subsequently, the MDA levels in the kidney were
measured using a rat MDA ELISA kit (catalog no. ZKP-150051; Suzhou
Zeke Biotech Co., Ltd.). Similarly, SOD and GSH-Px expression
levels were measured with a rat SOD ELISA kit (catalog no.
ZKP-150065; Suzhou Zeke Biotech Co., Ltd.), and a rat GSH-Px ELISA
kit (catalog no. ZKP-150078; Suzhou Zeke Biotech Co., Ltd.),
respectively, according to the manufacturer's protocol. A total of
20 µl serum and 80 µl sample diluent were added to the wells of a
96-well plate, gently mixed and incubated at 37°C for 30 min. The
plate was then washed with 100 µl washing buffer 5 times for 30
sec, and then 100 µl of HRP-conjugate reagent was added, except for
the blank wells, and incubated at 37°C for 30 min. The plate was
washed with 100 µl washing buffer 5 times for 30 sec, and 100 µl
DAB substrate was added at 37°C for 15 min. A total of 50 µl stop
solution was then added for 30 sec at 37°C. The absorbance was
measured at a wave length of 450 nm using a microplate reader for
15 min, and data was analyzed using SPSS software (version 21.0;
IBM Corp., Armonk, NY, USA), and histogram analysis was performed
using Origin version 9.5 software (Origin Lab).
Measurement of inflammatory cytokines,
including IL-6, TNF-α and TGF-βin rat kidneys by ELISA
A total of 20 µg kidney tissue was rapidly frozen in
liquid nitrogen, thawed, homogenized and centrifuged at 13,400 × g
at 4°C for 15 min, and the supernatant was collected. Subsequently,
the IL-6 levels in the kidney sample was measured using a rat IL-6
ELISA kit (catalog no. ZKP-1598; Suzhou Zeke Biotech Co., Ltd.).
Similarly, the TNF-α and TGF-β expression level was also measured
with a rat TNF-α ELISA kit (catalog no. ZKP-1500; Suzhou Zeke
Biotech Co., Ltd.), and a rat TGF-β ELISA kit (catalog no.
ZKP-1500104; Suzhou Zeke Biotech Co., Ltd.), respectively,
according to the manufacturer's protocol. A total of 20 µl serum
and 80 µl sample diluent were added to the wells of a 96-well
plate, gently mixed and incubated at 37°C for 30 min. The plate was
washed with 100 µl washing buffer 5 times for 30 sec, and then 100
µl HRP-conjugate reagent was added, except for blank wells, and
incubated at 37°C for 30 min. The plate was washed with 100 µl
washing buffer 5 times for 30 sec, and 100 µl DAB substrate was
added at 37°C for 15 min. A total of 50 µl of stop solution was
then added. Absorbance was measured at a wave length of 450 nm
using a microplate reader for 15 min, and analyzed using SPSS
software version 21.0 (IBM Corp.), and histogram analysis was
performed using Origin version 9.5 software (Origin Lab).
Western blotting
Total proteins were extracted from kidney tissues
using radioimmunoprecipitation lysis buffer [50 mM Tris-HCl (pH
7.4), 150 mM NaCl, 1% NP-40, 0.1% SDS and 1% PMSF], and quantified
using a bicinchoninic acid kit (catalog no. ZKP-160814-1; Suzhou
Zeke Biotech Co., Ltd.). A total of 35 µg protein from kidney
tissue was subjected to electrophoresis on 12% polyacrylamide gels,
and transferred to a polyvinylidene difluoride membrane following
the manufacturers' protocol. The membrane was blocked in 5% skim
milk at room temperature for 30 min, and then probed with
rabbit-anti-Bcl-2 antibody (catalog no. BA0412; 1:200; Wuhan Boster
Biological Technology, Ltd.), rabbit-anti-Bax (catalog no. BA0315,
1:200; Wuhan Boster Biological Technology, Ltd.), and
rabbit-anti-caspase-3 antibody (catalog no. BA3968, 1:200; Wuhan
Boster Biological Technology, Ltd.) for 1.5 h at room temperature.
Subsequently, the membranes were incubated with HRP-conjugated goat
anti-mouse secondary antibody (1:5,000 in TBST; OriProbe
Technologies, Inc., Beijing, China) at room temperature for 1 h.
Chemiluminescence luminol reagent (catalog no. ZKP-C150044-1;
Suzhou Zeke Biotech Co., Ltd.) was used to develop the
immune-labeled bands on X-ray film (Suzhou Zeke Biotech Co., Ltd.),
and the integrated optical density of the bands was quantified
using Image J version 1.46 software (National Institutes of Health,
Bethesda, MD, USA), and a histogram was generated using Origin 9.5
software (Origin Lab).
Statistical analysis
All data are expressed as the mean ± standard
deviation. Statistical analysis was performed with one-way analysis
of variance and the Tukey post hoc test using SPSS software version
21.0 (IBM Corp.), and a Student's t-test was performed when
comparing the means of two samples. P<0.05 was considered to
indicate a statistically significant difference.
Results
Rat body weight decreases and blood
glucose significantly increases with time in the
streptozotocin-induced DN model
After 60 days induction of DN with streptozotocin,
compared with sham group, the body weight was significantly
decreased in the diabetes model group (P<0.01; Table I). Compared with the sham group,
rats blood glucose was significantly increased to the maximum scale
value (33.33±0.00) after 20 days treatment with streptozotocin, and
was maintained for ≥60 days (P<0.01; Table II).
 | Table I.Body weight of sham or
streptozotocin-induced DN rats. |
Table I.
Body weight of sham or
streptozotocin-induced DN rats.
| Time (days) | Sham (g) | Diabetes model
(g) |
|---|
| 0 | 222.65±13.81 |
220.14±8.75 |
| 10 |
330.75±7.83 |
269.13±11.03a |
| 20 |
378.1±11.56 |
311.45±19.42a |
| 30 |
415.62±6.38 |
325.78±23.00a |
| 40 |
489.91±12.3 |
335.45±21.03a |
| 50 |
514.63±9.52 |
342.14±31.20a |
| 60 |
548.26±12.54 |
348.26±24.12a |
| Table II.Blood glucose change in diabetic rats
with prolonged modeling time. |
Table II.
Blood glucose change in diabetic rats
with prolonged modeling time.
| Time (days) | Sham (mmol/l) | Diabetes model
(mmol/l) |
|---|
| 0 |
8.35±0.04 |
8.38±0.08 |
| 10 |
8.25±0.14 |
30.40±2.21a |
| 20 |
8.24±0.04 |
33.33±0.00a |
| 30 |
8.31±0.24 |
33.33±0.00a |
| 40 |
8.25±0.16 |
33.33±0.00a |
| 50 |
8.24±0.12 |
33.33±0.00a |
| 60 |
8.28±0.26 |
33.33±0.00a |
The expression levels of MDA
significantly increases and SOD and GSH-Px expression significantly
decreases in the streptozotocin-induced DN model
The MDA expression level was significantly increased
in the model group at 1 month (2.65±0.14) and 2 months (3.85±0.17)
compared with 1.08±0.12 in the sham group (P<0.01; Table III). The expression level of
IL-6, TNF-α and TGF-β exhibited the same trend (P<0.01; Table III). In addition, the expression
levels of SOD and GSH-Px were significantly decreased after 1 and 2
months in the model group compared with the sham (P<0.01;
Table III).
| Table III.MDA, SOD, GSH-Px, IL-6, TNF-α and
TGF-β concentrations in kidneys of sham or diabetes model rats. |
Table III.
MDA, SOD, GSH-Px, IL-6, TNF-α and
TGF-β concentrations in kidneys of sham or diabetes model rats.
|
|
| Diabetes model |
|---|
|
|
|
|
|---|
| Group | Sham | 1 month | 2 months |
|---|
| MDA (nmol/l) |
1.08±0.12 |
2.65±0.14a |
3.85±0.17a,b |
| SOD (U/l) |
74.35±2.35 |
26.34±2.71a |
18.56±2.35a,b |
| GSH-Px (U/l) |
512.25±32.15 |
215.32±8.56a |
174.13±12.56a,b |
| IL-6 (ng/l) |
21.35±5.46 |
86.13±6.85a |
102.15±12.36a,b |
| TNF-α (ng/l) |
45.63±8.97 |
125.32±11.02a |
175.34±21.03a,b |
| TGF-β (ng/l) |
31.52±4.75 |
105.46±15.54a |
159.93±12.86a,b |
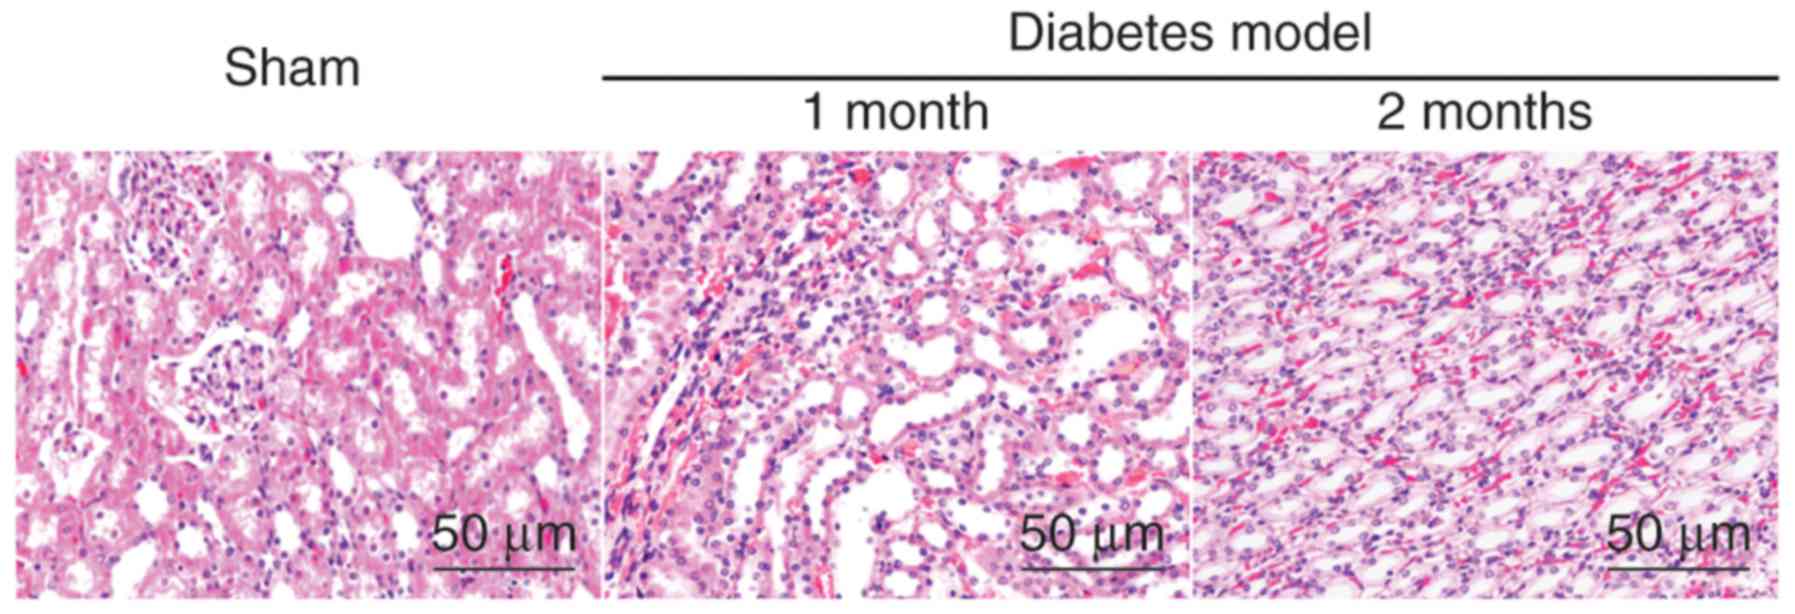
Kidney tissue morphology is loosely
packed and severely damaged in the diabetes model group
As demonstrated by HE staining, in the sham group,
the kidney cells were tightly distributed, with regular acinus, no
hyperchromatic nuclei and no inflammatory cell invasion. However,
in the model group, the kidney tissue appeared to be loosely packed
and severely damaged, the cell nuclei hyperchromatic, with severe
inflammation, an increased amount of interstitial matrix and
hypertrophy with vacuolar degeneration of renal tubular cells; the
DN model further aggravated these effects over time, as the level
of damage increased following 2 months when compared to 1 month
post-model induction (Fig. 1).
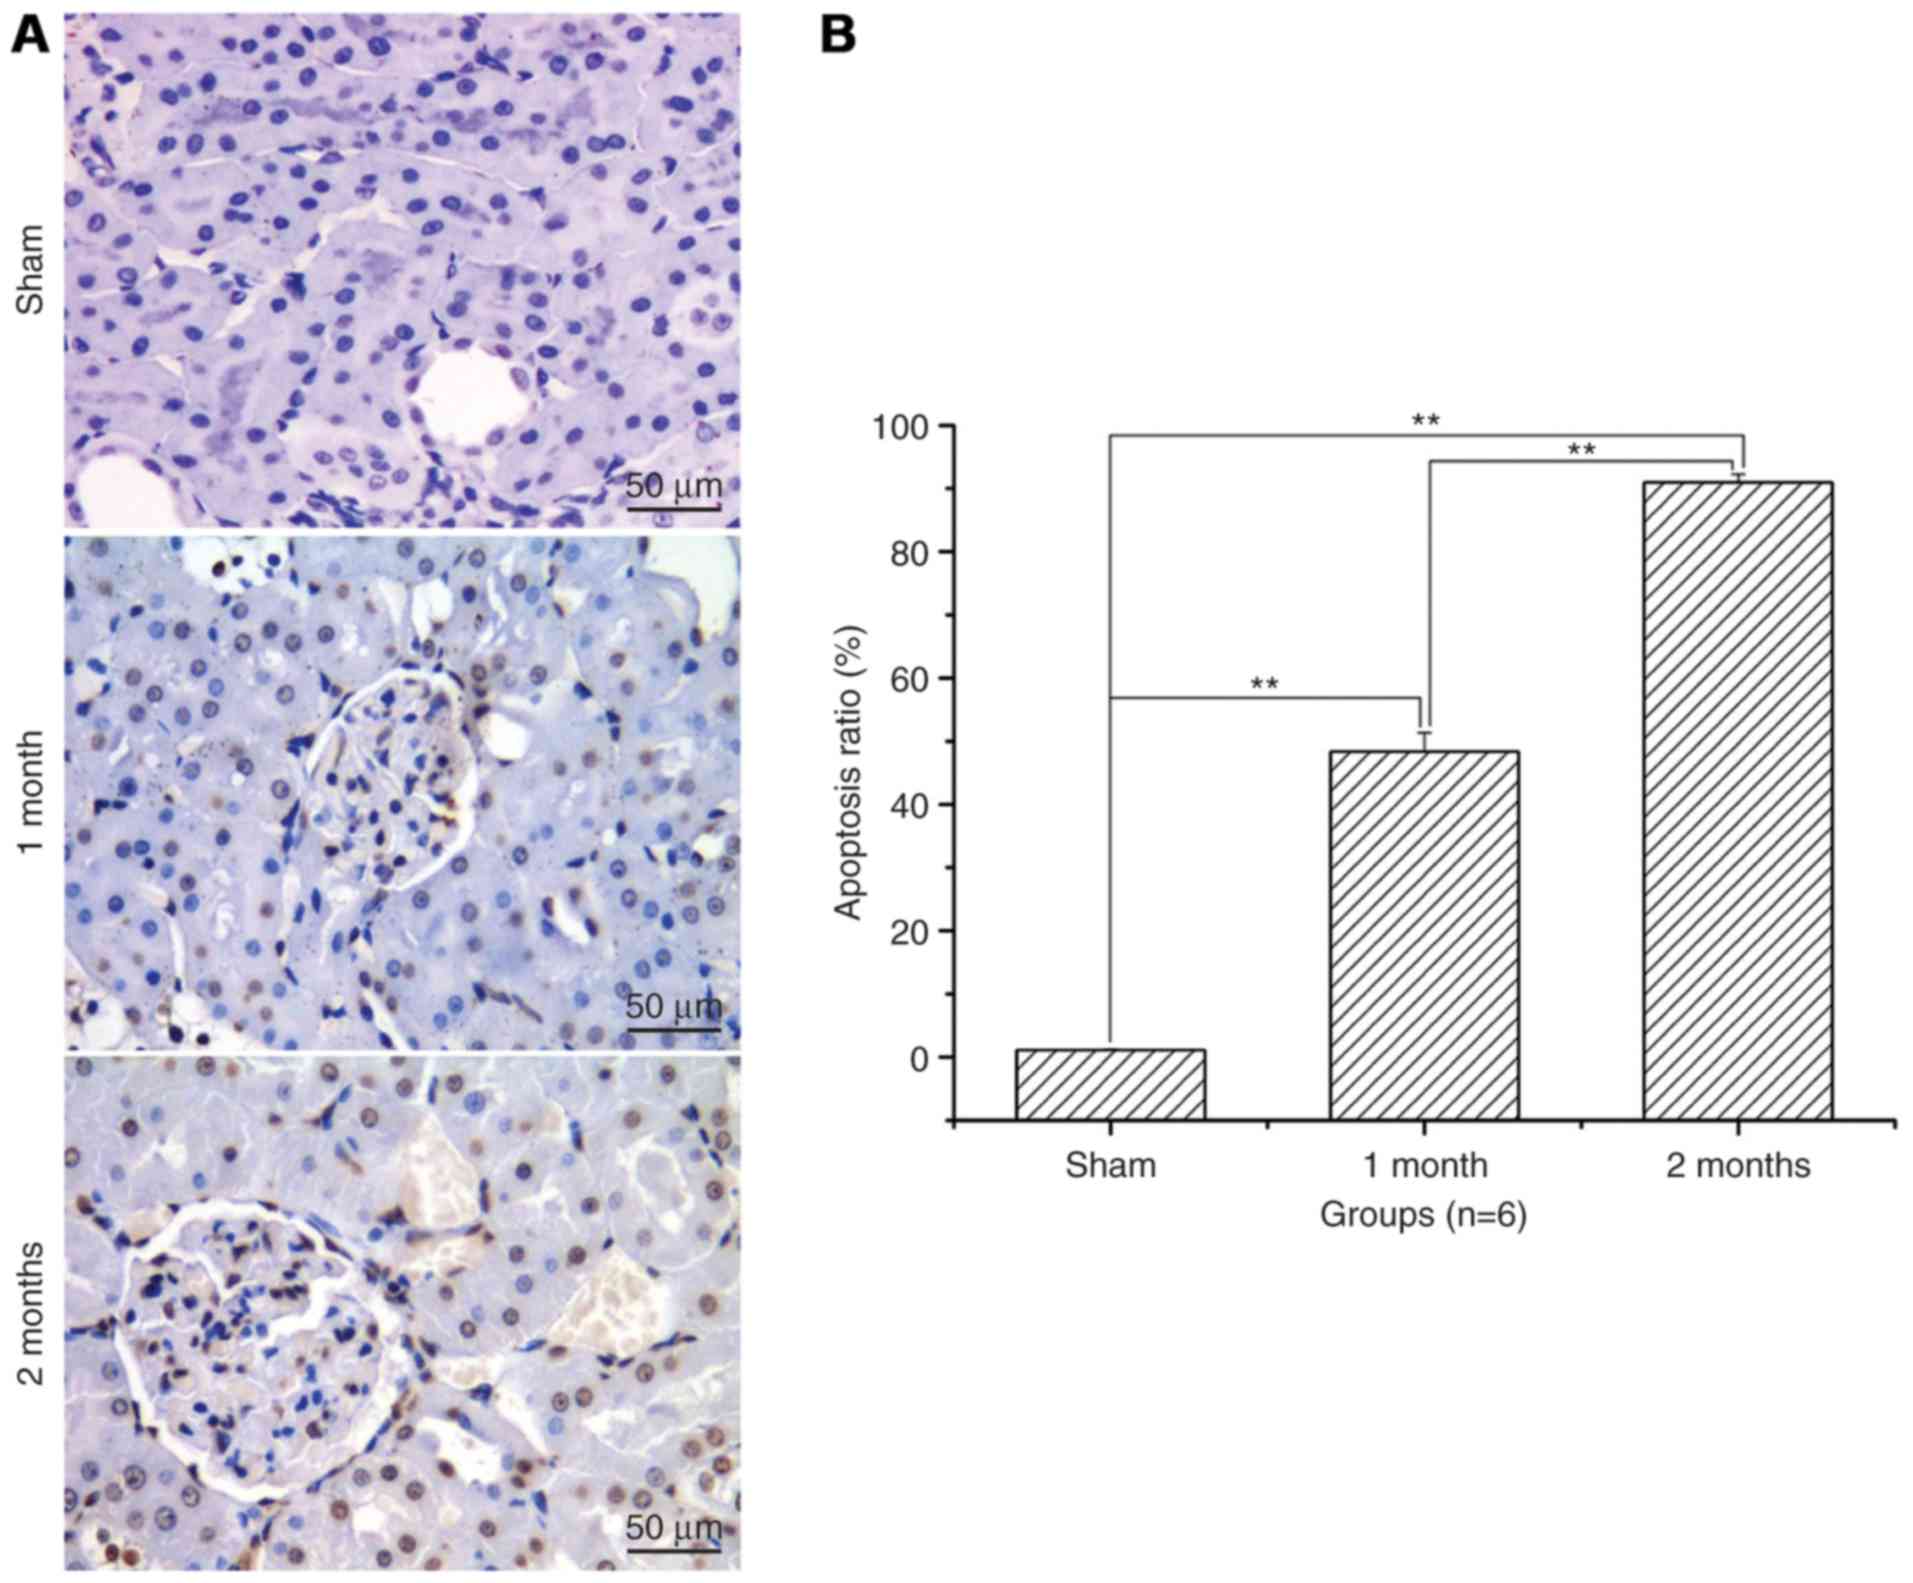
Renal cell apoptosis level and
apoptosis ratio significantly increases with time in the
streptozotocin-induced DN model group
After treatment with streptozotocin, renal cell
apoptosis and the apoptotic ratio was significantly increased in
the 1 and 2 month model groups when compared with the sham group
(P<0.01; Fig. 2). The increase
was greater in the 2 months model group compared with the 1 month
model group (P<0.01; Fig.
2).
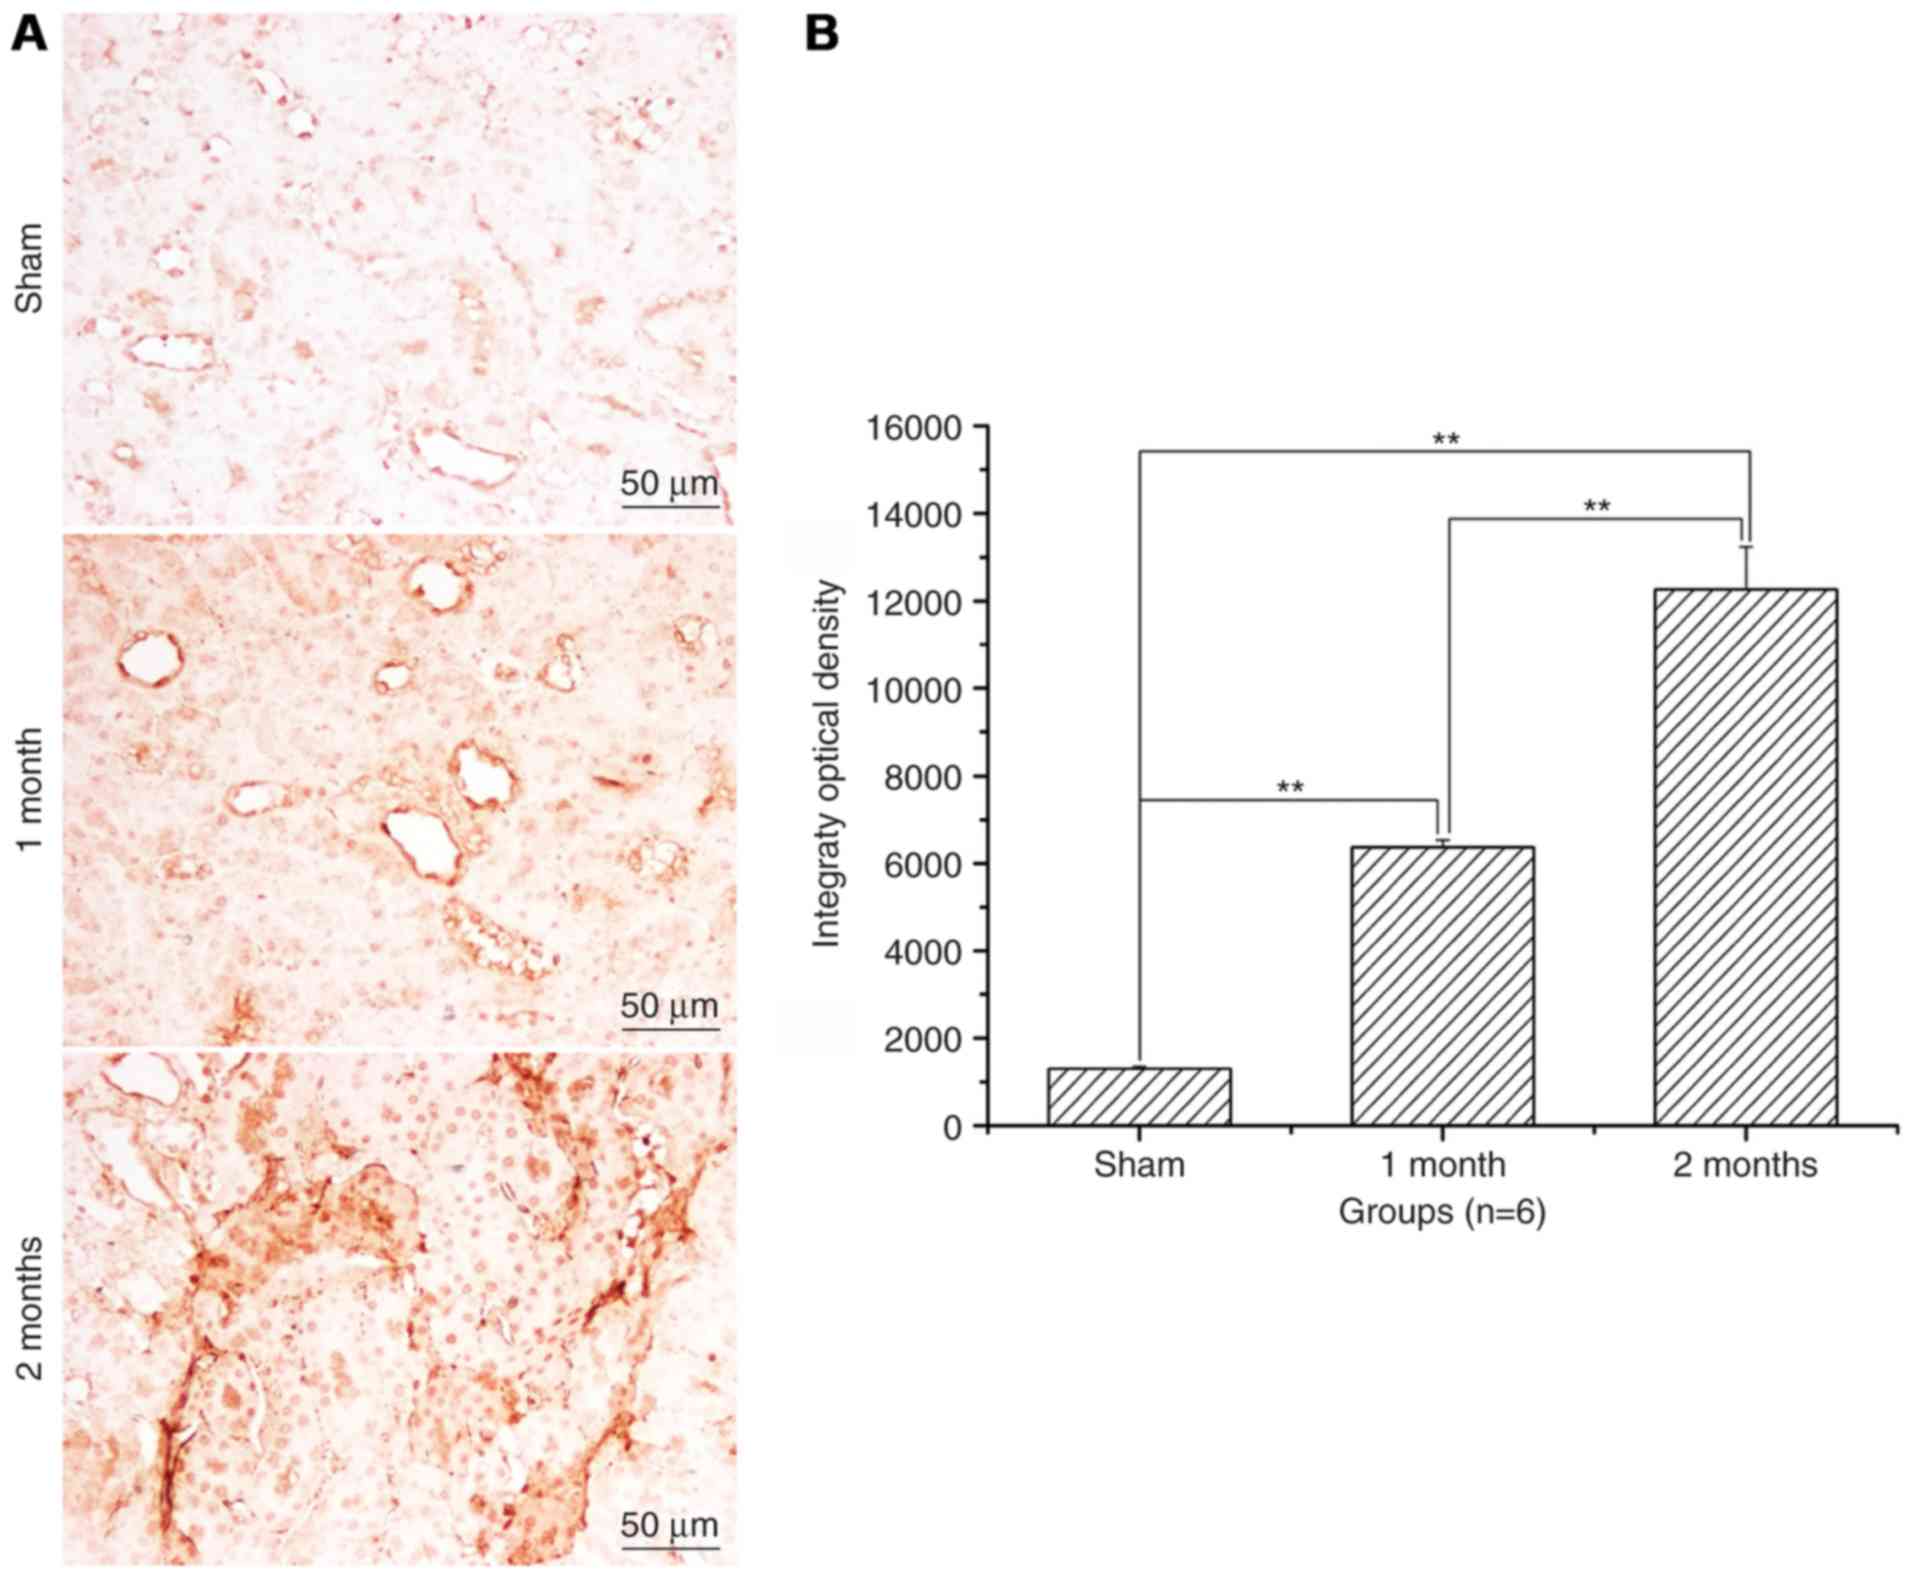
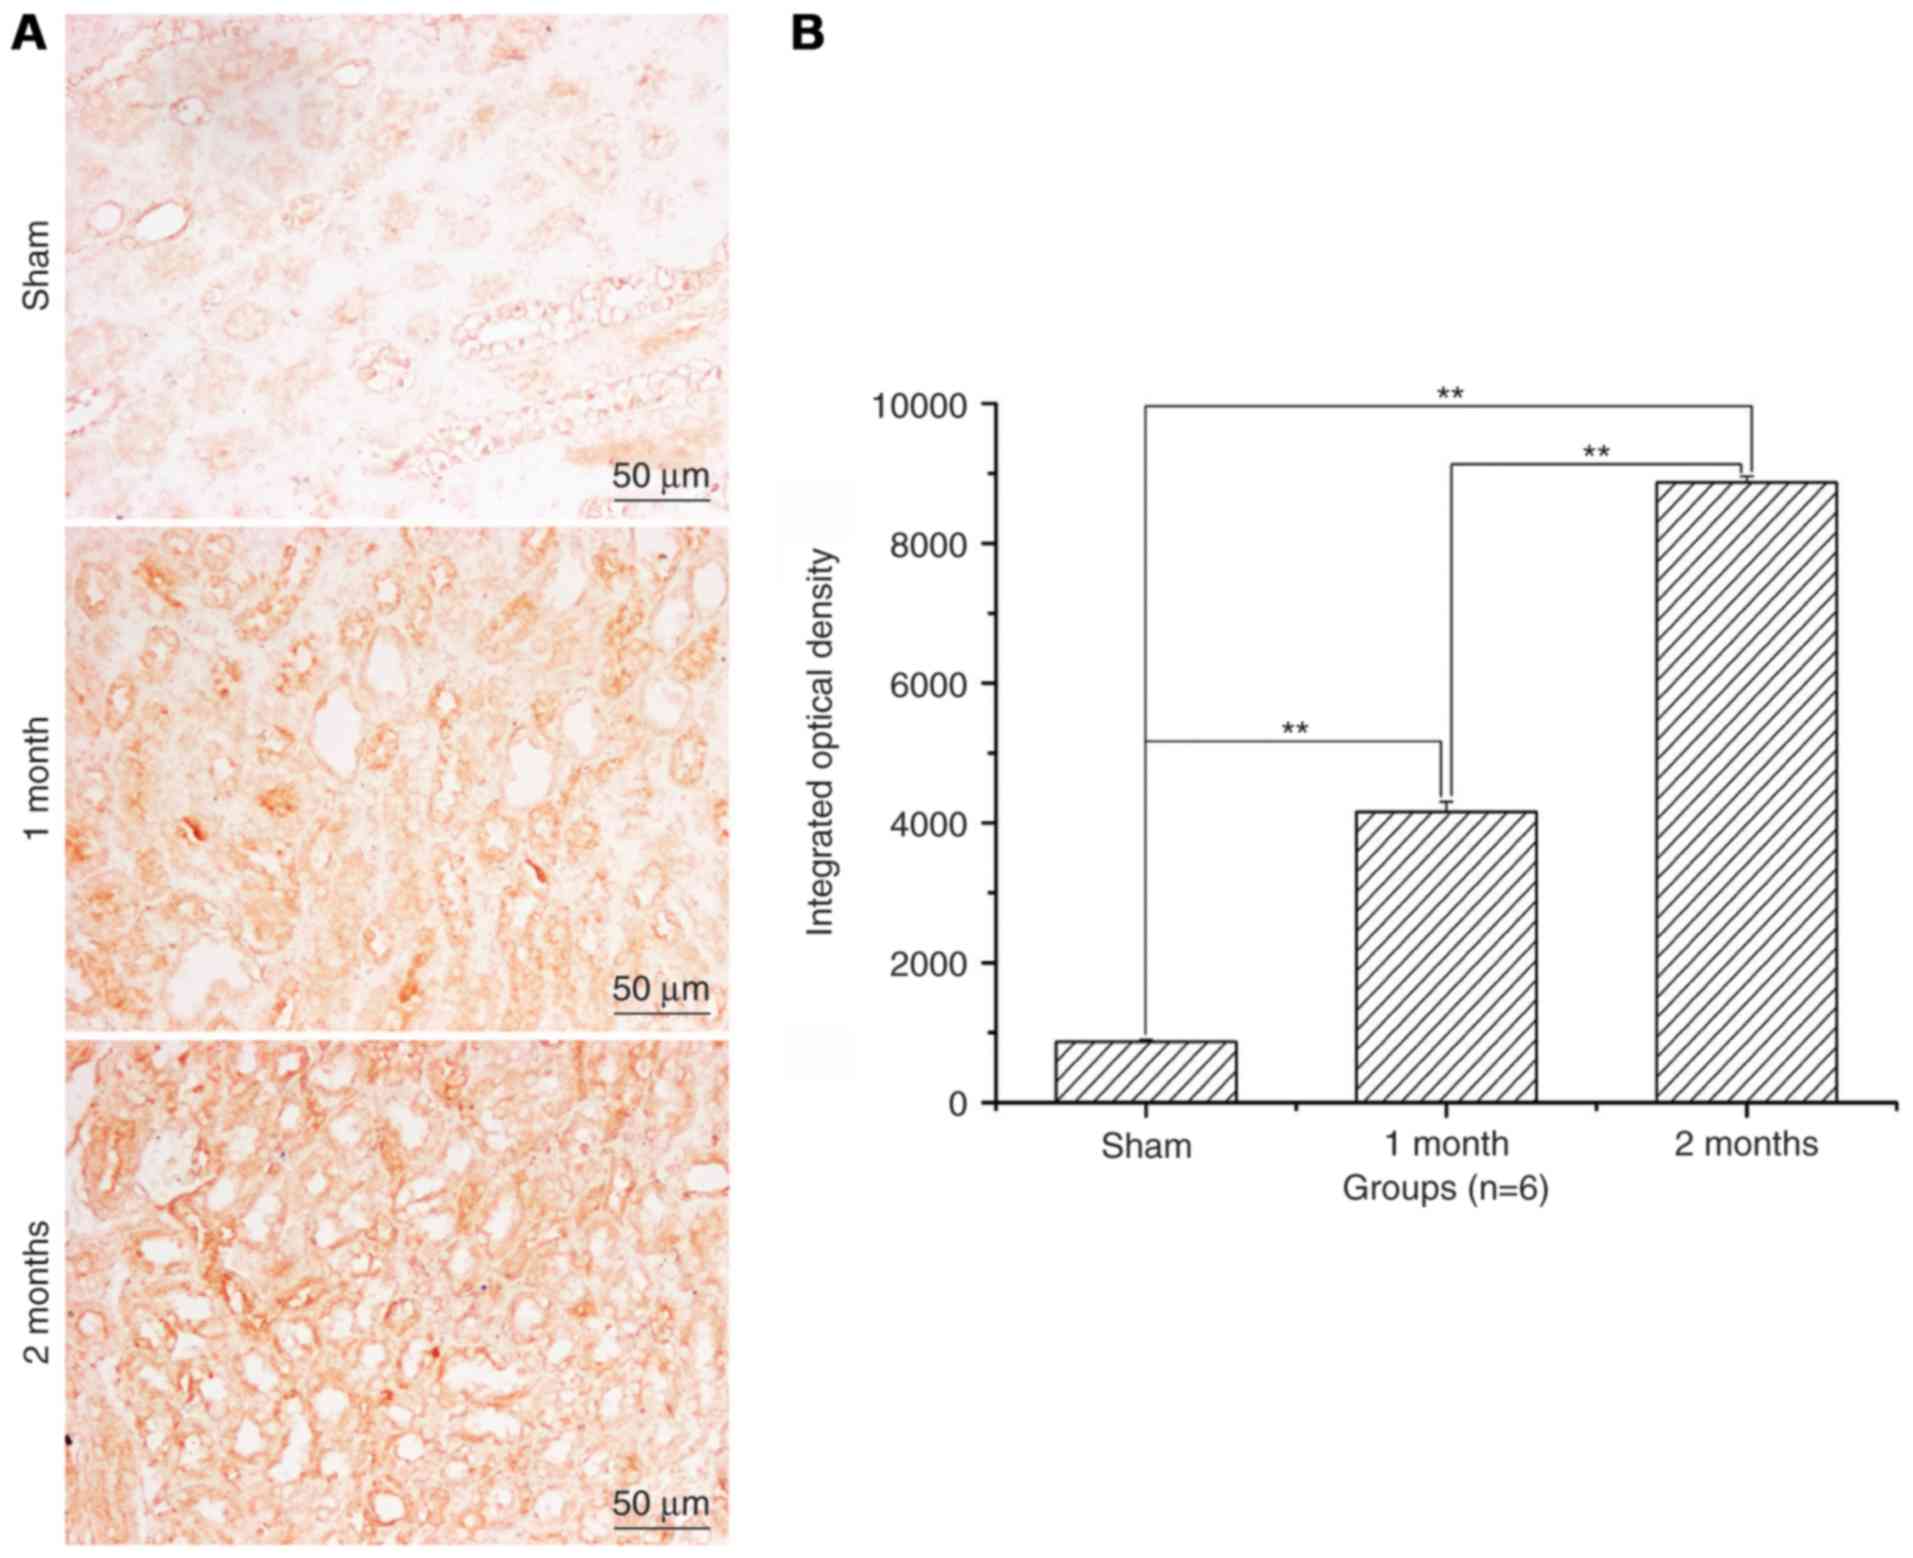
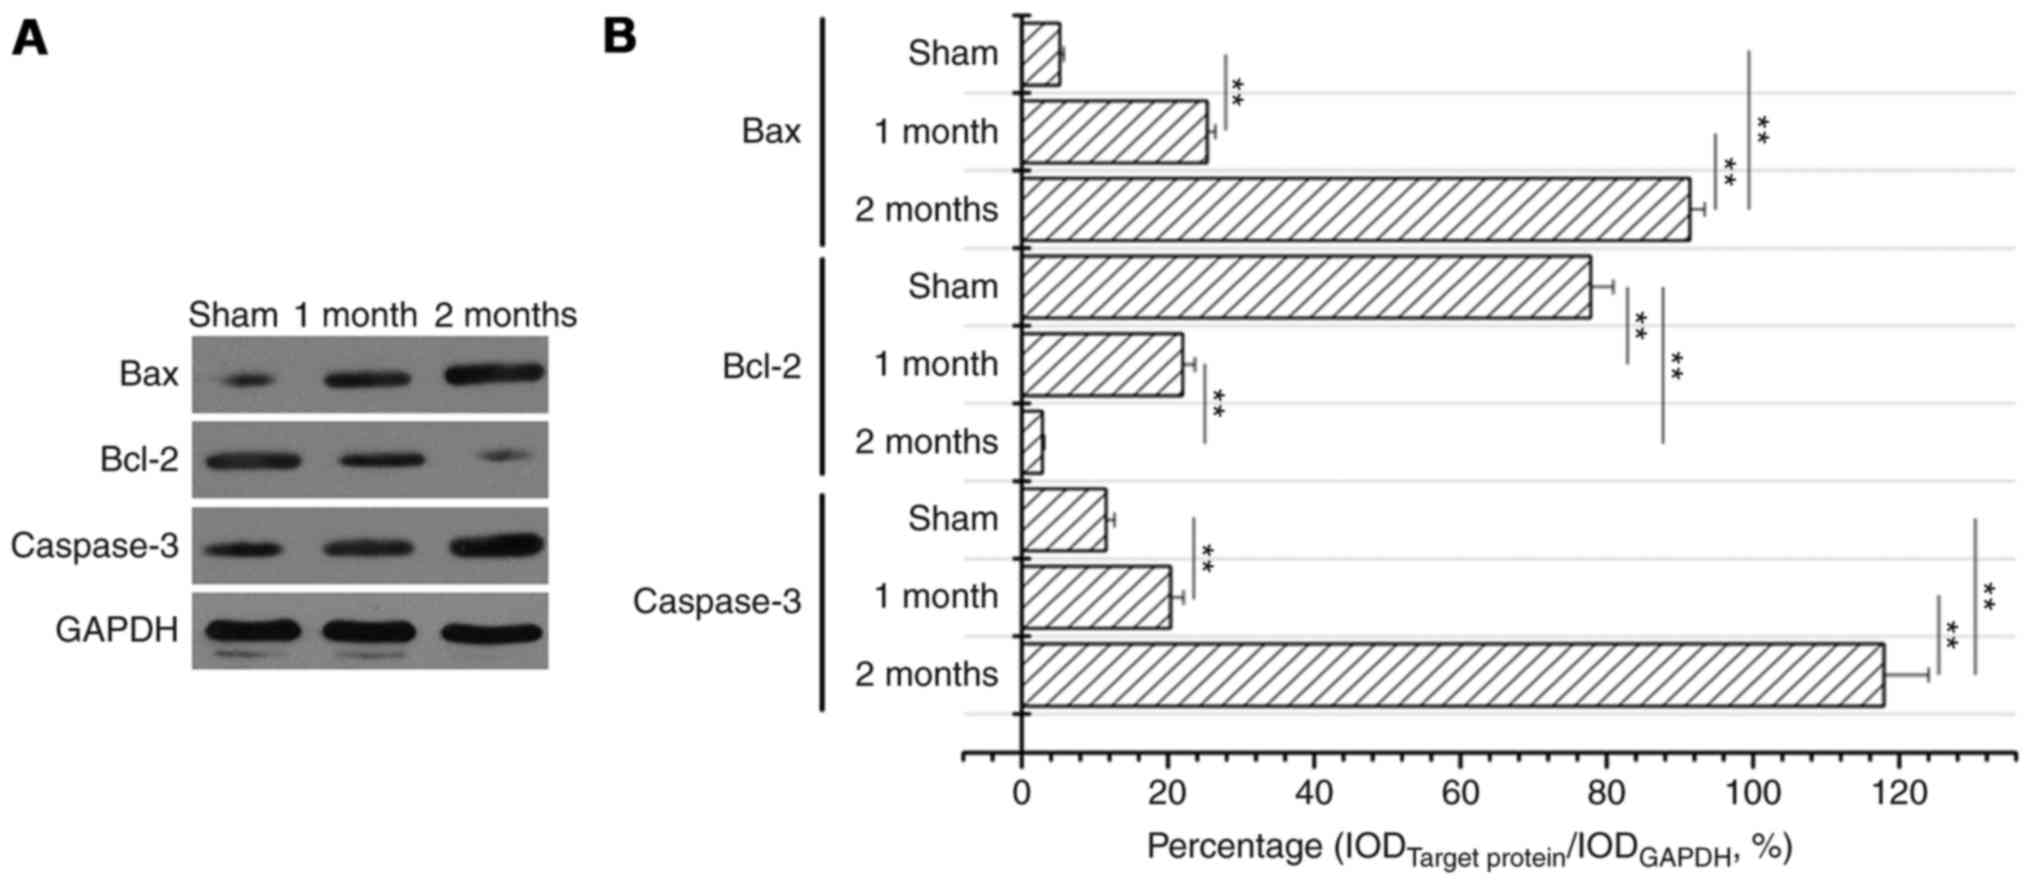
The expression levels of Bax and
caspase-3 significantly increase and of Bcl-2 significantly
decrease in the streptozotocin-induced DN model group
Following treatment with streptozotocin, Bax protein
expression levels were significantly increased in the 1 and 2 month
model groups compared with the sham group (P<0.01, Fig. 3) and the increase was greater in
the 2 month model group compared with the 1 month model group
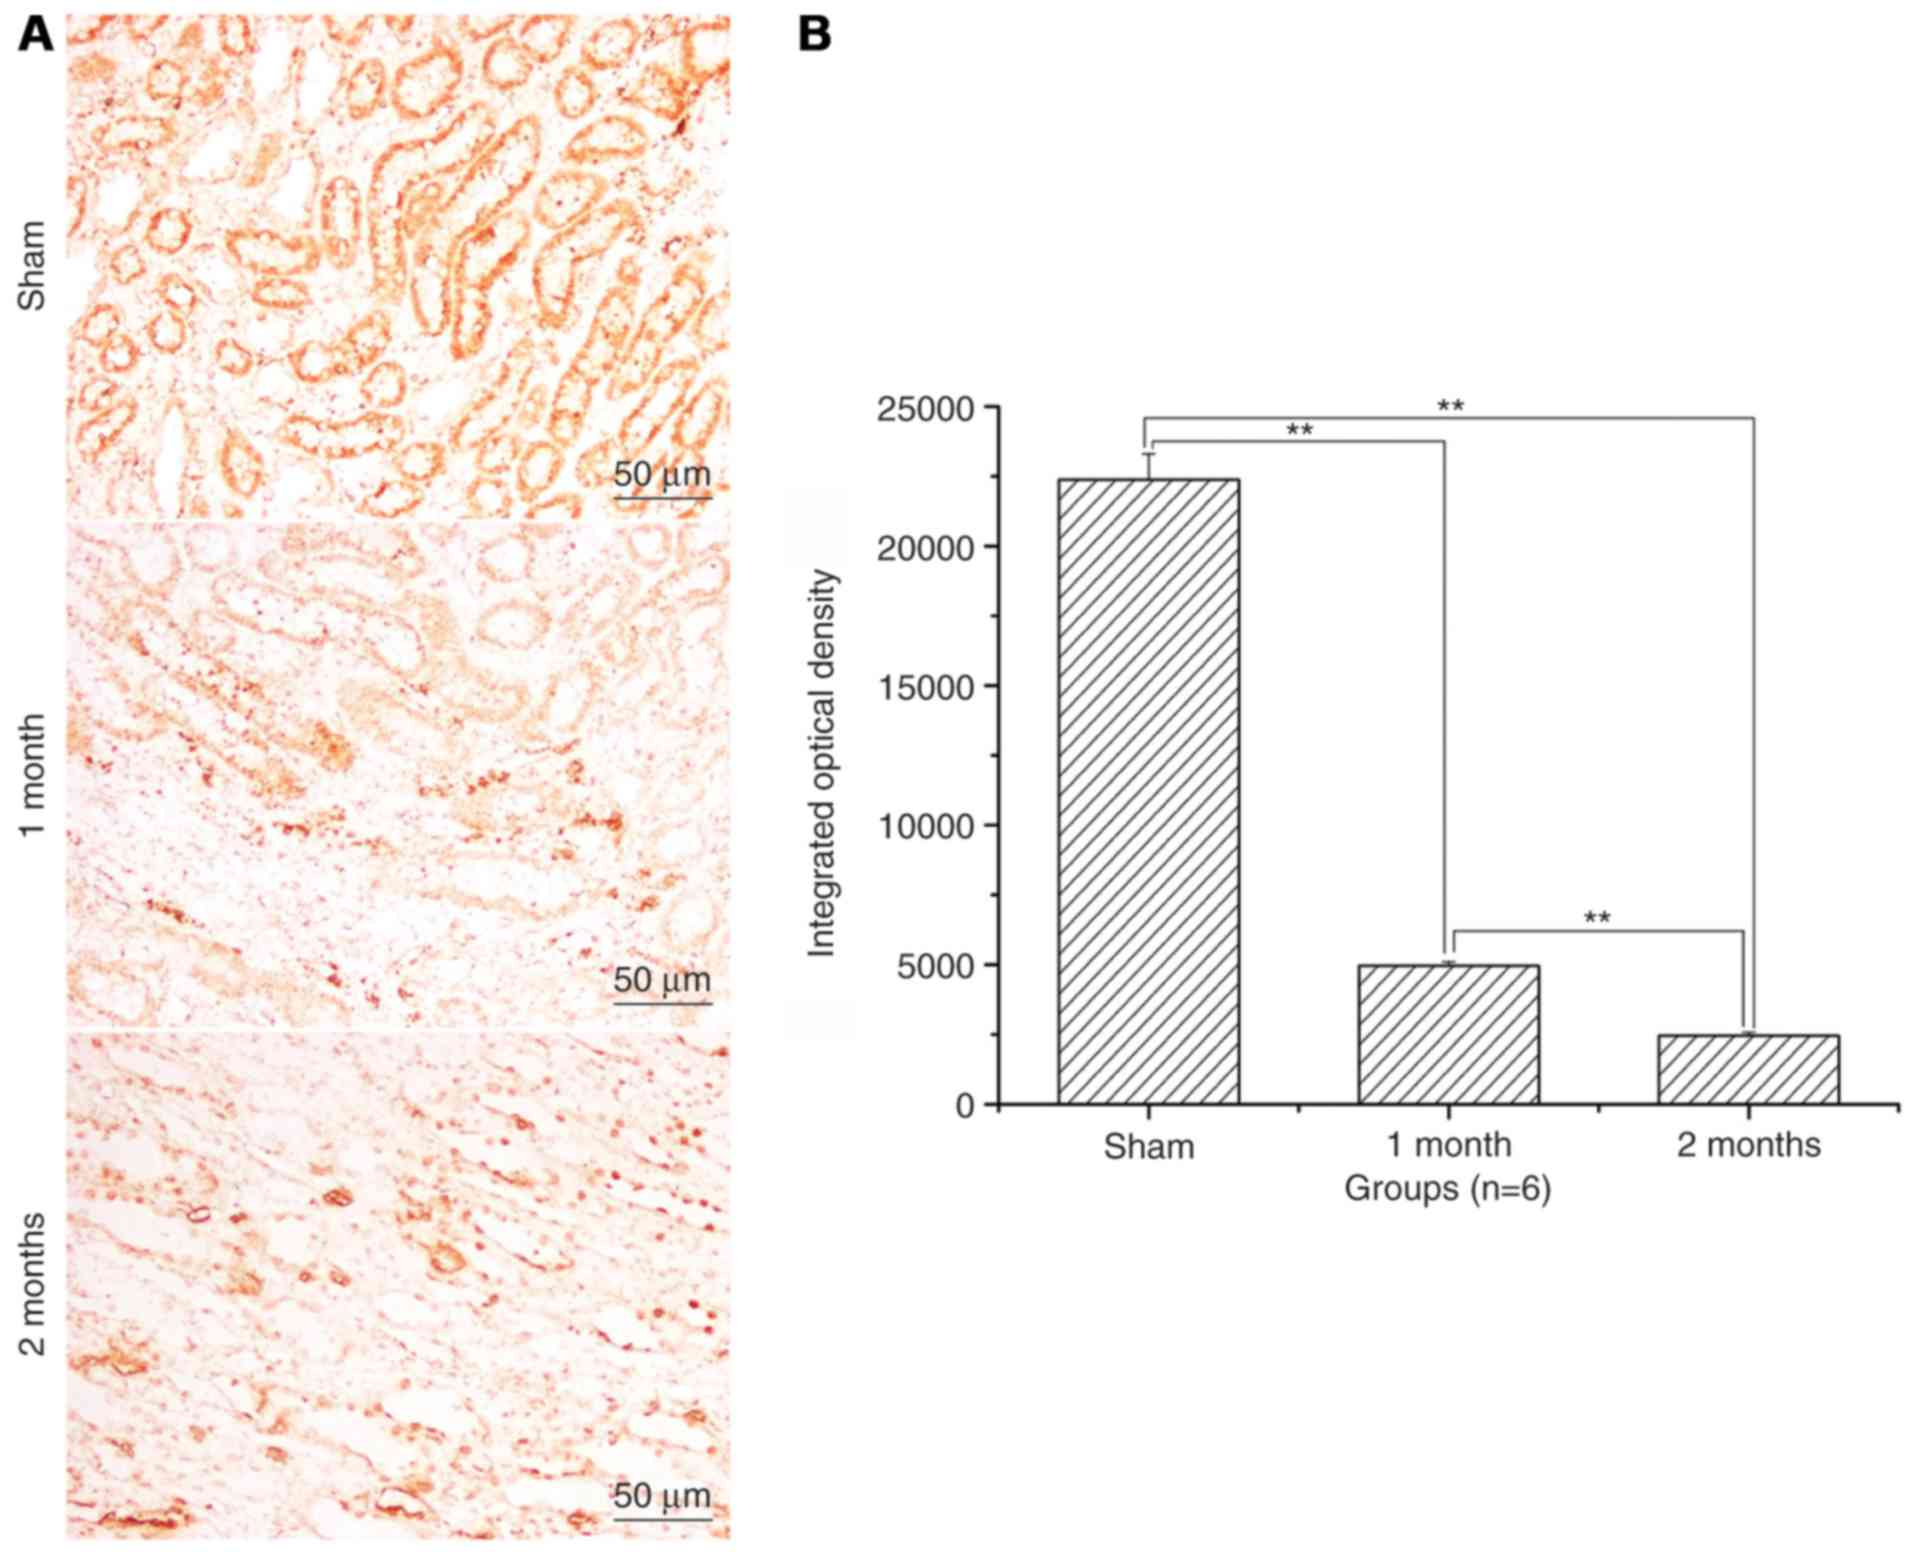
(P<0.01; Fig. 3). Bcl-2 protein
expression levels were significantly decreased in 1 month model
group and 2 months model group when compared to that of sham
(P<0.01; Fig. 4). Caspase-3
protein expression levels were also significantly increased in the
diabetes model group compared with the sham group (P<0.01;
Fig. 5). Western blotting also
confirmed these observations (Fig.
6).
Discussion
The present study demonstrated that the
streptozotocin-induced DN model was established in rats, and these
rats exhibited reduced body weight and higher blood glucose levels
compared with sham rats. Diabetic model rats additionally had lower
expression levels of SOD and GSH-Px, and the higher expression of
MDA, IL-6, TNF-α and TGF-β in their kidneys than that of sham group
rats. Additionally, renal cells were loosely packed and severely
damaged, and apoptosis was significantly increased with time in
diabetic rats. The expression levels of Bax and caspase-3 were
increased, and expression of Bcl-2 was decreased in diabetic rats.
Streptozotocin may increase or decrease the oxidative stress index
and inflammatory cytokines to further enhance apoptosis in DN.
Streptozotocin is a natural glucosamine nitrosourea
compound, and was originally identified as an antibiotic in 1959 by
Vavra et al (25), and may
induce DNA damage of β cells of the pancreas islets in mammals
(26–28). When pancreas islets cells were
damaged by streptozotocin, blood glucose levels were regulated by
production of the hormone insulin (14,16).
In the present study, the blood glucose of rats in the diabetes
model group was rapidly increased at 20 days, and was steadily
maintained for ≥60 days. In addition, diabetic symptoms of
hyperphagia, hyperposia and hyperuresis appeared at 3 days and this
was followed by slow movements, emaciation, hypomotility and
withered fur (data not shown). Pathological features of the kidney
included loosely packed cells, severe inflammatory cell invasion,
increasing amounts of interstitial matrix and hypertrophy with
vacuolar degeneration of renal tubular cells. Apoptosis is a form
of programmed cell death that is characterized by cell shrinkage,
chromatin condensation and DNA fragmentation. TUNEL staining
demonstrated that renal apoptosis was significantly increased in
the diabetes model group.
DN causes a number of alterations to metabolism and
blood circulation, and large amounts of reactive oxygen species
(ROS) and inflammatory molecules are produced (29–31).
MDA is a terminal product of lipid peroxide and its expression
levels may indirectly reflect the degree of cell damage (32). SOD and GSH-Px are free radical
scavenging enzyme system members which serve an important role in
oxidative stress and anti-oxidative stress (29–31).
IL-6 is an inflammatory cytokine that acts as both a
pro-inflammatory cytokine and an anti-inflammatory cytokine during
an immune response (33,34). TNF-α is a cell signaling cytokine
involved in systemic inflammation and serves a role in the
regulation of immune cells (35,36).
TGF-β is a pleiotropic cytokine that serves fundamental roles in
the development and physiology of diverse animal species (35). To elucidate these indexes in
streptozotocin-induced DN model, the concentrations of MDA, SOD,
GSH-Px, IL-6, TNF-α and TGF-β was measured by ELISA. Higher
concentrations of MDA, IL-6, TNF-α and TGF-β, and lower
concentrations of SOD and GSH-Px, were detected in the diabetes
model group. Results also suggested that abnormal metabolism and
apoptosis of renal cells in DN was more apparent at 2 months than
at 1 month induction with streptozotocin.
Apoptosis is a process of programmed cell death that
occurs in multicellular organisms. In addition to its importance as
a biological phenomenon, defective apoptotic processes have been
implicated in a variety of diseases (37,38).
Factors including Fas receptors and caspases promote apoptosis,
whereas certain members of the Bcl-2 family of proteins inhibit
apoptosis (39,40). Bcl-2 is considered to be an
important anti-apoptotic protein whereas Bax acts as a
pro-apoptotic regulator (41).
Caspase-3 serves a central role in the transduction of endoplasmic
reticulum apoptotic signals (42,43).
Having demonstrated that apoptosis contributes to the development
of DN, apoptosis proteins were further investigated, including
Bcl-2, Bax and caspase-3. Expression of Bax and caspase-3 was
increased with prolonged streptozotocin induction; however, Bcl-2
was decreased, which suggested that apoptosis contributed to the
development of DN in rats. Due to the limited amount of funding and
available drug interventions, only certain therapies that reduce
cell apoptosis are studied in DN.
In conclusion, streptozotocin induced DN in rats and
induced a change in morphological structure, oxidative stress
indexes, inflammatory cytokines and apoptosis. Apoptosis may
contribute to the development of DN in rats.
Acknowledgements
The present study was sponsored by the Natural
Science Foundation of Shandong Province (grant no. ZR2014JL024) and
the Project of Shandong Province Higher Educational Science and
Technology Program (grant no. J13LE04).
References
|
1
|
Zhang Y, Liu T, Chen Y, Dong Z, Zhang J,
Sun Y, Jin B, Gao F, Guo S and Zhuang R: CD226 reduces endothelial
cell glucose uptake under hyperglycemic conditions with
inflammation in type 2 diabetes mellitus. Oncotarget.
7:12010–12023. 2016. View Article : Google Scholar : PubMed/NCBI
|
|
2
|
Song SO, Song YD, Nam JY, Park KH, Yoon
JH, Son KM, Ko Y and Lim DH: Epidemiology of type 1 diabetes
mellitus in Korea through an investigation of the national
registration project of type 1 diabetes for the reimbursement of
glucometer strips with additional analyses using claims data.
Diabetes Metab J. 40:35–45. 2016. View Article : Google Scholar : PubMed/NCBI
|
|
3
|
Bhatt AB, Mulvey CK, Qasim AN, Nair JV,
Rickels MR, Prenner SB, Iqbal N and Reilly MP: Selective
association of electrocardiographic abnormalities with insulin
sensitivity and beta-cell function in type 2 diabetes mellitus: A
cross sectional analysis. Diabetes Metab Res Rev. 32:736–744. 2016.
View Article : Google Scholar : PubMed/NCBI
|
|
4
|
Zhou J, Du X, Long M, Zhang Z, Zhou S and
Qian G: Neuroprotective effect of berberine is mediated by MAPK
signaling pathway in experimental diabetic neuropathy in rats. Eur
J Pharmacol. 774:87–94. 2016. View Article : Google Scholar : PubMed/NCBI
|
|
5
|
Tesfaye S, Selvarajah D, Gandhi R, Greig
M, Shillo P, Fang F and Wilkinson ID: Diabetic peripheral
neuropathy may not be as its name suggests: Evidence from magnetic
resonance imaging. Pain. 157 Suppl 1:S72–S80. 2016. View Article : Google Scholar : PubMed/NCBI
|
|
6
|
Erbaş O, Oltulu F, Yilmaz M, Yavaşoğlu A
and Taşkıran D: Neuroprotective effects of chronic administration
of levetiracetam in a rat model of diabetic neuropathy. Diabetes
Res Clin Pract. 114:106–116. 2016. View Article : Google Scholar : PubMed/NCBI
|
|
7
|
Motawi TK, Darwish HA, Hamed MA, El-Rigal
NS and Naser AFA: A therapeutic insight of niacin and coenzyme Q10
against diabetic encephalopathy in rats. Mol Neurobiol.
54:1601–1611. 2017. View Article : Google Scholar : PubMed/NCBI
|
|
8
|
Cai XJ, Xu HQ and Lu Y: C-peptide and
diabetic encephalopathy. Chin Med Sci J. 26:119–125. 2011.
View Article : Google Scholar : PubMed/NCBI
|
|
9
|
Wang YY, Zhang D, Jiang ZY, Lu XQ, Zheng
X, Yu YJ, Wang YG and Dong J: Positive association between
betatrophin and diabetic retinopathy risk in type 2 diabetes
patients. Horm Metab Res. 48:169–173. 2016. View Article : Google Scholar : PubMed/NCBI
|
|
10
|
Micheletti JM, Hendrick AM, Khan FN,
Ziemer DC and Pasquel FJ: Current and next generation portable
screening devices for diabetic retinopathy. J Diabetes Sci Technol.
10:295–300. 2016. View Article : Google Scholar : PubMed/NCBI
|
|
11
|
Ebrahimi MH and Gharibi H: A case study of
a patient with diabetic retinopathy. Diabetes Metab Syndr.
10:166–168. 2016. View Article : Google Scholar : PubMed/NCBI
|
|
12
|
Zheng Z and Zheng F: Immune cells and
inflammation in diabetic nephropathy. J Diabetes Res.
2016:18416902016. View Article : Google Scholar : PubMed/NCBI
|
|
13
|
Skov J, Christiansen JS and Poulsen PL:
Hypertension and diabetic nephropathy. Endocr Dev. 31:97–107. 2016.
View Article : Google Scholar : PubMed/NCBI
|
|
14
|
Lytvyn Y, Bjornstad P, Pun N and Cherney
DZ: New and old agents in the management of diabetic nephropathy.
Curr Opin Nephrol Hypertens. 25:232–239. 2016. View Article : Google Scholar : PubMed/NCBI
|
|
15
|
Zheng S, Powell DW, Zheng F, Kantharidis P
and Gnudi L: Diabetic nephropathy: Proteinuria, inflammation, and
fibrosis. J Diabetes Res. 2016:52415492016. View Article : Google Scholar : PubMed/NCBI
|
|
16
|
Wanchoo R and Jhaveri KD: Nephrology
crosswords: Diabetic nephropathy. Kidney Int. 88:647–648. 2015.
View Article : Google Scholar : PubMed/NCBI
|
|
17
|
Chan GC and Tang SC: Diabetic nephropathy:
Landmark clinical trials and tribulations. Nephrol Dial Transplant.
31:359–368. 2016. View Article : Google Scholar : PubMed/NCBI
|
|
18
|
Zhang Y, Yang J, Zheng M, Wang Y, Ren H,
Xu Y, Yang Y, Cheng J, Han F, Yang X, et al: Clinical
characteristics and predictive factors of subclinical diabetic
nephropathy. Exp Clin Endocrinol Diabetes. 123:132–138. 2015.
View Article : Google Scholar : PubMed/NCBI
|
|
19
|
Barchetta I, Guglielmi C, Bertoccini L,
Calella D, Manfrini S, Secchi C, Pozzilli P and Cavallo MG: IMDIAB
group: Therapy with proton pump inhibitors in patients with type 2
diabetes is independently associated with improved glycometabolic
control. Acta Diabetol. 52:873–880. 2015. View Article : Google Scholar : PubMed/NCBI
|
|
20
|
Bhat KG and Periasamy PK: Effect of
long-term transfusion therapy on the glycometabolic status and
pancreatic Beta cell function in patients with Beta thalassemia
major. J Family Med Prim Care. 3:119–123. 2014. View Article : Google Scholar : PubMed/NCBI
|
|
21
|
Chen B, Niu YW, Xie T, Miao MY, Tian M, Ji
XY, Qing C and Lu SL: Relationship between cutaneous glycometabolic
disorders and cutaneous neuropathy in diabetic rats. Zhonghua Shao
Shang Za Zhi. 27:139–144. 2011.(In Chinese). PubMed/NCBI
|
|
22
|
Tian ML, Shen Y, Sun ZL and Zha Y:
Efficacy and safety of combining pentoxifylline with
angiotensin-converting enzyme inhibitor or angiotensin II receptor
blocker in diabetic nephropathy: A meta-analysis. Int Urol Nephrol.
47:815–822. 2015. View Article : Google Scholar : PubMed/NCBI
|
|
23
|
Patil MR, Mishra A, Jain N, Gutch M and
Tewari R: Weight loss for reduction of proteinuria in diabetic
nephropathy: Comparison with angiotensin-converting enzyme
inhibitor therapy. Indian J Nephrol. 23:108–113. 2013. View Article : Google Scholar : PubMed/NCBI
|
|
24
|
Abu-Romeh SH, Nawaz MK, Ali JH, Al-Suhaili
AR and Abu-Jayyab AK: Short-term effect of angiotensin-converting
enzyme inhibitor enalapril in incipient diabetic nephropathy. Clin
Nephrol. 31:18–21. 1989.PubMed/NCBI
|
|
25
|
Vavra JJ, Deboer C, Dietz A, Hanka LJ and
Sokolski WT: Streptozotocin, a new antibacterial antibiotic.
Antibiot Annu. 7:230–235. 1959.PubMed/NCBI
|
|
26
|
Zhu D, Zhang L, Cheng L, Ren L, Tang J and
Sun D: Pancreatic kininogenase ameliorates renal fibrosis in
streptozotocin induced-diabetic nephropathy rat. Kidney Blood Press
Res. 41:9–17. 2016. View Article : Google Scholar : PubMed/NCBI
|
|
27
|
Zhang Y, Hu T, Zhou H, Jin G and Yang Y:
Antidiabetic effect of polysaccharides from Pleurotus ostreatus in
streptozotocin-induced diabetic rats. Int J Biol Macromol.
83:126–132. 2016. View Article : Google Scholar : PubMed/NCBI
|
|
28
|
Yeh PT, Huang HW, Yang CM, Yang WS and
Yang CH: Astaxanthin inhibits expression of retinal oxidative
stress and inflammatory mediators in streptozotocin-induced
diabetic rats. PLoS One. 11:e01464382016. View Article : Google Scholar : PubMed/NCBI
|
|
29
|
Lindblom R, Higgins G, Coughlan M and de
Haan JB: Targeting mitochondria and reactive oxygen species-driven
pathogenesis in diabetic nephropathy. Rev Diabet Stud. 12:134–156.
2015. View Article : Google Scholar : PubMed/NCBI
|
|
30
|
Nishikawa T, Brownlee M and Araki E:
Mitochondrial reactive oxygen species in the pathogenesis of early
diabetic nephropathy. J Diabetes Investig. 6:137–139. 2015.
View Article : Google Scholar : PubMed/NCBI
|
|
31
|
Ha H, Hwang IA, Park JH and Lee HB: Role
of reactive oxygen species in the pathogenesis of diabetic
nephropathy. Diabetes Res Clin Pract. 82 Suppl 1:S42–S45. 2008.
View Article : Google Scholar : PubMed/NCBI
|
|
32
|
Utsumi K, Yasuda F, Watanabe Y, Higo S,
Hirama A, Fujita E, Ueda K, Mii A, Kaneko T, Mishina M, et al:
Effects of olmesartan and imidapril on the plasma adiponectin,
P-selectin, and MDA-LDL levels of diabetic nephropathy patients.
Clin Chim Acta. 413:348–349. 2012. View Article : Google Scholar : PubMed/NCBI
|
|
33
|
Rakitianskaia IA, Riabov SI, Dubrova AG,
Azanchevskaia SV, Riabova TS and Gurkov AS: The role of IL-6 in the
development of morphological changes in renal tissue in elderly
patients with type 2 diabetes complicated by diabetic nephropathy.
Adv Gerontol. 25:632–637. 2012.(In Russian). PubMed/NCBI
|
|
34
|
Svensson MK and Eriksson JW: Change in the
amount of body fat and IL-6 levels is related to altered insulin
sensitivity in type 1 diabetes patients with or without diabetic
nephropathy. Horm Metab Res. 43:209–215. 2011. View Article : Google Scholar : PubMed/NCBI
|
|
35
|
Guclu A, Erken HA, Erken G, Dodurga Y, Yay
A, Özçoban Ö, Şimşek H, Akçılar A and Koçak FE: The effects of
ozone therapy on caspase pathways, TNF-α, and HIF-1α in diabetic
nephropathy. Int Urol Nephrol. 48:441–450. 2016. View Article : Google Scholar : PubMed/NCBI
|
|
36
|
Navarro JF and Mora-Fernández C: The role
of TNF-alpha in diabetic nephropathy: Pathogenic and therapeutic
implications. Cytokine Growth Factor Rev. 17:441–450. 2006.
View Article : Google Scholar : PubMed/NCBI
|
|
37
|
Elsherbiny NM, Al-Gayyar MM and Abd El
Galil KH: Nephroprotective role of dipyridamole in diabetic
nephropathy: Effect on inflammation and apoptosis. Life Sci.
143:8–17. 2015. View Article : Google Scholar : PubMed/NCBI
|
|
38
|
Susztak K, Raff AC, Schiffer M and
Böttinger EP: Glucose-induced reactive oxygen species cause
apoptosis of podocytes and podocyte depletion at the onset of
diabetic nephropathy. Diabetes. 55:225–233. 2006. View Article : Google Scholar : PubMed/NCBI
|
|
39
|
Ghule AE, Jadhav SS and Bodhankar SL:
Trigonelline ameliorates diabetic hypertensive nephropathy by
suppression of oxidative stress in kidney and reduction in renal
cell apoptosis and fibrosis in streptozotocin induced neonatal
diabetic (nSTZ) rats. Int Immunopharmacol. 14:740–748. 2012.
View Article : Google Scholar : PubMed/NCBI
|
|
40
|
Baba K, Minatoguchi S, Sano H, Kagawa T,
Murata I, Takemura G, Hirano T, Ohashi H, Takemura M, Fujiwara T
and Fujiwara H: Involvement of apoptosis in patients with diabetic
nephropathy: A study on plasma soluble Fas levels and pathological
findings. Nephrology (Carlton). 9:94–99. 2004. View Article : Google Scholar : PubMed/NCBI
|
|
41
|
Borkan SC: The role of BCL-2 family
members in acute kidney injury. Semin Nephrol. 36:237–250. 2016.
View Article : Google Scholar : PubMed/NCBI
|
|
42
|
Kuribayashi K, Mayes PA and El-Deiry WS:
What are caspases 3 and 7 doing upstream of the mitochondria?
Cancer Biol Ther. 5:763–765. 2006. View Article : Google Scholar : PubMed/NCBI
|
|
43
|
Lakhani SA, Masud A, Kuida K, Porter GA
Jr, Booth CJ, Mehal WZ, Inayat I and Flavell RA: Caspases 3 and 7:
Key mediators of mitochondrial events of apoptosis. Science.
311:847–851. 2006. View Article : Google Scholar : PubMed/NCBI
|