Introduction
Major depressive disorder (MDD), a severely
debilitating mental disease, negatively affects the quality of life
of a substantial percentage of the world population, and is
associated with a lifetime morbidity of 4.4–20% (1). It is predicted that MDD will be the
second most common illness in 2020, according to the 1990 Global
Burden of Illness list. It is estimated that the economic burden of
depression was $52.9 billion in 1990 and $83.1 billion in 2000 in
the United States (2,3). Therefore, much attention has been
given to depression research worldwide. Over the last few decades,
many pathogenetic mechanisms have been put forward for MDD
(4). However, the molecular
mechanisms of MDD remain largely unknown. It is therefore urgent to
elucidate the underlying mechanisms of MDD.
To gain insight into the pathogenesis of depression,
our team previously used a proteomics approach on human plasma.
However, the differential proteins in Xu et al (5) were different from those in Yang et
al (6) and Song et al
(7). A possible reason for the
lack of concordance is variability in the factors that cause
depression. The pathogenesis of depression may therefore differ
among patients, accounting for the varying proteomic changes.
Furthermore, some patients might have taken antidepressants that
affect the metabolism of proteins in plasma (8). Therefore, we established a mouse
model of chronic unpredictable mild stress (CUMS) to acquire more
robust data (9). In this model,
mice in the CUMS group are exposed to the same stressors at the
same time. Both physical and mental stressors are given to imitate
the risk factors that depressive patients encounter in daily life.
Hence, the CUMS model might well mimic human depression, and plasma
from CUMS mice might help clarify the molecular changes in the
disease.
MDD is a mental illness, and therefore,
cerebrospinal fluid (CSF) and brain tissue samples might be better
for proteomic studies investigating the molecular mechanisms of
MDD; however, such samples are not practically accessible for
living human subjects. In contrast, plasma samples can be obtained
easily. Moreover, the pathogenesis of depression involves several
brain regions, while most published papers only examine one region
at a time (10–12). CSF, plasma and brain tissue
exchange their molecular components through the blood-brain and
CSF-brain barriers, which suggests that some proteins might be
exchanged between the central nervous system and the peripheral
circulation (13,14). Therefore, plasma samples might be
better for examining the pathogenesis of depression (15).
Proteomics is a hypothesis-free approach, and it is
a useful tool for discovering novel molecules involved in the
pathogenesis of disease. It has been applied in a wide range of
diseases, such as depression, schizophrenia and other psychiatric
illnesses (16). In the present
study, isobaric tags for relative and absolute quantitation (iTRAQ)
was employed for identifying proteins differentially expressed
between CON and CUMS mice. Furthermore, some of the proteins
involved in the significantly changed pathways were validated by
western blotting.
Materials and methods
Animals
A total of 40 adult male mice (8–10 weeks of age)
were bought from Chongqing Medical University's animal facility.
Unless indicated otherwise, the mice were maintained under standard
conditions (12h-12 h light-dark cycle, lights on from 07:00 a.m. to
07:00 p.m.; temperature: 23±1°C; relative humidity of 40–60%; food
and water available ad libitum). Chongqing Medical
University's Ethics Committee approved all procedures, which were
in accordance with the National Institutes of Health's Animal
Research Guide. Efforts were made to reduce the number of deaths
and to minimize suffering. (9).
CUMS protocol
The CUMS protocol was carried out according to our
previously published papers, with some minor modifications. After
adaptation and sucrose preference training, each lasting a week,
mice were isolated into two groups: CUMS group (n=20) and
CON group (n=20). The mice in the CUMS group were subjected
to various repeated unpredictable mild stressors for 4 weeks,
during which the sucrose preference test was performed. Minor
stress sources included deprivation of water and food, paired
housing, wet bedding, 45° cage tilt, night lighting, white noise,
strobe, and odor exposure. All stressors were applied in a random
order, and we did not repeat the same stressors over 2 consecutive
days.
Behavioral test
The sucrose preference test (SPT) is one of the most
important tests for evaluating depressive symptoms in mice. After 1
week of adaptation to the environment, each mouse was trained using
two bottles of water for 1 week, one with 1% sucrose solution and
the other with tap water. According to the baseline of sucrose
preference, the mice were segregated into two groups with no
significant difference. One group was exposed to CUMS stressors,
while the other group was kept under standard conditions. Sucrose
preference was measured starting at 8 am every Sunday morning for
24 h. During the test, the mice were placed in separate cages with
equal access to the two bottles. The location of the two bottles
was changed randomly to avoid position preference. The total weight
consumed by the mouse was measured. Sucrose preference (SP) was
calculated as follows: SP=(weight of 1% sucrose solution
consumed/[the weight of 1% sucrose solution consumed + the weight
of water consumed]) × 100%.
Open field testing was used to assess space
exploration behavior. Before the test, the mice were placed in the
experimental room for 30 min. The experiment was carried out in a
soundproof room from 8 am to 1 pm. Only one mouse was placed in the
open field test apparatus (44.5×44.5×45 cm) at a time, and allowed
to freely explore the field for 6 min. The behavior was recorded
and analyzed with an automatic video-tracking system (Smart, Panlab
SL, Barcelona, Spain). The box was thoroughly cleaned with alcohol
after each trial.
The forced swim test, also known as the behavioral
despair test, which evaluates the rodent's response to the threat
of drowning, was carried out in the experimental room from 8 am to
1 pm. In a separate test, the mouse was placed in the apparatus
(height, 30 cm; diameter, 15 cm) for 5 min, and the pool was filled
with tap water. The depth of the water was about 15 cm, and the
water temperature was about 23±1°C. After each trial, the water was
replaced with fresh water. Behavioral recording and analysis were
performed using the Smart system mentioned above.
Immunodepletion of high abundance
plasma proteins
Frozen plasma samples from the two groups (CON
(n=20) and CUMS (n=20) were thawed, and equal-volume
samples from six or seven mice (6,7) for
each group were pooled to minimize the effect of individual
variation (each group therefore generated three pooled samples).
The pooled plasma samples were immunodepleted of high abundance
plasma proteins using a Multiple Affinity Removal LC Column-Mouse 3
(Agilent Technologies, Inc., Santa Clara, CA, USA). The procedure
was carried out according to the manufacturer's instructions. To
evaluate the removal of high abundance proteins, samples of
non-immunodepleted plasma and immunodepleted plasma were separated
on 12.5% SDS-PAGE gels and then stained with Coomassie Blue
(5,17).
iTRAQ labeling, and strong cation
exchange (SCX) fractionation
After removal of high abundance proteins from
plasma, the samples were quantified using the BCA assay. Then,
300-µg samples of total protein for each group were taken out for
analysis. To these samples, 25 µl of SDT solution was added, and
then DTT solution to a final concentration of 100 mM. These samples
were then placed in a boiling water bath for 5 min and then cooled
to room temperature. Thereafter, 200 µl of UA buffer (8 M urea, 150
mM Tris-HCl, pH 8.0) was added, and the samples were then
centrifuged at 14,000 × g for 30 min in a 30-kd ultrafiltration
centrifuge tube. Subsequently, 200 µl of UA buffer was added to the
samples and centrifuged at 14,000 × g for 30 min. After discarding
the filtrate, 100 µl of IAA (50 mM IAA in UA) was added. The
solution was shaken at 600 rpm for 1 min, followed by a 45 min
incubation at room temperature. The samples were then centrifuged
at 14,000 × g for 30 min. Thereafter, 100 µl of UA buffer was added
to the concentrate and centrifuged at 14,000 × g, twice, 30 min
each. After discarding the filtrate, 100 µl of 25 mM ABC was added,
and the solution was centrifuged at 14,000 × g for 30 min. After
discarding the filtrate, 40 µl of trypsin buffer (6 µg trypsin in
40 µl 100 mM ABC) was added. This solution was shaken at 600 rpm
for 1 min followed by a 16-18-hour incubation at 37°C. Then, 40 µl
of 25 mM ABC was added to the previous solution and centrifuged at
14,000 × g for 30 min. Subsequently, 0.1% TFA solution was added,
and the OD280 was measured after desalting on a C18
cartridge (Sigma-Aldrich; Merck KGaA, Darmstadt, Germany). Samples
containing 100 µg of protein were labeled with the AB kit (iTRAQ
Reagent-8plex Multiplex kit (AB Sciex, Foster City, CA, USA)
according to the manufacturer's protocol (113, 114, 115 for the CON
group; 116, 117, 118 for the CUMS group). The parameters used for
SCX fractionation were as follows: AKTA Purifier 100 (GE
Healthcare, Chicago, IL, USA), polysulfoethyl 4.6×100 mm column (5
µm, 200 Å) (PolyLC Inc., Columbia, MD, USA), SCX Buffer A (10 mM
KH2PO4 pH 3.0, 25% CAN), SCX Buffer B (10 mM
KH2PO4 pH 3.0, 500 mM KCl, 25% CAN). The
peptide fragments after iTRAQ labeling were mixed and subjected to
SCX fractionation. For each test, 33 fractions were collected from
each group and then combined into ten pools according to the SCX
chromatogram, which were next desalted with a C18 cartridge
(66872-U; Sigma-Aldrich; Merck KGaA) (9).
Liquid chromatography-tandem mass
spectrometry
Each sample was separated using a nano-flow velocity
HPLC liquid system, Easy nLC (Thermo Fisher Scientific, Inc.,
Waltham, MA, USA), and 0.1% formic acid aqueous solution (buffer A)
and 0.1% formic acid acetonitrile aqueous solution (acetonitrile
84%) (buffer B) were used in the experiment. The column was
equilibrated with 95% buffer A. Then, samples were loaded with the
autosampler onto the Thermo Scientific EASY-column (2 cm ×100 µm, 5
µm-C18) and separated on an analytical column (Thermo Scientific
EASY-column, 75 µm × 100 mm, 3 µm-C18) at a flow rate of 300
nl/min. The liquid phase parameters were as follows: 0 to 55 min,
buffer B from 0 to 50% with a linear gradient; 55 to 57 min, buffer
B from 50 to 100% with a linear gradient; 57 to 60 min, buffer B
maintained at 100%. After separation by capillary high performance
liquid chromatography, each sample was analyzed by mass
spectrometry using a Q-Exactive mass spectrometer (Thermo Finnigan,
San Jose, CA, USA). The parameters were as follows: Analysis time,
60 min; detection method, positive ion; parent ion scanning range,
300–1,800 m/z; primary mass spectrometry resolution, 70,000 at m/z
200; AGC target, 3e6; primary maximum IT, 10 ms; number of scan
ranges, 1; dynamic exclusion, 40.0 s. The mass/charge ratio of the
fragments of the polypeptide and polypeptide were collected using
the following parameters: MS2 activation type, HCD; isolation
window, 2 m/z; secondary mass spectrometry resolution, 17,500 at
m/z 200; microscans, 1; secondary maximum IT, 60 ms; normalized
collision energy, 30 eV; underfill ratio, 0.1%. Subsequently, the
original data was processed with Mascot 2.2 and Proteome Discoverer
1.4 software packages (Thermo Fisher Scientific, Inc.) for
identification and quantitative analysis. The database was
downloaded from Unipart (uniprot_mouse_78469_20150825.fasta,
including 78649 series, downloaded on 2015-07-25). Peptide FDR was
set at ≤0.01 (9).
Ingenuity pathway analysis (IPA)
IPA software has been widely used in proteomics
research (9,11). To determine the significant
canonical pathways, networks of interacting proteins and models of
functions and diseases, we uploaded the differentially expressed
protein lists (with UniProt accession) and the directions of change
of these proteins onto the IPA server (Qiagen, Inc., Valencia, CA,
USA). All these analyses used Fisher's exact test with a
P<0.5.
Western blotting
Frozen plasma samples were thawed and diluted 50
times using 1X PBS and 1X loading buffer. The volume of the loading
buffer was one-fourth of the total volume. The proteins were
denatured at 100°C for 10 min. Following SDS-PAGE, the proteins
were transferred to PVDF membranes. After blocking in 5% non-fat
milk power in TBST for 2 h at room temperature, the PVDF membrane
was incubated for 10 h at 4°C with the following primary
antibodies: Anti-lipopolysaccharide binding protein (LBP) antibody
(1:500; Ruiying Biological, http://www.rlgene.com/), anti-fibrinogen β chain (FGB)
antibody (1:1,000; Sangon Biotech Co., Ltd., Shanghai, China),
anti-α-1 antitrypsin (SERPINA1) antibody (1:1,000; Abcam,
Cambridge, UK), anti-complement factor H antibody (CFH) (1:500;
Abcam). After three washes with THST, the membrane was incubated
with anti-sheep or anti-rabbit secondary antibody (1:10,000) at
room temperature for 2 h, and then the membrane was washed another
three times with TBST (10 min each). The relative intensity of each
protein was calculated with Quantity One software (version 4.6.7;
Bio-Rad Laboratories, Inc., Hercules, CA, USA).
Statistical analysis
All of the data results were presented as mean ±
standard deviation. Analysis of sucrose preference and body weight
of mice was performed using ANOVA method. Behavioral data of the
two groups of mice and the data of western blotting were analyzed
by Student's t-test. All data shown in this study were calculated
by SPSS21.0 (IBM Corp., Armonk, NY, USA) used in our previous
study. The threshold for statistical significance was set at
P<0.05.
Results
Assessment of the CUMS mouse
model
The CUMS mouse model was evaluated using the sucrose
preference test (SPT), body weight measurement, the forced swim
test (FST), and the open-field test (OFT). Given that the plasma
samples used in this study were collected from the same batch of
mice used in our previous publication (9), the results are only briefly described
here. Body weight in the CUMS group was significantly lower than in
the CON group after treatment (P=0.001). The total distance
traveled was not significantly different at baseline, but was
significantly shortened after 28 days of CUMS (P<0.05). Compared
to the CON group, immobility time was significantly increased
(P<0.05) and sucrose preference was significantly lower in the
CUMS group in the last week (P<0.05).
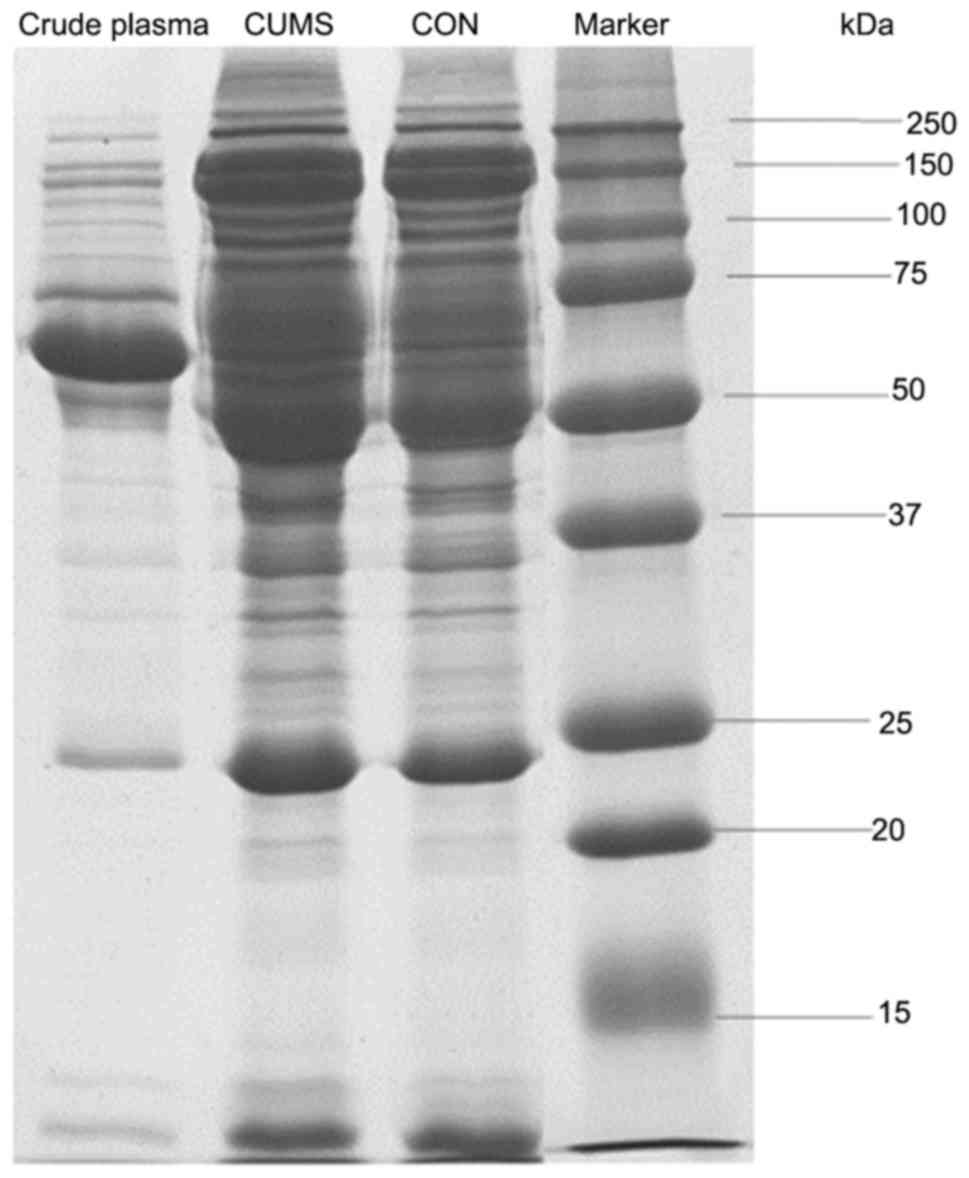
Immunodepletion of high-abundance
proteins
To assess the efficacy of depletion, equal amounts
of sample from each group were loaded onto a one-dimensional
electrophoresis gel. After electrophoresis, the gel was stained
with Coomassie Blue. More protein bands appeared after
immunodepletion comparing with crude plasma samples (Fig. 1). This indicates that
immunodepletion is an appropriate method for concentrating low
abundance proteins.
Plasma analysis by iTRAQ-based
quantitative proteomics
To identify differentially expressed proteins in
CUMS mice compared with CON mice, 2D LC-MS/MS coupled with iTRAQ
labeling was performed. As all samples from each group were mixed
for experimentation, the main concern was systematic variation. It
has been published that the iTRAQ approach for identifying and
quantifying differentially expressed proteins on a large-scale
entails at least a 30% technical variability (18). Therefore, a 1.3-fold change and
unique peptides ≥2 threshold was used, as in our earlier study
(5). Using this cut-off threshold,
47 proteins were found to be significantly differentially expressed
between the CUMS group and the CON group. Among these 47 proteins,
22 were upregulated and the remainder were downregulated in the
CUMS group (Table I).
 | Table I.Significant differentially expressed
proteins identified by an iTRAQ coupled with LC-MS/MS method. |
Table I.
Significant differentially expressed
proteins identified by an iTRAQ coupled with LC-MS/MS method.
| UniProt
accession | Gene symbol | Name | Unique
peptides | CUMS/CON | t-test P-value |
|---|
| Q6LD55 | APOA2 | APOAII | 2 | 0.23 | 1.19E-03 |
| A2APX3 | CST3 | Cystatin-C
(Fragment) | 2 | 0.44 | 3.28E-02 |
| Q9EQI5 | PPBP | Chemokine (C-X-C
motif) ligand 7, isoform CRA_b | 2 | 0.6 | 5.08E-03 |
| P98086 | C1QA | Complement C1q
subcomponent subunit A | 2 | 0.61 | 7.75E-04 |
| O55222 | ILK | Integrin-linked
protein kinase | 2 | 0.64 | 8.66E-03 |
| P23492 | PNP | Purine nucleoside
phosphorylase | 2 | 0.65 | 7.82E-03 |
| Q8CAG6 | PLEK | Pleckstrin | 2 | 0.65 | 9.63E-03 |
| Q5FW60 | MUP20 | Major urinary
protein 20 | 2 | 0.66 | 7.91E-03 |
| Q8BPF4 | N/A | Putative
uncharacterized protein | 3 | 0.67 | 1.69E-02 |
| A2AQ07 | TUBB1 | Tubulin β-1
chain | 2 | 0.67 | 6.90E-04 |
| P14106 | C1QB | Complement C1q
subcomponent subunit B | 5 | 0.69 | 3.03E-04 |
| P07310 | CKM | Creatine kinase
M-type | 4 | 0.7 | 1.86E-02 |
| Q02105 | C1QC | Complement C1q
subcomponent subunit C | 4 | 0.7 | 7.42E-03 |
| A7LNR1 | CD93 | CD93 antigen
(Fragment) | 2 | 0.7 | 2.26E-02 |
| D3Z0Y2 | PRDX6 |
Peroxiredoxin-6 | 3 | 0.71 | 8.35E-03 |
| A2AE89 | GSTM1 | Glutathione
S-transferase Mu 1 (Fragment) | 2 | 0.71 | 8.21E-03 |
| Q8K0E8 | FGB | Fibrinogen β
chain | 32 | 0.71 | 2.34E-03 |
| P26039 | TLN1 | Talin-1 | 19 | 0.72 | 2.10E-03 |
| Q923D2 | BLVRB | Flavin reductase
(NADPH) | 6 | 0.72 | 4.08E-03 |
| P13634 | CA1 | Carbonic anhydrase
1 | 4 | 0.72 | 3.71E-03 |
| P16015 | CA3 | Carbonic anhydrase
3 | 3 | 0.74 | 3.81E-02 |
| B1AXY5 | B4GALT1 |
β-1,4-galactosyltransferase 1 | 2 | 0.75 | 1.74E-02 |
| P61089 | UBE2N |
Ubiquitin-conjugating enzyme E2 N | 3 | 0.75 | 1.09E-02 |
| P32848 | PVALB | Parvalbumin α | 3 | 0.75 | 2.21E-02 |
| P97336 | OBP1A | Odorant binding
protein Ia (Fragment) | 4 | 0.76 | 7.95E-04 |
| P06909 | CFH | Complement factor
H | 46 | 1.31 | 9.61E-03 |
| P31532 | SAA4 | Serum amyloid A-4
protein | 7 | 1.32 | 7.37E-03 |
| B2RXW7 | C4B | Complement
component 4B (Childo blood group) | 64 | 1.33 | 7.25E-03 |
| A1L3C5 | PRG4 | Prg4 protein | 4 | 1.34 | 4.24E-02 |
| P01027 | C3 | Complement C3 | 107 | 1.34 | 5.16E-03 |
| Q71KU9 | FGL1 | Fibrinogen-like
protein 1 | 3 | 1.35 | 3.33E-03 |
| G3X8T9 | SERPINA3N | Serine (Or
cysteine) peptidase inhibitor, clade A, member 3N,isoform
CRA_a | 18 | 1.37 | 2.41E-04 |
| Q03734 | SERPINA3M | Serine protease
inhibitor A3M | 7 | 1.39 | 2.97E-03 |
| Q8BJU6 | COL3A1 | Putative
uncharacterized protein (Fragment) | 3 | 1.39 | 4.46E-02 |
| Q8VCM7 | FGG | Fibrinogen gamma
chain | 31 | 1.41 | 5.87E-03 |
| Q9D8W4 | IGLV1 |
β-2-microglobulin | 2 | 1.41 | 5.42E-03 |
| E9PV24 | FGA | Fibrinogen α
chain | 37 | 1.41 | 2.95E-03 |
| Q61805 | LBP | Lipopolysaccharide-
binding protein | 4 | 1.42 | 1.40E-02 |
| Q91X72 | HPX | Hemopexin | 25 | 1.53 | 5.85E-04 |
| Q61704 | ITIH3 | Inter-α-trypsin
inhibitor heavy chain H3 | 19 | 1.6 | 2.74E-03 |
| P61939 | SERPINA7 | Thyroxine-binding
globulin | 12 | 1.61 | 4.15E-03 |
| Q60590 | ORM1 | α-1-acid
glycoprotein 1 | 6 | 1.62 | 1.81E-03 |
| Q91XL1 | LRG1 | Leucine-rich HEV
glycoprotein | 6 | 1.74 | 5.48E-03 |
| P12246 | APCS | Serum amyloid
P-component | 6 | 1.87 | 3.58E-03 |
| P07361 | ORM2 | α-1-acid
glycoprotein 2 | 3 | 2.5 | 1.14E-04 |
| Q00898 | SERPINA1E | α-1-antitrypsin
1–5 | 4 | 2.51 | 4.08E-03 |
| Q61646 | HP | Haptoglobin | 18 | 2.98 | 9.14E-04 |
IPA analysis of the differential
proteins
To analyze the overall function of these 47
significantly expressed proteins, we uploaded them onto the IPA
server. The top 5 canonical pathways were LXR/RXR activation, acute
phase response signaling, FXR/RXR activation, complement system,
and intrinsic prothrombin activation pathway (Table II). Four proteins related to these
significantly changed canonical pathways were chosen for western
blot validation. Additionally, IPA identified the following top
five diseases and functions: Cell-to-cell signaling and
interaction, developmental disorder, organismal injury and
abnormalities, hereditary disorder, and immunological disease
(Table III).
| Table II.Significant differentially changed
pathways and related proteins. |
Table II.
Significant differentially changed
pathways and related proteins.
| Ingenuity canonical
pathways | P-value | Molecules |
|---|
| Acute phase
response signaling |
1.00x−19 | HPX, ITIH3, C3,
APOA2, SERPINA3, SAA2-SAA4, FGG, C4A/C4B, HP, APCS, SERPINA, FGB,
LBP, FGA |
| Complement
system |
1.00x−10 | C4A/C4B, C3, C1QA,
C1QC, CFH, C1QB |
| LXR/RXR
activation |
3.72x−09 | C4A/C4B, HPX, C3,
APOA2, SERPINA1, LBP, FGA |
| FXR/RXR
activation |
1.70x−07 | C4A/C4B, HPX, C3,
APOA2, SERPINA1, FGA |
| Intrinsic
prothrombin activation pathway |
3.02x−07 | FGB, FGA, FGG,
COL3A1 |
| Coagulation
system |
6.61x−07 | SERPINA1, FGB, FGA,
FGG |
| Extrinsic
prothrombin activation pathway |
3.98x−06 | FGB, FGA, FGG |
| Role of pattern
recognition receptors in recognition of bacteria and viruses |
1.51x−04 | C3, C1QA, C1QC,
C1QB |
| Role of tissue
factor in cancer |
1.82x−03 | FGB, FGA, FGG |
| Xanthine and
xanthosine salvage |
2.00x−03 | PNP |
| Atherosclerosis
signaling |
2.04x−03 | APOA2, SERPINA1,
COL3A1 |
| Guanine and
guanosine salvage I |
3.98x−03 | PNP |
| Adenine and
adenosine salvage I |
3.98x−03 | PNP |
| Arsenate
detoxification I (Glutaredoxin) |
7.94x−03 | PNP |
| Heme
degradation |
7.94x−03 | BLVRB |
| IL-10
signaling |
7.94x−03 | BLVRB, LBP |
| Creatinx-phosphate
biosynthesis |
9.77x−03 | CKM |
| Adenine and
adenosine salvage III |
1.38x−02 | PNP |
| Purine
ribonucleosides degradation to ribosx-1-phosphate |
1.58x−02 | PNP |
| TR/RXR
activation |
1.62x−02 | HP, FGA |
| Guanosine
nucleotides degradation III |
2.51x−02 | PNP |
| Urate
biosynthesis/inosine 5′-phosphate degradation |
2.75x−02 | PNP |
| Glutaryl-CoA
degradation |
2.95x−02 | CA1 |
| Phagosome
maturation |
3.31x−02 | TUBB1, PRDX6 |
| Adenosine
nucleotides degradation II |
3.31x−02 | PNP |
| IL-12 signaling and
production in macrophages |
3.39x−02 | APOA2,
SERPINA1 |
| Purine nucleotides
degradation II (Aerobic) |
3.89x−02 | PNP |
| Germ cell-sertoli
cell junction signaling |
4.57x−02 | TUBB1, ILK |
| Glutathione redox
reactions I |
4.68x−02 | PRDX6 |
| Tryptophan
degradation III (Eukaryotic) |
4.68x−02 | CA1 |
| Sertoli
cell-sertoli cell junction signaling |
4.79x−02 | TUBB1, ILK |
| Table III.Significant differentially changed
diseases and functions with uploaded proteins (top 10). |
Table III.
Significant differentially changed
diseases and functions with uploaded proteins (top 10).
| Category | P-value | Molecules |
|---|
| Developmental
disorder |
1.43x−10−3.95x−03 | TUBB1, C3, ILK,
C1QA, C1QC, HBA1/HBA2, C1QB, SERPINA7, FGG, C4A/C4B, CA3, HP,
B4GALT1, CST3, APCS, PNP, SERPINA1, FGB, FGA, CA1, COL3A1 |
| Hereditary
disorder |
1.43x−10−3.95x−03 | APOA2, LRG1, C1QA,
SERPINA3, C1QC, HBA1/HBA2, C1QB, SERPINA7, PRDX6, FGG, C4A/C4B,
CA3, CST3, APCS, FGB, SERPINA1, CFH, CA1, TUBB1, PVALB, C3, HP,
B4GALT1, PNP, FGA, COL3A1 |
| Immunological
disease |
1.43x−10−3.95x−03 | TUBB1, HPX, C3,
C1QA, C1QC, HBA1/HBA2, C1QB, PRDX6, FGG, C4A/C4B, CA3, HP, B4GALT1,
CST3, APCS, PNP, SERPINA1, FGB, PLEK, LBP, CFH, FGA, CA1,
COL3A1 |
| Organismal injury
and abnormalities |
1.43x−10−3.95x−03 | ITIH3, GSTM5,
UBE2N, APOA2, LRG1, ILK, C1QC, TLN1, SERPINA3, C1QA, HBA1/HBA2,
C1QB, SERPINA7, PRDX6, FGG, C4A/C4B, CA3, APCS, CST3, SERPINA1,
FGB, LBP, CFH, CA1, PVALB, TUBB1, HPX, C3, CKM, CD93, BLVRB, HP,
B4GALT1, PNP, FGL1, PLEK, FGA, COL3A1 |
| Cell-To-cell
signaling and interaction |
6.08x−10−3.95x−03 | C3, Ppbp, UBE2N,
APOA2, CD93, ILK, C1QA, TLN1, FGG, C4A/ C4B, B4GALT1, APCS, CST3,
PNP, FGB, SERPINA1, PLEK, LBP, CFH, FGA, COL3A1 |
| Hematological
system development and function |
6.08x−10−3.95x−03 | UBE2N, APOA2, ILK,
C1QC, TLN1, SERPINA3, C1QA, HBA1/ HBA2, FGG, C4A/C4B, APCS, CST3,
FGB, SERPINA1, CFH, LBP, HPX, C3, Ppbp, CD93, HP, B4GALT1, PNP,
PLEK, FGA |
| Immune cell
trafficking |
6.08x−10−3.95x−03 | C3, Ppbp, UBE2N,
CD93, ILK, C1QA, TLN1, SERPINA3, FGG, C4A/C4B, HP, B4GALT1, CST3,
APCS, FGB, SERPINA1, CFH, LBP, FGA |
| Inflammatory
response |
7.5x−10−3.95x−03 | TUBB1, HPX, C3,
CKM, APOA2, UBE2N, CD93, ILK, SERPINA3, TLN1, C1QA, HBA1/HBA2,
PRDX6, FGG, C4A/C4B, CA3, HP, B4GALT1, APCS, CST3, PNP, SERPINA1,
FGB, PLEK, CFH, LBP, FGA, CA1, COL3A1 |
| Cellular
movement |
6.12x−09−3.95x−03 | C3, Ppbp, CD93,
ILK, TLN1, SERPINA3, PRDX6, C4A/C4B, HP, B4GALT1, APCS, CST3,
SERPINA1, FGB, CFH, LBP, FGA, COL3A1 |
| Hematological
disease |
7.18x−09−3.95x−03 | TUBB1, C3, CKM,
APOA2, CD93, C1QA, HBA1/HBA2, FGG, C4A/C4B, HP, SERPINA1, FGB,
FGL1, LBP, PLEK, CFH, FGA |
Validation of differential proteins by
western blotting
Four significantly changed candidate proteins were
chosen for validation using western
blotting-lipopolysaccharide-binding protein, fibrinogen β chain,
α-1 antitrypsin, and complement factor H. Compared with the CON
group, α-1 antitrypsin and lipopolysaccharide-binding protein were
upregulated (P<0.05) (Fig. 2).
In contrast, expression of fibrinogen β chain (P<0.05) was
significantly reduced in the CUMS group (Fig. 2). These findings are concordant
with our iTRAQ results. However, the expression levels of
complement factor H were not significantly changed as assessed by
western blotting (P>0.05) (Fig.
2), although they were significantly upregulated in CUMS mice
by the iTRAQ method.
Discussion
The systemic response triggered by local
inflammation, which can be seen in acute and chronic inflammation,
is called the acute phase response. The function of acute phase
proteins include opsonization, capturing microbes, complement
activation, neutralizing enzymes and modulating immune responses.
The acute phase proteins validated in this study included LBP,
SERPINA1 and FGB, which are involved in the acute phase response
pathway (Table II). LBP is used
as a marker of a variety of inflammatory diseases and the
development and prognosis of disease (19). Furthermore, depression and
inflammation are closely related (20). LBP can also affect the innate
immune function and Toll-like receptor 4 (21,22),
which are involved in the pathogenesis of depression (23). Thus, LBP might be involved in the
pathogenesis of depression. LBP is also associated with other
psychiatric disorders, such as Parkinson's disease (24), and therefore, LBP may be closely
related to central nervous system functions. The concentration of
SERPINA1 in the plasma of depressed patients is increased (25), consistent with our results.
SERPINA1 also has a relationship with the immune system, the
apoptotic process and the inflammatory response (26). The concentration of FGB is reduced
in the platelets of depressed patients (27), also consistent with our results.
This suggests that FGB is closely related to the occurrence and
development of depression. The plasma concentration of FGB is also
abnormal in Rett syndrome (28),
and Rett syndrome is a unusual genetic postnatal neurological
disease negatively affecting the grey matter of the brain. Thus,
FGB may be closely related to central nervous system functions.
Retinoid X receptors (RXRs) are nuclear receptors
that mediate the biological effects of retinoids. RXRα is the
dimerization partner for the type II nuclear receptors that include
the liver X receptor (LXR). The LXR is activated by oxysterol
ligands and forms a heterodimer with RXR. After the heterodimer is
formed, LXR initiates the transcription of the target gene by
binding to the LXR response element. LXR/RXR are involved in lipid
metabolism, the inflammatory response and cholesterol and bile acid
metabolism (29). Previous studies
suggest that abnormalities in these processes lead to the
development of depression (9,20).
The farnesoid X receptor (FXR) is a member of the nuclear receptor
family and is a key player in many metabolic pathways. FXR is
activated by bile acids and their intermediates, which thus serves
as a sensor of bile acid levels. Along with the retinoid X receptor
(RXR), FXR plays a key role in linking bile acid regulation with
lipoprotein and lipid and glucose metabolism (30). Energy metabolism is dysregulated in
depressed patients and in the CUMS mouse model (5,10,11).
Perturbations of the LXR/RXR and FXR/RXR pathways may be involved
in the development of depression (31,32).
In this study, according to the IPA, iTRAQ data and western
blotting validation, LBP is involved in LXR/RXR activation
(Table II), in accordance with a
previous study (33). SERPINA1 is
also related to the LXR/RXR and FXR/RXR pathways (Table II). Thus, LBP and SERPINA1 might
be responsible for the occurrence and development of MDD via
LXR/RXR and FXR/RXR pathways.
According to IPA analysis and previous studies, LBP
is also involved in IL-10 signaling (34). FGB is related to the coagulation
system, the extrinsic prothrombin activation pathway, and role of
tissue factor in cancer (35).
SERPINA1 participates in the coagulation system (36), atherosclerotic signaling (37), and IL-12 signaling and production
in macrophages (Table II)
(38). This suggests that these
pathways likely contribute to the development of depression.
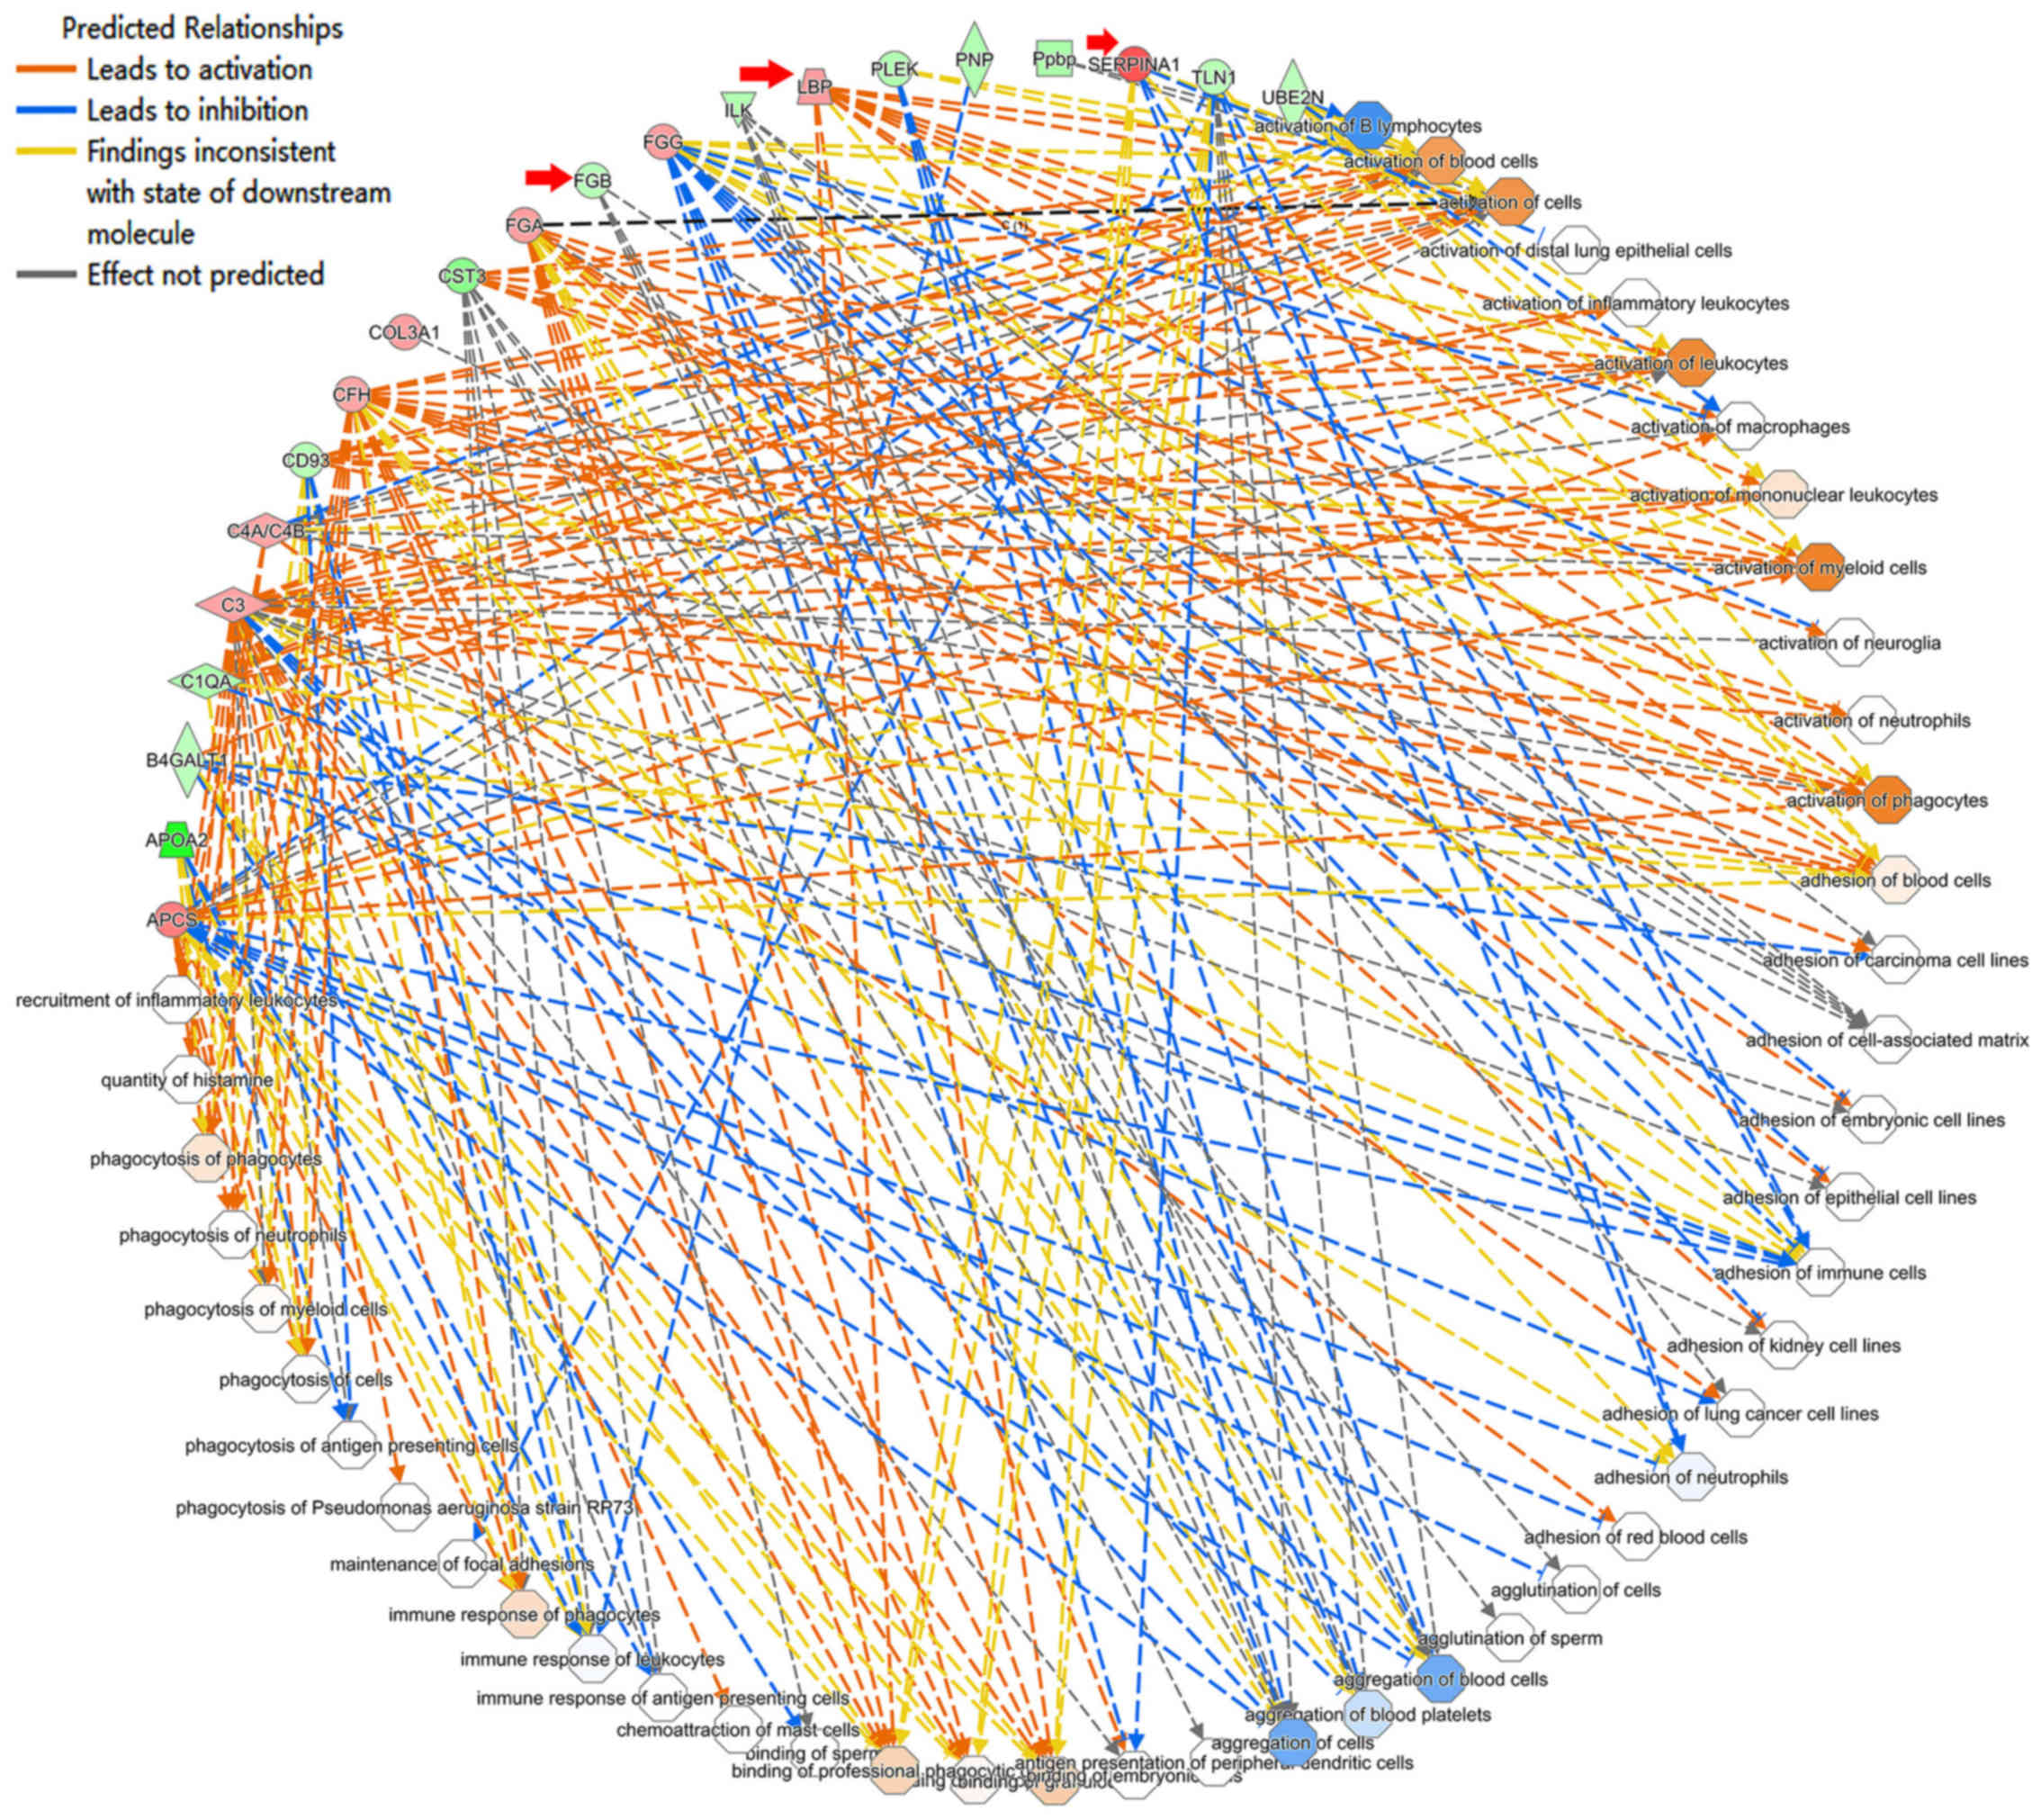
The various changes in proteins and pathways in the
CUMS model might ultimately lead to a depressive state. In this
study, the first five significantly changed functions and diseases
identified by IPA were cell-to-cell signaling and interaction,
developmental disorder, organismal injury and abnormalities,
hereditary disorder, and immunological disease (Table III). These results suggest that
depression is also related to structural abnormalities in the
central nervous system (39) as
well as intercellular interaction and signal transmission (Fig. 3). Therefore, synaptic
neurotransmission might be perturbed in CUMS mice.
However, the expression levels of factor H were not
significantly changed as assessed by western blotting, although
they were significantly upregulated in CUMS mice by the iTRAQ
method. A similar phenomenon has also been observed in other
previous studies (5,6). The variability of dynamic range
between iTRAQ and western blotting and the internal differences
related to the steps of iTRAQ coupled with tandem mass spectrometry
approach and western blotting analysis may lead to this
discrepancy.
These results suggest that the CUMS mouse model is a
suitable model of depression, and that peripheral plasma samples
can, at least to an extent, provide some biomarkers of depression.
The three significantly differentially expressed proteins (FGB,
SERPINA1, LBP) are worthy of further studies on the molecular
mechanisms of depression.
Acknowledgements
This study was financially supported by The National
Key Research and Development Program of China (grant no.
2017YFA0505700), The Natural Science Foundation Project of China
(grant no. 81371310), and Funds for Outstanding Young Scholars in
Chongqing Medical University (grant no. CYYQ201502). We thank Barry
Patel, PhD, from Liwen Bianji, Edanz Group China (www.liwenbianji.cn/ac), for editing the English text
of a draft of this manuscript.
References
|
1
|
Bakish D: New standard of depression
treatment: Remission and full recovery. J Clin Psychiatry. 62 Suppl
26:S5–S9. 2001.
|
|
2
|
Greenberg PE, Fournier AA, Sisitsky T,
Pike CT and Kessler RC: The economic burden of adults with major
depressive disorder in the United States (2005 and 2010). J Clin
Psychiatry. 76:155–162. 2015. View Article : Google Scholar : PubMed/NCBI
|
|
3
|
Bennett S and Thomas AJ: Depression and
dementia: Cause, consequence or coincidence? Maturitas. 79:184–190.
2014. View Article : Google Scholar : PubMed/NCBI
|
|
4
|
Belmaker RH and Agam G: Major depressive
disorder. N Engl J Med. 358:55–68. 2008. View Article : Google Scholar : PubMed/NCBI
|
|
5
|
Xu HB, Zhang RF, Luo D, Zhou Y, Wang Y,
Fang L, Li WJ, Mu J, Zhang L, Zhang Y and Xie P: Comparative
proteomic analysis of plasma from major depressive patients:
Identification of proteins associated with lipid metabolism and
immunoregulation. Int J Neuropsychopharmacol. 15:1413–1425. 2012.
View Article : Google Scholar : PubMed/NCBI
|
|
6
|
Yang Y, Chen J, Liu C, Fang L, Liu Z, Guo
J, Cheng K, Zhou C, Zhan Y, Melgiri ND, et al: The extrinsic
coagulation pathway: A biomarker for suicidal behavior in major
depressive disorder. Sci Rep. 6:328822016. View Article : Google Scholar : PubMed/NCBI
|
|
7
|
Song YR, Wu B, Yang YT, Chen J, Zhang LJ,
Zhang ZW, Shi HY, Huang CL, Pan JX and Xie P: Specific alterations
in plasma proteins during depressed, manic, and euthymic states of
bipolar disorder. Braz J Med Biol Res. 48:973–982. 2015. View Article : Google Scholar : PubMed/NCBI
|
|
8
|
Hinze-Selch D, Schuld A, Kraus T, Kühn M,
Uhr M, Haack M and Pollmächer T: Effects of antidepressants on
weight and on the plasma levels of leptin, TNF-α and soluble TNF
Receptors: A longitudinal study in patients treated with
amitriptyline or paroxetine. Neuropsychopharmacology. 23:13–19.
2000. View Article : Google Scholar : PubMed/NCBI
|
|
9
|
Wu Y, Tang J, Zhou C, Zhao L, Chen J, Zeng
L, Rao C, Shi H, Liao L, Liang Z, et al: Quantitative proteomics
analysis of the liver reveals immune regulation and lipid
metabolism dysregulation in a mouse model of depression. Behav
Brain Res. 311:330–339. 2016. View Article : Google Scholar : PubMed/NCBI
|
|
10
|
Rao C, Shi H, Zhou C, Zhu D, Zhao M, Wang
Z, Yang Y, Chen J, Liao L, Tang J, et al: Hypothalamic proteomic
analysis reveals dysregulation of glutamate balance and energy
metabolism in a mouse model of chronic mild stress-induced
depression. Neurochem Res. 41:2443–2456. 2016. View Article : Google Scholar : PubMed/NCBI
|
|
11
|
Cheng K, Li J, Yang D, Yang Y, Rao C,
Zhang S, Wang W, Guo H, Fang L, Zhu D, et al: 2D-gel based
proteomics unravels neurogenesis and energetic metabolism
dysfunction of the olfactory bulb in CUMS rat model. Behav Brain
Res. 313:302–309. 2016. View Article : Google Scholar : PubMed/NCBI
|
|
12
|
Yang Y, Yang D, Tang G, Zhou C, Cheng K,
Zhou J, Wu B, Peng Y, Liu C, Zhan Y, et al: Proteomics reveals
energy and glutathione metabolic dysregulation in the prefrontal
cortex of a rat model of depression. Neuroscience. 247:191–200.
2013. View Article : Google Scholar : PubMed/NCBI
|
|
13
|
Moussa E, Huang H, Ahras M, Lall A,
Thezenas ML, Fischer R, Kessler BM, Pain A, Billker O and
Casals-Pascual C: Proteomic profiling of the brain of mice with
experimental cerebral malaria. J Proteomics. Jun 5–2017.(Epub ahead
of print). View Article : Google Scholar : PubMed/NCBI
|
|
14
|
Niklasson F and Agren H: Brain energy
metabolism and blood-brain barrier permeability in depressive
patients: Analyses of creatine, creatinine, urate, and albumin in
CSF and blood. Biol Psychiatry. 19:1183–1206. 1984.PubMed/NCBI
|
|
15
|
Li J, Zhang SX, Wang W, Cheng K, Guo H,
Rao CL, Yang DY, He Y, Zou DZ, Han Y, et al: Potential
antidepressant and resilience mechanism revealed by metabolomic
study on peripheral blood mononuclear cells of stress resilient
rats. Behav Brain Res. 320:12–20. 2017. View Article : Google Scholar : PubMed/NCBI
|
|
16
|
Guest PC, Guest FL and Martins-de Souza D:
Making sense of blood-based proteomics and metabolomics in
psychiatric research. Int J Neuropsychopharmacol. Dec 30–2015.(Epub
ahead of print). View Article : Google Scholar : PubMed/NCBI
|
|
17
|
Wisniewski JR, Zougman A, Nagaraj N and
Mann M: Universal sample preparation method for proteome analysis.
Nat Methods. 6:359–362. 2009. View Article : Google Scholar : PubMed/NCBI
|
|
18
|
Gan CS, Chong PK, Pham TK and Wright PC:
Technical, experimental and biological variations in isobaric tags
for relative and absolute quantitation (iTRAQ). J Proteome Res.
6:821–827. 2007. View Article : Google Scholar : PubMed/NCBI
|
|
19
|
Brănescu C, Şerban D, Şavlovschi C,
Dascălu AM and Kraft A: Lipopolysaccharide binding protein
(L.B.P.)-an inflammatory marker of prognosis in the acute
appendicitis. J Med Life. 5:342–347. 2012.PubMed/NCBI
|
|
20
|
Berk M, Williams LJ, Jacka FN, O'Neil A,
Pasco JA, Moylan S, Allen NB, Stuart AL, Hayley AC, Byrne ML and
Maes M: So depression is an inflammatory disease, but where does
the inflammation come from? BMC Med. 11:2002013. View Article : Google Scholar : PubMed/NCBI
|
|
21
|
Ding PH and Jin LJ: The role of
lipopolysaccharide-binding protein in innate immunity: A revisit
and its relevance to oral/periodontal health. J Periodontal Res.
49:1–9. 2014. View Article : Google Scholar : PubMed/NCBI
|
|
22
|
Pahwa R, Devaraj S and Jialal I: The
effect of the accessory proteins, soluble CD14 and
lipopolysaccharide-binding protein on Toll-like receptor 4 activity
in human monocytes and adipocytes. Int J Obes (Lond). 40:907–911.
2016. View Article : Google Scholar : PubMed/NCBI
|
|
23
|
Liu J, Buisman-Pijlman F and Hutchinson
MR: Toll-like receptor 4: Innate immune regulator of neuroimmune
and neuroendocrine interactions in stress and major depressive
disorder. Front Neurosci. 8:3092014. View Article : Google Scholar : PubMed/NCBI
|
|
24
|
Pal GD, Shaikh M, Forsyth CB, Ouyang B,
Keshavarzian A and Shannon KM: Abnormal lipopolysaccharide binding
protein as marker of gastrointestinal inflammation in Parkinson
disease. Front Neurosci. 9:3062015. View Article : Google Scholar : PubMed/NCBI
|
|
25
|
Joyce PR, Hawes CR, Mulder RT, Sellman JD,
Wilson DA and Boswell DR: Elevated levels of acute phase plasma
proteins in major depression. Biol Psychiatry. 32:1035–1041. 1992.
View Article : Google Scholar : PubMed/NCBI
|
|
26
|
de Serres F and Blanco I: Role of alpha-1
antitrypsin in human health and disease. J Intern Med. 276:311–335.
2014. View Article : Google Scholar : PubMed/NCBI
|
|
27
|
Huang TL, Sung ML and Chen TY: 2D-DIGE
proteome analysis on the platelet proteins of patients with major
depression. Proteome Sci. 12:12014. View Article : Google Scholar : PubMed/NCBI
|
|
28
|
Cortelazzo A, Guerranti R, De Felice C,
Signorini C, Leoncini S, Pecorelli A, Landi C, Bini L, Montomoli B,
Sticozzi C, et al: A plasma proteomic approach in Rett syndrome:
Classical versus preserved speech variant. Mediators Inflamm.
2013:4386532013. View Article : Google Scholar : PubMed/NCBI
|
|
29
|
Edwards PA, Kennedy MA and Mak PA: LXRs;
oxysterol-activated nuclear receptors that regulate genes
controlling lipid homeostasis. Vascul Pharmacol. 38:249–256. 2002.
View Article : Google Scholar : PubMed/NCBI
|
|
30
|
Rizzo G, Renga B, Mencarelli A,
Pellicciari R and Fiorucci S: Role of FXR in regulating bile acid
homeostasis and relevance for human diseases. Curr Drug Targets
Immune Endocr Metabol Disord. 5:389–303. 2005. View Article : Google Scholar
|
|
31
|
Jia P, Kao CF, Kuo PH and Zhao Z: A
comprehensive network and pathway analysis of candidate genes in
major depressive disorder. BMC Syst Biol. 5 Suppl 3:S122011.
View Article : Google Scholar : PubMed/NCBI
|
|
32
|
Steri R, Achenbach J, Steinhilber D,
Schubert-Zsilavecz M and Proschak E: Investigation of imatinib and
other approved drugs as starting points for antidiabetic drug
discovery with FXR modulating activity. Biochem Pharmacol.
83:1674–1681. 2012. View Article : Google Scholar : PubMed/NCBI
|
|
33
|
Li GC, Zhang L, Yu M, Jia H, Tian T, Wang
J, Wang F and Zhou L: Identification of novel biomarker and
therapeutic target candidates for acute intracerebral hemorrhage by
quantitative plasma proteomics. Clin Proteomics. 14:142017.
View Article : Google Scholar : PubMed/NCBI
|
|
34
|
Ren L, Jiang ZQ, Fu Y, Leung WK and Jin L:
The interplay of lipopolysaccharide-binding protein and cytokines
in periodontal health and disease. J Clin Periodontol. 36:619–626.
2009. View Article : Google Scholar : PubMed/NCBI
|
|
35
|
Choe H, Sboner A, Beltran H, Nanus D and
Tagawa ST: PO-43 – Differential coagulation factor expression in
neuroendocrine prostate cancer (PC), metastatic castrate-resistant
PC, and localized prostatic adenocarcinoma. Thromb Res. 140 Suppl
1:S1922016. View Article : Google Scholar : PubMed/NCBI
|
|
36
|
Langley PG, Hughes RD, Rolando N and
Williams R: Increased elastase-alpha 1-antitrypsin complex in
fulminant hepatic failure: Relationship to bacterial infection and
activation of coagulation. Clin Chim Acta. 200:211–219. 1991.
View Article : Google Scholar : PubMed/NCBI
|
|
37
|
Howlett GJ and Moore KJ: Untangling the
role of amyloid in atherosclerosis. Curr Opin Lipidol. 17:541–547.
2006. View Article : Google Scholar : PubMed/NCBI
|
|
38
|
Subramaniyam D, Steele C, Köhnlein T,
Welte T, Grip O, Matalon S and Janciauskiene S: Effects of alpha
1-antitrypsin on endotoxin-induced lung inflammation in vivo.
Inflamm Res. 59:571–578. 2010. View Article : Google Scholar : PubMed/NCBI
|
|
39
|
Cheng W, Rolls ET, Qiu J, Liu W, Tang Y,
Huang CC, Wang X, Zhang J, Lin W, Zheng L, et al: Medial reward and
lateral non-reward orbitofrontal cortex circuits change in opposite
directions in depression. Brain. 139:3296–3309. 2016. View Article : Google Scholar : PubMed/NCBI
|