Introduction
Multiple system atrophy (MSA) is a sporadic
neurodegenerative disorder characterized by a combination of
various degrees of parkinsonism, cerebellar ataxia and autonomic
dysfunction (1). At present, there
are no established biomarkers of MSA and so the clinical diagnosis
of MSA is dependent on the assessment of clinical symptoms, thus
misdiagnoses are frequent (2). The
characteristic pathological hallmark of MSA is the accumulation of
α-synuclein positive glial cytoplasmic inclusions in
oligodendrocytes (3). The
pathogenesis of MSA remains unclear, although it has been reported
that α-synuclein accumulation serves a key role in
neurodegeneration (3,4).
microRNA (miRNA) are short RNA molecules that
function as post-transcriptional regulators that bind to
complementary sequences on target mRNA transcripts, typically
resulting in translational repression or target degradation and
gene silencing (5). Previous
studies have demonstrated that the dysregulation of miRNA serves an
important role in a number of neurological disorders, including
Alzheimer's disease, Parkinson's disease (PD) (6) and amyotrophic lateral sclerosis
(7). However, the miRNA profile of
patients with MSA remains to be fully investigated.
Increased serum levels of insulin like growth factor
(IGF)-1 have been reported in patients with MSA (8,9).
Since IGF-1 signaling has been revealed to be regulated by several
miRNAs (10,11), it may be hypothesized that miRNAs
and IGF-1 contribute to the pathogenesis of MSA.
In the present study, the expression of serum miRNAs
and IGF-1 was investigated in patients with MSA, in order to
identify potential biomarkers and clarify the pathogenesis of
MSA.
Materials and methods
Patients and samples
A total of 10 patients with MSA (7 males and 3
females; mean age, 64±6.9 years; range, 49–75 years) and 6 age- and
sex-matched healthy controls (caregivers of the MSA patients
without MSA; 4 males and 2 females; mean age, 64±2.9; range, 58–66
years) were recruited for the present study between January and
December 2013, from the Department of Neurology, Kagawa University
Hospital. All of the patients with MSA were diagnosed according to
the 2008 consensus statement on the diagnosis of MSA: Definite, 1
patient; probable, 4 patients; possible, 5 patients (12). Five of the 10 patients had MSA of
the parkinsonian form (MSA-P), and the other 5 patients had MSA of
the cerebellar form (MSA-C). The mean duration of the illness was
5.5±2.8 years (Table I). Blood
samples were harvested upon recruitment and processed for serum
isolation within 2 h following withdrawal. Whole blood was
centrifuged at 1,500 × g for 15 min at 4°C. Each serum sample was
divided into aliquots and stored at −80°C until analysis. Informed
consent was obtained from all of the participants and the present
study was approved by the Ethics Committee of Kagawa University
(Kagawa, Japan).
 | Table I.Profiles of patients with MSA-P and
-C. |
Table I.
Profiles of patients with MSA-P and
-C.
| Patient number | Age (years) | Sex | Subtype | Diagnostic
criteria | Disease duration
(years) |
|---|
| 1 | 59 | M | P | Possible | 3 |
| 2 | 64 | M | C | Probable | 5 |
| 3 | 69 | M | C | Possible | 3 |
| 4 | 64 | M | C | Probable | 7 |
| 5 | 63 | M | P | Definite | 8 |
| 6 | 75 | F | P | Probable | 9 |
| 7 | 62 | F | C | Probable | 10 |
| 8 | 66 | M | P | Probable | 3 |
| 9 | 69 | M | C | Possible | 5 |
| 10 | 49 | F | P | Possible | 2 |
RNA isolation
Total RNA was extracted from the serum samples using
an miRNeasy Mini kit (Qiagen, Inc., Valencia, CA, USA) according to
the manufacturer's instructions. All RNA samples used in the
present study exhibited A260/280 ratios between 2.0 and 2.1. The
integrity of RNA was determined using a NanoDrop 2000
spectrophotometer (Thermo Fisher Scientific, Inc., Waltham, MA,
USA). The quality of total RNA was determined using the RNA Nano
6000 chips from the Agilent 2100 Bioanalyzer (Agilent Technologies,
Inc., Santa Clara, CA, USA) according to the manufacturer's
protocol, and all RNA samples used for the microarray analyses had
RNA Integrity Number values >8.2. Briefly, total RNA from all
serum samples was heated at 70°C for 2 min and incubated on ice for
5 min. Subsequently, samples (1 µl) were loaded into each lane on
the RNA Nano 6000 chips, and the bands of 18S (arrow) and 28S
ribosomal RNA (arrowhead) in the gel were detected using the
Agilent 2100 Bioanalyzer (Fig.
1A). These RNA samples were stored at −80°C.
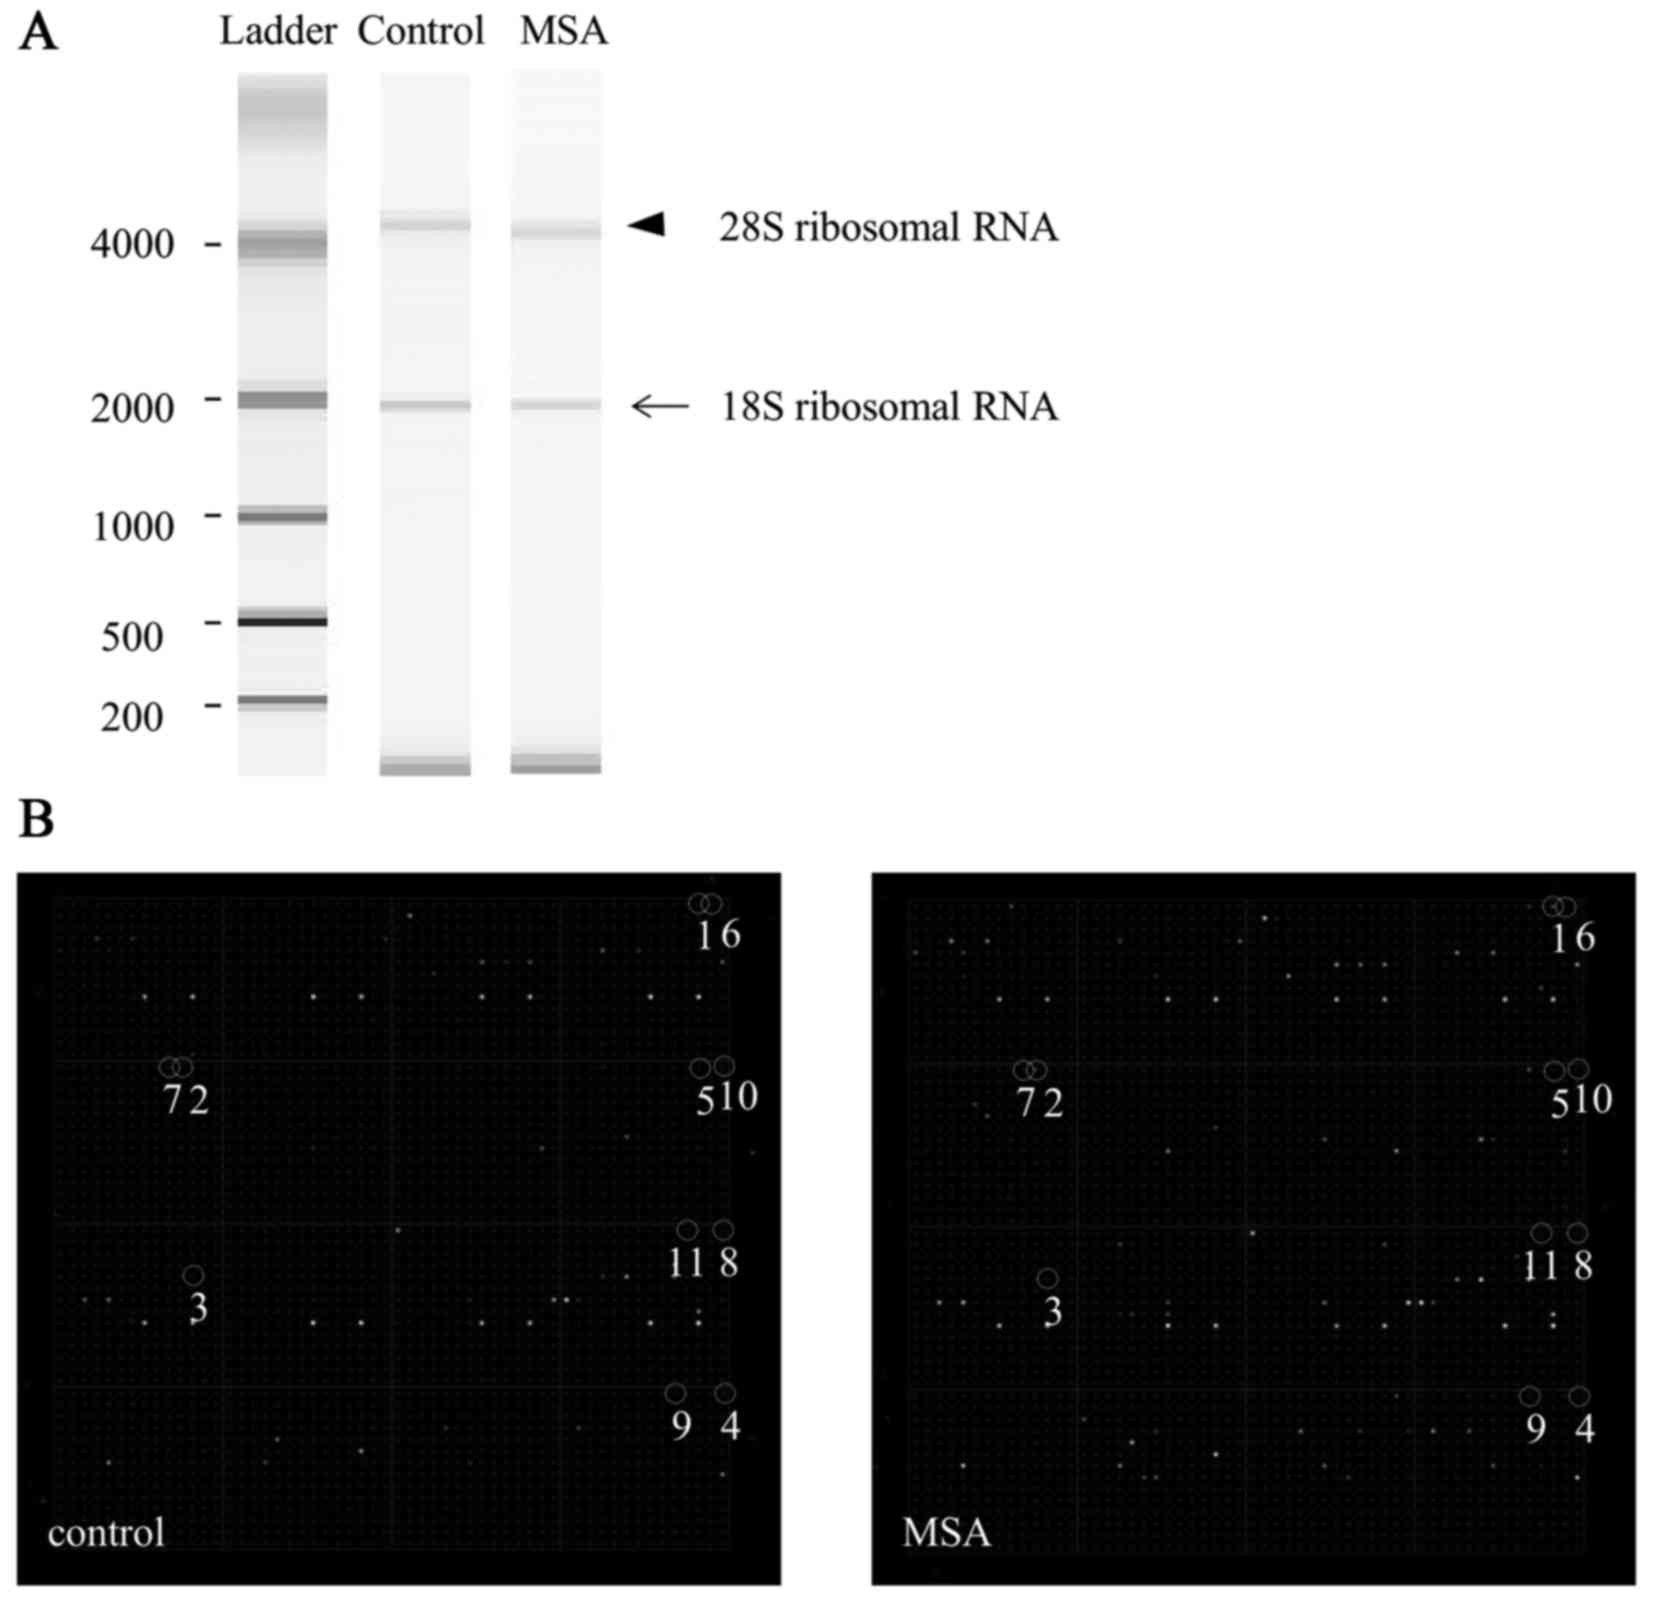 | Figure 1.Quality of total RNA and miRNA
expression in the serum of a typical patient with MSA. (A) The
bands of 18S (arrow) and 28S (arrowhead) ribosomal RNA in the gel
were detected using a 2100 Bioanalyzer. (B) Representative miRNA
expression in control and MSA cases, using miRNA chip analysis.
Spot numbers 1 to 11 are presented: 1, miR-16; 2, miR-223; 3,
miR-25; 4, let-7c; 5, miR-17; 6, let-7d; 7, let-7i; 8, let-7b; 9,
miR-24; 10, let-7a; 11, miR-20a. MSA, multiple system atrophy;
miRNA/miR, microRNA. |
miRNA arrays
Total RNA was labeled with Hy3 dye using an miRCURY
LNA microRNA Array Hi-Power Labeling kit (Exiqon A/S, Vedbæk,
Denmark). Total RNA (2 µg) was incubated with a spike of 30 min at
37°C and then at 95°C for 5 min. Hy3 dye and Hi-Power Labeling
enzyme were then added to each sample. The enzyme was then
heat-inactivated at 16°C for 1 h and at 65°C for 15 min, protected
from light. The samples were loaded onto the arrays by capillary
force using 3D-Gene miRNA oligo chips (version 17; Toray
Industries, Inc., Tokyo, Japan). The chips enabled the examination
of the expression of 679 miRNAs printed in duplicate spots.
The arrays were incubated at 32°C for 16 h, then
briefly washed in a 30°C wash buffer solution [0.5X saline-sodium
citrate (SSC), 0.1% SDS], rinsed in wash buffer solution (0.2X SSC,
0.1% SDS) and then washed again in another buffer solution (0.05X
SSC), according to the manufacturer's instructions (Toray
Industries, Inc.). The arrays were centrifuged for 1 min at 600 × g
at room temperature for drying, followed by immediate scanning
using a 3D-Gene 3000 miRNA microarray scanner (Toray Industries,
Inc.). It was calculated that the relative expression level of each
miRNA by comparing the average signal intensities of the valid
spots with their mean value throughout the microarray experiments,
following normalization to their adjusted median values.
Quantification of miRNA
Isolation of RNA was performed using a miRNeasy
serum/plasma kit adding spike in control cel-miR-39 (Qiagen, Inc.),
according to the manufacturer's protocol. cDNA was individually
synthesized for each target miRNA using miRNA Reverse Transcription
kit (Thermo Fisher Scientific, Inc.) according to the
manufacturer's protocol. The detection of miRNA expression was
performed by reverse transcription-quantitative polymerase chain
reaction (RT-qPCR), using TaqMan miRNA Assays and TaqMan Universal
Master MixII (Thermo Fisher Scientific, Inc.) according to the
manufacturer's protocol. Thermocycling conditions were as follows:
Initial denaturation at 95°C for 10 min, followed by 40 cycles at
95°C for 15 sec and at 60°C for 60 sec. The relative expression
levels of miRNA were calculated using the comparative Cq method
(13) and normalized to cel-miR-39
expression. Experiments were performed in triplicate.
Heatmap
A heatmap was created using R software version 3.2.3
(https://www.R-project.org) in which the
expression levels of miRNAs from each of the 10 MSA patients and 6
healthy controls were represented using unsupervised hierarchical
clustering Brunner-Munzel analysis. The heatmap was color-coded
according to the log2-transformed expression levels. The center
level of the color code is set as the median value over all of the
values used in the heatmap. White color represented mean values,
red indicated an increase and blue represented a decrease in
expression.
Measurement of IGF-1
Serum IGF-1 levels were measured by Shikoku Chuken
(Ayagawa, Japan) using an immunoradiometric assay.
Statistical analysis
Data are expressed as the mean ± standard deviation.
The statistical significance of the differences between groups was
assessed using unpaired Student's t-test. P<0.05 was considered
to indicate a statistically significant difference. Statistical
analysis was performed using SPSS software version 23.0 (IBM Corp.,
Armonk, NY, USA).
Results
Identification of differentially
expressed plasma miRNA in the patients with MSA and healthy
controls
The miRNA expression levels in serum obtained from
the patients with MSA and healthy controls were compared. The
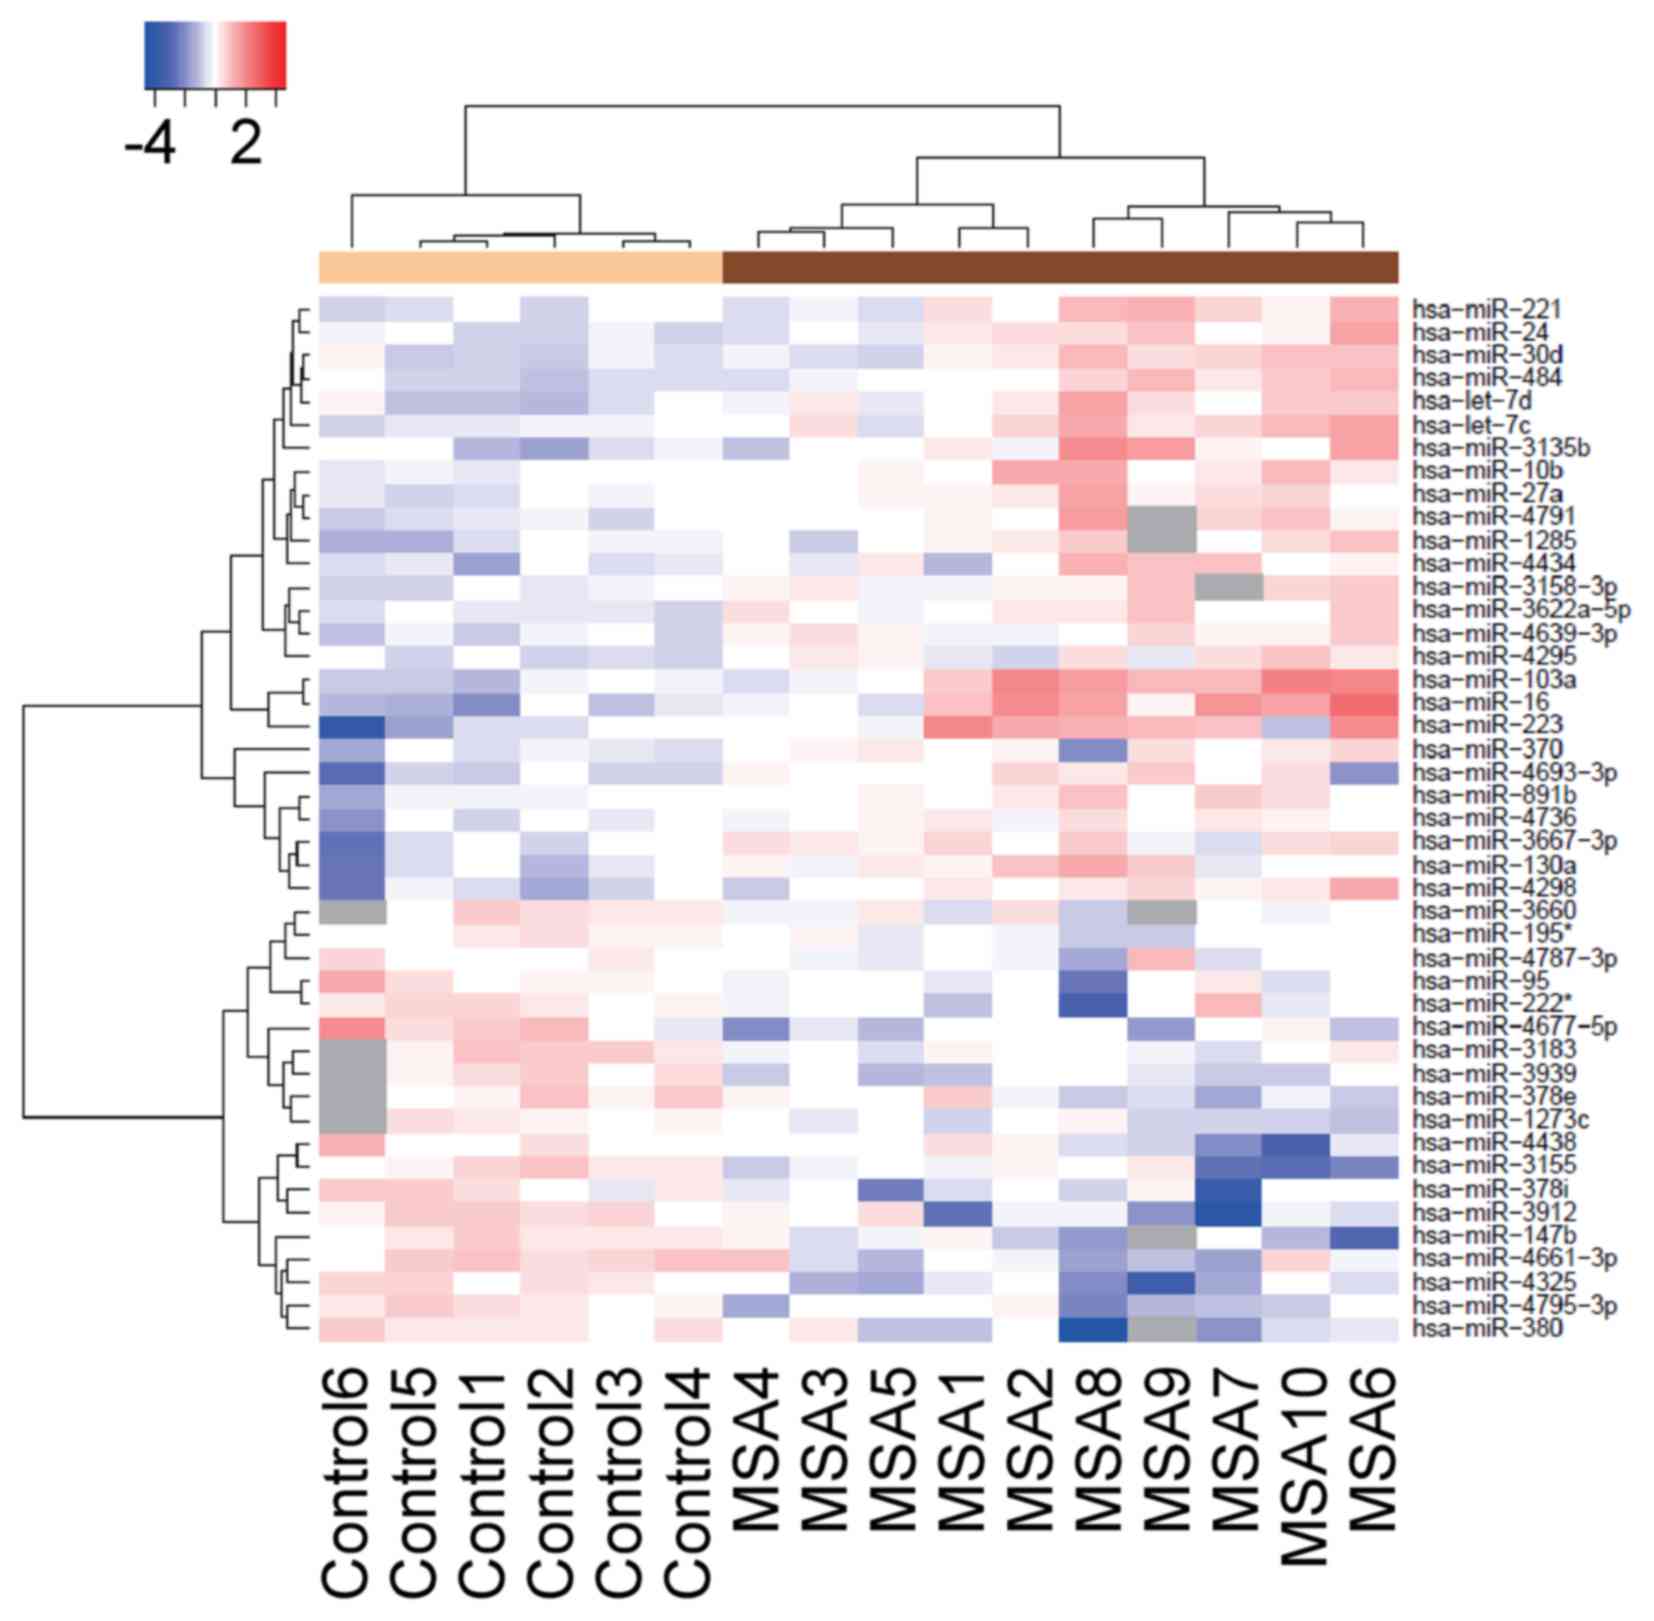
custom microarray platform identified 50 miRNAs that were
upregulated and 17 miRNAs that were downregulated in the serum of
the patients with MSA (Table II).
As shown in Fig. 1B, the
representative upregulated miRNAs were: miR-16 (spot no. 1),
miR-223 (spot no. 2), miR-25 (spot no. 3), let-7c (spot no. 4),
miR-17 (spot no. 5), let-7d (spot no. 6), let-7i (spot no. 7),
let-7b (spot no. 8), miR-24 (spot no. 9), let-7a (spot no. 10) and
miR-20a (spot no. 11). An unsupervised hierarchical clustering
analysis using a Brunner-Munzel test revealed that the patients
with MSA clustered separately from the healthy control group
(Fig. 2).
| Table II.Statistical results and chromosomal
locations of miRNAs in the 10 patients with MSA and 6 healthy
controls. |
Table II.
Statistical results and chromosomal
locations of miRNAs in the 10 patients with MSA and 6 healthy
controls.
| miRNA | Fold change
(MSA/control) | P-value | Chromosomal
localization |
|---|
| Upregulated |
|
hsa-miR-16 | 4.42 | 0.009 | 13q14.2 |
|
hsa-miR-451 | 4.21 | 0.017 | 17q11.2 |
|
hsa-miR-103a | 3.43 | 0.006 | 5q34 |
|
hsa-miR-223 | 3.28 | 0.007 | Xq12 |
|
hsa-miR-486-5p | 2.70 | 0.023 | 8p11.21 |
|
hsa-miR-107 | 2.45 | 0.014 | 10q23.31 |
|
hsa-miR-25 | 2.42 | 0.029 | 7q22.1 |
|
hsa-miR-3135b | 2.31 | 0.035 | 6 |
|
hsa-miR-15b | 2.19 | 0.009 | 3q25.33 |
|
hsa-miR-185 | 2.14 | 0.010 | 22q11.21 |
|
hsa-miR-939 | 2.09 | 0.048 | 8q24.3 |
|
hsa-miR-92a | 2.08 | 0.036 | 13q31.3 |
|
hsa-miR-4298 | 2.07 | 0.006 | 11 |
|
hsa-miR-92b | 2.07 | 0.019 | 1q22 |
|
hsa-let-7c | 2.02 | 0.006 | 21q21.1 |
|
hsa-miR-17 | 1.97 | 0.007 | 13q31.3 |
|
hsa-miR-4693-3p | 1.95 | 0.005 | 11 |
|
hsa-miR-130a | 1.95 | 0.010 | 5q34 |
|
hsa-let-7d | 1.91 | 0.012 | 9q22.32 |
|
hsa-let-7i | 1.91 | 0.003 | 12q14.1 |
|
hsa-miR-484 | 1.90 | 0.004 | 16p13.11 |
|
hsa-miR-4791 | 1.89 | 0.019 | 3 |
|
hsa-miR-522 | 1.88 | 0.003 | 19q13.42 |
|
hsa-miR-26a | 1.88 | 0.033 | 3p22.2 |
|
hsa-let-7b | 1.86 | 0.024 | 22q13.31 |
|
hsa-miR-3605-3p | 1.86 | 0.009 | 1 |
|
hsa-miR-30d | 1.83 | 0.006 | 8q24.22 |
|
hsa-miR-4434 | 1.80 | 0.016 | 2 |
|
hsa-miR-4281 | 1.80 | 0.007 | 5 |
|
hsa-miR-106a | 1.76 | 0.015 | Xq26.2 |
|
hsa-miR-3667-3p | 1.74 | 0.008 | 22 |
|
hsa-miR-99a | 1.74 | 0.040 | 21q21.1 |
|
hsa-miR-24 | 1.74 | 0.017 | 9q22.32 |
|
hsa-miR-221 | 1.73 | 0.020 | Xp11.3 |
|
hsa-miR-31 | 1.73 | 0.024 | 9p21.3 |
|
hsa-miR-1285 | 1.73 | 0.007 | 7q21-q22 |
|
hsa-miR-218-2 | 1.70 | 0.041 | 5q34 |
|
hsa-let-7a | 1.70 | 0.025 | 9q22.32 |
|
hsa-miR-27a | 1.68 | 0.019 | 19p13.13 |
|
hsa-miR-20a | 1.68 | 0.015 | 13q31.3 |
|
hsa-miR-518a-3p | 1.67 | 0.043 | 19q13.42 |
|
hsa-miR-19b | 1.67 | 0.028 | 13q31.3 |
|
hsa-miR-10b | 1.67 | 0.028 | 2q31.1 |
|
hsa-miR-377 | 1.66 | 0.015 | 14q32.31 |
|
hsa-miR-4698 | 1.65 | 0.033 | 12 |
|
hsa-miR-186 | 1.65 | 0.042 | 1p31.1 |
|
hsa-miR-126 | 1.64 | 0.032 | 9q34.3 |
|
hsa-miR-1303 | 1.61 | 0.032 | 5 |
|
hsa-miR-500b | 1.61 | 0.029 | Xp11.23 |
|
hsa-miR-3622a-5p | 1.61 | 0.002 | 8 |
|
hsa-miR-3139 | 0.50 | 0.037 | 4 |
| Downregulated |
|
hsa-miR-4325 | 0.46 | 0.0003 | 20 |
|
hsa-miR-380 | 0.50 | 0.0008 | 14q32.31 |
|
hsa-miR-3912 | 0.51 | 0.0019 | 5 |
|
hsa-miR-4661-3p | 0.54 | 0.0032 | 8 |
|
hsa-miR-4795-3p | 0.55 | 0.0038 | 3 |
|
hsa-miR-4458 | 0.55 | 0.041 | 5p15.31 |
|
hsa-miR-3155 | 0.55 | 0.0082 | 10 |
|
hsa-miR-590-3p | 0.55 | 0.045 | 7q11.23 |
|
hsa-miR-147b | 0.56 | 0.0034 | 15q21.1 |
|
hsa-miR-4439 | 0.56 | 0.046 | 2 |
|
hsa-miR-378i | 0.56 | 0.016 | 22 |
|
hsa-miR-3939 | 0.57 | 0.0058 | 6 |
|
hsa-miR-4495 | 0.58 | 0.026 | 12 |
|
hsa-miR-526b | 0.58 | 0.036 | 19q13.42 |
|
hsa-miR-548z | 0.58 | 0.041 | 12 |
|
hsa-miR-3183 | 0.59 | 0.0082 | 17 |
Identification of differentially
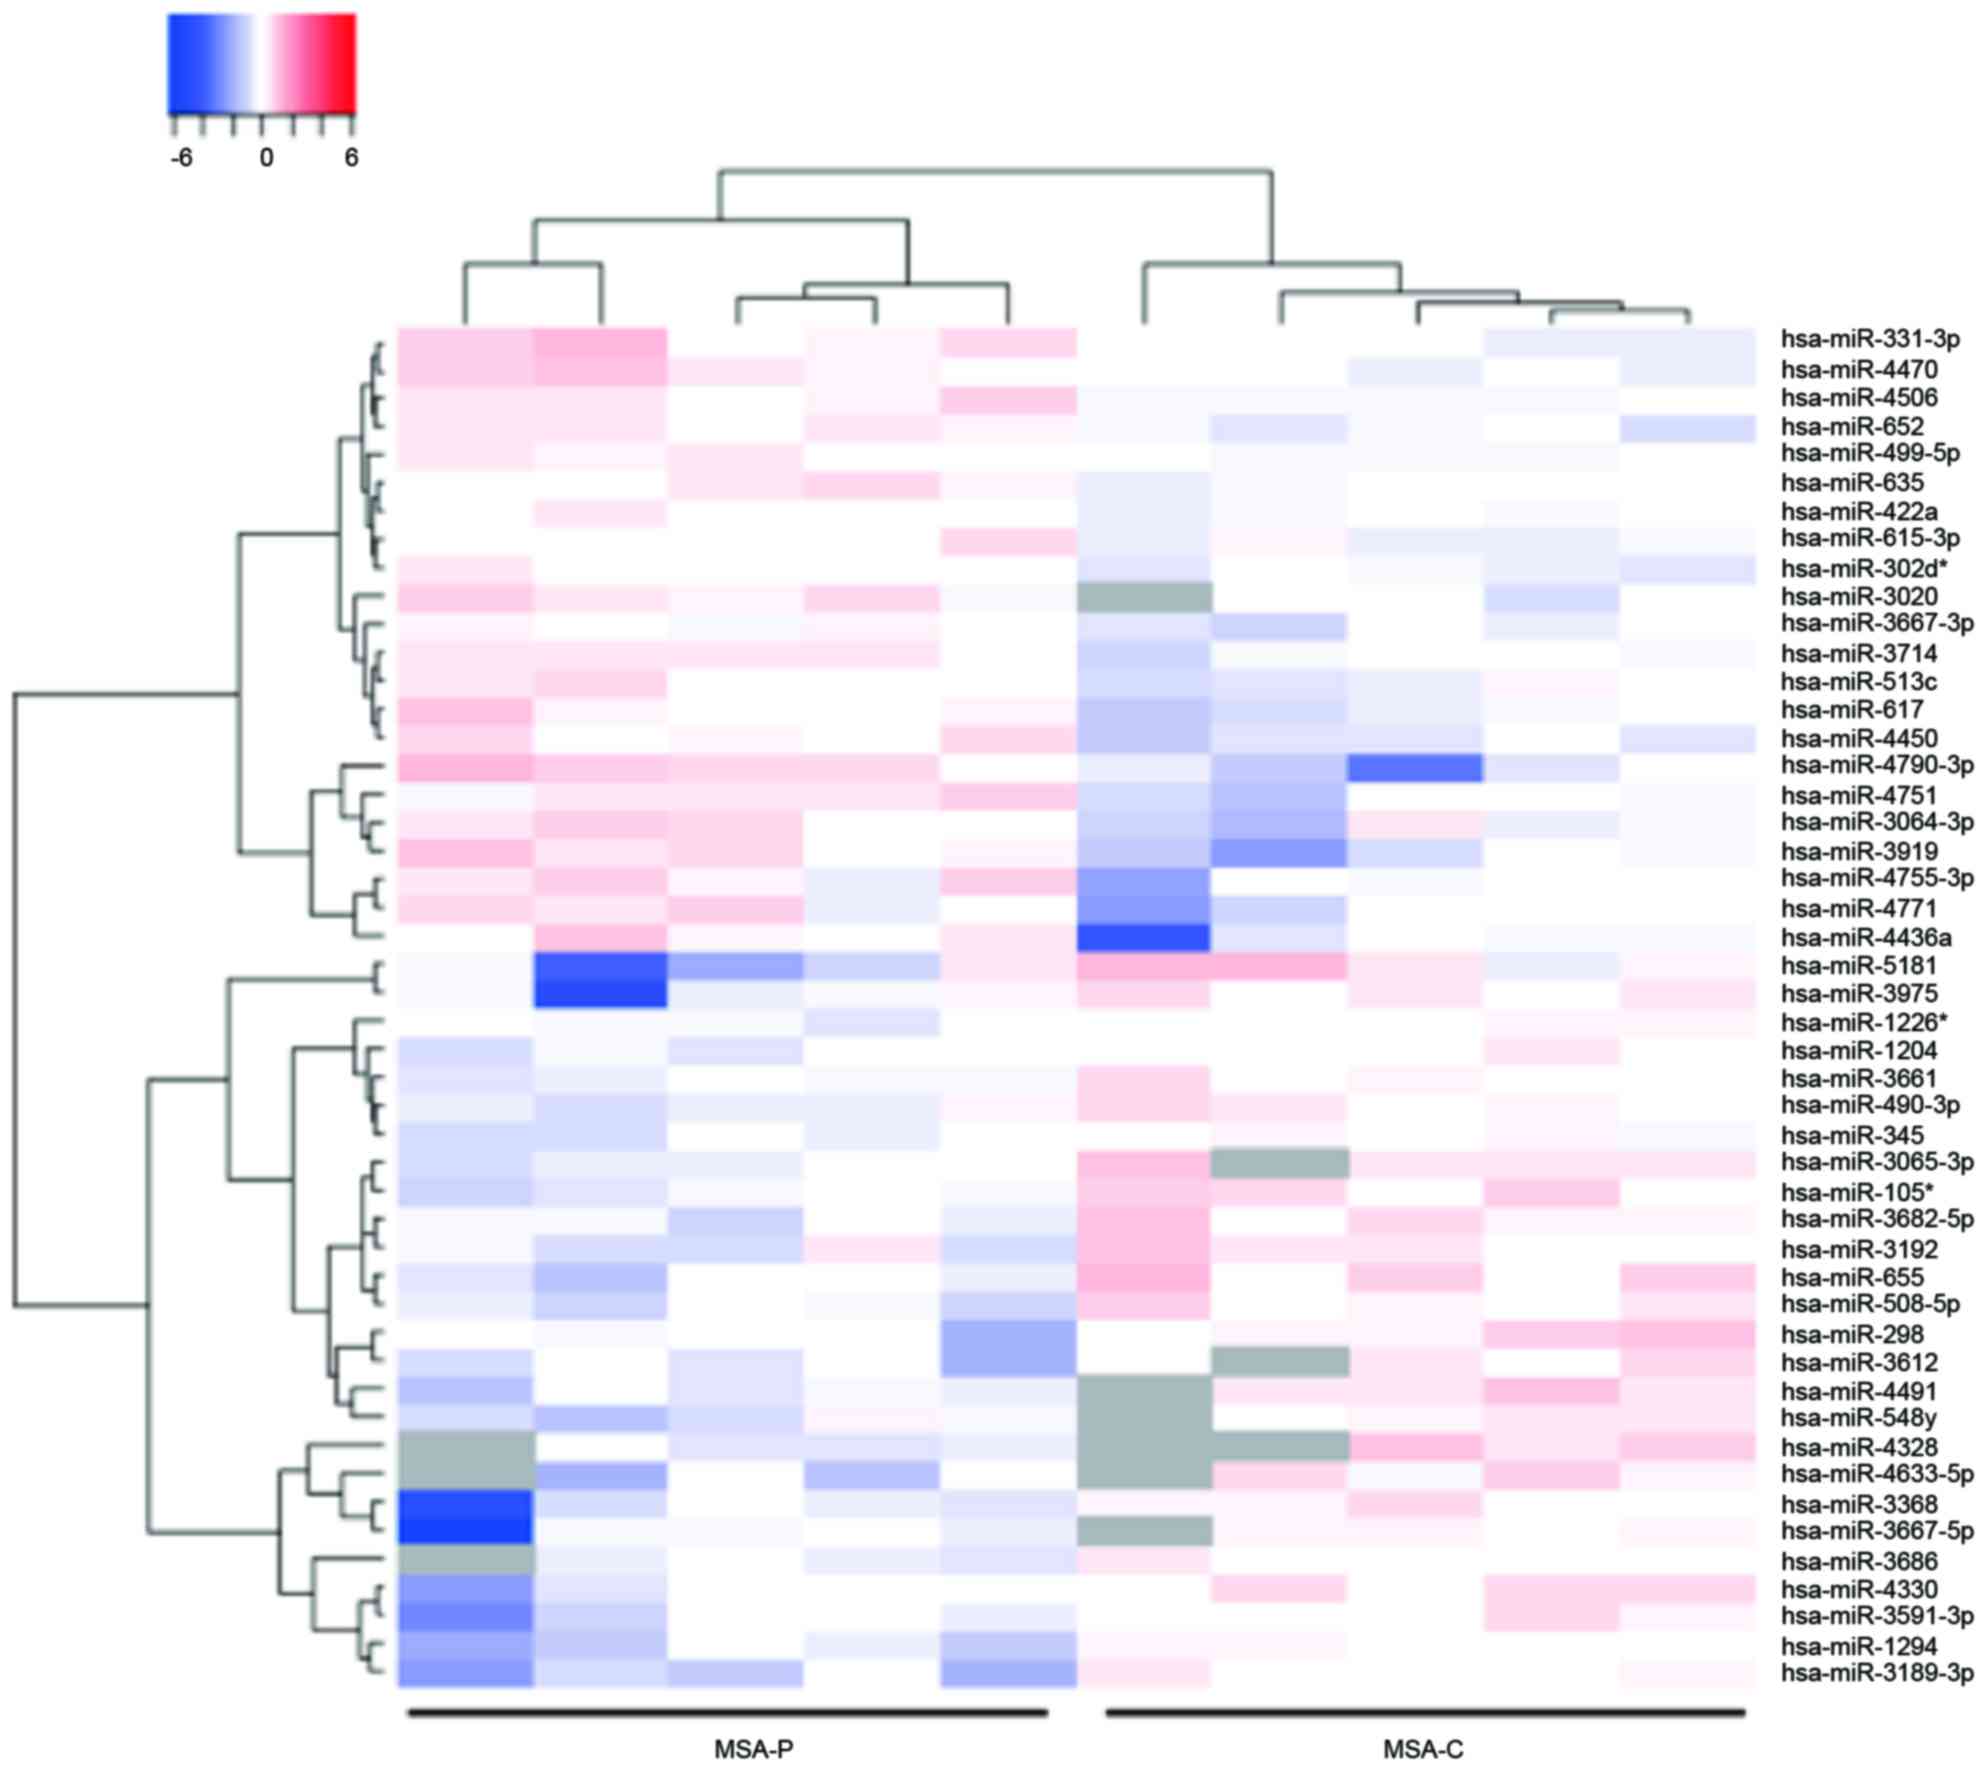
expressed plasma miRNA in the MSA-P and MSA-C patients
The miRNA expression levels in serum obtained from
the MSA-P and MSA-C patients were then compared. This analysis
identified that 22 miRNAs were upregulated and 17 miRNAs were
downregulated in the serum of the patients with MSA-P (Table III). An unsupervised hierarchical
clustering analysis using a Brunner-Munzel test demonstrated that
the MSA-P patients clustered separately from the MSA-C patients
(Fig. 3).
| Table III.Statistical results and chromosomal
locations of miRNAs in the patients with MSA-P and -C. |
Table III.
Statistical results and chromosomal
locations of miRNAs in the patients with MSA-P and -C.
| miRNA | Fold change
(MSA-P/-C) | P-value | Chromosomal
localization |
|---|
| Upregulated |
|
hsa-miR-4790-3p | 3 | 0.0016 | 3p26.1 |
|
hsa-miR-3919 | 2.31 | 0.015 | 3q25.32 |
|
hsa-miR-4436a | 2 | 0.025 | 2p11.2 |
|
hsa-miR-3202 | 1.97 | 0.027 | Xq28 |
|
hsa-miR-4450 | 1.95 | 0.0014 | 4q21.1 |
|
hsa-miR-4771 | 1.9 | 0.032 | 2p11.2 |
|
hsa-miR-331-3p | 1.89 | 0.021 | 12q22 |
|
hsa-miR-3064-3p | 1.87 | 0.033 | 17q23.3 |
|
hsa-miR-4751 | 1.87 | 0.019 | 19q13.33 |
|
hsa-miR-617 | 1.82 | 0.03 | 12q21.31 |
|
hsa-miR-4470 | 1.8 | 0.014 | 8q12.3 |
|
hsa-miR-4755-3p | 1.76 | 0.045 | 20q11.22 |
|
hsa-miR-379 | 1.75 | 0.048 | 14q32.31 |
|
hsa-miR-3714 | 1.7 | 0.001 | 3p24.3 |
|
hsa-miR-4506 | 1.69 | 0.0032 | 14q32.12 |
|
hsa-miR-454 | 1.68 | 0.035 | 17q22 |
|
hsa-miR-135a | 1.66 | 0.038 | 3p21.2 |
|
hsa-miR-652 | 1.61 | 0.007 | Xq23 |
|
hsa-miR-4790-3p | 3 | 0.0016 | 3p26.1 |
|
hsa-miR-3919 | 2.31 | 0.015 | 3q25.32 |
|
hsa-miR-4436a | 2 | 0.025 | 2p11.2 |
|
hsa-miR-3202 | 1.97 | 0.027 | Xq28 |
| Downregulated |
|
hsa-miR-518f | 0.37 | 0.041 | 19q13.42 |
|
hsa-miR-4703-5p | 0.41 | 0.043 | 13q14.3 |
|
hsa-miR-3189-3p | 0.44 | 0.008 | 19p13.11 |
|
hsa-miR-655 | 0.46 | 0.017 | 14q32.31 |
|
hsa-miR-3168 | 0.5 | 0.015 | 13q14.11 |
|
hsa-miR-105 | 0.51 | 0.014 | Xq28 |
|
hsa-miR-1294 | 0.53 | 0.011 | 5q33.2 |
|
hsa-miR-3686 | 0.53 | 0.019 | 8q24.21 |
|
hsa-miR-4330 | 0.53 | 0.012 | Xq28 |
|
hsa-miR-508-5p | 0.53 | 0.014 | Xq27.3 |
|
hsa-miR-3591-3p | 0.53 | 0.027 | 18q21.31 |
|
hsa-miR-298 | 0.54 | 0.042 | 20q13.32 |
|
hsa-miR-3682-5p | 0.54 | 0.032 | 2p16.2 |
|
hsa-miR-3115 | 0.55 | 0.046 | 1p36.12 |
|
hsa-miR-3192 | 0.55 | 0.035 | 20p11.23 |
|
hsa-miR-3975 | 0.55 | 0.037 | 18q12.2 |
|
hsa-miR-518f | 0.37 | 0.041 | 19q13.42 |
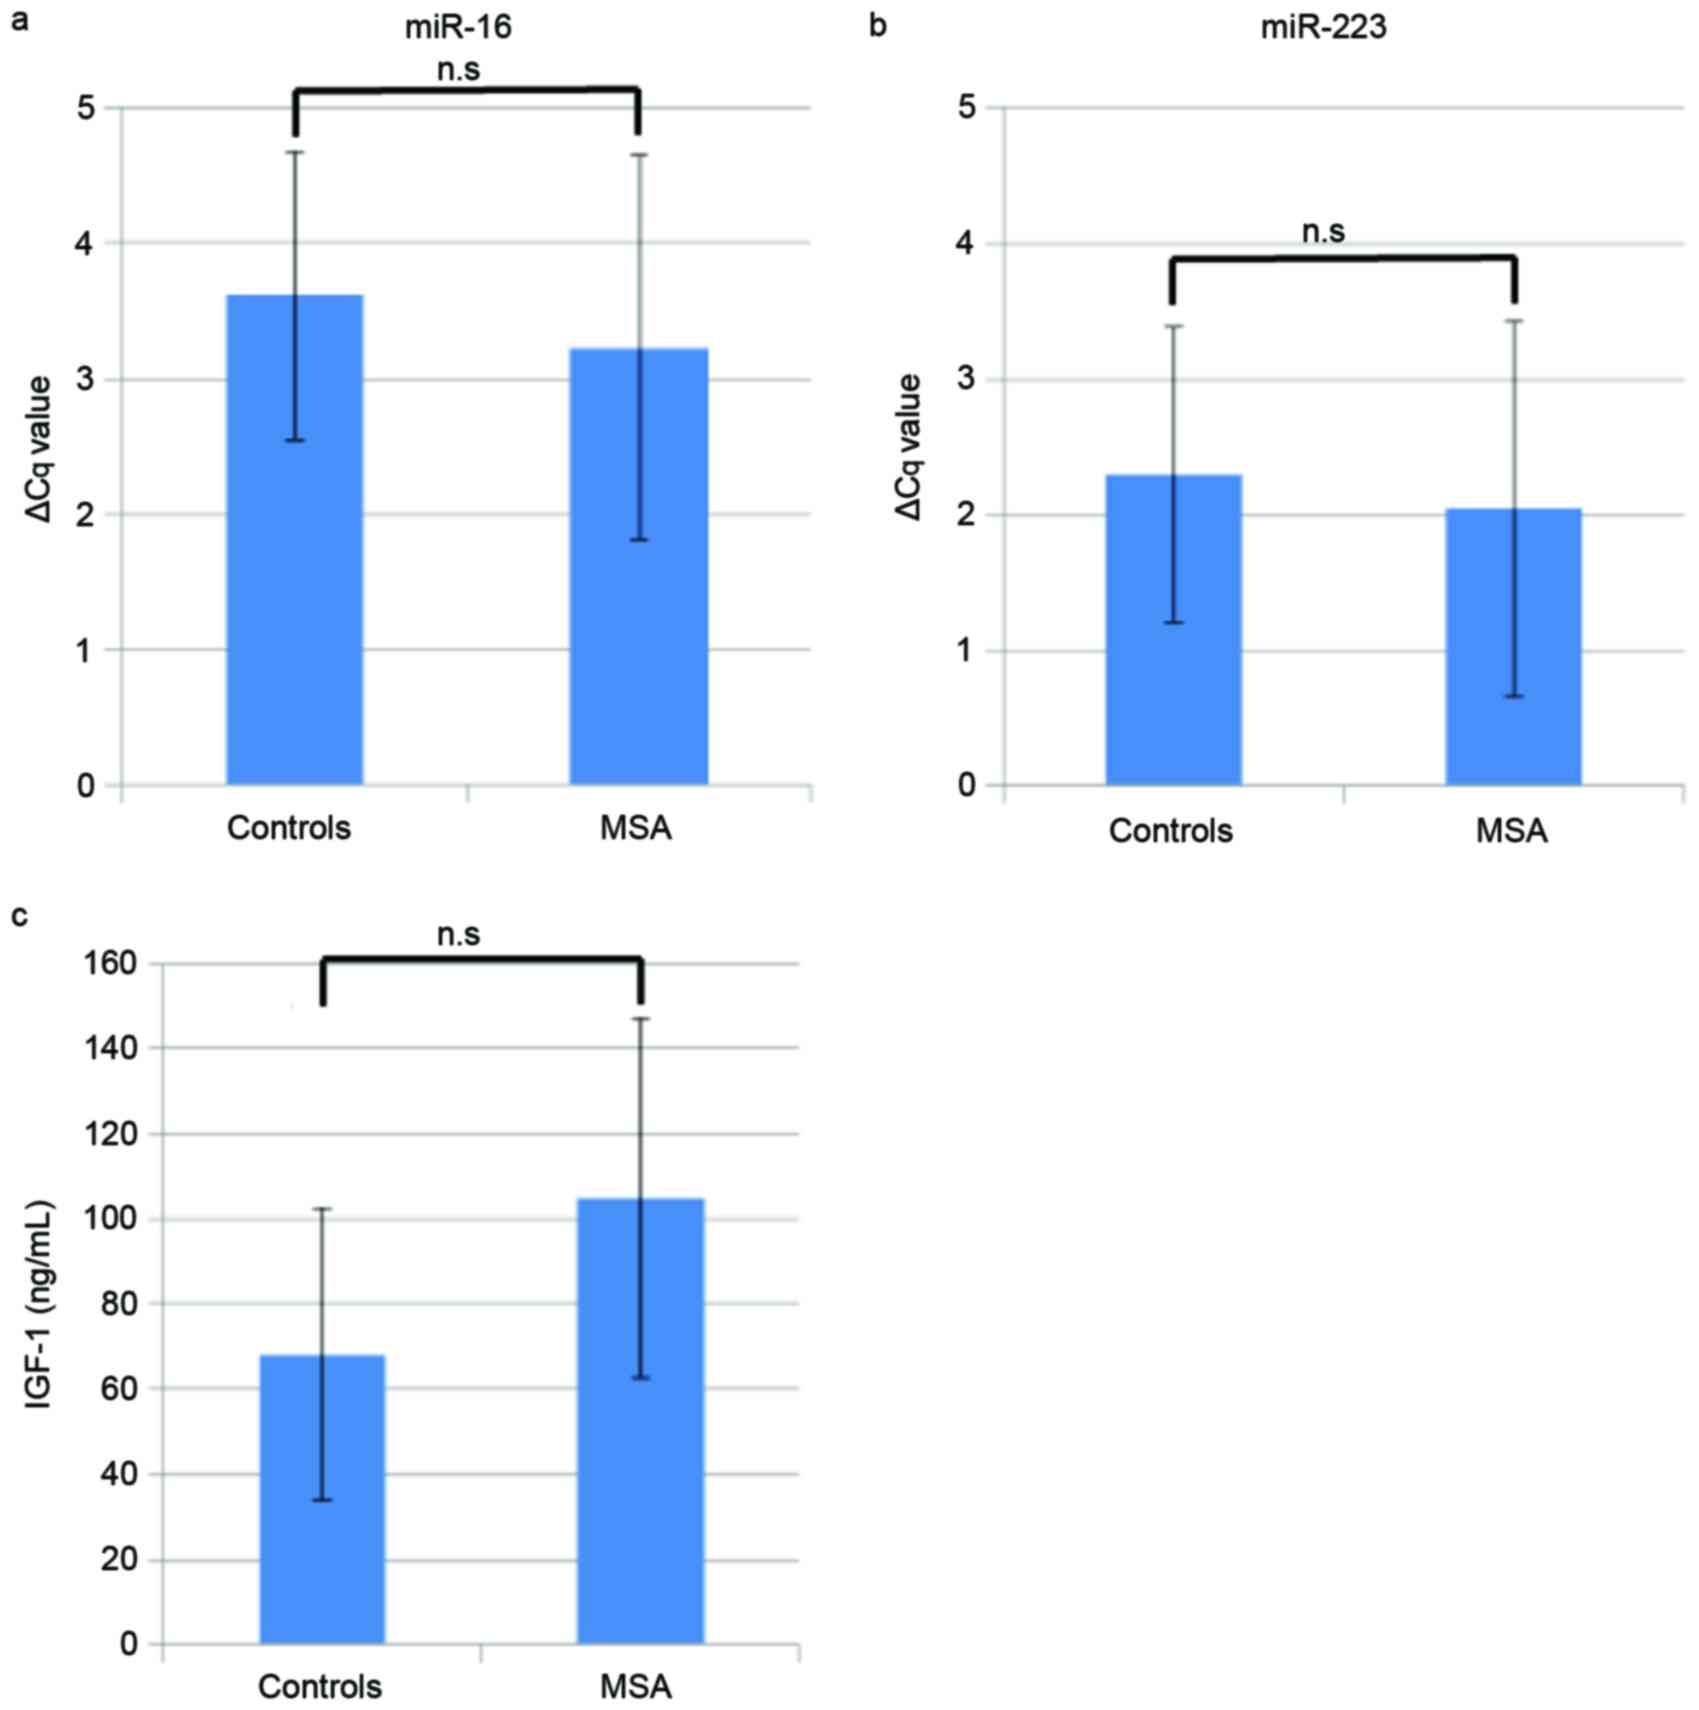
Quantification of miR-16 and
miR-223
The expression levels of miR-16 and miR-223 were
determined using RT-qPCR to validate the miRNA array data. The mean
ΔCq ± standard deviation of miR-16 was 3.6±1.1 and 3.2±1.4 for the
control and MSA groups, respectively (Fig. 4A). Similarly, for miR-223, the
value was 2.3±1.1 and 2.0±1.4 for the control and MSA groups
(Fig. 4B). There were no
significant differences between the miRNA levels of the patients
with MSA and the healthy controls.
Quantification of IGF-1
Mean serum IGF-1 levels were revealed to be
68.1±34.2 ng/ml in control group and 105±42.1 ng/ml in the MSA
group (Fig. 4C). However, no
statistically significant difference in IGF-1 levels was detected
between patients with MSA and healthy controls.
Discussion
In the present study, 50 upregulated miRNAs and 17
downregulated miRNAs were identified in serum from patients with
MSA, using a microarray platform. The hierarchical clustering
analysis identified marked differences between the miRNA profiles
of the MSA and the control groups.
There are few reports on miRNA profiling in patients
with MSA (14,15). It has been demonstrated that
miR-24, miR-223 and miR-324-3p are upregulated in the serum of
patients with MSA or PD (14), and
a greater upregulation of miR-24, miR-34b and miR-148b was observed
in MSA when compared with PD. In studies investigating miRNA in the
MSA brain, it was observed that miR-96 was upregulated in the
frontal cortex (16) and miR-202
was upregulated in the cerebellum (15).
The results of the present study also identified
that miR-24 and miR-223 were upregulated in MSA serum, as described
previously (14). These results
indicate that the methods used by the present study to determine
the profile of miRNA are valid. However, the upregulation of miR-96
and miR-202 described in these previous studies in MSA brain tissue
was not observed in the present study. These differing results may
be due to the differences between the brain tissue and serum
samples used in each study.
A previous study demonstrated that the expression of
several miRNAs was altered in a mouse model of pre-motor stage MSA
(17) however, in the present
study, this altered expression of miRNA was not observed. These
differing results may be due to differences between mouse brain
tissue and human serum.
miR-16 was the most elevated miRNA in the present
study. The function of miR-16 has been primarily investigated in
the field of oncology, and has been demonstrated to act as a tumor
suppressor, an oncomiR (an miRNA associated with cancer), a
modulator of the immune response and a negative regulator of
angiogenesis (18). It has also
been reported that miR-16 promotes α-synuclein aggregation by
downregulating heat shock protein 70 (HSP70) in a neuroblastoma
cell line (19). A previous study
of brain tissue with MSA identified that the dysfunction of HSP70
may contribute to neuronal cell death (20). Therefore, the elevation of miR-16
in the serum of patients with MSA may cause an accumulation of
α-synuclein via the downregulation of HSP70, which may be
associated with the pathogenesis of MSA.
Previous studies have demonstrated that miR-24
(21), and the other upregulated
miRNAs identified in the present study [miR-17 (22), miR-20a (23,24),
miR-25 (25), miR-30d (26,27)
and miR-451 (28)], are associated
with autophagy. These miRNAs serve a role in inhibiting autophagy,
downregulating the expression of target genes (Table IV). In brain tissue with MSA, an
impairment of autophagy has been observed (29). These miRNAs may decrease the level
of autophagy-associated protein and induce the impairment of
autophagy in patients with MSA.
| Table IV.miRNAs and target genes associated
with autophagy. |
Table IV.
miRNAs and target genes associated
with autophagy.
| Author, year | miRNA | Target gene | (Refs.) |
|---|
| Kawamoto et
al, 2007 | miR-24 | ATG4 | (20) |
| Pan et al,
2015 | miR-17 | ATG7 | (21) |
| Comincini et
al, 2013; Sun et al, 2015; Wang et al, 2015 | miR-20a | ULK1, LC3-II,
ATG16L1 | (22,23,25) |
| Wu et al,
2012 | miR-25 | ULK1 | (24) |
| Wang et al,
2015; Yang et al, 2013 | miR-30d | Beclin-1, BNIP3L,
ATG2, ATG5, ATG12 | (25,26) |
| Zhang et al,
2014 | miR-451 | TSC1 | (27) |
In agreement with a previous study, miR-223 was also
upregulated in the present study (14). It has been demonstrated that
upregulation of miR-223 is associated with the pathophysiology of
infection, inflammation and cancer (30). An in vitro study indicated
that miR-223 downregulated the IGF-1 receptor and inhibited cell
proliferation (10). In addition,
the serum IGF-1 level increased in patients with MSA and is
associated with disease progression (9). Therefore, an upregulation of miR-223
expression may contribute to the inhibition of IGF-1 signaling and
thus induce cell death. Elevated IGF-1 levels in patients with MSA
may be a compensatory response to upregulated miR-223. The present
study assessed serum IGF-1 levels by the immune radio metric assay
and serum miR-223 levels were measured by RT-qPCR. However, there
were no significant differences observed between the IGF-1 and
miR-223 levels in patients with MSA and the healthy controls in the
present study; these results may be due to the small sample
size.
The present study also observed that members of the
let-7 family were upregulated in the serum of patients with MSA.
The human let-7 family, which contains 13 members, is widely
recognized as a class of miRNAs that have a tumor-suppressing
effect (31). A previous study
demonstrated that extracellular let-7b induced neurodegeneration
through the neuronal toll-like receptor 7 and that the levels of
cerebrospinal fluid let-7b expression in patients with Alzheimer's
disease were higher than those observed in the healthy control
subjects (32). Similarly, let-7
family members, including let-7b, may induce neurodegeneration in
patients with MSA.
Using a microarray platform, the present study
identified 22 upregulated miRNAs and 17 downregulated miRNAs in the
serum of patients with MSA-P. The hierarchical clustering analysis
observed marked differences in the miRNA profiles between the MSA
and control groups. These alterations in the expression of miRNA
may explain the differences between the pathophysiology of patients
with MSA-P and MSA-C.
The present study had a number of limitations. The
sample size was small and no validation of the level of miRNA
expression was performed. In future investigations, a greater
number of patients with MSA should be examined and individual miRNA
expression levels should be determined by RT-qPCR. In addition, the
present study analyzed serum miRNA, not cerebrospinal fluid (CSF)
miRNA, the latter of which may be more appropriate for
investigating neurodegenerative disorders such as MSA. However,
analyses of miRNA expression in the serum of individuals with MSA
may be more suitable, as obtaining serum samples is easier than
collecting CSF samples.
In conclusion, the present study identified
dysregulated miRNAs in the serum of patients with MSA. These miRNAs
may serve as effective biomarkers for MSA and contribute to the
pathogenesis of MSA, which may involve the accumulation of
α-synuclein and the suppression of autophagy.
References
|
1
|
Stefanova N, Bücke P, Duerr S and Wenning
GK: Multiple system atrophy: An update. Lancet Neurol. 8:1172–1178.
2009. View Article : Google Scholar : PubMed/NCBI
|
|
2
|
Joutsa J, Gardberg M, Röyttä M and
Kaasinen V: Diagnostic accuracy of parkinsonism syndromes by
general neurologists. Parkinsonism Relat Disord. 20:840–844. 2014.
View Article : Google Scholar : PubMed/NCBI
|
|
3
|
Jellinger KA: Neuropathology of multiple
system atrophy: New thoughts about pathogenesis. Mov Disord.
29:1720–1741. 2014. View Article : Google Scholar : PubMed/NCBI
|
|
4
|
Stefanova N, Kaufmann WA, Humpel C, Poewe
W and Wenning GK: Systemic proteasome inhibition triggers
neurodegeneration in a transgenic mouse model expressing human
α-synuclein under oligodendrocyte promoter: Implications for
multiple system atrophy. Acta Neuropathol. 124:51–65. 2012.
View Article : Google Scholar : PubMed/NCBI
|
|
5
|
Bartel DP: MicroRNAs: Target recognition
and regulatory functions. Cell. 136:215–233. 2009. View Article : Google Scholar : PubMed/NCBI
|
|
6
|
Salta E and De Strooper B: Non-coding RNAs
with essential roles in neurodegenerative disorders. Lancet Neurol.
11:189–200. 2012. View Article : Google Scholar : PubMed/NCBI
|
|
7
|
Cloutier F, Marrero A, O'Connell C and
Morin P Jr: MicroRNAs as potential circulating biomarkers for
amyotrophic lateral sclerosis. J Mol Neurosci. 56:102–112. 2015.
View Article : Google Scholar : PubMed/NCBI
|
|
8
|
Pellecchia MT, Pivonello R, Longo K,
Manfredi M, Tessitore A, Amboni M, Pivonello C, Rocco M, Cozzolino
A, Colao A and Barone P: Multiple system atrophy is associated with
changes in peripheral insulin-like growth factor system. Mov
Disord. 25:2621–2626. 2010. View Article : Google Scholar : PubMed/NCBI
|
|
9
|
Numao A, Suzuki K, Miyamoto M, Miyamoto T
and Hirata K: Clinical correlates of serum insulin-like growth
factor-1 in patients with Parkinson's disease, multiple system
atrophy and progressive supranuclear palsy. Parkinsonism Relat
Disord. 20:212–216. 2014. View Article : Google Scholar : PubMed/NCBI
|
|
10
|
Jia CY, Li HH, Zhu XC, Dong YW, Fu D, Zhao
QL, Wu W and Wu XZ: MiR-223 suppresses cell proliferation by
targeting IGF-1R. PLoS One. 6:e270082011. View Article : Google Scholar : PubMed/NCBI
|
|
11
|
Zhu S, Peng W, Li X, Weng J, Zhang X, Guo
J, Huang D, Rong Q and Chen S: miR-1827 inhibits osteogenic
differentiation by targeting IGF1 in MSMSCs. Sci Rep. 7:461362017.
View Article : Google Scholar : PubMed/NCBI
|
|
12
|
Gilman S, Wenning GK, Low PA, Brooks DJ,
Mathias CJ, Trojanowski JQ, Wood NW, Colosimo C, Dürr A, Fowler CJ,
et al: Second consensus statement on the diagnosis of multiple
system atrophy. Neurology. 71:670–676. 2008. View Article : Google Scholar : PubMed/NCBI
|
|
13
|
Livak KJ and Schmittgen TD: Analysis of
relative gene expression data using real-time quantitative PCR and
the 2(-Delta Delta C(T)) method. Methods. 25:402–408. 2001.
View Article : Google Scholar : PubMed/NCBI
|
|
14
|
Vallelunga A, Ragusa M, Di Mauro S,
Iannitti T, Pilleri M, Biundo R, Weis L, Di Pietro C, De Iuliis A,
Nicoletti A, et al: Identification of circulating microRNAs for the
differential diagnosis of Parkinson's disease and multiple system
atrophy. Front Cell Neurosci. 8:1562014. View Article : Google Scholar : PubMed/NCBI
|
|
15
|
Lee ST, Chu K, Jung KH, Ban JJ, Im WS, Jo
HY, Park JH, Lim JY, Shin JW, Moon J, et al: Altered expression of
miR-202 in cerebellum of multiple-system atrophy. Mol Neurobiol.
51:180–186. 2015. View Article : Google Scholar : PubMed/NCBI
|
|
16
|
Ubhi K, Rockenstein E, Kragh C, Inglis C,
Spencer B, Michael S, Mante M, Adame A, Galasko D and Masliah E:
Widespread microRNA dysregulation in multiple system
atrophy-disease-related alteration in miR-96. Eur J Neurosci.
39:1026–1041. 2014. View Article : Google Scholar : PubMed/NCBI
|
|
17
|
Schafferer S, Khurana R, Refolo V, Venezia
S, Sturm E, Piatti P, Hechenberger C, Hackl H, Kessler R, Willi M,
et al: Changes in the miRNA-mRNA regulatory network precede motor
symptoms in a mouse model of multiple system atrophy: Clinical
implications. PLoS One. 11:e01507052016. View Article : Google Scholar : PubMed/NCBI
|
|
18
|
Huang E, Liu R and Chu Y: miRNA-15a/16: As
tumor suppressors and more. Future Oncol. 11:2351–2363. 2015.
View Article : Google Scholar : PubMed/NCBI
|
|
19
|
Zhang Z and Cheng Y: miR-16-1 promotes the
aberrant α-synuclein accumulation in Parkinson disease via
targeting heat shock protein 70. ScientificWorldJournal.
2014:9383482014.PubMed/NCBI
|
|
20
|
Kawamoto Y, Akiguchi I, Shirakashi Y,
Honjo Y, Tomimoto H, Takahashi R and Budka H: Accumulation of Hsc70
and Hsp70 in glial cytoplasmic inclusions in patients with multiple
system atrophy. Brain Res. 1136:219–227. 2007. View Article : Google Scholar : PubMed/NCBI
|
|
21
|
Pan B, Chen Y, Song H, Xu Y, Wang R and
Chen L: Mir-24-3p downregulation contributes to VP16-DDP resistance
in small-cell lung cancer by targeting ATG4A. Oncotarget.
6:317–331. 2015. View Article : Google Scholar : PubMed/NCBI
|
|
22
|
Comincini S, Allavena G, Palumbo S, Morini
M, Durando F, Angeletti F, Pirtoli L and Miracco C: microRNA-17
regulates the expression of ATG7 and modulates the autophagy
process, improving the sensitivity to temozolomide and low-dose
ionizing radiation treatments in human glioblastoma cells. Cancer
Biol Ther. 14:574–586. 2013. View Article : Google Scholar : PubMed/NCBI
|
|
23
|
Sun KT, Chen MY, Tu MG, Wang IK, Chang SS
and Li CY: MicroRNA-20a regulates autophagy related protein-ATG16L1
in hypoxia-induced osteoclast differentiation. Bone. 73:145–153.
2015. View Article : Google Scholar : PubMed/NCBI
|
|
24
|
Wu H, Wang F, Hu S, Yin C, Li X, Zhao S,
Wang J and Yan X: MiR-20a and miR-106b negatively regulate
autophagy induced by leucine deprivation via suppression of ULK1
expression in C2C12 myoblasts. Cell Signal. 24:2179–2186. 2012.
View Article : Google Scholar : PubMed/NCBI
|
|
25
|
Wang Z, Wang N, Liu P, Chen Q, Situ H, Xie
T, Zhang J, Peng C, Lin Y and Chen J: MicroRNA-25 regulates
chemoresistance-associated autophagy in breast cancer cells, a
process modulated by the natural autophagy inducer
isoliquiritigenin. Oncotarget. 5:7013–7026. 2014. View Article : Google Scholar : PubMed/NCBI
|
|
26
|
Yang X, Zhong X, Tanyi JL, Shen J, Xu C,
Gao P, Zheng TM, DeMichele A and Zhang L: mir-30d regulates
multiple genes in the autophagy pathway and impairs autophagy
process in human cancer cells. Biochem Biophys Res Commun.
431:617–622. 2013. View Article : Google Scholar : PubMed/NCBI
|
|
27
|
Zhang Y, Yang WQ, Zhu H, Qian YY, Zhou L,
Ren YJ, Ren XC, Zhang L, Liu XP, Liu CG, et al: Regulation of
autophagy by miR-30d impacts sensitivity of anaplastic thyroid
carcinoma to cisplatin. Biochem Pharmacol. 87:562–570. 2014.
View Article : Google Scholar : PubMed/NCBI
|
|
28
|
Song L, Su M, Wang S, Zou Y, Wang X, Wang
Y, Cui H, Zhao P, Hui R and Wang J: MiR-451 is decreased in
hypertrophic cardiomyopathy and regulates autophagy by targeting
TSC1. J Cell Mol Med. 18:2266–2274. 2014. View Article : Google Scholar : PubMed/NCBI
|
|
29
|
Tanji K, Odagiri S, Maruyama A, Mori F,
Kakita A, Takahashi H and Wakabayashi K: Alteration of
autophagosomal proteins in the brain of multiple system atrophy.
Neurobiol Dis. 49:190–198. 2013. View Article : Google Scholar : PubMed/NCBI
|
|
30
|
Haneklaus M, Gerlic M, O'Neill LA and
Masters SL: miR-223: Infection, inflammation and cancer. J Intern
Med. 274:215–226. 2013. View Article : Google Scholar : PubMed/NCBI
|
|
31
|
Boyerinas B, Park SM, Hau A, Murmann AE
and Peter ME: The role of let-7 in cell differentiation and cancer.
Endocr Relat Cancer. 17:F19–F36. 2010. View Article : Google Scholar : PubMed/NCBI
|
|
32
|
Lehmann SM, Krüger C, Park B, Derkow K,
Rosenberger K, Baumgart J, Trimbuch T, Eom G, Hinz M, Kaul D, et
al: An unconventional role for miRNA: Let-7 activates Toll-like
receptor 7 and causes neurodegeneration. Nat Neurosci. 15:827–835.
2012. View
Article : Google Scholar : PubMed/NCBI
|