Obesity is a major public health concern, and
contributes to morbidity and mortality rates via associations with
chronic diseases (1,2), including type 2 diabetes mellitus,
cardiovascular diseases, osteoarthritis and certain types of cancer
(3). Although weight loss through
dietary regimes and exercise is commonly prescribed, there is
minimal insight into the molecular basis of weight loss,
particularly concerning disparities in the extent of weight loss
among individuals (4,5). The observed differences in weight
loss among individuals is an important issue for clinicians and
patients, and these differences are predominantly observed between
males and females undergoing the same treatment courses (6).
The current understanding of the etiology of obesity
and weight loss involves environmental, genetic and epigenetic
factors (4,7,8).
External factors in the pathogenesis of obesity include diet,
physical exercise and stress. Previous studies indicate that single
nucleotide polymorphisms (SNPs) are also important determinants of
weight loss (8,9). It is accepted that genetic factors
partially determine individual susceptibility to weight gain and
obesity, however, the established genetic variants only partially
explain the variation observed. As a result, interest in
understanding the potential role of epigenetics as a mediator of
gene-environment interactions in obesity development has increased
(10). Previous studies have
investigated gene-environment interactions associated with the
development of obesity (4,11–13).
The initial studies focused on the associations between obesity and
global DNA methylation (14–16).
Global DNA methylation refers to the overall level of
methylcytosine in the genome as a percentage of total cytosine,
while gene-specific methylation refers to the methylation status of
a specific site. While numerous studies have reported a complex
association between global DNA methylation and body mass index
(BMI), there is no consistent evidence for an association between
global DNA methylation and obesity, which may be due to the lack of
a gold standard method of measuring global DNA methylation
(14,17–22).
Genome-wide arrays have demonstrated a concurrent loss of
methylation in the non-coding areas of the genome and gain of
methylation in CpG islands located on promoter regions of obese
patients with a high BMI, compared with patients with a low BMI.
The studies also identified multiple obesity-associated
differentially methylated sites, primarily in blood cells (23–26).
Cytosine methylation in SNPs (allele-specific
methylation) has previously been successfully investigated in
weight loss (9). Accumulating
evidence indicates that the tendency towards adult obesity has
early developmental origins, which are associated with a
‘nutritional memory response’ that can take form in epigenetic
modifications during a lifetime. Associations between methylation
marks at birth and later life obesity were reported (14,27–36).
However, to the best of our knowledge, the potential genetic and
epigenetic interactions associated with weight loss have not
previously been investigated (37–41).
The present study aimed to investigate the genetic
and epigenetic alterations associated with weight loss in a
population of obese patients participating in a personalized weight
loss program, which was designed based on genetic information.
Personalized weight loss diets and lifestyle modification plans
were provided to study participants according to the combined SNP
profiles of five genes associated with energy balance and lipid
metabolism. The present study determined the association between a
global DNA methylation index (GDMI) and the allelic composition of
near insulin-induced gene 2 (INSIG2), melanocortin 4
receptor (MC4R), adrenoceptor β2 (ADRB2),
apolipoprotein A5 (APOA5) and G-protein subunit β3
(GNB3) in 105 obese or overweight patients that participated
in a 12 month program.
The patients were referred to the Clinical Genetics
laboratory of CGC (Madrid Spain) between January 2009 and June
2010, by either an endocrinologist or a dietitian in order to
establish a healthy lifestyle intervention based on the risk of
obesity inherent to each polymorphism investigated. Upon arrival at
the clinic, the patients answered a questionnaire regarding
previous health issues, including surgery, pathologies, diabetes
and cardiovascular disease, and their height and present weight was
recorded. The Institutional Review Boards of the Johns Hopkins
University School of Medicine (Baltimore, MD, USA) approved the
protocol for the present study. All participants signed an informed
consent form where it was specifically stated that the samples may
be used for anonymized research studies and for publications.
The patients participated in a personalized weight
reduction program guided by their genotypic profile, which included
SNP-associated dietary recommendations, for 12 months. The BMI in
kg/m2 was calculated for each participant prior to and
after completion of the personalized weight reduction program.
Adult obesity was defined as a BMI of ≥30 kg/m2, and
patients were classified as overweight if they had a BMI between 25
and 29.9 kg/m2. The participants underwent a
personalized weight reduction program based on their genotypic
profile. This method utilized SNP data to develop dietary
recommendations. Participants also provided data regarding age at
maximum weight recorded, previous dietary interventions and maximum
weight loss. Additionally, women provided details regarding age at
menarche and pregnancy history, in addition to height and weight
prior to and following menarche and pregnancy. The polymorphisms
were investigated in our laboratory and the results were disclosed
in a post-test genetic counseling session.
The dietary and lifestyle interventions were
subsequently tailored to the genotype of each patient by their
endocrinologist/dietitian, following the general recommendations
provided by the laboratory, as described in Table I. Genetic information and lifestyle
modification recommendations were provided during the initial
counseling session and adherence was determined at follow-up by the
referring endocrinologist/dietitian. Patients were provided with a
personalized weight reduction program, with primary and
preferential lifestyle interventions, together with supplemental
activities for each SNP of the five loci in the panel. The
descriptions of sequence variants presented in Table I follow the Human Genome Variation
Society 2016 recommended format (42). The five loci selected for this
intervention are collectively associated with energy balance and
lipid metabolism in ≥1 of the following metabolic pathways or
conditions: Development of obesity, high BMI, hyperphagia,
hyperinsulinemia, lipolysis control, lipid metabolism homeostasis
and exercise-induced weight loss (43–65).
Information on the well-established associations
between each SNP and the risk of obesity was also provided to each
patient. Each patient received up to three personalized
dietary/lifestyle recommendations, based on their individual
genotypic mosaic, which included a combination of physical activity
and diets low in calories, carbohydrates and/or lipids.
DNA was extracted from peripheral blood mononuclear
cell (PBMC) samples obtained from all participants, and all samples
were kept at −80°C until analysis. Blood was collected in 4 ml
vacutainer tubes containing EDTA (BD Biosciences, Franklin Lakes,
NJ, USA). Whole blood was centrifuged at 300 × g for 10 min and the
leukocyte layer was separated, adding the same volume of PBS (0.01
M PO4, 0.15 M NaCl, pH 7.2). The resulting mixture was carefully
placed on Ficoll-Paque (17-1440-02), followed by centrifugation at
700 × g for 30 min. The corresponding leukocyte portion was
separated in another tube and centrifuged at 300 × g for 10 min.
The supernatant was discarded and the material precipitated was
washed with 1 ml PBS (0.01 M PO4, 0.15 M NaCl, pH 7.2) by
centrifugation at 300 × g for 10 min and resuspended in 200 µl NET
100 (5 M NaCl, 1 M Tris-HCl, 0.5 M EDTA, pH 8.0) to be stored at
−20°C. The concentration of cells was determined by manual cell
counting using a Neubauer chamber and divided into three equal
aliquots. PBMC DNA samples were sent to the Head and Neck Cancer
Research Laboratory of Johns Hopkins School of Medicine where they
were digested with 50 µg/ml proteinase K in the presence of 1%
sodium dodecyl sulfate at 48°C for 3 days, which was followed by
phenol/chloroform extraction and ethanol precipitation, and finally
dissolved in 30 µl LoTE (2.5 mmol/l EDTA and 10 mmol/l Tris-HCl),
as previously described (66).
In total, sufficient DNA levels were obtained from
95 samples for the global DNA methylation analysis. The global DNA
methylation levels were determined with an ELISA-based commercial
kit (Imprint Methylated DNA Quantification kit; cat no. MDQ1;
Sigma-Aldrich, St Louis, MO, USA), according to the manufacturer's
protocol. The MDQ1 kit is a high-throughput molecular biology kit,
which employs a 96-well plate format to provide accurate
differential global DNA methylation absorbance readings with as
little as 50 ng genomic DNA. In the present study, 2 µl DNA at a
concentration of 100 ng/µl was diluted with 28 µl lysis and binding
buffers, and incubated at 37°C for 60 min. The samples were
incubated with capture and detection antibodies and absorbance was
read at 450 nm. Quantification of global DNA methylation was
performed by calculating the amount of methylated cytosine
(5-methylcytosine) in the sample relative to the global cytidine
(5-methylcytosine + deoxycytosine) in a positive control that had
been previously methylated. All samples were analyzed in
duplicate.
DNA was genotyped using made-to-order TaqMan SNP
Genotyping Assays with the following cat no. 4351379 and assay IDs:
C_29404113_20 (near INSIG2-rs7566605); C_32667060_10
(MC4R-rs17782313); C_2084765_20 (ADRB2-rs1042714);
C_2310403_10 (APOA5-rs662799); C_2184734_10
(GNB3-rs5443) (Thermo Fisher Scientific, Inc., Waltham, MA,
USA).
The following probe sequences were used in each
respective genotyping assay: i) rs7566605 (near INSIG2)
consensus sequence-Chr2: 118078449 on GrCH38:
5-AAGTACTTAACAATGGATATTTGAT[C/G]GTGGTCCTTTAGGTCTGTACCAGGG-3′;
ii) rs17782313 (MC4R) consensus sequence-Chr18: 60183864 on
GrCH38:
5′-GTTTAAAGCAGGAGAGATTGTATCC[C/T]GATGGAAATGACAAGAAAAGCTTCA-3′;
iii) rs1042714 (ADRB2) consensus sequence-Chr5: 148826910 on
GrCH38:
5′-TGCGCCGGACCACGACGTCACGCAG[C/G]AAAGGGACGAGGTGTGGGTGGTGGG-3′;
iv) rs662799 (APOA5) consensus sequence-Chr11: 116792991 on
GrCH38:
5′-GAGCCCCAGGAACTGGAGCGAAAGT[A/G]AGATTTGCCCCATGAGGAAAAGCTG-3′;
and v) rs5443 (GNB3) consensus sequence-Chr12:6845711 on
GrCH38:
5′-AGAGCATCATCTGCGGCATCACGTC[C/T]GTGGCCTTCTCCCTCAGTGGCCGCC-3′.
The two probes for each locus were identical apart
from the region highlighted in square brackets, where the
nucleotide in this position differed between the two probes, as
indicated.
Quantitative polymerase chain reactions (PCR) were
performed with two allele-specific TaqMan MGB probes for each of
the five SNPs tested on an ABI 7,500 Real-Time PCR instrument.
Duplicate reactions were run for each assay using a 25 µl reaction
volume on a 96-well plate. PCR was performed with 20 ng input DNA,
1 µmol/l each primer, 0.25 µmol/l each probe and 1× TaqMan master
mix (cat no. 4371355; Thermo Fisher Scientific, Inc., Waltham, MA,
USA). The cycling program was one cycle of 50°C for 2 min, one
cycle of 95°C for 10 min, followed by 40 cycles of 95°C for 15 sec
and 60°C for 1 min. The ROX passive reference provides an internal
reference to which the reporter-dye signal can be normalized during
data analysis. The Taqman master mix contained AmpliTaq
Gold® DNA Polymerase, Ultra Pure (UP)
Deoxyribonucleotide triphosphates (dNTPs), ROX passive reference
and buffer components optimized for tight endpoint fluorescence
clusters, reproducible allelic discrimination and bench top
stability. Fluorescence intensities (arbitrary units) of the two
probes were plotted and genotype calling was performed using
predefined calling parameters.
Univariate and multivariate analyses were performed
to investigate the association between each SNP and global DNA
methylation adjusting for sex, age, weight, BMI and weight loss
using the association function in the SNPassoc package in R. This
function carries out an association analysis between a single SNP
and a dependent variable (phenotype) under five different genetic
models (inheritance patterns): co-dominant, dominant, recessive,
over-dominant and log-additive. The only significant association
between global DNA methylation and an SNP, adjusted by BMI and
weight loss, was obtained when using the log additive model.
P<0.05 was considered to indicate a statistically significant
difference. All samples were analyzed in duplicate.
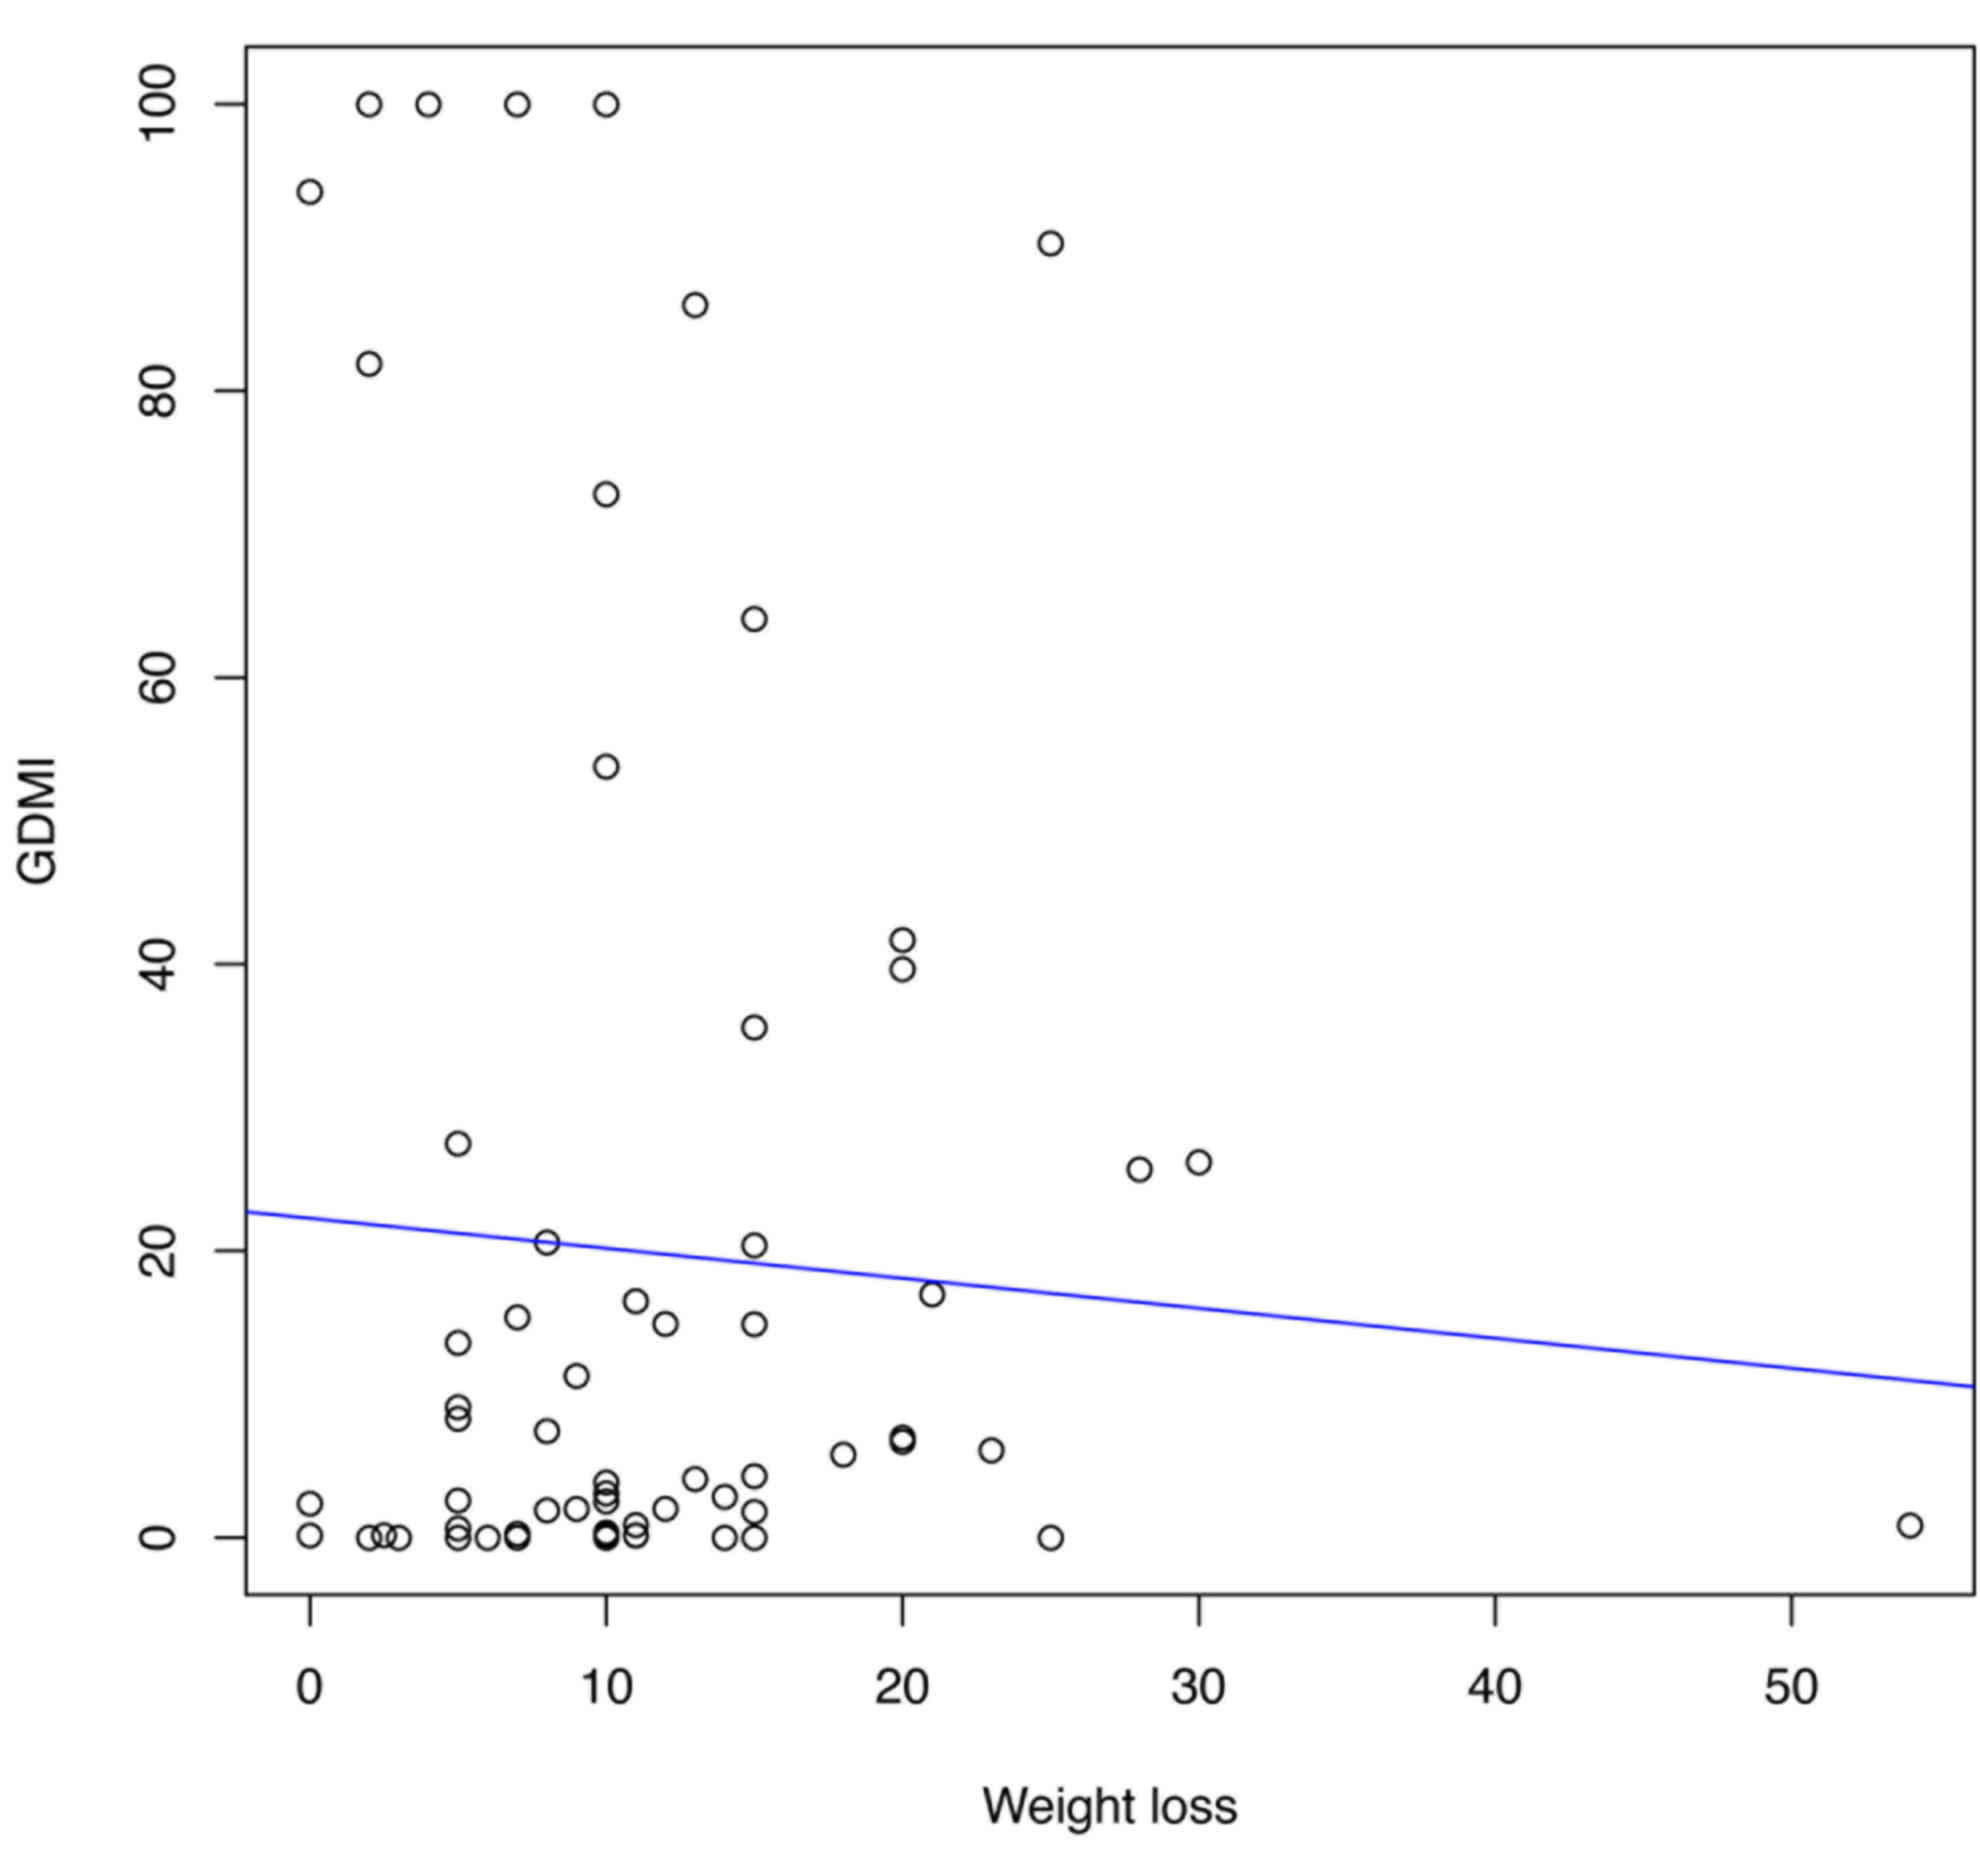
The present study did not identify any associations
between global DNA methylation and weight at baseline, BMI, sex or
age (data not shown). However, an inverse association between
global DNA methylation and weight loss (P<0.05; Fig. 1) was demonstrated. Furthermore,
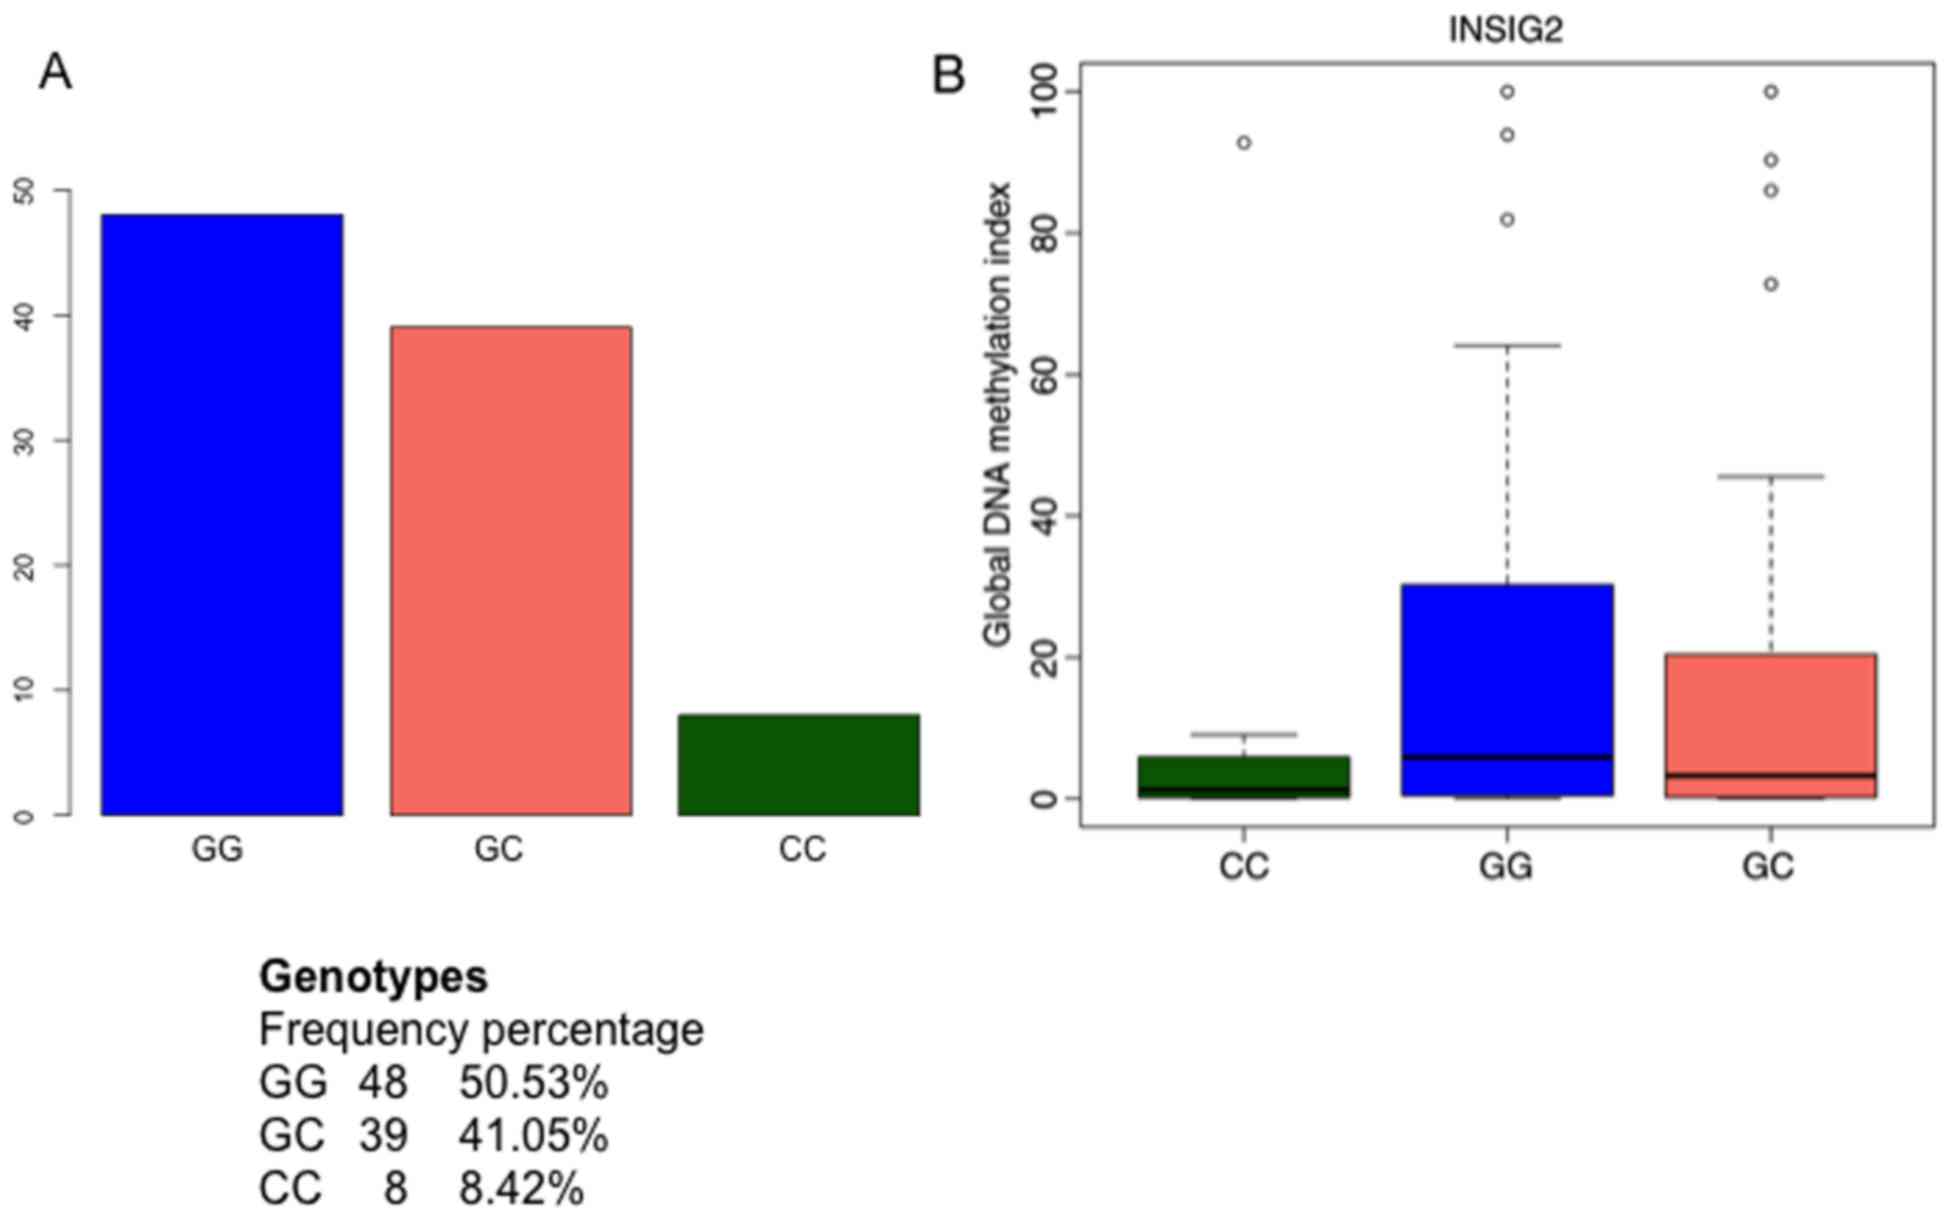
significant associations between the GDMI and INSIG2, after
adjusting for BMI and weight loss (P<0.05), and significant
trends when stratifying by gender (P<0.05) were also observed
(data not shown). The frequency of genotypes for near INSIG2
(rs7566605; 50.53, 41.05 and 8.42% for GG, GC and CC, respectively)
and the boxplots for INSIG2 genotype and their corresponding
GDMI values are presented in Fig.
2. No significant associations between global DNA methylation
and the other genes were observed (data not shown). The frequency
of genotypes for the other four genes were as follows: ADRB2
(rs1042714), 50.53, 34.74 and 14.74% for CC, CG and GG,
respectively; APOA5 (rs662799), 88.42, 10.53 and 1.05% for
AA, AG and GG, respectively; GNB3 (rs5443), 41.05, 50.53 and
8.42% for CC, CT and TT, respectively; and MC4R
(rs17782313), 97.89, 1.05 and 1.05% for GG, AG and AA, respectively
(Table III). Boxplots of GDMI
values stratified by genotype for ADRB2, GNB3,
APOA5 and MC4R are presented in Fig. 3.
The present study demonstrated an inverse
association between global DNA methylation and weight loss; as
weight loss increased, global DNA methylation decreased. However,
no associations between global DNA methylation and weight at
baseline, BMI, sex or age were observed. Therefore, global DNA
methylation may have potential as a marker for weight loss
potential from personalized weight reduction programs based on
genotypic profiles. The association between near INSIG2
(rs7566605) and global DNA methylation indicates that genetic
variants may interact with epigenetic events that are ultimately
associated with weight loss potential. The present study
investigated the association between global DNA methylation and the
allelic composition of five genetic loci associated with energy
balance and lipid metabolism, and weight loss among participants,
in a personalized weight reduction program designed on the basis of
genotypic information. These five loci, near INSIG2
(rs7566605), MC4R (rs17782313), ADRB2 (rs1042714),
APOA5 (rs662799) and GNB3 (rs5443), are among the
most well-characterized SNPs regarding their roles in obesity,
energy balance and lipid metabolism.
Epigenetic alterations occur over time and
throughout the lifetime of individuals. Examples of these
alterations include DNA methylation (83,84)
and histone modifications (85,86),
which are associated with factors such as diet (87), stress (88) and other modifiable lifestyles,
including smoking (89) and
alcohol consumption (90). Global
DNA methylation levels, measured in PBMCs with Long Interspersed
Nucleotide Elements-1 (LINE)-1 as a surrogate endpoint, was
reported to be significantly higher in participants with a higher
degree of weight loss compared with those who exhibited low
responses (<8%) to energy-restricted treatment (91). LINE-1 was reported to be positively
associated with healthy energy and micronutrient intake, and
inversely associated with body fat mass (92).
It has been demonstrated that weight loss induced by
a hypocaloric diet in humans altered the DNA methylation status of
certain genes. Baseline DNA methylation patterns have previously
been employed as epigenetic markers that may allow the degree of
weight loss to be predicted in obese patients (52). In another study, epigenetic scores
were used to predict alterations in body weight (7), and also identified five genes
(aquaporin 9, dual specificity phosphatase 22,
homeodomain-interacting protein kinase 3, troponin T1 slow skeletal
type and troponin I3 cardiac type) that were differentially
methylated between participants with high and low responses to a
weight loss intervention program. The study also reported that
subjects with the highest methylation in these regions exhibited a
significantly enhanced response to the weight loss treatment
program. While these studies demonstrate that differential
methylation at specific loci may have an effect on weight loss, the
results of the present study also demonstrate that global
differential DNA methylation may also be associated with weight
loss.
Global and gene-specific DNA methylation
alterations, which vary with age, sex and socioeconomic status, may
also be predictive biomarkers of weight loss response to
intervention programs (91).
Global DNA methylation and inflammatory gene promoter
hypermethylation are reported to be early biomarkers of adiposity
and metabolic alterations (93).
Global DNA methylation and hydroxymethylation may functions as
biomarkers in obesity and associated comorbidities. DNA methylation
patterns are reported to behave differently depending on the choice
of intervention in obesity (diet or surgery) (94).
The major strength of the present study is the
simultaneous analysis of SNP loci and DNA methylation in the
context of weight loss in obese patients. Interactions between
germline variants of genes with somatic changes in epigenetic
modifications may provide insights into pathologic causality in
obesity and weight loss. The present study also demonstrates that
non-invasive methods of assaying molecular biomarkers, such as
those employed in the current study, may translate well in the
clinic. Additionally, as global DNA methylation does not appear to
be associated with initial BMI, initial weight, sex or age, further
studies of this type should consider including additional
weight-associated variable measurements that may be associated with
global and gene-specific DNA methylation levels.
The results of the current study indicate that
precision weight loss programs designed based on genetic and
epigenetic information, which involve the creation of personalized
interventions for individuals, may be beneficial for obese patients
(95,96). These personalized programs may
incorporate data from previous studies that have identified
associations between DNA methylation, diet and weight loss. At
present, is difficult to interpret how the interaction between
INSIG2 and global DNA methylation modulates the weight loss
response. Therefore, additional studies should consider the
concurrent associations of established and unknown energy balance
and lipid metabolism SNPs to improve the understanding of the role
of DNA methylation in obesity and the weight loss responses.
The present study was supported by the National
Cancer Institute (grant nos. K01-CA164092 and U01-CA8498).
|
1
|
Jiang Y, Chen Y, Manuel D, Morrison H and
Mao Y: Obesity Working Group: Quantifying the impact of obesity
category on major chronic diseases in Canada.
ScientificWorldJournal. 7:1211–1221. 2007. View Article : Google Scholar
|
|
2
|
Huxley R, James WP, Barzi F, Patel JV,
Lear SA, Suriyawongpaisal P, Janus E, Caterson I, Zimmet P,
Prabhakaran D, et al: Ethnic comparisons of the cross-sectional
relationships between measures of body size with diabetes and
hypertension. Obes Rev. 9 Suppl 1:S53–S61. 2008. View Article : Google Scholar
|
|
3
|
Obesity in Asia Collaboration: Is central
obesity a better discriminator of the risk of hypertension than
body mass index in ethnically diverse populations? J Hypertens.
26:169–177. 2008. View Article : Google Scholar
|
|
4
|
Goni L, Milagro FI, Cuervo M and Martínez
JA: Single-nucleotide polymorphisms and DNA methylation markers
associated with central obesity and regulation of body weight. Nutr
Rev. 72:673–690. 2014. View Article : Google Scholar
|
|
5
|
Lau DC, Douketis JD, Morrison KM, Hramiak
IM, Sharma AM and Ur E: Obesity Canada Clinical Practice Guidelines
Expert Panel: 2006 Canadian clinical practice guidelines on the
management and prevention of obesity in adults and children
(summary). CMAJ. 176:S1–S13. 2007. View Article : Google Scholar :
|
|
6
|
Stroh C, Köckerling F, Weiner R, Horbach
T, Ludwig K, Dressler M, Lange V, Loermann P, Wolff S, Schmidt U,
et al: Are there gender-specific aspects of sleeve gastrectomy-data
analysis from the quality assurance study of surgical treatment of
obesity in Germany. Obes Surg. 22:1214–1219. 2012. View Article : Google Scholar
|
|
7
|
Moleres A, Campión J, Milagro FI, Marcos
A, Campoy C, Garagorri JM, Gómez-Martínez S, Martínez JA,
Azcona-Sanjulián MC and Martí A: EVASYON Study Group: Differential
DNA methylation patterns between high and low responders to a
weight loss intervention in overweight or obese adolescents: The
EVASYON study. FASEB J. 27:2504–2512. 2013. View Article : Google Scholar
|
|
8
|
Bouchard L, Rabasa-Lhoret R, Faraj M,
Lavoie ME, Mill J, Pérusse L and Vohl MC: Differential epigenomic
and transcriptomic responses in subcutaneous adipose tissue between
low and high responders to caloric restriction. Am J Clin Nutr.
91:309–320. 2010. View Article : Google Scholar
|
|
9
|
Mansego ML, Milagro FI, Zulet MA and
Martinez JA: SH2B1 CpG-SNP is associated with body weight reduction
in obese subjects following a dietary restriction program. Ann Nutr
Metab. 66:1–9. 2015. View Article : Google Scholar
|
|
10
|
van Dijk SJ, Tellam RL, Morrison JL,
Muhlhausler BS and Molloy PL: Recent developments on the role of
epigenetics in obesity and metabolic disease. Clin Epigenetics.
7:662015. View Article : Google Scholar :
|
|
11
|
Campión J, Milagro FI, Goyenechea E and
Martínez JA: TNF-alpha promoter methylation as a predictive
biomarker for weight-loss response. Obesity (Silver Spring).
17:1293–1297. 2009.
|
|
12
|
Wang K, Li WD, Zhang CK, Wang Z, Glessner
JT, Grant SF, Zhao H, Hakonarson H and Price RA: A genome-wide
association study on obesity and obesity-related traits. PLoS One.
6:e189392011. View Article : Google Scholar :
|
|
13
|
Mansego ML, Garcia-Lacarte M, Milagro FI,
Marti A and Martinez JA: GENOI members: DNA methylation of miRNA
coding sequences putatively associated with childhood obesity.
Pediatr Obes. 12:19–27. 2017. View Article : Google Scholar
|
|
14
|
van Dijk SJ, Molloy PL, Varinli H,
Morrison JL and Muhlhausler BS: Members of EpiSCOPE: Epigenetics
and human obesity. Int J Obes (Lond). 39:85–97. 2015. View Article : Google Scholar
|
|
15
|
Youngson NA and Morris MJ: What obesity
research tells us about epigenetic mechanisms. Philos Trans R Soc
Lond B Biol Sci. 368:201103372013. View Article : Google Scholar :
|
|
16
|
Na YK, Hong HS, Lee DH, Lee WK and Kim DS:
Effect of body mass index on global DNA methylation in healthy
Korean women. Mol Cells. 37:467–672. 2014. View Article : Google Scholar :
|
|
17
|
Nomura Y, Lambertini L, Rialdi A, Lee M,
Mystal EY, Grabie M, Manaster I, Huynh N, Finik J, Davey M, et al:
Global methylation in the placenta and umbilical cord blood from
pregnancies with maternal gestational diabetes, preeclampsia, and
obesity. Reprod Sci. 21:131–137. 2014. View Article : Google Scholar :
|
|
18
|
BLUEPRINT consortium: Quantitative
comparison of DNA methylation assays for biomarker development and
clinical applications. Nat Biotechnol. 34:726–737. 2016. View Article : Google Scholar
|
|
19
|
Crary-Dooley FK, Tam ME, Dunaway KW,
Hertz-Picciotto I, Schmidt RJ and LaSalle JM: A comparison of
existing global DNA methylation assays to low-coverage whole-genome
bisulfite sequencing for epidemiological studies. Epigenetics.
12:206–214. 2017. View Article : Google Scholar :
|
|
20
|
Perng W, Mora-Plazas M, Marín C, Rozek LS,
Baylin A and Villamor E: A prospective study of LINE-1DNA
methylation and development of adiposity in school-age children.
PLoS One. 8:e625872013. View Article : Google Scholar :
|
|
21
|
Pearce MS, McConnell JC, Potter C, Barrett
LM, Parker L, Mathers JC and Relton CL: Global LINE-1 DNA
methylation is associated with blood glycaemic and lipid profiles.
Int J Epidemiol. 41:210–217. 2012. View Article : Google Scholar :
|
|
22
|
Duggan C, Xiao L, Terry MB and McTiernan
A: No effect of weight loss on LINE-1 methylation levels in
peripheral blood leukocytes from postmenopausal overweight women.
Obesity (Silver Spring). 22:2091–2096. 2014. View Article : Google Scholar :
|
|
23
|
Demerath EW, Guan W, Grove ML, Aslibekyan
S, Mendelson M, Zhou YH, Hedman ÅK, Sandling JK, Li LA, Irvin MR,
et al: Epigenome-wide association study (EWAS) of BMI, BMI change
and waist circumference in African American adults identifies
multiple replicated loci. Hum Mol Genet. 24:4464–4479. 2015.
View Article : Google Scholar :
|
|
24
|
Aslibekyan S, Demerath EW, Mendelson M,
Zhi D, Guan W, Liang L, Sha J, Pankow JS, Liu C, Irvin MR, et al:
Epigenome-wide study identifies novel methylation loci associated
with body mass index and waist circumference. Obesity (Silver
Spring). 23:1493–1501. 2015. View Article : Google Scholar :
|
|
25
|
Dick KJ, Nelson CP, Tsaprouni L, Sandling
JK, Aïssi D, Wahl S, Meduri E, Morange PE, Gagnon F, Grallert H, et
al: DNA methylation and body-mass index: A genome-wide analysis.
Lancet. 383:1990–1998. 2014. View Article : Google Scholar
|
|
26
|
Kaz AM, Wong CJ, Varadan V, Willis JE,
Chak A and Grady WM: Global DNA methylation patterns in Barrett's
esophagus, dysplastic Barrett's and esophageal adenocarcinoma are
associated with BMI, gender, and tobacco use. Clin Epigenetics.
8:1112016. View Article : Google Scholar :
|
|
27
|
Lillycrop K, Murray R, Cheong C, Teh AL,
Clarke-Harris R, Barton S, Costello P, Garratt E, Cook E, Titcombe
P, et al: ANRIL promoter DNA methylation: A perinatal marker for
later adiposity. EBioMedicine. 19:60–72. 2017. View Article : Google Scholar :
|
|
28
|
Lumey LH, Terry MB, Delgado-Cruzata L,
Liao Y, Wang Q, Susser E, McKeague I and Santella RM: Adult global
DNA methylation in relation to pre-natal nutrition. Int J
Epidemiol. 41:116–123. 2012. View Article : Google Scholar
|
|
29
|
Tobi EW, Slieker RC, Stein AD, Suchiman
HE, Slagboom PE, van Zwet EW, Heijmans BT and Lumey LH: Early
gestation as the critical time-window for changes in the prenatal
environment to affect the adult human blood methylome. Int J
Epidemiol. 44:1211–1223. 2015. View Article : Google Scholar :
|
|
30
|
Tobi EW, Goeman JJ, Monajemi R, Gu H,
Putter H, Zhang Y, Slieker RC, Stok AP, Thijssen PE and Müller F:
DNA methylation signatures link prenatal famine exposure to growth
and metabolism. Nat Commun. 5:55922014. View Article : Google Scholar :
|
|
31
|
Agha G, Hajj H, Rifas-Shiman SL, Just AC,
Hivert MF, Burris HH, Lin X, Litonjua AA, Oken E, DeMeo DL, et al:
Birth weight-for-gestational age is associated with DNA methylation
at birth and in childhood. Clin Epigenetics. 8:1182016. View Article : Google Scholar :
|
|
32
|
Kupers LK, Xu X, Jankipersadsing SA, Vaez
A, la Bastide-van Gemert S, Scholtens S, Nolte IM, Richmond RC,
Relton CL, Felix JF, et al: DNA methylation mediates the effect of
maternal smoking during pregnancy on birthweight of the offspring.
Int J Epidemiol. 44:1224–1237. 2015. View Article : Google Scholar :
|
|
33
|
Kresovich JK, Zheng Y, Cardenas A, Joyce
BT, Rifas-Shiman SL, Oken E, Gillman MW, Hivert MF, Baccarelli AA
and Hou L: Cord blood DNA methylation and adiposity measures in
early and mid-childhood. Clin Epigenetics. 9:862017. View Article : Google Scholar :
|
|
34
|
Godfrey KM, Sheppard A, Gluckman PD,
Lillycrop KA, Burdge GC, McLean C, Rodford J, Slater-Jefferies JL,
Garratt E, Crozier SR, et al: Epigenetic gene promoter methylation
at birth is associated with child's later adiposity. Diabetes.
60:1528–34. 2011. View Article : Google Scholar :
|
|
35
|
Richmond SA, Rothman L, Buliung R,
Schwartz N, Larsen K and Howard A: Exploring the impact of a
dedicated streetcar right-of-way on pedestrian motor vehicle
collisions: A quasi experimental design. Accid Anal Prev.
71:222–227. 2014. View Article : Google Scholar
|
|
36
|
Stel J and Legler J: The role of
epigenetics in the latent effects of early life exposure to
obesogenic endocrine disrupting chemicals. Endocrinology.
156:3466–3472. 2015. View Article : Google Scholar :
|
|
37
|
Do C, Shearer A, Suzuki M, Terry MB,
Gelernter J, Greally JM and Tycko B: Genetic-epigenetic
interactions in cis: A major focus in the post-GWAS era. Genome
Biol. 18:1202017. View Article : Google Scholar :
|
|
38
|
Do C, Lang CF, Lin J, Darbary H, Krupska
I, Gaba A, Petukhova L, Vonsattel JP, Gallagher MP, Goland RS, et
al: Mechanisms and disease associations of haplotype-dependent
allele-specific DNA methylation. Am J Hum Genet. 98:934–955. 2016.
View Article : Google Scholar :
|
|
39
|
Cole SA: Epigenetic studies of perinatal
determinants of later obesity link important, but previously
unrelated, genetic and epidemiological findings. EBioMedicine.
20:15–16. 2017. View Article : Google Scholar :
|
|
40
|
Day SE, Coletta RL, Kim JY, Garcia LA,
Campbell LE, Benjamin TR, Roust LR, De Filippis EA, Mandarino LJ
and Coletta DK: Potential epigenetic biomarkers of obesity-related
insulin resistance in human whole-blood. Epigenetics. 12:254–263.
View Article : Google Scholar
|
|
41
|
Aronica L, Levine AJ, Brennan K, Mi J,
Gardner C, Haile RW and Hitchins MP: A systematic review of studies
of DNA methylation in the context of a weight loss intervention.
Epigenomics. 9:769–787. 2017. View Article : Google Scholar
|
|
42
|
den Dunnen JT, Dalgleish R, Maglott DR,
Hart RK, Greenblatt MS, McGowan-Jordan J, Roux AF, Smith T,
Antonarakis SE and Taschner PE: HGVS recommendations for the
description of sequence variants: 2016 update. Hum Mutat.
37:564–569. 2016. View Article : Google Scholar
|
|
43
|
Le Hellard S, Theisen FM, Haberhausen M,
Raeder MB, Fernø J, Gebhardt S, Hinney A, Remschmidt H, Krieg JC,
Mehler-Wex C, et al: Association between the insulin-induced gene 2
(INSIG2) and weight gain in a German sample of
antipsychotic-treated schizophrenic patients: Perturbation of
SREBP-controlled lipogenesis in drug-related metabolic adverse
effects? Mol Psychiatry. 14:308–317. 2009. View Article : Google Scholar
|
|
44
|
Prakash J, Mittal B, Apurva S, Shally A,
Pranjal S and Neena S: Common genetic variant of insig2 gene
rs7566605 polymorphism is associated with severe obesity in north
India. Iran Biomed J. 21:261–269. 2017. View Article : Google Scholar :
|
|
45
|
Apalasamy YD, Moy FM, Rampal S, Bulgiba A
and Mohamed Z: Genetic associations of the INSIG2 rs7566605
polymorphism with obesity-related metabolic traits in malaysian
malays. Genet Mol Res. 13:4904–10. 2014. View Article : Google Scholar
|
|
46
|
Kaulfers AM, Deka R, Dolan L and Martin
LJ: Association of INSIG2 polymorphism with overweight and LDL in
children. PLoS One. 10:e01163402015. View Article : Google Scholar :
|
|
47
|
Chambers JC, Elliott P, Zabaneh D, Zhang
W, Li Y, Froguel P, Balding D, Scott J and Kooner JS: Common
genetic variation near MC4R is associated with waist circumference
and insulin resistance. Nat Genet. 40:716–718. 2008. View Article : Google Scholar
|
|
48
|
Loos RJ, Lindgren CM, Li S, Wheeler E,
Zhao JH, Prokopenko I, Inouye M, Freathy RM, Attwood AP, Beckmann
JS, et al: Common variants near MC4R are associated with fat mass,
weight and risk of obesity. Nat Genet. 40:768–775. 2008. View Article : Google Scholar :
|
|
49
|
Xi B, Chandak GR, Shen Y, Wang Q and Zhou
D: Association between common polymorphism near the MC4R gene and
obesity risk: A systematic review and meta-analysis. PLoS One.
7:e45731 View Article : Google Scholar :
|
|
50
|
Paolini B, Maltese PE, Del Ciondolo I,
Tavian D, Missaglia S, Ciuoli C, Zuntini M, Cecchin S, Bertelli M
and Pompucci G: Prevalence of mutations in LEP, LEPR and MC4R genes
in individuals with severe obesity. Genet Mol Res. 15:2016.
View Article : Google Scholar
|
|
51
|
Takenaka A, Nakamura S, Mitsunaga F,
Inoue-Murayama M, Udono T and Suryobroto B: Human-specific SNP in
obesity genes, adrenergic receptor beta2 (ADRB2), Beta3 (ADRB3) and
PPAR γ2 (PPARG), during primate evolution. PLoS One. 7:e434612012.
View Article : Google Scholar :
|
|
52
|
Ruiz JR, Larrarte E, Margareto J, Ares R
and Labayen I: Role of β2-adrenergic receptor
polymorphisms on body weight and body composition response to
energy restriction in obese women: Preliminary results. Obesity
(Silver Spring). 19:212–215. 2011. View Article : Google Scholar
|
|
53
|
Ruiz JR, Larrarte E, Margareto J, Ares R,
Alkorta P and Labayen I: Preliminary findings on the role of PLIN1
polymorphisms on body composition and energy metabolism response to
energy restriction in obese women. Br J Nutr. 106:486–90. 2011.
View Article : Google Scholar
|
|
54
|
Large V, Hellström L, Reynisdottir S,
Lönnqvist F, Eriksson P, Lannfelt L and Arner P: Human beta-2
adrenoceptor gene polymorphisms are highly frequent in obesity and
associate with altered adipocyte beta-2 adrenoceptor function. J
Clin Invest. 100:3005–3013. 1997. View Article : Google Scholar :
|
|
55
|
Ishiyama-Shigemoto S, Yamada K, Yuan X,
Ichikawa F and Nonaka K: Association of polymorphisms in the
beta2-adrenergic receptor gene with obesity, hypertriglyceridaemia,
and diabetes mellitus. Diabetologia. 42:98–101. 1999. View Article : Google Scholar
|
|
56
|
Martin S, Nicaud V, Humphries SE and
Talmud PJ: EARS group: Contribution of APOA5 gene variants to
plasma triglyceride determination and to the response to both fat
and glucose tolerance challenges. Biochim Biophys Acta.
1637:217–225. 2003. View Article : Google Scholar
|
|
57
|
Kisfali P, Mohás M, Maasz A, Hadarits F,
Markó L, Horvatovich K, Oroszlán T, Bagosi Z, Bujtor Z, Gasztonyi
B, et al: Apolipoprotein A5 IVS3+476A allelic variant associates
with increased trigliceride levels and confers risk for development
of metabolic syndrome in Hungarians. Circ J. 72:40–43. 2008.
View Article : Google Scholar
|
|
58
|
Elosua R, Ordovas JM, Cupples LA, Lai CQ,
Demissie S, Fox CS, Polak JF, Wolf PA, D'Agostino RB Sr and
O'Donnell CJ: Variants at the APOA5 locus, association with carotid
atherosclerosis and modification by obesity: The Framingham Study.
J Lipid Res. 47:990–996. 2006. View Article : Google Scholar
|
|
59
|
Sánchez-Moreno C, Ordovás JM, Smith CE,
Baraza JC, Lee YC and Garaulet M: APOA5 gene variation interacts
with dietary fat intake to modulate obesity and circulating
triglycerides in a Mediterranean population. J Nutr. 141:380–385.
2011. View Article : Google Scholar :
|
|
60
|
Garelnabi M, Lor K, Jin J, Chai F and
Santanam N: The paradox of ApoA5 modulation of triglycerides:
Evidence from clinical and basic research. Clin Biochem. 46:12–19.
2013. View Article : Google Scholar
|
|
61
|
Aberle J, Evans D, Beil FU and Seedorf U:
A polymorphism in the apolipoprotein A5 gene is associated with
weight loss after short-term diet. Clin Genet. 68:152–154. 2005.
View Article : Google Scholar
|
|
62
|
Hauner H, Meier M, Jöckel KH, Frey UH and
Siffert W: Prediction of successful weight reduction under
sibutramine therapy through genotyping of the G-protein beta3
subunit gene (GNB3) C825T polymorphism. Pharmacogenetics.
13:453–459. 2003. View Article : Google Scholar
|
|
63
|
Hsiao TJ, Hwang Y, Liu CH, Chang HM and
Lin E: Association of the C825T polymorphism in the GNB3 gene with
obesity and metabolic phenotypes in a Taiwanese population. Genes
Nutr. 8:137–144. 2013. View Article : Google Scholar
|
|
64
|
Maniotis C, Chantziara K, Kokkoris P,
Papadogiannis D, Andreou C, Tsioufis C, Vaiopoulos G and Stefanadis
C: The AGT and the GNB3 polymorphisms and insulin resistance in
prehypertension. Hormones (Athens). 13:79–86. 2014.
|
|
65
|
Michalsen A, Knoblauch NT, Lehmann N,
Grossman P, Kerkhoff G, Wilhelm FH, Moebus S, Konstantinides S,
Binder L and Heusch G: Effects of lifestyle modification on the
progression of coronary atherosclerosis, autonomic function and
angina-the role of GNB3 C825T polymorphism. Am Heart J.
151:870–877. 2006. View Article : Google Scholar
|
|
66
|
Hoque MO, Lee CC, Cairns P, Schoenberg M
and Sidransky D: Genome-wide genetic characterization of bladder
cancer: A comparison of high-density single-nucleotide polymorphism
arrays and PCR-based microsatellite analysis. Cancer Res.
63:2216–2222. 2003.
|
|
67
|
Smith AJ, Cooper JA, Li LK and Humphries
SE: INSIG2 gene polymorphism is not associated with obesity in
Caucasian, Afro-Caribbean and Indian subjects. Int J Obes (Lond).
31:1753–1755. 2007. View Article : Google Scholar
|
|
68
|
Granell S, Serra-Juhé C, Martos-Moreno GÁ,
Díaz F, Pérez-Jurado LA, Baldini G and Argente J: A novel
melanocortin-4 receptor mutation MC4R-P272L associated with severe
obesity has increased propensity to be ubiquitinated in the ER in
the face of correct folding. PLoS One. 7:e508942012. View Article : Google Scholar :
|
|
69
|
Corella D, Ortega-Azorín C, Sorlí JV,
Covas MI, Carrasco P, Salas-Salvadó J, Martínez-González MÁ, Arós
F, Lapetra J, Serra-Majem L, et al: Statistical and biological
gene-lifestyle interactions of MC4R and FTO with diet and physical
activity on obesity: New effects on alcohol consumption. PLoS One.
7:e523442012. View Article : Google Scholar :
|
|
70
|
Feigelson HS, Teras LR, Diver WR, Tang W,
Patel AV, Stevens VL, Calle EE, Thun MJ and Bouzyk M: Genetic
variation in candidate obesity genes ADRB2, ADRB3, GHRL, HSD11B1,
IRS1, IRS2 and SHC1 and risk for breast cancer in the cancer
prevention study II. Breast Cancer Res. 10:R572008. View Article : Google Scholar :
|
|
71
|
Brøgger J, Steen VM, Eiken HG, Gulsvik A
and Bakke P: Genetic association between COPD and polymorphisms in
TNF, ADRB2 and EPHX1. Eur Respir J. 27:682–688. 2006. View Article : Google Scholar
|
|
72
|
Park HW, Yang MS, Park CS, Kim TB, Moon
HB, Min KU, Kim YY and Cho SH: Additive role of tiotropium in
severe asthmatics and Arg16Gly in ADRB2 as a potential marker to
predict response. Allergy. 64:778–783. 2009. View Article : Google Scholar
|
|
73
|
Sánchez González JL, Proenza AM, Martínez
Larrad MT, Ramis JM, Pérez Fernández C, Palou A and Ríos Serrano M:
The glutamine 27 glutamic acid polymorphism of the
beta2-adrenoceptor gene is associated with abdominal obesity and
greater risk of impaired glucose tolerance in men but not in women:
A population-based study in Spain. Clin Endocrinol (Oxf).
59:476–481. 2003. View Article : Google Scholar
|
|
74
|
Kawaguchi H, Masuo K, Katsuya T, Sugimoto
K, Rakugi H, Ogihara T and Tuck ML: Beta2- and beta3-Adrenoceptor
polymorphisms relate to subsequent weight gain and blood pressure
elevation in obese normotensive individuals. Hypertens Res.
29:951–959. 2006. View Article : Google Scholar
|
|
75
|
Masuo K, Katsuya T, Kawaguchi H, Fu Y,
Rakugi H, Ogihara T and Tuck ML: Beta2-adrenoceptor polymorphisms
relate to obesity through blunted leptin-mediated sympathetic
activation. Am J Hypertens. 19:1084–1091. 2006. View Article : Google Scholar
|
|
76
|
Maasz A, Kisfali P, Jaromi L, Horvatovich
K, Szolnoki Z, Csongei V, Safrany E, Sipeky C, Hadarits F and
Melegh B: Apolipoprotein A5 gene IVS3+G476A allelic variant confers
susceptibility for development of ischemic stroke. Circ J.
72:1065–1070. 2008. View Article : Google Scholar
|
|
77
|
Maász A, Kisfali P, Szolnoki Z, Hadarits F
and Melegh B: Apolipoprotein A5 gene C56G variant confers risk for
the development of large-vessel associated ischemic stroke. J
Neurol. 255:649–654. 2008. View Article : Google Scholar
|
|
78
|
Elosua R, Cupples LA, Fox CS, Polak JF,
D'Agostino RA Sr, Wolf PA, O'Donnell CJ and Ordovas JM: Association
between well-characterized lipoprotein-related genetic variants and
carotid intimal medial thickness and stenosis: The framingham heart
study. Atherosclerosis. 189:222–228. 2006. View Article : Google Scholar
|
|
79
|
Casiglia E, Tikhonoff V, Boschetti G,
Bascelli A, Saugo M, Guglielmi G, Caffi S, Rigoni G, Giordano N,
Grasselli C, et al: The C825T GNB3 polymorphism, independent of
blood pressure, predicts cerebrovascular risk at a population
level. Am J Hypertens. 25:451–457. 2012. View Article : Google Scholar
|
|
80
|
Frey UH, Moebus S, Möhlenkamp S, Kälsch H,
Bauer M, Lehmann N, Nöthen M, Mühleisen TW, Stang A, Erbel R, et
al: GNB3 gene 825 TT variant predicts hard coronary events in the
population-based HEINZ NIXDORF RECALL study. Atherosclerosis.
237:437–442. 2014. View Article : Google Scholar
|
|
81
|
Nishimura R, Tanabe N, Sekine A, Kasai H,
Suda R, Kato F, Jujo T, Sugiura T, Shigeta A, Sakao S and Tatsumi
K: Synergistic effects of ACE Insertion/deletion and GNB3 C825T
polymorphisms on the efficacy of PDE-5 inhibitor in patients with
pulmonary hypertension. Respiration. 91:132–140. 2016. View Article : Google Scholar
|
|
82
|
Sperling H, Eisenhardt A, Virchow S, Hauck
E, Lenk S, Porst H, Stief C, Wetterauer U, Rubben H, Muller N and
Siffert W: Sildenafil response is influenced by the G protein beta
3 subunit GNB3 C825T polymorphism: A pilot study. J Urol.
169:1048–1051. 2003. View Article : Google Scholar
|
|
83
|
Bell CG, Xia Y, Yuan W, Gao F, Ward K,
Roos L, Mangino M, Hysi PG, Bell J, Wang J and Spector TD: Novel
regional age-associated DNA methylation changes within human common
disease-associated loci. Genome Biol. 17:1932016. View Article : Google Scholar :
|
|
84
|
Murray R, Bryant J, Titcombe P, Barton SJ,
Inskip H, Harvey NC, Cooper C, Lillycrop K, Hanson M and Godfrey
KM: DNA methylation at birth within the promoter of ANRIL predicts
markers of cardiovascular risk at 9 years. Clin Epigenetics.
8:902016. View Article : Google Scholar :
|
|
85
|
Pal S and Tyler JK: Epigenetics and aging.
Sci Adv. 2:e16005842016. View Article : Google Scholar :
|
|
86
|
Wu X, Cao N, Fenech M and Wang X: Role of
sirtuins in maintenance of genomic stability: Relevance to cancer
and healthy aging. DNA Cell Biol. 35:542–575. 2016. View Article : Google Scholar
|
|
87
|
Perng W, Villamor E, Shroff MR, Nettleton
JA, Pilsner JR, Liu Y and Diez-Roux AV: Dietary intake, plasma
homocysteine and repetitive element DNA methylation in the
Multi-Ethnic Study of Atherosclerosis (MESA). Nutr Metab Cardiovasc
Dis. 24:614–622. 2014. View Article : Google Scholar
|
|
88
|
Needham BL, Smith JA, Zhao W, Wang X,
Mukherjee B, Kardia SL, Shively CA, Seeman TE, Liu Y and Diez Roux
AV: Life course socioeconomic status and DNA methylation in genes
related to stress reactivity and inflammation: The multi-ethnic
study of atherosclerosis. Epigenetics. 10:958–969. 2015. View Article : Google Scholar :
|
|
89
|
Guerrero-Preston R, Goldman LR,
Brebi-Mieville P, Ili-Gangas C, Lebron C, Witter FR, Apelberg BJ,
Hernández-Roystacher M, Jaffe A, Halden RU and Sidransky D: Global
DNA hypomethylation is associated with in utero exposure to
cotinine and perfluorinated alkyl compounds. Epigenetics.
5:539–546. 2010. View Article : Google Scholar :
|
|
90
|
Chater-Diehl EJ, Laufer BI, Castellani CA,
Alberry BL and Singh SM: Alteration of gene expression, DNA
methylation and histone methylation in free radical scavenging
networks in adult mouse hippocampus following fetal alcohol
exposure. PLoS One. 11:e01548362016. View Article : Google Scholar :
|
|
91
|
Garcia-Lacarte M, Milagro FI, Zulet MA,
Martinez JA and Mansego ML: LINE-1 methylation levels, a biomarker
of weight loss in obese subjects, are influenced by dietary
antioxidant capacity. Redox Rep. 21:67–74. 2016. View Article : Google Scholar
|
|
92
|
Marques-Rocha JL, Milagro FI, Mansego ML,
Mourão DM, Martínez JA and Bressan J: LINE-1 methylation is
positively associated with healthier lifestyle but inversely
related to body fat mass in healthy young individuals. Epigenetics.
11:49–60. 2016. View Article : Google Scholar :
|
|
93
|
Carraro JC, Mansego ML, Milagro FI, Chaves
LO, Vidigal FC, Bressan J and Martínez JA: LINE-1 and inflammatory
gene methylation levels are early biomarkers of metabolic changes:
Association with adiposity. Biomarkers. 21:625–632. 2016.
View Article : Google Scholar
|
|
94
|
Nicoletti CF, Nonino CB, de Oliveira BA,
Pinhel MA, Mansego ML, Milagro FI, Zulet MA and Martinez JA: DNA
methylation and hydroxymethylation levels in relation to two weight
loss strategies: Energy-restricted diet or bariatric surgery. Obes
Surg. 26:603–611. 2016. View Article : Google Scholar
|
|
95
|
Weiner R, El-Sayes I, Manger T, Weiner S,
Lippert H and Stroh C: Obesity Surgery Working Group, Competence
Network Obesity: Antidiabetic efficacy of obesity surgery in
Germany: A quality assurance nationwide survey. Surg Obes Relat
Dis. 10:322–327. 2014. View Article : Google Scholar
|
|
96
|
Stroh C, Weiner R, Wolff S, Knoll C and
Manger T: Obesity Surgery Working Group; Competence Network
Obesity: Influences of gender on complication rate and outcome
after Roux-en-Y gastric bypass: Data analysis of more than 10,000
operations from the german bariatric surgery registry. Obes Surg.
24:1625–1633. 2014. View Article : Google Scholar
|