Introduction
Oxidative phosphorylation (OXPHOS) is an essential
metabolic pathway for the generation of energy in cells. In most
eukaryotes, this process takes place in mitochondria and usually
requires the cytosolic substrate pyruvate. Extensive effort has
been put into identifying the molecular carrier responsible for the
transport of pyruvate across the inner mitochondrial membrane (IMM)
and into the mitochondrial matrix. In 2012, two independent groups
discovered the long sought-after mammalian mitochondrial pyruvate
carrier (MPC), which is composed of two paralogous subunits, MPC1
and MPC2 (1,2). The location of the MPC complex at the
IMM puts it at the intersection between cytosolic glycolysis and
mitochondrial OXPHOS. Subsequent works confirmed the critical role
of the MPC complex in multiple cellular functions, including the
metabolism of glucose and pyruvate, fibrosis, and effects on drug
efficacy (3–6). Unlike other mitochondrial carriers
that can function as a monomer, pyruvate transport by the MPC
complex requires both MPC1 and MPC2 (1). In addition, the function of the MPC
complex is closely related to mitochondrial function, especially
MPC1, in mammals.
Studies show that MPC dysfunction causes various
diseases, including lactic acidosis, hyperpyruvatemia, tumors and
other severe diseases (7). As the
gatekeeper for pyruvate entry into mitochondria, the MPC is thought
to be of core position in cell metabolic programming. MPC
dysfunction or expression reduction blocks pyruvate entry into the
TCA cycle, which leads to a metabolism switch to increase
glycolysis. Depending on their localization, endothelial cells
(ECs) are exposed to various oxygen tensions. Like tumor cells, ECs
rely on glycolysis (specifically, aerobic glycolysis) for energy
production (8). Glycolysis
provides bioenergetic intermediates, but generates less ATP. In
physiological situations, cells change from aerobic oxidation to
glycolysis in hypoxic conditions. While most pyruvate, the primary
product of glycolysis, is converted to lactate by lactate
dehydrogenase A (LDHA), a small amount of pyruvate is transferred
to mitochondria for OXPHOS. Given that the MPC complex represents a
crucial checkpoint in the regulation of cellular metabolism,
understanding how it is regulated could have an enormous impact on
the treatment of human diseases. Currently, whether and how MPC
expression is altered in response to stressful conditions such as
hypoxia is unclear. Knowledge gained from such research will
advance our understanding of the roles and regulatory mechanisms of
the MPC complex in ECs.
For a long time, most of the studies on human
vascular ECs are based on human umbilical vein ECs (HUVECs), and
all the functions of ECs can be achieved through in vitro
culture (9). HUVECs provide a
classic model system to study many aspects of endothelial function
and disease, such as tumor-associated angiogenesis,
cardiovascular-related complications, oxidative stress, hypoxia and
inflammation related pathways in endothelia, mode of action and
cardiovascular protection effects of various compounds.
In this study, we initially examined the MPC
expression levels in several metabolic cell types, including
HUVECs, human coronary artery ECs (HCAECs), human umbilical vein
smooth muscle cells (HUSMCs), and human embryonic kidney cells 293.
Our data indicate that, while MPC1 and MPC2 were expressed at
significantly higher levels in 293T cells, no significant
differences were observed among HUVECs, HCAECs, and HUSMCs.
Furthermore, hypoxia was found to increase lactate secretion while
it led to reduced MPC1 and MPC2 levels in HUVECs. Following
re-oxygenation, the levels of both subunits rose. To explore the
role of the MPC complex in cellular metabolism under hypoxia, a
small interfering RNA (siRNA) targeting the mpc1 gene and
the MPC inhibitor UK5099 were utilized to inhibit MPC1 expression
and MPC function. Treatment with either the siRNA or UK5099
promoted aerobic glycolysis and lactate secretion in HUVECs under
hypoxia. These results indicate that hypoxia can induce lactate
secretion and glycolytic flux by downregulating MPC levels.
Materials and methods
Cell culture
HCAECs were purchased from Promocell (Heidelberg,
Germany). HUSMCs and 293T were grown in Dulbecco's modified Eagle's
minimal essential medium (DMEM) supplemented with 10% fetal bovine
serum. HUVECs and HCAECs were cultured in endothelial growth
media-2 (Promocell) supplemented with EC growth supplement
(Promocell) at 37°C in a humidified atmosphere of 95% air and 5%
CO2. To determine the effect of hypoxia-normoxia
transition on MPC expression, cells were incubated under hypoxia
(1% O2 and 99% N2) for 24 h, and they were
then cultured for 24 h under normoxia (95% air and 5%
CO2).
Reagents
JC-1 fluorescent probe was purchased from Beyotime
Institute of Biotechnology (Jiangsu, China). UK5099 was purchased
from Sigma-Aldrich (Merck KGaA, Darmstadt, Germany). UK5099 was
dissolved in Dimethyl sulfoxide (DMSO), and the final concentration
of DMSO was less than 0.05%. UK5099 was optimized to a final
concentration of 40 µM to reduce pyruvate transportation into
mitochondrial based on a series of UK5099 dose tested in a range of
10 µM to 100 µM as previously published (10,11).
Silencing experiments
HUVECs were grown in 6-well plates up to 85%
confluence and transfected using Lipofectamine RNAiMAX (Invitrogen,
Merelbeke, Belgium) with 200 pmol of specific siRNA (GenePharma,
Shanghai, China) targeting MPC1 (Accession no. NM_001270879.1)
(sense: 5′-GGCUUAUCAAACACGAGAUTT-3′; antisense:
5′-AUCUCGUGUUUGAUAAGCCTT-3′). All star control siRNA (sense:
5′-UUCUUCGAACGUGUCACGUTT-3′; antisense:
5′-ACGUGACACGUUCGGAGAATT-3′) was used as negative control.
Silencing efficiency was detected by western blotting.
Reverse transcription-polymerase chain
reaction (RT-PCR)
Total RNA was isolated from cells using standard
procedure according to the manufacturer's instructions. The RNA was
reverse-transcribed to cDNA with random primers using All-In-One RT
MasterMix (Applied Biological Materials, Inc., Richmond, BC,
Canada) at 25°C for 10 min, 42°C for 15 min, followed by 85°C for 5
min. PCR was performed using an iCycler (Bio-Rad Laboratories,
Inc., Hercules, CA, USA). The reaction mixture consisted of 1 µl
template cDNA, 0.2 µM of each primer and 25 µl 2×PCR Taq MasterMix
(Applied Biological Materials, Inc.). PCR was performed for 32
cycles for each gene with denaturation at 94°C for 30 sec,
annealing at 61°C for 30 sec, and extension at 72°C for 20 sec. PCR
products were quantified using NIH Image. The primer sequences
purchased from Invitrogen for MPC1 (sense:
5′-GCCTACAAGGTACAGCCTCG-3′; antisense: 5′-GTGTTTGATAAGCCGCCCTC-3′)
and for MPC2 (Accession no. NM_001143674.3) (sense:
5′-TACCACCGGCTCCTCGATAA-3′; antisense: 5′-ACAGCAGATTGAGCTGTGCT-3′).
β-actin (sense: 5′-CCCATCTATGAGGGTTACGC-3′; antisense:
5′-TTTAATGTCACGCACGATTTC-3′) was used as a reference gene.
Quantitative PCR (qPCR)
qPCR was performed in a final volume of 20 µl
containing cDNA template, primers and qRCR MasterMix (Applied
Biological Materials, Inc.) using the 7300 qPCR system (Applied
Biosystems; Thermo Fisher Scientific, Inc., Waltham, MA, USA) as
described in the manufacture's manual. PCR amplification was
carried out on 95°C for 30 sec, 40 cycles at 95°C for 5 sec and
60°C for 31 sec using the following primers: MPC1, MPC2 and β-actin
were described above; Fis1 (Accession no. NM_016068.2) (sense:
5′-CTTAAAGTACGTCCGCGGGT-3′; antisense: 5′-GCCCACGAGTCCATCTTTCT-3′);
Opa1 (Accession no. NM_015560.2) (sense:
5′-TACCAGCCTCGCAGGAATTT-3′; antisense:
5′-CTTTTTGGCTGTGTAGCCACC-3′). The relative mRNA amounts of target
genes were normalized to the values of β-actin. The results were
expressed as fold-changes of Cquantification cycle (Cq) value
relative to the controls using the 2-ΔΔCq method.
Western blotting
Western blotting was carried as described
previously. In brief, cells lysate with equal amount of protein (50
µg) were separated by 10% SDS-polyacrylamide gel electrophoresis
and then transferred electronically to the polyvinylidene
difluoride membranes. Membranes were blocked in 5% non-fat milk
powder in TBST for 1 h at room temperature, and then incubated with
targeting antibodies: MPC1 (ab74871, dilution 1:1,000; Abcam,
Cambridge, UK), anti-MPC2 (ab111380, dilution 1:1,000; Abcam),
hexokinase II (HK2; ab104836, dilution 1:1,000; Abcam), LDHA
(ab101562, dilution 1:1,000; Abcam),
6-phosphofructo-2-kinase/fructose-2,6-bisphosphatase 3 (PFKFB3;
ab181861, dilution 1:1,000; Abcam), β-actin (3700, dilution
1:1,000; Cell Signaling Technology, Inc., Danvers, MA, USA) at 4°C
overnight. Finally, the membranes were incubated with secondary
antibodies conjugated with horseradish peroxidase for 1 h at room
temperature. Immunoreactive materials were visualized by using
Chemiluminescent Substrate kit (Pierce; Thermo Fisher Scientific,
Inc.). The membranes were scanned and the sum optical density was
quantitatively analyzed by Quantityone software (Bio-Rad
Laboratories, Inc.).
Lactate concentration measurement
HUVECs were washed with ice cold PBS three times and
split with RIPA for 20 min at 4°C. Lysates was centrifuged and
supernatant was analyzed by Amplite™ Colorimetricn L-Lactate Assay
kit (AAT Bioquest, Inc., Sunnyvale, CA, USA) according to the
manufacture's instruction. Lactate concentration in each well was
normalized to total protein content by the Brandford assay.
ATP production measurement
1×10⁶ cells were harvested in 200 µl PBS
and cell lysate was achieved by sonication before the homogenate
was centrifuged at 12,000 × g for 5 min. The intracellular ATP
production was assessed by using an Enhanced ATP Assay kit
(Beyotime Institute of Biotechnology) and the manufacturers'
instructions were strictly followed. Luminescence was measured by a
luminometer (Fluroskan Ascent FL; Thermo Fisher Scientific, Inc.).
Data were normalized based on the protein concentration measured by
the Brandford assay.
Measurement of mitochondrial membrane
potential (∆ψm)
Cells cultured in 6-well plates after indicated
treatments were incubated with an equal volume of JC-1 staining
solution (5 µg/ml) at 37°C for 20 min and rinsed twice with PBS.
Mitochondrial membrane potential was monitored by determining the
relative amounts of dual emissions from mitochondrial JC-1 monomers
or aggregates using an Olympus fluorescent microscope under 488 nm
laser excitation.
Moreover, the fluorescence intensity was detected
with a flow cytometry (BD FACSCalibur; BD Biosciences, Franklin
Lakes, NJ, USA). The wavelengths of excitation and emission were
514 and 529 nm for detection of monomeric form of JC-1. 585 and 590
nm were used to detect aggregation of JC-1. Mitochondrial
depolarization is indicated by an increase in the green/red
fluorescence intensity ratio.
Transmission electron microscope.
HUVECs were harvested using trypsin-EDTA
After washing for three tomes with ice cold PBS,
cells were fixed with 4% glutaraldehyde overnight at 4°C. A
specimen was cut into ultra-thin sections of 60–68 nm. A JEM-1010
model transmission electron microscope (Japan Electron Optics
Laboratory Company, Tokyo, Japan) was used to observe the
ultra-microstructures of mitochondrial.
Mitochondrial pyruvate
measurement
Mitochondrial pyruvate concentration was determined
by pyruvate assay kit (BioVision, California, USA) according to the
instructions. Briefly, 50 µl working reagent and 50 µl test or
standard sample were mixed, and then added in 96-well plate. After
30 min's incubation at room temperature, the color intensity of the
reaction product at 570 nm was read and recorded with a Microplate
Reader (Infinite® M200; Tecan Ltd.). The results were
normalized to the total cell numbers.
Statistical analysis
Data were presented as means ± standard deviation.
One-way analysis of variance was used for multiple comparisons by
SPSS 19.0 (SPSS, Inc, Chicago, IL, USA). If there was a significant
variation between treated groups, Tukey's post hoc test was
applied. P<0.05 was considered to indicate a statistically
significant difference.
Results
MPC expression levels in different
metabolic cell types
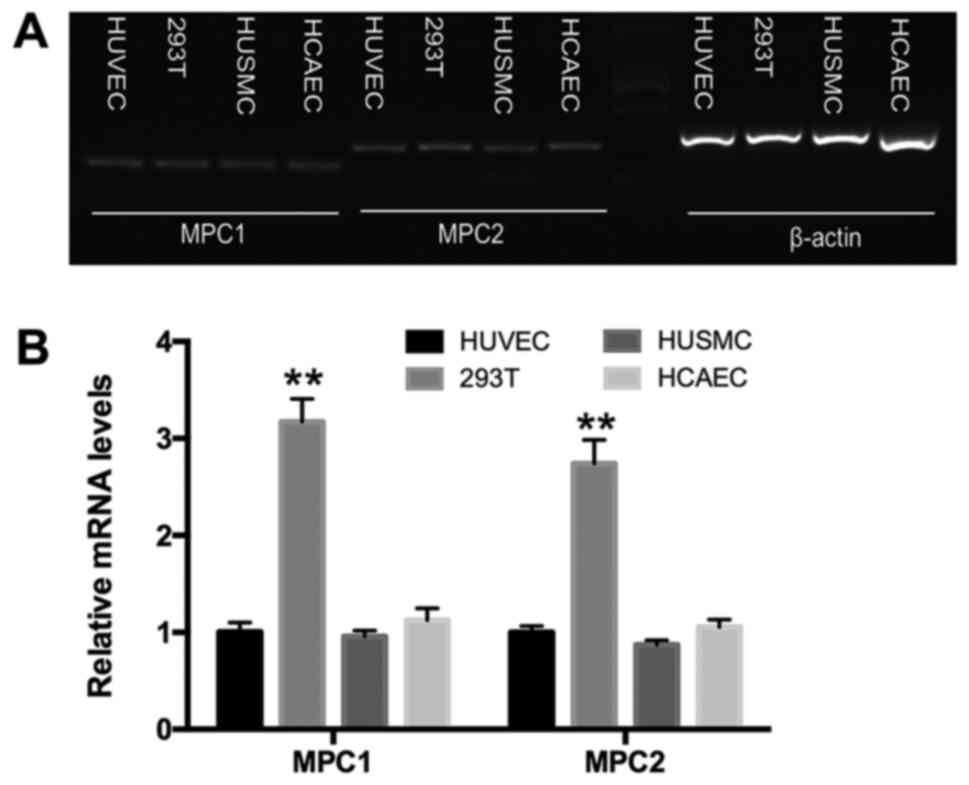
To evaluate whether MPC expression varies among
different cell types, we examined the MPC levels in HUVECs, HCAECs,
293T cells, and HUSMCs. The former three cell types rely on
glycolysis for energy production while HUSMCs rely on oxidation
(12,13). Using reverse
transcription-polymerase chain reaction (RT-PCR), both mpc1 and
mpc2 were shown to be expressed in HUVECs, HCAECs, HUSMCs, and 293T
cells (Fig. 1A). qPCR demonstrated
that, compared to the other cell types, MPC1 and MPC2 were highly
expressed in 293T cells, a typical anaerobic cell type (13). No significant difference was
observed in MPC expression among HUVECs, HCAECs, and HUSMCs
(Fig. 1B).
The effect of hypoxia on lactate
secretion and MPC expression in HUVECs
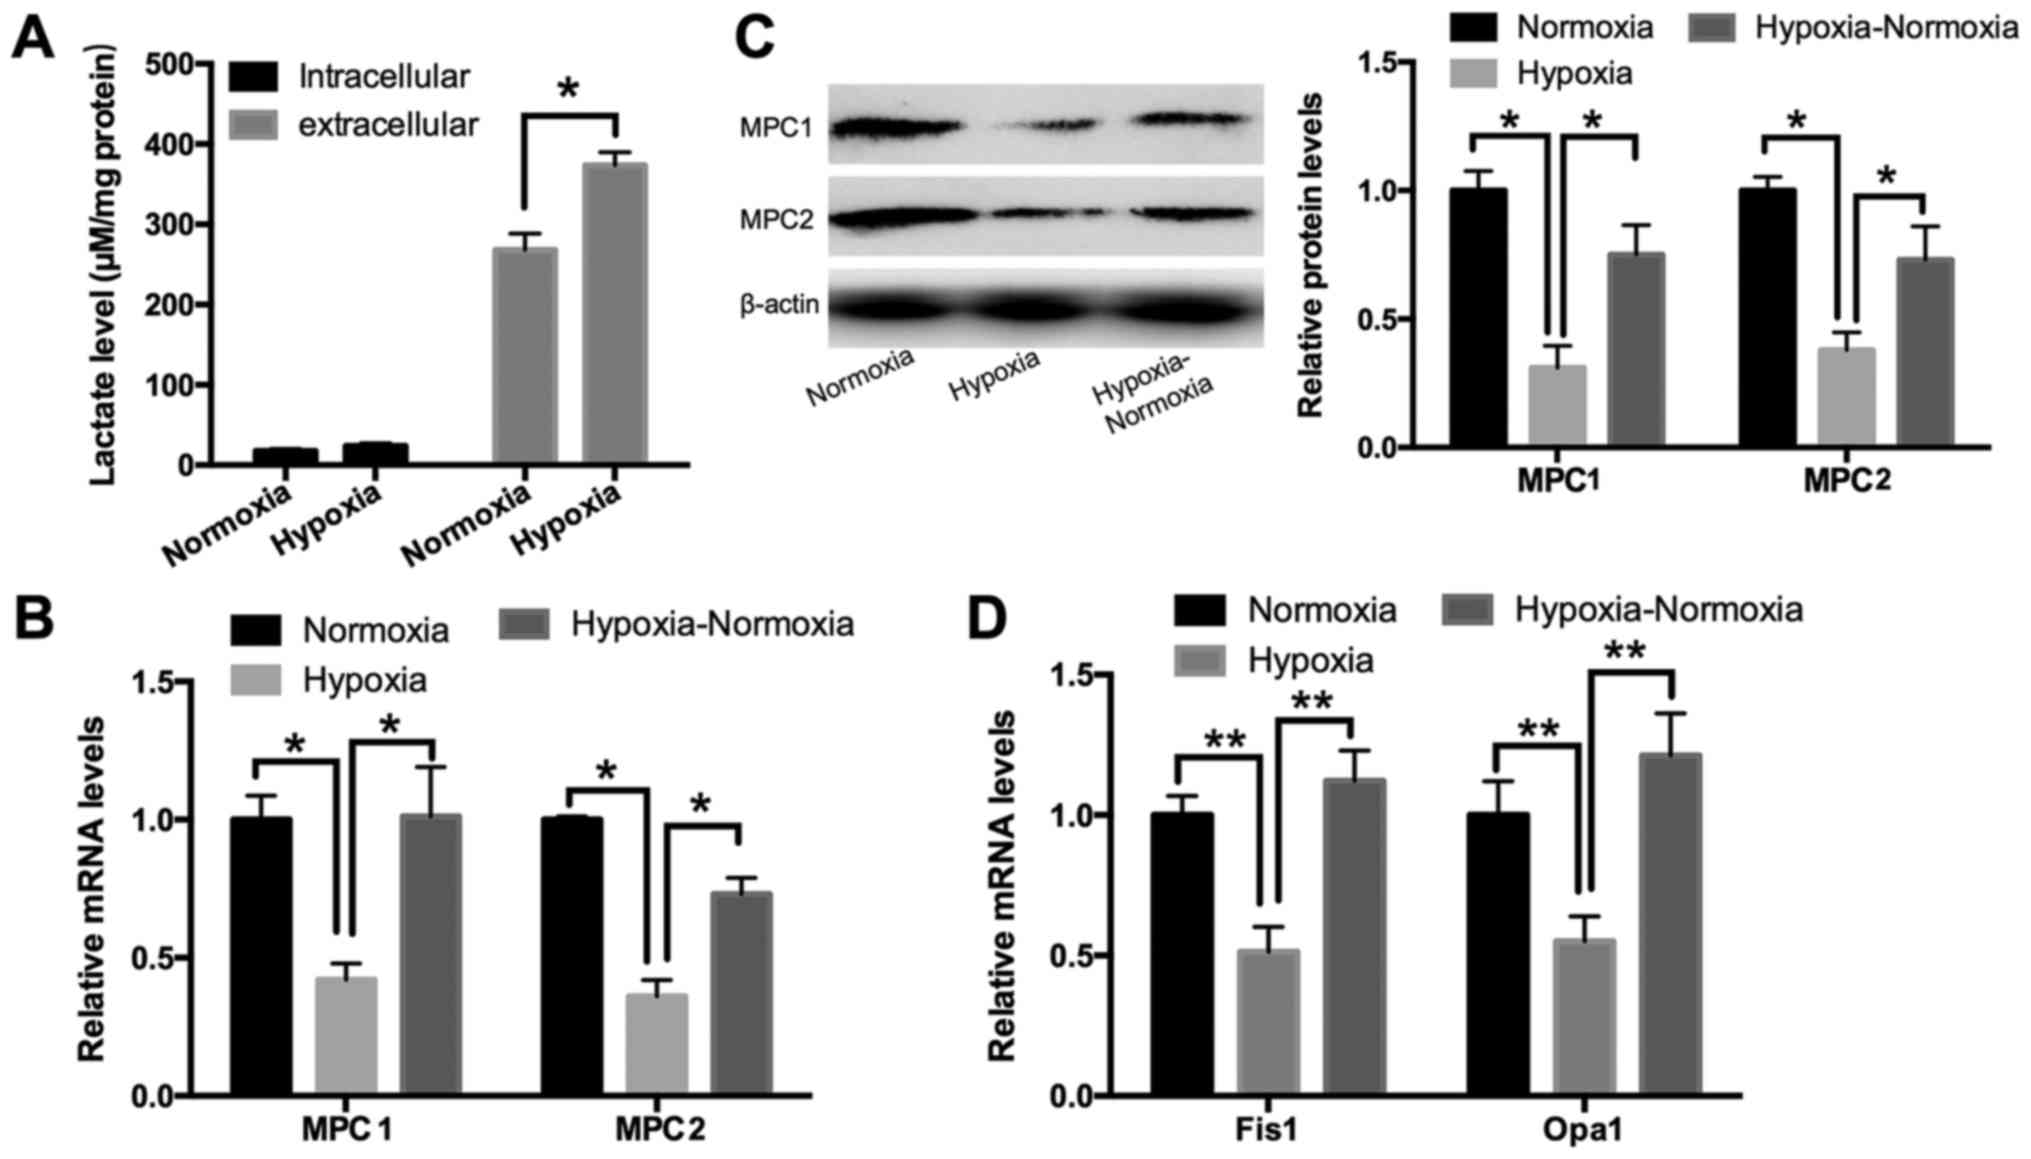
Lactate, generated from pyruvate by LDHA, is the
final product of glycolysis. To determine the effect of hypoxia on
this metabolic process, we measured the lactate levels as well as
MPC expression upon exposure to hypoxia in HUVECs. An L-lactate
acid assay revealed that the extracellular lactate concentration
was increased under hypoxia for 24 h in HUVECs, while the levels of
intracellular lactate were not significantly affected (Fig. 2A). This suggests that lactate
efflux was upregulated under hypoxia. qPCR and Western blotting
showed that the expression of MPC1 and MPC2 was downregulated under
conditions of hypoxia lasting for 24 h and subsequently induced
following re-oxygenation (Fig. 2B and
C). Opa1 and Fis1, two key factors in mediating mitochondrial
fusion and fission, were used as positive controls as they have
been shown to be influenced by extracellular oxygen levels
(14). As demonstrated in Fig. 2D, HUVECs exposed to hypoxia
exhibited significantly increased mRNA levels of Opa1 and Fis1 at
24 h post-treatment; further, these levels were increased following
re-oxygenation for 24 h.
Role of the MPC complex in
hypoxia-induced lactate secretion and aerobic glycolysis in
HUVECs
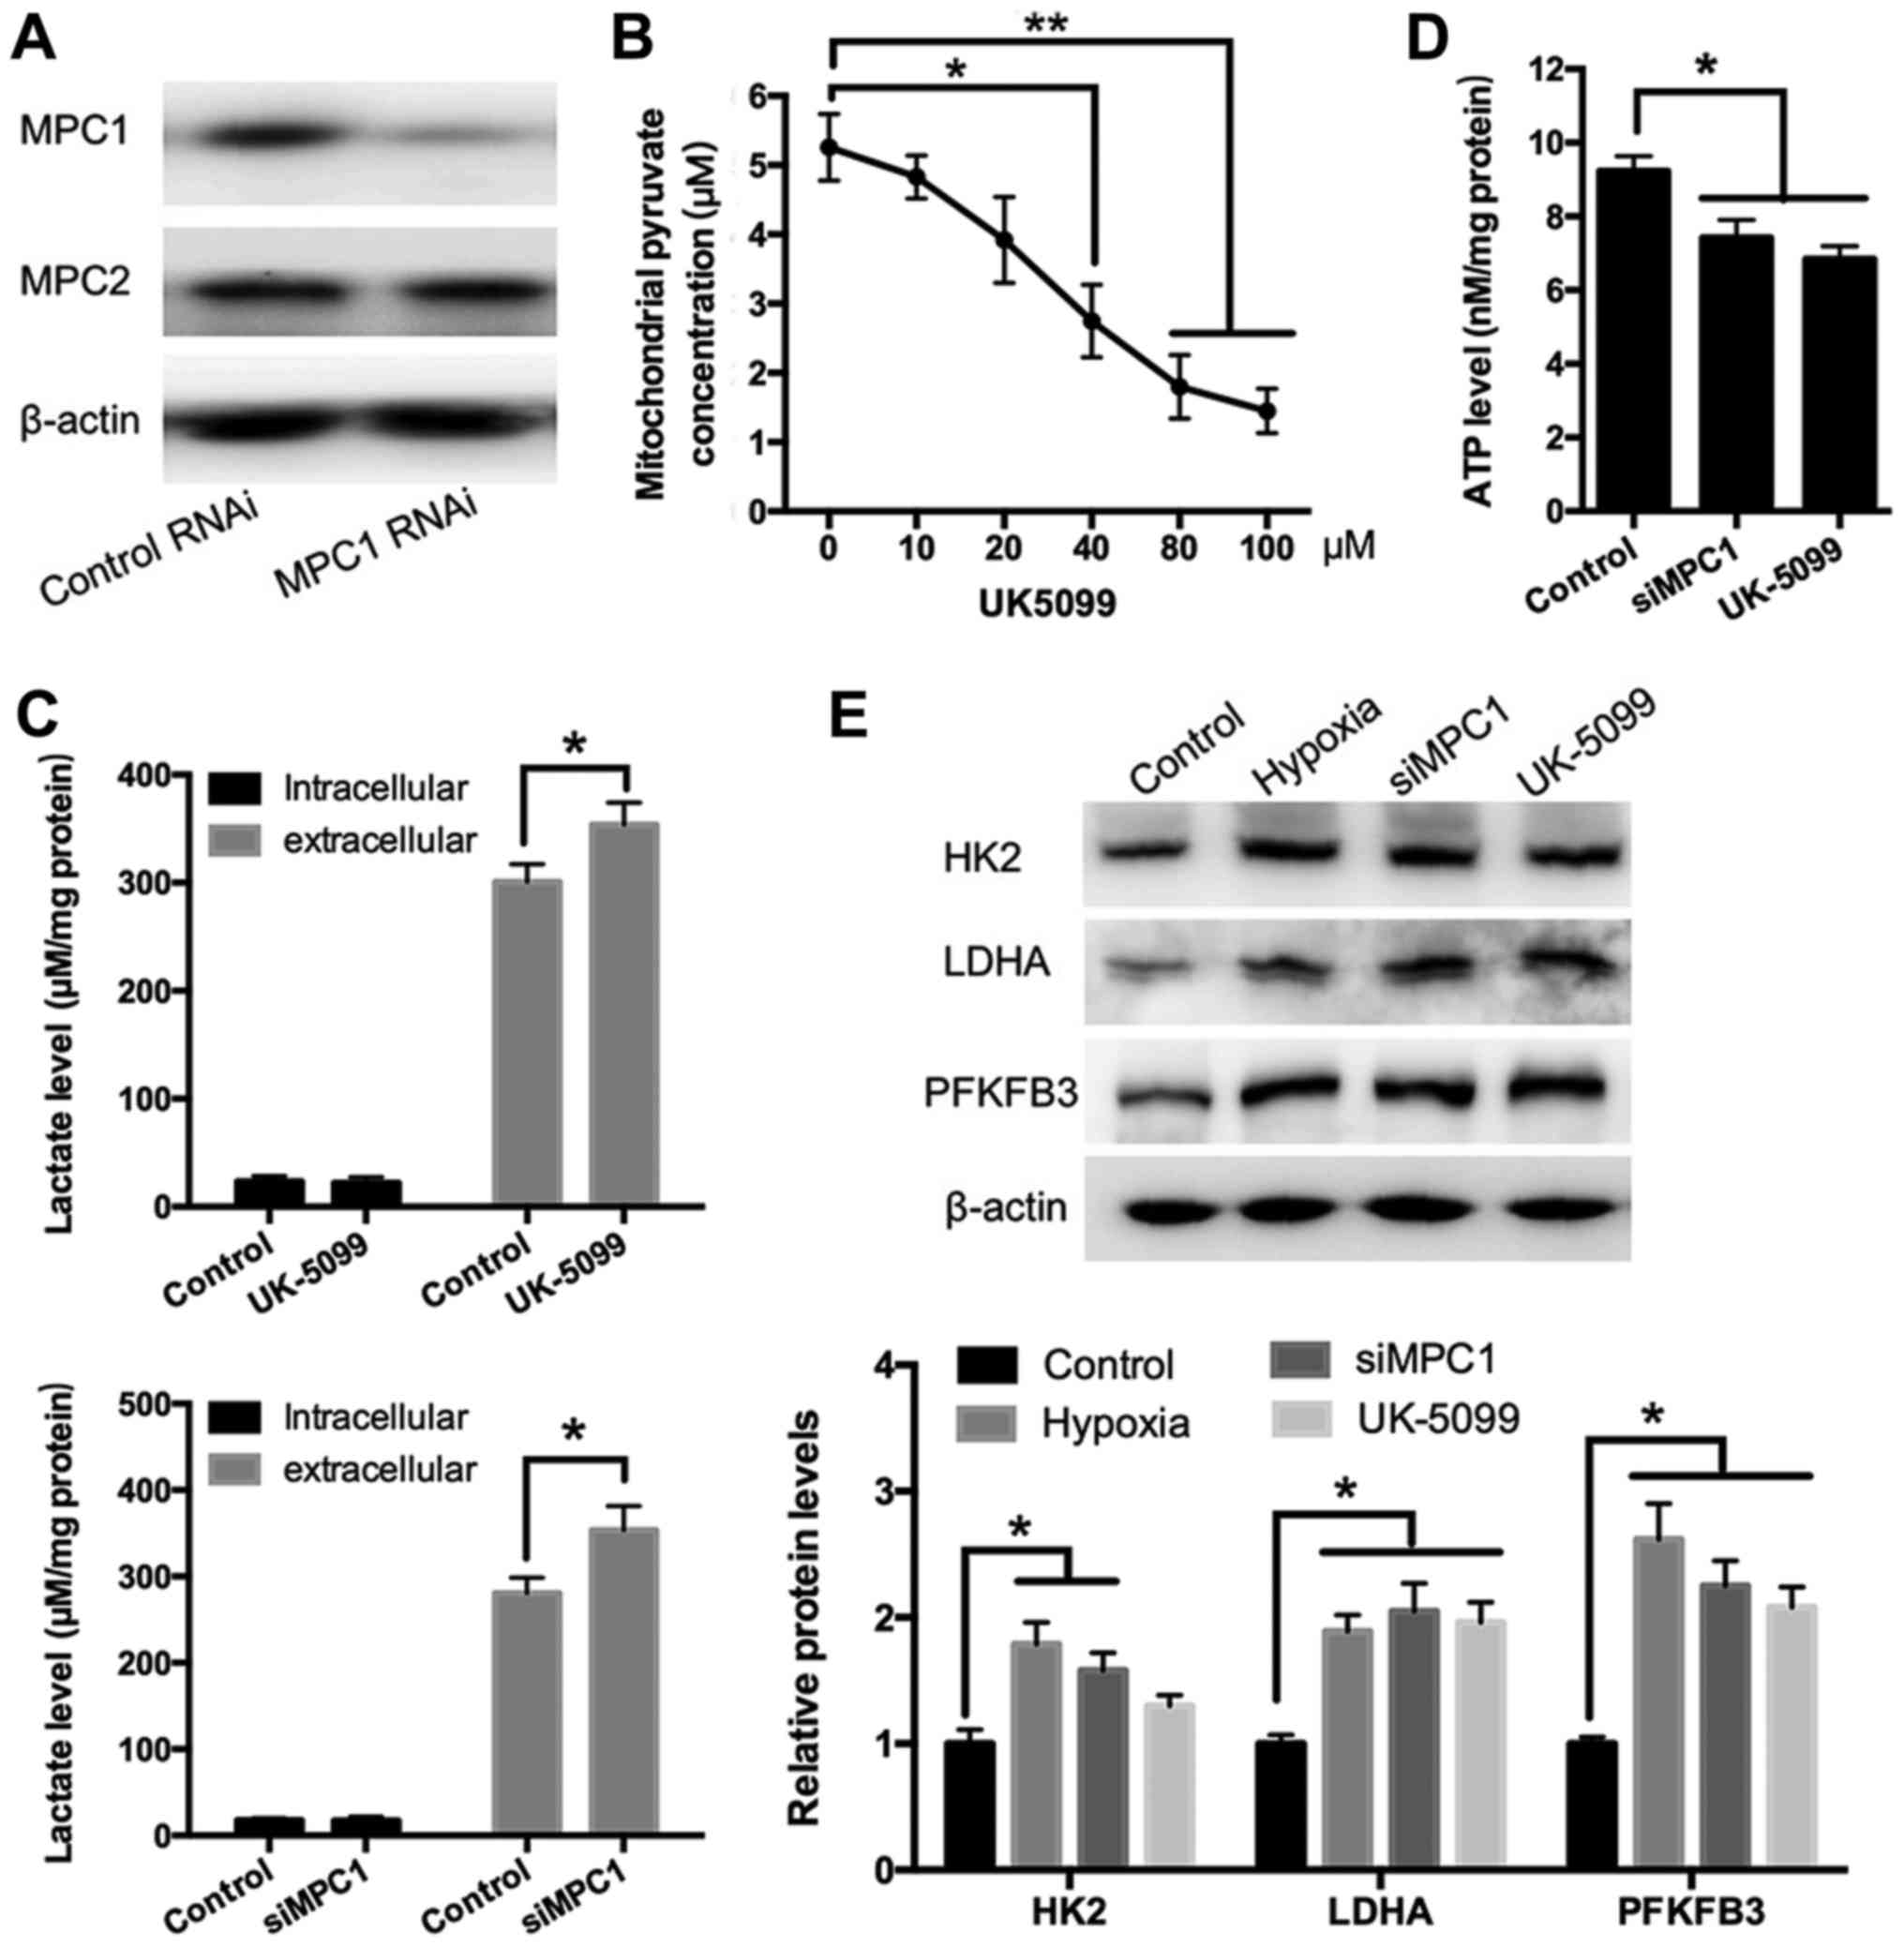
To evaluate whether hypoxia-induced lactate
secretion was related to MPC function, MPC1 expression was silenced
using an siRNA and MPC activity was inhibited using UK5099
(15). Western blotting revealed
that the siRNA targeting MPC1 (siMPC1) reduced MPC1 levels
specifically without affecting MPC2 expression (Fig. 3A). It was discovered that UK5099
was optimized to a final concentration of 40 µM to effectively
reduce pyruvate transportation into mitochondria (Fig. 3B). Both MPC1 silencing and
treatment with UK5099 in HUVECs increased the extracellular lactate
concentration significantly, indicating a higher glycolytic efflux,
thus produced more lactic acid (Fig.
3C). In contrast, ATP production in samples treated with UK5099
or siMPC1 was significantly lower than that in control cells
(Fig. 3D). Next, to determine how
the inhibition of MPC affects glycolysis, the levels of the key
glycolytic enzymes HK2, LDHA, and PFKFB3 were measured using
Western blotting in HUVECs treated with or without siRNA or UK5099.
As shown in Fig. 3E, exposure to
hypoxia led to the upregulation of HK2, LDHA, and PFKFB3,
suggesting that hypoxia promotes glycolysis. Similarly, treatment
with UK5099 or MPC1 silencing resulted in a significant increase in
the protein expression of HK2, LDHA, and PFKFB3 (Fig. 3E).
The effect of MPC inhibition on
mitochondrial structure and the mitochondrial membrane potential
(∆ψm) in HUVECs
During mitochondrial respiratory oxidation, energy
generated by the electrochemical chain reaction is stored within
the IMM. Changes in this energy generation process can impact the
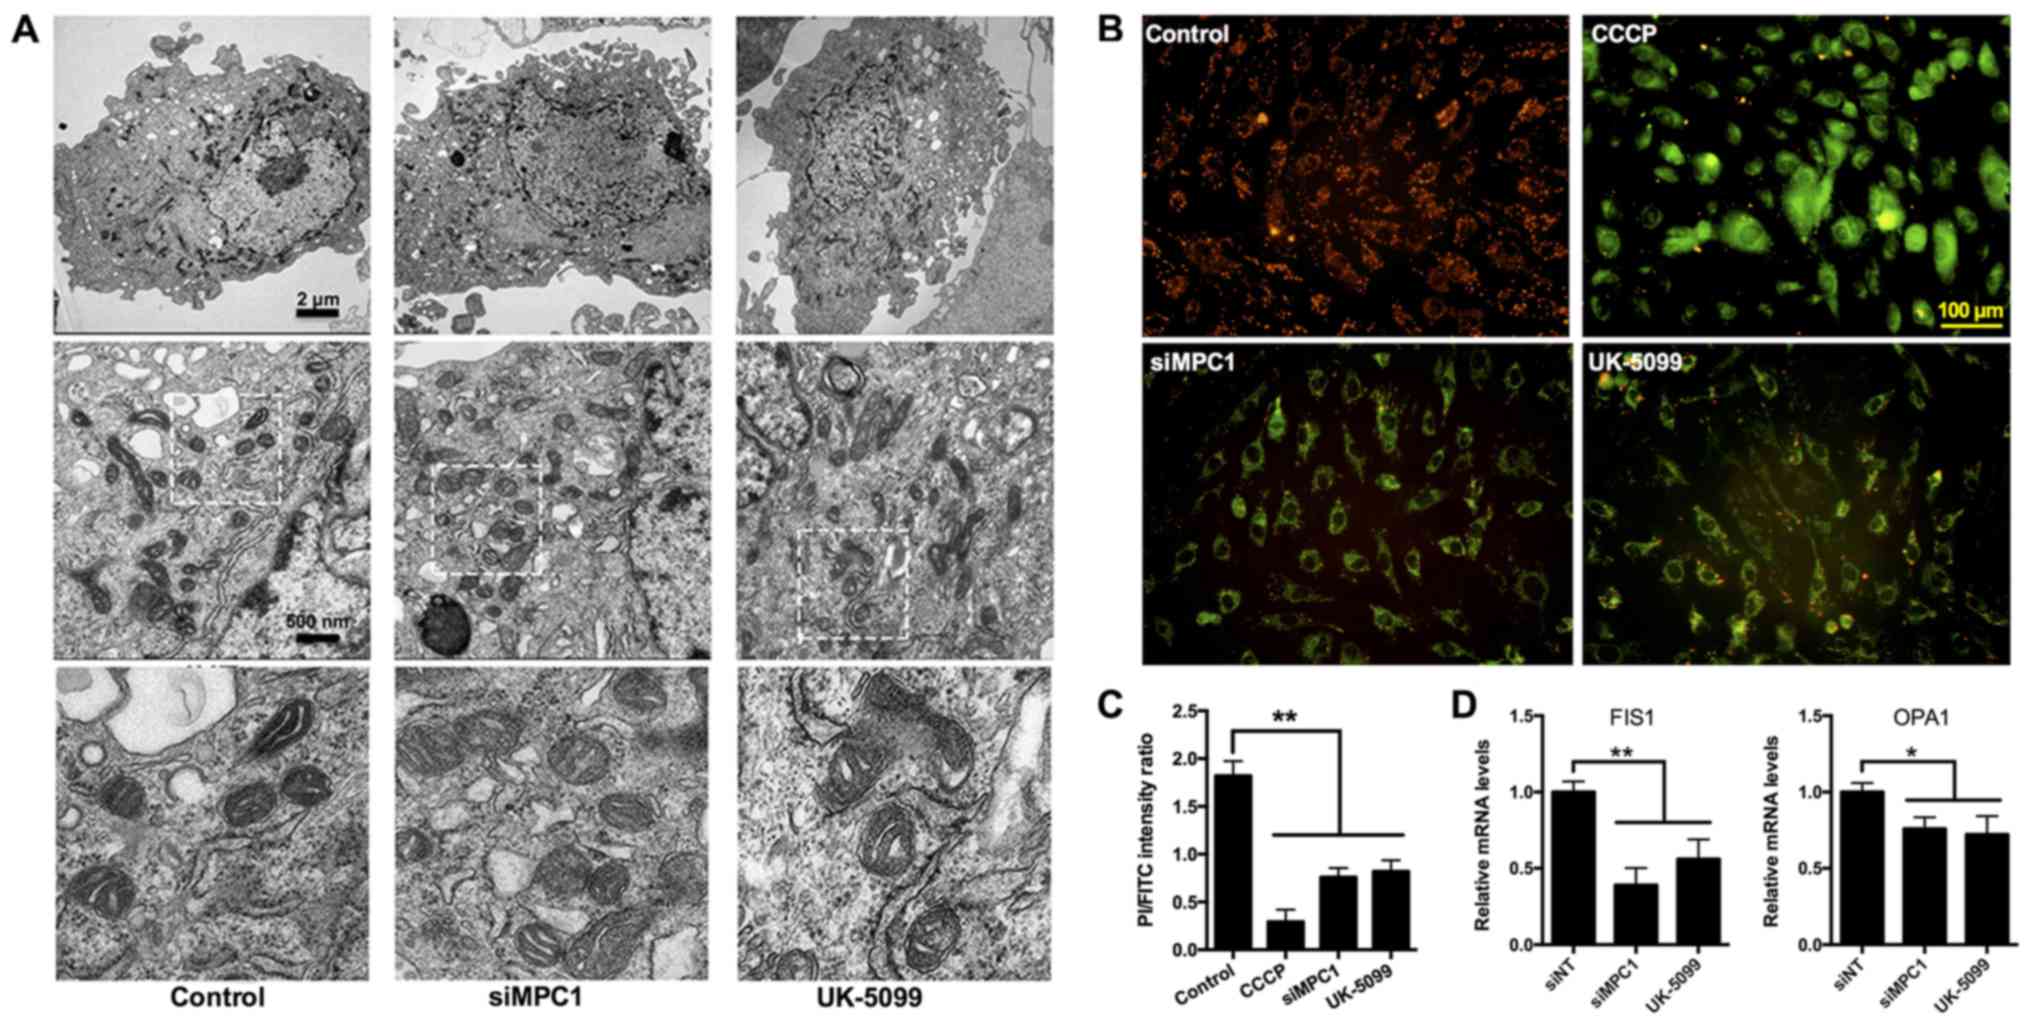
morphology of the organelle. To determine whether mitochondrial
structure was affected by the inhibition of MPC, transmission
electron microcopy was utilized to examine the mitochondrial
morphology in HUVECs treated with UK5099 or siRNA. Compared with
control treatment groups, MPC1 silencing or UK5099 treatment did
not lead to significant alterations in mitochondrial structure
(i.e., no mitochondrial swelling, pyknosis, and ambiguous cristae
were observed; Fig. 4A).
The mitochondrial ∆ψm, an important parameter
reflecting mitochondrial function (16), can be measured using the
fluorescent dye JC-1. JC-1 accumulates and aggregates in healthy
mitochondria and can be visualized as red fluorescence. The
treatment of HUVECs with carbonyl cyanide-m-chlorophenylhydrazone
(CCCP), an OXPHOS inhibitor (17),
resulted in an increase in green fluorescence, indicating a
reduction in the mitochondrial ∆ψm (Fig. 4B). Similarly, the depletion of MPC1
using an siRNA or inhibition of MPC activity by UK5099 decreased
the mitochondrial ∆ψm (Fig. 4B).
Dissipation of the mitochondrial ∆ψm can also be represented by the
ratio of aggregated to monomeric JC-1, since the monomeric form of
JC-1 re-localizes to the cytosol following its disassociation in
mitochondria. Using flow cytometry, a significant amount of JC-1
aggregates was observed in the mitochondria of control cells
(Fig. 4C). In contrast, cells
treated with CCCP had a lower aggregated to monomeric JC-1 ratio
(Fig. 4C). HUVECs treated with
UK5099 or siMPC1 exhibited a reduced mitochondrial ∆ψm (Fig. 4C). Opa1 and Fis1 mediate
mitochondrial fusion and fission, and are important for the
maintenance of the organelle's function. qPCR revealed that the
Opa1 and Fis1 mRNA levels were reduced in
MPC1-knockdown and UK5099-treated HUVECs (Fig. 4D), suggesting a role for MPC in
mitochondrial function.
Discussion
A previous study showed that the MPC complex is a
key regulator of glycolysis in tumor cells (11). Independent of the EC subtype,
arterial, venous, lymphatic, and microvascular ECs rely heavily on
glycolysis for energy production regardless of the abundance of
oxygen (8). In this study, we
found that hypoxia decreased MPC1 and MPC2 expression in HUVECs.
This was correlated with an upregulation in the levels of
glycolytic enzymes, leading to increased glycolysis and lactate
secretion.
In contrast to other cell types with greater energy
needs, there is a moderate number of mitochondria in ECs. The
mitochondrial volume in these cells is only 2–6% of the total
cellular volume, compared to 32% in cardiomyocytes and 28% in
hepatocytes (16,18,19).
Interestingly, we found that HUVECs, HCAECs, and HUSMCs had similar
transcript levels of MPC1 and MPC2, suggesting that
mitochondrial volume may not be the deciding factor for MPC
expression.
Lactate is generated through the metabolism of
pyruvate by LDHA as the final step of glycolysis. The effect of
hypoxia on EC metabolism remains poorly understood. Previous
studies have suggested that hypoxia promotes glycolysis by
upregulating the expression of glycolysis-promoting genes,
stabilizing HIF-1α, inhibiting pyruvate dehydrogenase kinase and
prolyl hydroxylase, and inducing lactate secretion (20). Recently, De Bock et al
(8) demonstrated that glycolysis
in ECs is modulated by the enzyme PFKFB3, an activator of
phosphofructokinase 1, which is a rate-limiting enzyme in
glycolysis. Xu et al (12)
later reported that PFKFB3 expression was increased upon exposure
to hypoxia in ECs. Consistent with these findings, our data show
that HUVECs upregulated lactate secretion by increasing the levels
of the glycolytic enzymes HK2, LDHA, and PFKFB3 under hypoxic
conditions.
Hypoxia signaling can induce a shift from other
forms of energy production to glycolysis-dependent means (21). In ECs, in which glycolysis is the
main form of energy generation, hypoxia may have a more profound
impact on other metabolic pathways, including mitochondrial OXPHOS.
Low oxygen levels regulate glycolysis-promoting genes while
decreasing pyruvate metabolism (22). Given the important role of the MPC
complex in pyruvate metabolism, alterations in the expression of
MPC could have a significant effect on cells. We found that the
expression of MPC1 and MPC2 was decreased when the oxygen level was
low, and that their expression levels recovered following
re-oxygenation. This suggests that the function of the MPC complex
is regulated by oxygen concentrations. The transportation of
pyruvate into mitochondria by the MPC complex is the first step in
mitochondrial OXPHOS; however, how this process may affect
glycolysis is unclear. Li et al (11) reported that blocking pyruvate
transportation into mitochondria using the MPC blocker UK5099
attenuated mitochondrial OXPHOS and triggered aerobic glycolysis in
esophageal squamous cell carcinomas. As pyruvate plays a central
role in glucose and lipid metabolism, we speculated that
dysregulation of MPC function may alter the expression of other
metabolic genes apart from those involved in OXPHOS. Indeed,
treatment with UK5099 or MPC1 silencing upregulated the glycolytic
enzymes HK2, LDHA, and PFKFB3 in HUVECs. However, the mechanism of
MPC inhibition-induced glycolytic enzymes expression is unclear in
ECs. During hypoxia, hypoxia-inducible factor (HIF) signaling
regulates multiple aspects of ECs metabolism. Stabilization of
HIF1α results in a switch from OXPHOS towards glycolysis by binding
to a hypoxia response element (HRE) in the promoter and thus
upregulating glycolysis-promoting genes, such as HK,
glyceraldehyde-3-phosphate dehydrogenase, LDHA and pyruvate
dehydrogenase kinase 1 (PDK1) (22). Furthermore, lactate production from
glycolysis flux can further stabilize HIF1α. In the present study,
we found that treatment with UK5099 or MPC1 silencing increased
lactate secretion. Therefore, we consider that MPC inhibition
increases glycolytic enzymes via both directly and indirectly
stabilize HIF1α. A future work will be performed to fully
understand the mechanism.
Due to an insufficient oxygen supply, mitochondrial
OXPHOS is inhibited. ATP levels are also decreased during the
initial phase of hypoxia as a result of reduced glycolysis. As
glycolysis recovers, the production of ATP increases as long as
sufficient amounts of substrates are available (23), while the concentration of lactate
rises steadily. Our data reveal a significant decrease in ATP
synthesis and increase in lactate production in HUVECs treated with
UK5099 or siMPC1. This suggests that impaired mitochondrial
pyruvate transport could drive glycolysis to promote lactate
secretion in HUVECs.
Mitochondrial function is closely related to the
amount of pyruvate entering mitochondria (16). In our study, we showed that the
mitochondrial ∆ψm dropped when MPC1 was silenced or when MPC
function was inhibited, suggesting that hypoxia-induced
mitochondrial dysfunction is related to MPC expression and/or
activity. Interestingly, little change was detected in
mitochondrial morphology. However, we cannot rule out the
possibility that the inhibition of MPC could induce changes in
organelle structure if treatment was prolonged (> 24 h).
Fission and fusion mechanisms regulate mitochondrial
morphology and apoptosis (14).
Fission frequency is determined by the levels of Fis1, which
localizes to the outer mitochondrial membrane. Fusion frequency is
influenced by Opa1 levels, which are known to be associated with
the IMM (24). It has been shown
that the depletion of Opa1 leads to a reduction in mitochondrial
∆ψm, while fragmentation of the mitochondrial network by Fis1 leads
to cytochrome c release (14).
Other studies have indicated that hypoxia/re-oxygenation results in
a significant reduction in Opa1 levels and upregulation of Fis1 in
cardiomyocytes (25) and
hippocampal neurons (26).
However, Chitra and Boopathy (27)
reported that hypobaric hypoxia modulated mitochondrial dynamics by
decreasing Fis1 in rat lung cells. Our data demonstrate that
Opa1 and Fis1 mRNA levels were reduced after MPC1
knockdown or UK5099 treatment. Additional experimental
investigations are needed to better understand the role of the MPC
complex in mitochondrial fission and fusion.
In conclusion, we found that the MPC complex may
play an essential role in hypoxia-induced glycolysis and lactate
secretion in HUVECs. The depletion of MPC1 or inhibition of the MPC
complex leads to increased lactate production, potentially by
upregulating glycolytic enzymes and therefore promoting glycolysis.
This study is the first attempt to link hypoxia to the MPC complex.
It reveals MPC as a potential target for the treatment of
hypoxia-related injury to ECs, including acute myocardial
infarction and pulmonary hypertension. Limiting glycolysis
decreased endothelial sprouting (28), showing the role of glycolysis on
angiogenesis. As we known, angiogenesis has close relationship with
cancer. It is thus tempting to speculate that MPC may be a novel
target for the prevention and treatment of cancer. In conclusion,
we demonstrated that hypoxia can induce lactate secretion and
glycolytic efflux by downregulating MPC levels. Our study provided
the evidence that MPC complex may play an essential role in
hypoxia-induced glycolysis and lactate secretion in HUVECs. MPC
might be a novel treatment target for hypoxia-induced EC injury,
such as acute myocardial infarction and pulmonary hypertension.
Acknowledgements
Not applicable.
Funding
The present work was supported by Chengchun Tang
(NSF nos. 81670237 and 81370225) and Dong Wang (the Fundamental
Research Funds for the Central Universities, no.
2242018K40159).
Availability of data and materials
The datasets used during the present study are
available from the corresponding author on reasonable request.
Authors' Contributions
DW, QW and CT designed the research. DW, QW, BZ and
BL performed the experiments. DW, QW, GY and YQ analyzed the data.
DW and CT wrote the manuscript. All authors reviewed and edited the
manuscript.
Ethics approval and consent to
participate
Not applicable.
Consent for publication
Not applicable.
Competing interests
The authors declare that they have no competing
interests.
References
|
1
|
Herzig S, Raemy E, Montessuit S, Veuthey
JL, Zamboni N, Westermann B, Kunji ER and Martinou JC:
Identification and functional expression of the mitochondrial
pyruvate carrier. Science. 337:93–96. 2012. View Article : Google Scholar : PubMed/NCBI
|
|
2
|
Bricker DK, Taylor EB, Schell JC, Orsak T,
Boutron A, Chen YC, Cox JE, Cardon CM, Van Vranken JG, Dephoure N,
et al: A mitochondrial pyruvate carrier required for pyruvate
uptake in yeast, Drosophila, and humans. Science. 337:96–100. 2012.
View Article : Google Scholar : PubMed/NCBI
|
|
3
|
Schell JC, Wisidagama DR, Bensard C, Zhao
H, Wei P, Tanner J, Flores A, Mohlman J, Sorensen LK, Earl CS, et
al: Control of intestinal stem cell function and proliferation by
mitochondrial pyruvate metabolism. Nat Cell Biol. 19:1027–1036.
2017. View
Article : Google Scholar : PubMed/NCBI
|
|
4
|
Divakaruni AS, Wallace M, Buren C,
Martyniuk K, Andreyev AY, Li E, Fields JA, Cordes T, Reynolds IJ,
Bloodgood BL, et al: Inhibition of the mitochondrial pyruvate
carrier protects from excitotoxic neuronal death. J Cell Biol.
216:1091–1105. 2017. View Article : Google Scholar : PubMed/NCBI
|
|
5
|
Vigueira PA, McCommis KS, Hodges WT,
Schweitzer GG, Cole SL, Oonthonpan L, Taylor EB, McDonald WG,
Kletzien RF, Colca JR and Finck BN: The beneficial metabolic
effects of insulin sensitizers are not attenuated by mitochondrial
pyruvate carrier 2 hypomorphism. Exp Physiol. 102:985–999. 2017.
View Article : Google Scholar : PubMed/NCBI
|
|
6
|
McCommis KS, Hodges WT, Brunt EM,
Nalbantoglu I, McDonald WG, Holley C, Fujiwara H, Schaffer JE,
Colca JR and Finck BN: Targeting the mitochondrial pyruvate carrier
attenuates fibrosis in a mouse model of nonalcoholic
steatohepatitis. Hepatology. 65:1543–1556. 2017. View Article : Google Scholar : PubMed/NCBI
|
|
7
|
Bender T and Martinou JC: The
mitochondrial pyruvate carrier in health and disease: To carry or
not to carry? Biochim Biophys Acta. 1863:2436–2442. 2016.
View Article : Google Scholar : PubMed/NCBI
|
|
8
|
De Bock K, Georgiadou M, Schoors S,
Kuchnio A, Wong BW, Cantelmo AR, Quaegebeur A, Ghesquière B,
Cauwenberghs S, Eelen G, et al: Role of PFKFB3-driven glycolysis in
vessel sprouting. Cell. 154:651–663. 2013. View Article : Google Scholar : PubMed/NCBI
|
|
9
|
Bachetti T and Morbidelli L: Endothelial
cells in culture: A model for studying vascular functions.
Pharmacol Res. 42:9–19. 2000. View Article : Google Scholar : PubMed/NCBI
|
|
10
|
Patterson JN, Cousteils K, Lou JW, Fox
Manning JE, MacDonald PE and Joseph JW: Mitochondrial metabolism of
pyruvate is essential for regulating glucose-stimulated insulin
secretion. J Biol Chem. 289:13335–13346. 2014. View Article : Google Scholar : PubMed/NCBI
|
|
11
|
Li Y, Li X, Kan Q, Zhang M, Li X, Xu R,
Wang J, Yu D, Goscinski MA, Wen JG, et al: Mitochondrial pyruvate
carrier function is negatively linked to Warburg phenotype in vitro
and malignant features in esophageal squamous cell carcinomas.
Oncotarget. 8:1058–1073. 2017.PubMed/NCBI
|
|
12
|
Xu Y, An X, Guo X, Habtetsion TG, Wang Y,
Xu X, Kandala S, Li Q, Li H, Zhang C, et al: Endothelial PFKFB3
plays a critical role in angiogenesis. Arterioscler Thromb Vasc
Biol. 34:1231–1239. 2014. View Article : Google Scholar : PubMed/NCBI
|
|
13
|
Yu Z, Zhao X, Huang L, Zhang T, Yang F,
Xie L, Song S, Miao P, Zhao L, Sun X, et al: Proviral insertion in
murine lymphomas 2 (PIM2) oncogene phosphorylates pyruvate kinase
M2 (PKM2) and promotes glycolysis in cancer cells. J Biol Chem.
288:35406–35416. 2013. View Article : Google Scholar : PubMed/NCBI
|
|
14
|
Lee YJ, Jeong SY, Karbowski M, Smith CL
and Youle RJ: Roles of the mammalian mitochondrial fission and
fusion mediators Fis1, Drp1, and Opa1 in apoptosis. Mol Biol Cell.
15:5001–5011. 2004. View Article : Google Scholar : PubMed/NCBI
|
|
15
|
Hildyard JC, Ammälä C, Dukes ID, Thomson
SA and Halestrap AP: Identification and characterisation of a new
class of highly specific and potent inhibitors of the mitochondrial
pyruvate carrier. Biochim Biophys Acta. 1707:221–230. 2005.
View Article : Google Scholar : PubMed/NCBI
|
|
16
|
Tang X, Luo YX, Chen HZ and Liu DP:
Mitochondria, endothelial cell function, and vascular diseases.
Front Physiol. 5:1752014. View Article : Google Scholar : PubMed/NCBI
|
|
17
|
Xiao B, Deng X, Lim GGY, Xie S, Zhou ZD,
Lim KL and Tan EK: Superoxide drives progression of
Parkin/PINK1-dependent mitophagy following translocation of Parkin
to mitochondria. Cell Death Dis. 8:e30972017. View Article : Google Scholar : PubMed/NCBI
|
|
18
|
Dromparis P and Michelakis ED:
Mitochondria in vascular health and disease. Annu Rev Physiol.
75:95–126. 2013. View Article : Google Scholar : PubMed/NCBI
|
|
19
|
Kluge MA, Fetterman JL and Vita JA:
Mitochondria and endothelial function. Circ Res. 112:1171–1188.
2013. View Article : Google Scholar : PubMed/NCBI
|
|
20
|
Wong BW, Marsch E, Treps L, Baes M and
Carmeliet P: Endothelial cell metabolism in health and disease:
Impact of hypoxia. EMBO J. 36:2187–2203. 2017. View Article : Google Scholar : PubMed/NCBI
|
|
21
|
Tretyakov AV and Farber HW: Endothelial
cell tolerance to hypoxia. Potential role of purine nucleotide
phosphates. J Clin Invest. 95:738–744. 1995. View Article : Google Scholar : PubMed/NCBI
|
|
22
|
Schofield CJ and Ratcliffe PJ: Oxygen
sensing by HIF hydroxylases. Nat Rev Mol Cell Biol. 5:343–354.
2004. View
Article : Google Scholar : PubMed/NCBI
|
|
23
|
Jezek P and Plecitá-Hlavatá L:
Mitochondrial reticulum network dynamics in relation to oxidative
stress, redox regulation, and hypoxia. Int J Biochem Cell Biol.
41:1790–1804. 2009. View Article : Google Scholar : PubMed/NCBI
|
|
24
|
Olichon A, Baricault L, Gas N, Guillou E,
Valette A, Belenguer P and Lenaers G: Loss of OPA1 perturbates the
mitochondrial inner membrane structure and integrity, leading to
cytochrome c release and apoptosis. J Biol Chem. 278:7743–7746.
2003. View Article : Google Scholar : PubMed/NCBI
|
|
25
|
Yu J, Wu J, Xie P, Maimaitili Y, Wang J,
Xia Z, Gao F, Zhang X and Zheng H: Sevoflurane postconditioning
attenuates cardiomyocyte hypoxia/reoxygenation injury via restoring
mitochondrial morphology. PeerJ. 4:e26592016. View Article : Google Scholar : PubMed/NCBI
|
|
26
|
Zhao L, Li S, Wang S, Yu N and Liu J: The
effect of mitochondrial calcium uniporter on mitochondrial fission
in hippocampus cells ischemia/reperfusion injury. Biochem Biophys
Res Commun. 461:537–542. 2015. View Article : Google Scholar : PubMed/NCBI
|
|
27
|
Chitra L and Boopathy R: Adaptability to
hypobaric hypoxia is facilitated through mitochondrial
bioenergetics: An in vivo study. Br J Pharmacol. 169:1035–1047.
2013. View Article : Google Scholar : PubMed/NCBI
|
|
28
|
Boeckel JN, Derlet A, Glaser SF, Luczak A,
Lucas T, Heumüller AW, Krüger M, Zehendner CM, Kaluza D,
Doddaballapur A, et al: JMJD8 regulates angiogenic sprouting and
cellular metabolism by interacting with pyruvate kinase M2 in
endothelial cells. Arterioscler Thromb Vasc Biol. 36:1425–1433.
2016. View Article : Google Scholar : PubMed/NCBI
|