Introduction
Chronic myelogenous leukemia (CML) is a type of
leukemia characterized by an accumulation of myeloid cells in
patient blood and is caused by the uncontrolled growth of myeloid
cells in the bone marrow (1). CML
has a slight male predominance (1)
and people with a median age of 65-years are more susceptible to
the disease (2). Although the
cause of most CML cases remains unknown, it has been suggested that
genetic variations may serve a role in the pathogenesis of CML
(3).
To date, hundreds of genes have been linked to CML.
For example, the fusion gene breakpoint cluster region-Abelson
murine leukemia viral oncogene homolog 1 (BCR-ABL1) leads to
increased expression of ABL1 and has been observed in many cases of
CML (4–6). ABL1 inhibitors have been developed to
inhibit tyrosine kinase activity and are often used to treat
patients with CML. In addition, serum levels of interleukin (IL)-6
and tumor necrosis factor (TNF) have been suggested as potential
prognostic markers for CML (7,8).
Other genes, including ephrin type-B receptor 4, janus kinase 2
(JAK2), epidermal growth factor receptor (EGFR), catenin β 1
(CTNNB1), vascular endothelial growth factor A (VEGFA), KIT
proto-oncogene receptor tyrosine kinase and tumor protein p53
(TP53), have been suggested to be significantly linked to CML,
albeit with unknown mechanisms (9–14).
Nevertheless, many of the genes reported to be associated with CML
have been reported by very few studies, and these studies have
largely been conducted with small sample sizes. Therefore, there is
an increased requirement to systematically evaluate these CML
target genes.
Over the last few years, Pathway Studio®
(PS; www.pathwaystudio.com) has become a
popular tool for literature-based relation data analysis (15–17).
In the present study, PS was used to identify CML target genes for
evaluation, based on published scientific literature. Multiple
levels of analysis between these target genes and CML were
conducted by integrating data across different modalities. The
present study aimed to provide a systematic evaluation approach
through a weighted gene-gene interaction (GGI) network analysis, in
order to better understand the underlying pathogenic development of
CML.
Materials and methods
Study design
Large-scale CML-gene relation data were analyzed to
identify CML candidate genes and generate two literature-based
metrics (i.e., reference and age scores). Subsequently, multiple
analyses of target genes and CML were conducted to identify CML
candidate pathways, build GGI networks and develop two network
metrics (i.e., pathway and significance scores). The analysis
included GGI analysis, sub-network enrichment analysis (SNEA) and
gene set enrichment analysis (GSEA). Lastly, a Euclidean
distance-based classification approach (18) was employed to test the
effectiveness of the proposed metrics using gene expression
data.
Using the aforementioned approach, a genetic
database for CML (CML_GD) was developed (http://gousinfo.com/database/Data_Genetic/CML_GD.xlsx).
The database contained 579 CML target genes (CML_GD→Related Genes),
supported by 1,739 references (CML_GD→Ref for Disease-Gene
Relation). The database also included 145 pathways from GSEA
(CML_GD→Related Pathways) and 99 diseases from SNEA (CML_GD→Related
Diseases). Further information regarding the database can be found
at (CML_GD→Database Note).
CML target genes
The 579 CML target genes (CML_GD→Related Genes) were
genes that had been associated with CML once or several times
within PS. PS identified CML-gene relations using a natural
language processing technique, covering a large literature database
with >35 million references (19,20).
Enrichment analysis
Using the 579 CML target genes as input, GSEA and
SNEA were conducted within PS. GSEA compared the 579 CML target
genes against the Gene Ontology (GO) terms, PS Ontology and
>2,000 PS-curated pathways. SNEA, another PS built-in enrichment
module (21), identified that the
579 target genes significantly overlapped with genes associated
with diseases. P-values were calculated using the Fisher's exact
test, with false discovery rate (FDR) analysis for multiple
analyses (22). The Fisher's exact
test has been adopted as an effective statistical method to measure
the gene-enrichment in annotation terms. Subsequently, GGI analysis
was conducted to generate a weighted GGI network. The number of
pathways shared by two genes was used as the weight for the
corresponding edge.
Four network metrics
For each of the 579 CML target genes four metrics
were proposed. The reference sore (RScore) of a gene was defined as
the number of references supporting the CML-gene relation,
according to the following equation: RScore = number of references
supporting a CML-gene relation. The age score (AScore) of a gene
was defined as the age of the reference that first reported the
CML-gene relation. The pathway score (PScore) was defined as the
number of pathways in CML_GD→Related Pathways that included the
gene of interest. The network significance score (SScore) of a
node/gene was defined as follows:
SScore=N×CDW0.5(i)∑jNCDW0.5(i)
where N represents the CML target gene number
in the network and CWD0.5
is the generalized centrality of the ith node. A detailed
calculation of CWD0.5 is
described in previous studies (23–25).
Validation by case/control
classification
R 3.1.2 software was used for the analysis. Based on
the hypothesis that an effective metric could be used to select
genes that were more relevant to the disease, the present study
proposed to use gene expression of the top genes ranked by
different metrics to classify CML cases from controls. A Euclidean
distance-based classification approach (26) was employed as a classifier,
followed by a leave-one-out (LOO) cross-validation. The Euclidean
distance-based classification approach has been successfully
applied to the classification of functional magnetic resonance
imaging data as well as single nucleotide polymorphisms data in
previous studies (18,26). The input of the classifier was the
gene expression of selected genes. For each run of the LOO
processes, gene expression values of one sample were used as a
testing sample and the remainder as training samples. The output
was the classification accuracy (CR), which was defined as the
number of correctly classified subjects of the total subjects.
Lastly, a 5,000-run permutation was performed to generate a
permutation P-value, which stated the probability a randomly
selected gene set containing the same number of genes could reach
the same or higher CR.
The expression data used for case/control
classification were acquired from 149 subjects, including samples
from 76 patients with CML and 73 healthy controls (NCBI GEO:
GSE13159; http://www.ncbi.nlm.nih.gov/geo/). The dataset
included 549 out of 579 CML target genes (CML_GD→Related
Genes).
Results
CML target genes
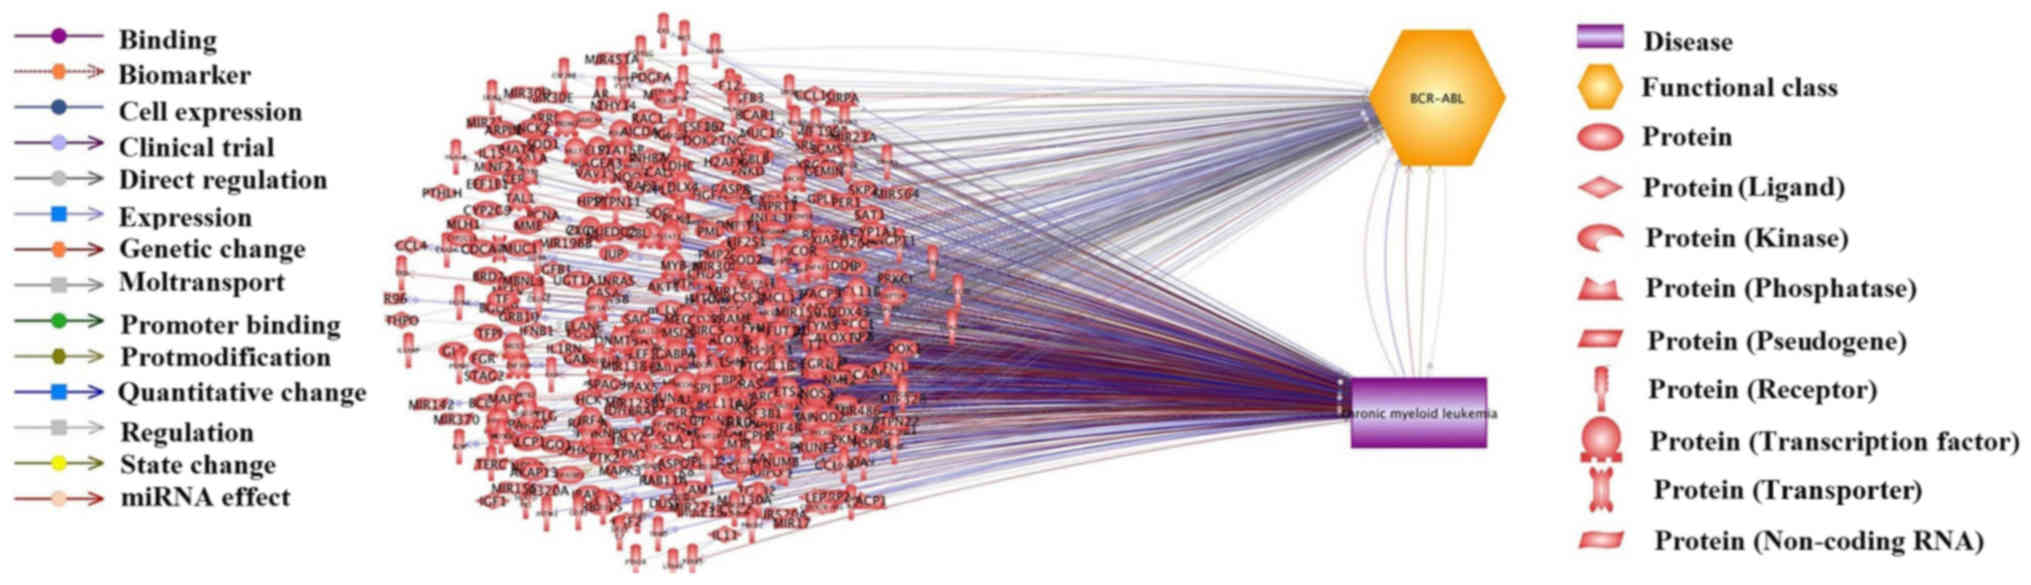
A total of 579 CML candidate genes were identified
from CML-gene relation data supported by 1,739 references (Fig. 1). These genes are presented in
CML_GD→Related Genes. The 1,739 supporting references are presented
in CML_GD→Ref for Disease-Gene Relation, which included types of
CML-gene relations, reference titles and the reference where a
disease-gene relation has been identified. In addition, Fig. 1 revealed the relations between 265
out of the 579 genes and BCR-ABL mutations. It is widely accepted
that BCR-ABL mutations are significantly associated with the
treatment of patients with CML (27). Therefore, the present study also
aimed to investigate BCR-ABL mutation-related genes and discuss
their relationship to CML. The BCR-ABL-related genes and supporting
references are presented in CML_GD→BCR-ABL related Genes and
CML_GD→Ref for BCR-ABL-Gene Relation, respectively.
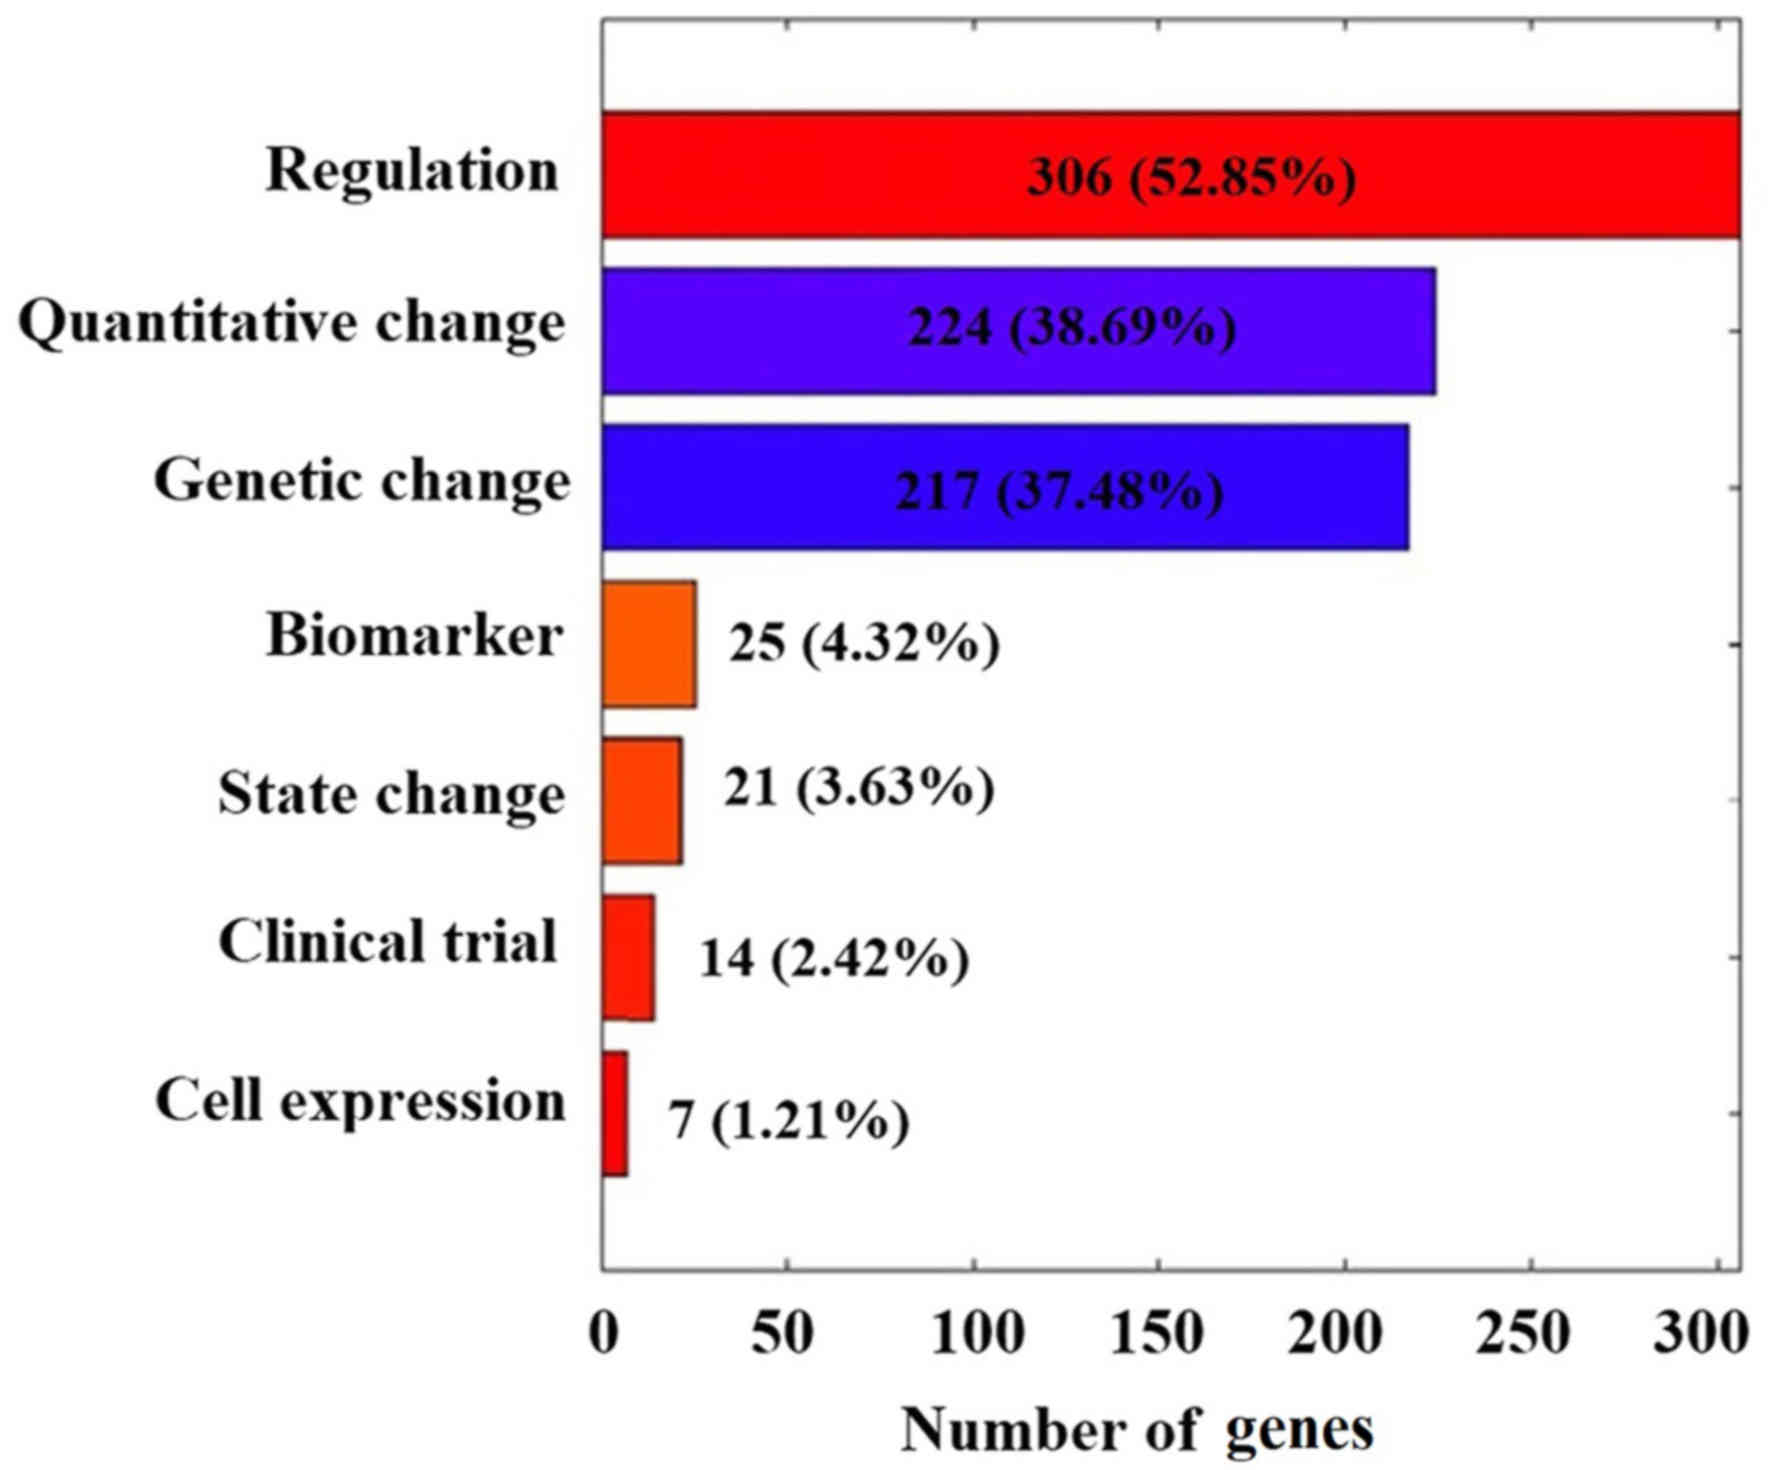
Of the 579 CML candidate genes, 325 (56.13%) have
been reported with one reference (RScore=1), 88 (15.20%) with two,
47 (8.12%) with 3 and only 65 (11.23%) with more than five
references. As presented in Fig.
2, these 579 CML genes demonstrated several different types of
functional associations with CML. While all these studies are
valuable, further evaluation with meaningful metrics may help to
further evaluate the linkage between these genes and CML, and
reduce possible noise introduced within individual studies.
The publication date distribution for the 1,739
supporting references was also analyzed. The results demonstrated
that on average the publication age of the references was 6.4
years. In addition, novel genes were identified each year.
Enrichment analysis
The top 20 significantly enriched pathways are
listed in Table I. A total of 389
out of 579 genes were enriched within these pathways
(P<1.2×10⁻²⁷; q=0.005). In CML_GD→Related Pathways,
the top 145 pathways that were significantly enriched with 485 out
of 579 genes (P<8.1×10⁻¹¹; q=0.005) are
presented.
 | Table I.Top 20 gene pathways/groups enriched
by 389 out of 579 target genes. |
Table I.
Top 20 gene pathways/groups enriched
by 389 out of 579 target genes.
| Pathway/gene set
name | GO ID | No. of
entities | Overlap | P-value (FDR
correction) | P-value |
|---|
| Response to
drug | 0017035 | 509 | 94 |
4.36×10−51 |
4.36×10−54 |
| Positive regulation
of cell proliferation | 0008284 | 568 | 90 |
3.20×10−43 |
6.39×10−46 |
| Negative regulation
of apoptotic process | 0006916 | 650 | 94 |
5.64×10−42 |
1.69×10−44 |
| Blood
coagulation | 0007596 | 501 | 80 |
1.35×10−38 |
5.38×10−41 |
| Response to organic
cyclic compound | 0014070 | 253 | 59 |
1.34×10−37 |
6.69×10−40 |
| Negative regulation
of cell proliferation | 0008285 | 471 | 72 |
2.30×10⁻³³ |
1.38×10⁻³⁵ |
| Cytokine-mediated
signaling pathway | 0019221 | 316 | 60 |
5.50×10⁻³³ |
3.85×10⁻³⁵ |
| Positive regulation
of ERK1 and ERK2 cascade | 0070374 | 134 | 42 |
2.46×10⁻³² |
1.97×10⁻³⁴ |
| Innate immune
response | 0002226 | 792 | 90 |
5.02×10⁻³² |
4.51×10⁻³⁴ |
| Regulation of cell
proliferation | 0042127 | 240 | 52 |
1.59×10⁻³¹ |
1.59×10⁻³³ |
| Positive regulation
of apoptotic process | 0043065 | 393 | 64 |
2.33×10⁻³¹ |
2.57×10⁻³³ |
| Response to
hypoxia | 0001666 | 259 | 53 |
6.63×10⁻³¹ |
7.95×10⁻³³ |
| Apoptotic
process | 0008632 | 790 | 88 |
9.39×10⁻³¹ |
1.22×10⁻³² |
| Aging | 0016280 | 254 | 52 |
2.16×10⁻³⁰ |
3.14×10⁻³² |
| Positive regulation
of transcription, DNA-templated | 0045941 | 623 | 76 |
5.27×10⁻²⁹ |
8.95×10⁻³¹ |
| Response to
ethanol | 0017036 | 161 | 42 |
5.27×10⁻²⁹ |
8.96×10⁻³¹ |
| Response to
estradiol | 0032355 | 175 | 43 |
1.48×10⁻²⁸ |
2.66×10⁻³⁰ |
| Neurotrophin TRK
receptor signaling pathway | 0048011 | 280 | 52 |
2.53×10⁻²⁸ |
4.81×10⁻³⁰ |
| Epidermal growth
factor receptor signaling pathway | 0007173 | 201 | 45 |
4.43×10⁻²⁸ |
8.87×10⁻³⁰ |
| Negative regulation
of transcription from RNA polymerase II promoter | 0000122 | 799 | 84 |
1.18×10⁻²⁷ |
2.48×10⁻²⁹ |
Within the 145 pathways (CML_GD→Related Pathways),
12 were related to cell growth and proliferation (overlapped genes:
221), 11 to protein kinase (overlapped genes: 156), 11 to cell
apoptosis (overlapped genes: 201), eight to protein phosphorylation
(overlapped genes: 119), six to transcription factors (overlapped
genes: 152), three to nervous system (overlapped genes: 89) and
three to immune system (overlapped genes: 140). Additionally, two
ontology terms were related to ageing (overlapped genes: 140).
Along with GSEA, SNEA was also conducted to identify
the diseases that were significantly linked to the 579 CML target
genes. A total of 99 diseases are presented in CML _GD→Related
Diseases and the top 10 diseases are listed in Table II. The genes associated with each
of these 99 diseases demonstrated significant overlap with the 579
CML target genes (P<1×10−90).
| Table II.Sub-networks enriched by the 579
genes. |
Table II.
Sub-networks enriched by the 579
genes.
| Gene set | Total no. of
related genes | Overlap | P-value (FDR
correction) | P-value |
|---|
| Acute myeloid
leukemia | 1,023 | 295 |
5.91×10−256 |
1.77×10−258 |
| Lymphoma |
967 | 254 |
7.44×10−204 |
5.21×10−206 |
| Myelodysplastic
syndrome |
504 | 203 |
6.37×10−202 |
5.10×10−204 |
| Acute lymphoblastic
leukemia |
582 | 212 |
1.45×10−200 |
1.30×10−202 |
| Non-small cell lung
cancer | 1,568 | 296 |
2.41×10−198 |
2.40×10−200 |
| Breast cancer | 3,180 | 380 |
2.47×10−195 |
2.71×10−197 |
| Colorectal
cancer | 2,326 | 338 |
1.39×10−194 |
1.67×10−196 |
| Hepatocellular
carcinoma | 2,450 | 337 |
6.40×10−186 |
1.02×10−187 |
| Melanoma | 1,398 | 272 |
5.08×10−183 |
8.63×10−185 |
| Lung cancer | 1,745 | 294 |
5.29×10−182 |
9.53×10−184 |
GGI analysis
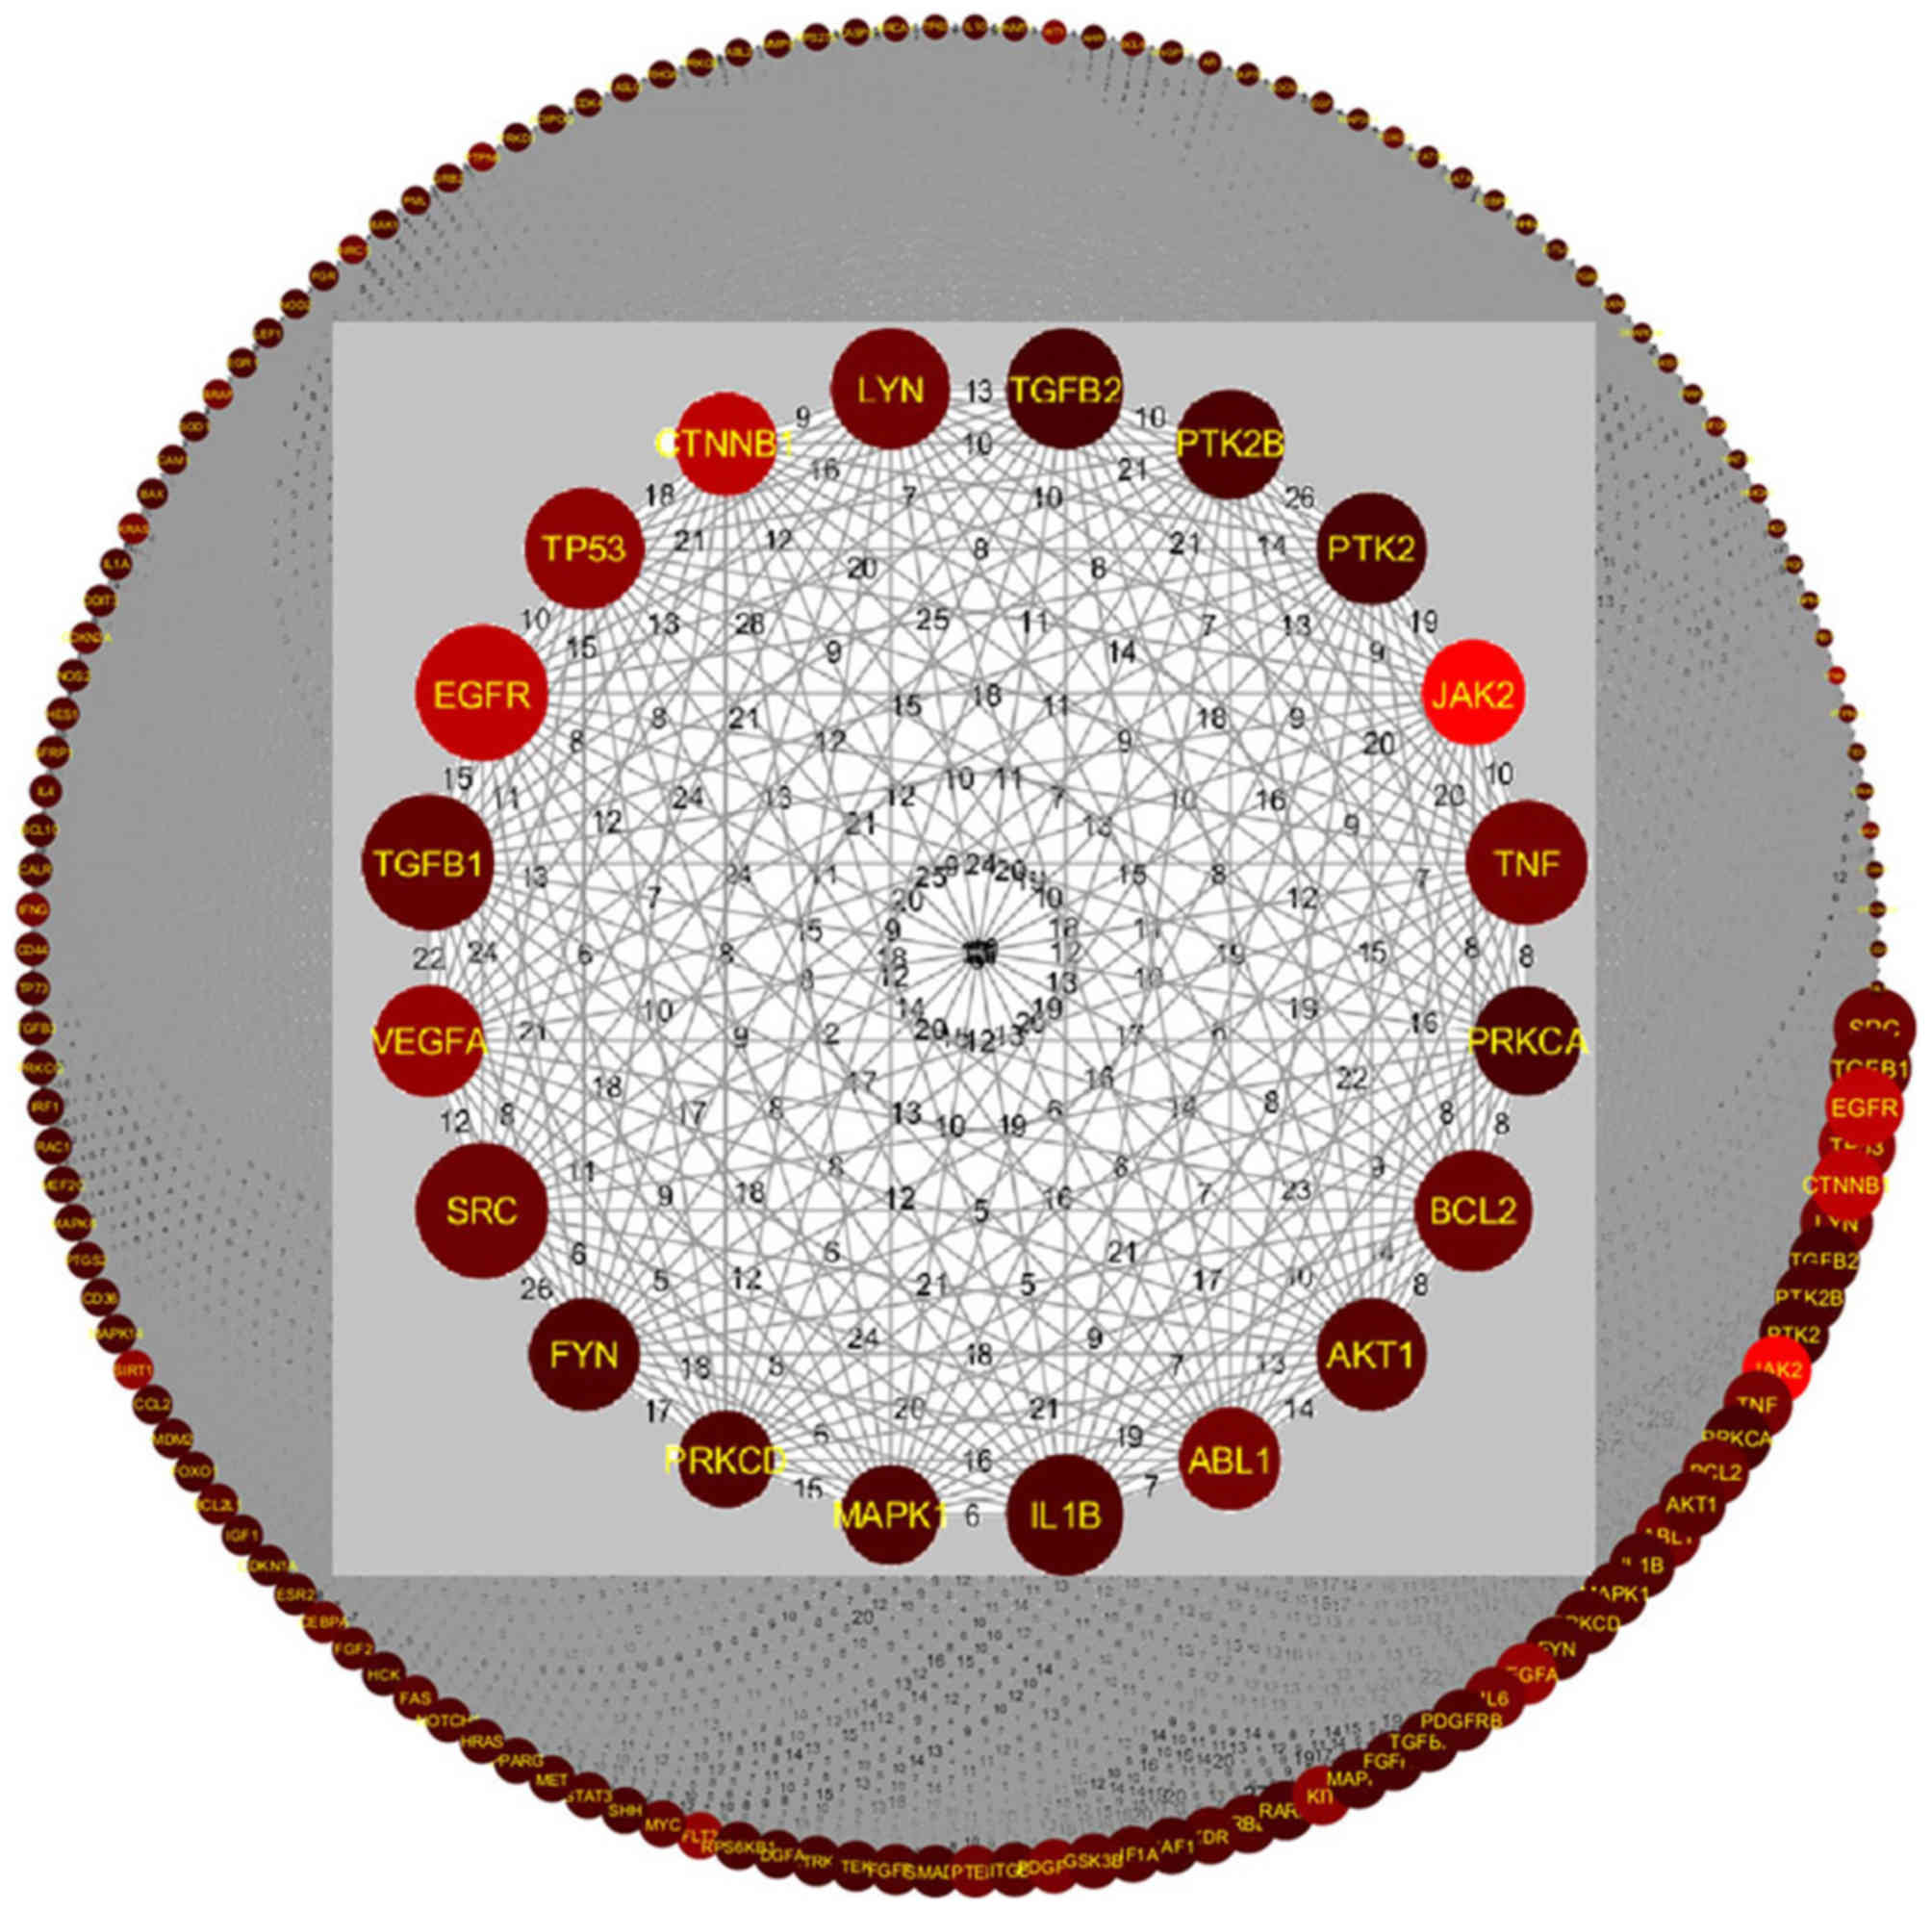
Pathway-based GGI analysis was conducted on all 579
candidate genes to build a gene interaction network for CML, as
shown in Fig. 3. The network was
composed of 485 out of 579 genes and 51,072 edges. An edge between
two genes represents at least one shared pathway. The remaining 94
out of 579 genes were not included, as these were not enriched
within the 145 significant pathways (CML_GD→Related Pathways). The
adjacent matrix of the network is presented in CML_GD→GGI Network.
In the adjacent matrix, the number between two genes represents the
number of shared pathways. For further statistics, please refer to
CML_GD→Network Statistics.
Evaluation by case/control
classification
For case/control classification, the 579 target
genes were initially ranked by different metrics and then the
expression values of the top n (n=1,2…) genes were
used as the input for classification. In each run of the LOO
process, expression data of these input genes from one sample were
used as the test, and the remainder as the training dataset for
classification. The process was repeated for each sample and each
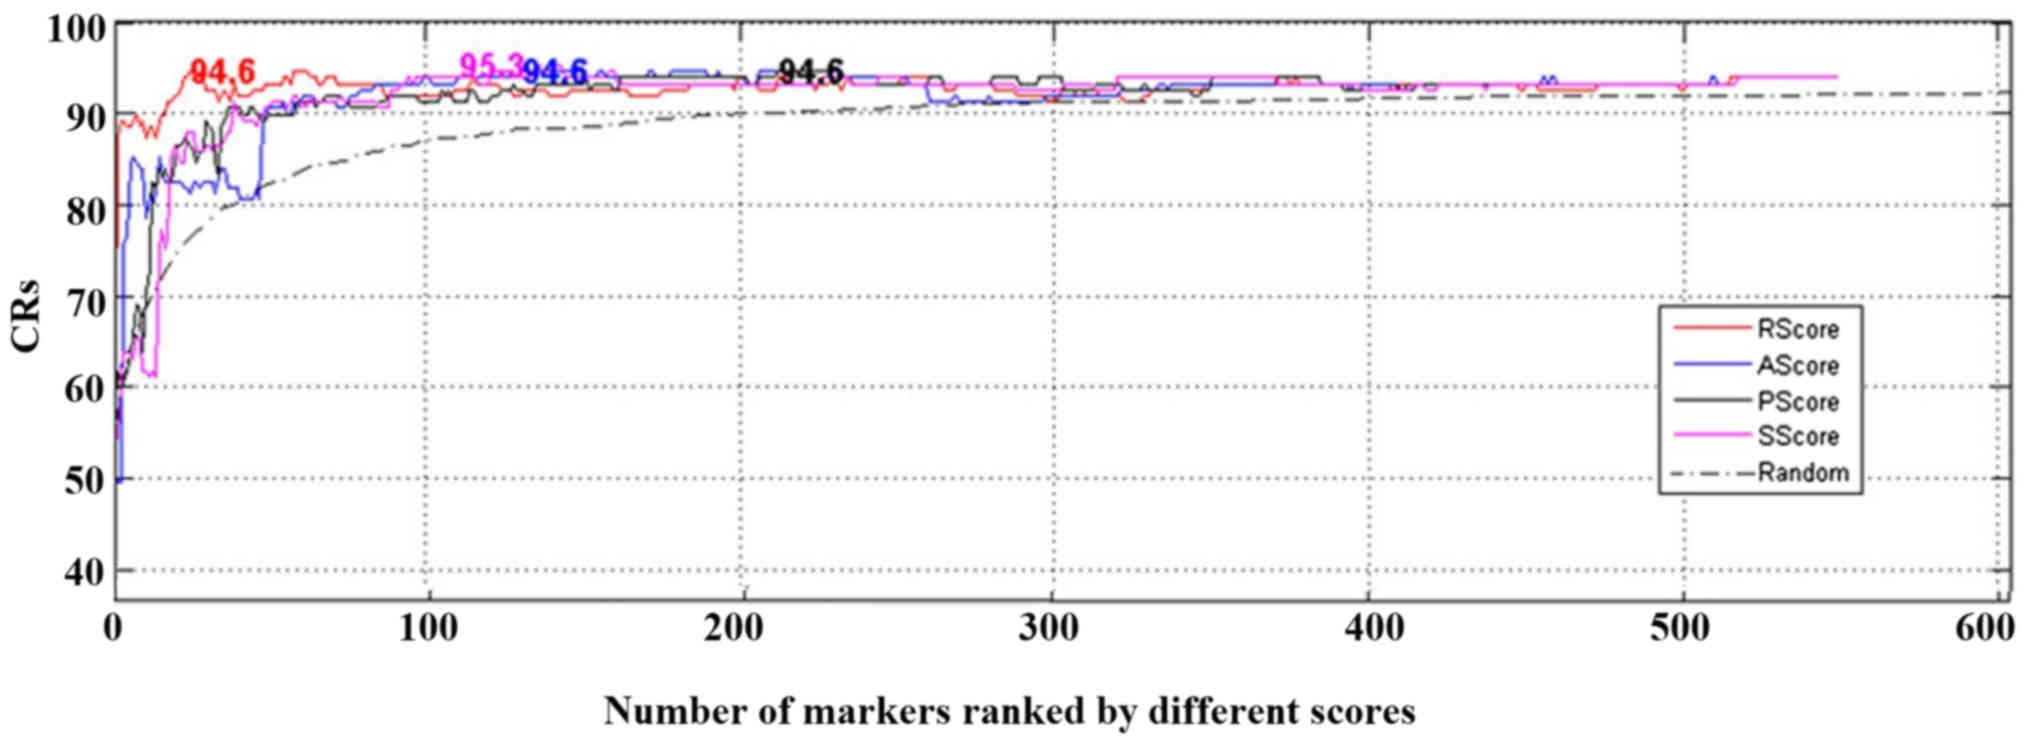
n. The output from the LOO process was CR. The CRs obtained
using a number of different genes for classification are presented
in Fig. 4. Further results are
provided in Table III.
| Table III.Permutation test on top genes
corresponding to highest CRs. |
Table III.
Permutation test on top genes
corresponding to highest CRs.
| Variable | RScore | AScore | PScore | SScore | 549 genes |
|---|
| Max CRs (%) | 94.63 | 94.63 | 94.63 | 95.30 | 93.96 |
| No. of genes | 25 | 131 | 212 | 111 | 549 |
| P-value |
<2×10⁻⁴ | 0.0124 | 0.029 | 0.0008 | 0.215 |
Both Fig. 4 and
Table III demonstrated that high
CR can be achieved by using top genes ranked by different scores,
whereas using more lower-scored genes may not increase the CRs
(Fig. 4, the highest CR were
presented at the corresponding number of genes). The results
suggested that the proposed metrics were effective in selecting top
genes to discriminate CML cases from controls. Notably, RScore
required the smallest number of genes and had the most significant
permutation P-value (P<2×10⁻⁴), and SScore led to the
highest CR of 95.30%.
Cross metrics analysis
If a gene satisfied the following, it may be more
likely to be associated with the development of CML: i) The gene
has been supported by multiple studies for its relation with CML
(high RScore); ii) the gene is involved in high number of molecular
pathways implicated in CML (high PScore); and iii) the gene
possesses strong connections with other CML candidate genes (high
SScore). AScore presented the history of a relation between a gene
and CML; the LOO results indicated that each of the four scores
proposed in this study was effective in selecting top genes for CML
prediction and that these identified genes may lead to an improved
classification accuracy. Therefore, top genes that were present in
all four scores may be considered as significant CML target
genes.
In Fig. 3, the
inner circle depicts the top genes selected using SScore. The size
of the circle is directly proportional to the PScore and the
brightness in color corresponds to the RScore. According to the
aforementioned hypothesis, genes with high SScore, PScore and
RScore values should be considered as important for CML. The
relevant genes were EGFR, TP53, CTNNB1, JAK2, TNF, ABL1, VEGFA,
B-cell lymphoma 2 (BCL2) and SRC proto-oncogene (SRC), which are
presented in Fig. 3 as large,
bright red circles. Analysis demonstrated that on average these
genes have an RScore=22.22±11.76, PScore=38.67±3.74 and
SScore=2.54±0.16. Please refer to CML_GD→Related Genes for further
information.
Some genes exhibited a high PScore and SScore, but
low RScore; these included SRC, transforming growth factor β1
(TGFB1), lck/yes-related novel protein tyrosine kinase, TGFB2,
protein tyrosine kinase 2β (PTK2B), PTK2, protein kinase c alpha,
BCL2, AKT serine/threonine kinase 1, IL1B, mitogen-activated
protein kinase 1 (MAPK1), FYN proto-oncogene, platelet derived
growth factor receptor β and MAPK3 (Fig. 3; CML_GD→Related Genes). These genes
were present in multiple CML-implicated pathways
(PScore=39.21±3.70) and displayed strong connections with other CML
target genes (SScore=2.55±0.16); however, these genes were first
reported many years ago (AScore=14.00±7.18) with few references
available (RScore=4.36±3.61). These findings indicated that further
research on these genes may improve the understanding of their true
relevance for CML. In addition, the ‘inner circle’ can be increased
to include more genes with less significance for future
analysis.
Discussion
Besides BCR-ABL mutations, many other genes have
been associated with CML (8–14).
However, due to the inaccuracies introduced during subject
recruitment, data collection and processing, these findings require
further validation. In the present study, literature-based CML-gene
relation data and gene expression data, together with enrichment
analysis and GGI analysis were employed to study pathogenic
interactions between 579 target genes and CML. Four metrics were
proposed and evaluated using a case/control classification
approach. The results demonstrated that most of the CML target
genes interacted with each other and served a role within numerous
CML-implicated pathways.
A total of 579 genes were collected and evaluated,
as these were supported by 1,739 references to demonstrate
association with CML (CML_GD→Ref for Disease-Gene Relation). Both
GSEA and SNEA were conducted to analyze the functional roles of
these genes in the pathogenesis of CML. The GSEA results
demonstrated that 485 out of 579 genes were significantly enriched
in 145 pathways (P<8.2×10⁻¹¹; q=0.005). Many of these
pathways have been previously implicated in CML (CML_GD→Related
Pathways), including three nervous system, three immune system and
two ageing-related pathways (28–36).
Furthermore, GGI analysis revealed that most CML candidate genes
exhibited a strong functional association with each other. Notably,
>70% of the 579 genes were also associated with many other
diseases, including acute myeloid leukemia, myelodysplastic
syndrome and lymphoma (CML_GD→Related Diseases), which are linked
to CML (37–39).
In the present study, four metrics were proposed to
select target genes relevant for CML. RScore was used to identify
genes that have been frequently reported to be associated with CML,
PScore was used to find genes linked to CML-related pathways,
SScore was used to discover genes with a strong functional
association with other CML candidate genes and AScore was used to
identify newly discovered CML genes.
The results from the case/control classification
approach demonstrated the effectiveness of the proposed metrics. In
particular, genes selected by the four metric scores led to
effective CML case/control prediction (CRs >94%; P<0.029),
whereas non-effective predication accuracy (P=0.215) was achieved
when all the target genes were included in the dataset (GSE13159;
549 out of 579 genes). These results suggested the necessity of
using node (gene) metrics for further analysis of the CML candidate
genes.
Cross-network metrics analysis revealed nine top CML
candidate target genes, including EGFR, TP53, CTNNB1, JAK2, TNF,
ABL1, VEGFA, BCL2 and SRC. These genes have been reported by
numerous independent studies for their association with CML
(RScore=22.22±11.76) (7–14), have a role within CML candidate
pathways (PScore=38.67±3.74) and display strong functional linkage
with other CML candidate genes (SScore=2.54±0.16). Therefore, the
results demonstrated that these genes may be associated with a
higher probability of developing CML.
Although this study evaluated 579 known CML
candidate genes acquired from CML-gene relation data, the proposed
PScore and SScore can be used to evaluate any gene included in the
CML pathways. In addition, more/novel genes can be evaluated
following the same approach. Further metrics may also be tested for
the evaluation of CML target genes. Lastly, the results presented
in this study are computational rather than experimental;
therefore, biological experiments are required to test the
functional mechanism of these significant CML genes.
In conclusion, to the best of our knowledge, this
study has demonstrated for the first time integration of
large-scale literature-based relation data and gene expression
data, together with enrichment analysis and GGI analysis to
evaluate 579 genes for their association with CML. The proposed
computational approach utilized a weighted network that may help
identification of significant or novel CML target genes for future
research.
Acknowledgements
Not applicable.
Funding
The present study was supported by the Program for
the National Natural Sciences Foundation of China (grant no.
81500162), the Shanghai Three-Year Plan of the Key Subjects
Construction (grant nos. 15GWZK0102 and 16CR1034B).
Availability of data and materials
All data generated or analyzed during this study are
included in this published article.
Authors' contributions
YZ, YW, HC and XZ contributed to the study design
and the writing of the manuscript; YZ and HC made substantial
contributions to data analysis. YW and QC made substantial
contributions to the concept and design of the present study. All
authors read and approved the final manuscript.
Ethics approval and consent to
participate
Not applicable.
Consent for publication
Not applicable.
Competing interests
The authors declare that they have no competing
interests.
References
|
1
|
Garcia-Manero G, Faderl S, O'Brien S,
Cortes J, Talpaz M and Kantarjian HM: Chronic myelogenous leukemia:
A review and update of therapeutic strategies. Cancer. 98:437–57.
2003. View Article : Google Scholar : PubMed/NCBI
|
|
2
|
Kantarjian HM, Giles FJ, O'Brien SM and
Talpaz M: Clinical course and therapy of chronic myelogenous
leukemia with interferon-alpha and chemotherapy. Hematol Oncol Clin
North Am. 12:31–80. 1998. View Article : Google Scholar : PubMed/NCBI
|
|
3
|
Nowell PC: Discovery of the Philadelphia
chromosome: A personal perspective. J Clin Invest. 117:2033–2035.
2007. View
Article : Google Scholar : PubMed/NCBI
|
|
4
|
De Bono JS and Ashworth A: Translating
cancer research into targeted therapeutics. Nature. 467:543–549.
2010. View Article : Google Scholar : PubMed/NCBI
|
|
5
|
Yogalingam G and Pendergast AM: Abl
kinases regulate autophagy by promoting the trafficking and
function of lysosomal components. J Biol Chem. 283:35941–35953.
2008. View Article : Google Scholar : PubMed/NCBI
|
|
6
|
Daniel L, Ahmed CM, Bloodgood RS, Kidd JR,
Castiglione CM, Duttagupta S and Lebowitz P: Polymorphism of the
human c-abl gene: Relation to incidence and course of chronic
myelogenous leukemia. Oncogene. 1:193–200. 1987.PubMed/NCBI
|
|
7
|
Anand M, Chodda SK, Parikh PM and Nadkarni
JS: Abnormal levels of proinflammatory cytokines in serum and
monocyte cultures from patients with chronic myeloid leukemia in
different stages, and their role in prognosis. Hematol Oncol.
16:143–154. 1998. View Article : Google Scholar : PubMed/NCBI
|
|
8
|
Singer MK, Assem M, Abdel Ghaffar AB and
Morcos NY: Cytokine profiling as a prognostic markers in chronic
myeloid leukemia patients. Egyp J Immunol. 18:37–46. 2011.
|
|
9
|
Li L, Xu N, Zhang JF, Xu LL, Zhou X, Huang
BT, Li YL and Liu XL: Ephb4/ephrinb2 contributes to imatinib
resistance in chronic myeloid leukemia involved in cytoskeletal
proteins. Int J Med Sci. 13:365–373. 2016. View Article : Google Scholar : PubMed/NCBI
|
|
10
|
Tefferi A, Thiele J, Vannucchi AM and
Barbui T: An overview on CALR and CSF3R mutations and a proposal
for revision of WHO diagnostic criteria for myeloproliferative
neoplasms. Leukemia. 28:1407–1413. 2014. View Article : Google Scholar : PubMed/NCBI
|
|
11
|
Perez CA, Velez M, Raez LE and Santos ES:
Overcoming the resistance to crizotinib in patients with non-small
cell lung cancer harboring EML4/ALK translocation. Lung Cancer.
84:110–115. 2014. View Article : Google Scholar : PubMed/NCBI
|
|
12
|
McCubrey JA, Steelman LS, Bertrand FE,
Davis NM, Abrams SL, Montalto G, D'Assoro AB, Libra M, Nicoletti F,
Maestro R, et al: Multifaceted roles of GSK-3 and Wnt/β-catenin in
hematopoiesis and leukemogenesis: Opportunities for therapeutic
intervention. Leukemia. 28:15–33. 2014. View Article : Google Scholar : PubMed/NCBI
|
|
13
|
Ouerhani S, Gharbi H, Menif S, Safra I,
Douzi K and Abbes S: KIT mutation detection in Tunisian patients
with newly diagnosed myelogenous leukemia: Prevalence and
prognostic significance. Cancer Genet. 205:436–41. 2012. View Article : Google Scholar : PubMed/NCBI
|
|
14
|
Hoermann G, Greiner G and Valent P:
Cytokine regulation of microenvironmental cells in
myeloproliferative neoplasms. Mediators Inflamm. 2015:8692422015.
View Article : Google Scholar : PubMed/NCBI
|
|
15
|
Nikitin A, Egorov S, Daraselia N and Mazo
I: Pathway studio-the analysis and navigation of molecular
networks. Bioinformatics. 19:2155–2157. 2003. View Article : Google Scholar : PubMed/NCBI
|
|
16
|
Abdelmoez A, Coraça-Huber DC, Thurner GC,
Debbage P, Lukas P, Skvortsov S and Skvortsova II: Screening and
identification of molecular targets for cancer therapy. Cancer
Lett. 387:3–9. 2017. View Article : Google Scholar : PubMed/NCBI
|
|
17
|
Li J, Sheng N, Cui R, Feng Y, Shao B, Guo
X, Zhang H and Dai J: Gestational and lactational exposure to
bisphenol AF in maternal rats increases testosterone levels in
23-day-old male offspring. Chemosphere. 163:552–561. 2016.
View Article : Google Scholar : PubMed/NCBI
|
|
18
|
Cao H, Duan J, Lin D, Shugart YY, Calhoun
V and Wang YP: Sparse representation based biomarker selection for
schizophrenia with integrated analysis of fMRI and SNPs. Neuroimage
102 Pt. 1:220–228. 2014. View Article : Google Scholar
|
|
19
|
Daraselia N, Yuryev A, Egorov S,
Novichkova S, Nikitin A and Mazo I: Extracting human protein
interactions from MEDLINE using a full-sentence parser.
Bioinformatics. 20:604–611. 2004. View Article : Google Scholar : PubMed/NCBI
|
|
20
|
Lorenzi PL, Claerhout S, Mills GB and
Weinstein JN: A curated census of autophagy-modulating proteins and
small molecules: Candidate targets for cancer therapy. Autophagy.
10:1316–1326. 2014. View Article : Google Scholar : PubMed/NCBI
|
|
21
|
Sivachenko AY, Yuryev A, Daraselia N and
Mazo I: Molecular networks in microarray analysis. J Bioinform
Comput Biol. 5:429–456. 2007. View Article : Google Scholar : PubMed/NCBI
|
|
22
|
Benjamini Y and Hochberg Y: Controlling
the false discovery rate: A practical and powerful approach to
multiple testing. J Royal Statistical Society, Series B
(Methodological). 57:289–300. 1995.
|
|
23
|
Opsahl T, Agneessens F and Skvoretz J:
Node centrality in weighted networks: Generalizing degree and
shortest paths. Social Networks. 32:245–251. 2010. View Article : Google Scholar
|
|
24
|
Freeman LC: Centrality in social networks:
Conceptual clarification. Social Networks. 1:215–239. 1978.
View Article : Google Scholar
|
|
25
|
Yang S and Knoke D: Optimal connections:
Strength and distance in valued graphs. Social Networks.
23:285–295. 2001. View Article : Google Scholar
|
|
26
|
Wang J, Cao H, Liao Y, Liu W, Tan L, Tang
Y, Chen J, Xu X, Li H, Luo C, et al: Three dysconnectivity patterns
in treatment-resistant schizophrenia patients and their unaffected
siblings. Neuroimage Clin. 8:95–103. 2015. View Article : Google Scholar : PubMed/NCBI
|
|
27
|
Hehlmann R, Hochhaus A and Baccarani M:
European Leukemia Net: Chronic myeloid leukaemia. Lancet.
370:342–350. 2007. View Article : Google Scholar : PubMed/NCBI
|
|
28
|
Gong IY and Kim RB: Impact of genetic
variation in OATP transporters to drug disposition and response.
Drug Metab Pharmacokinet. 28:4–18. 2013. View Article : Google Scholar : PubMed/NCBI
|
|
29
|
Sawyers CL, McLaughlin J and Witte ON:
Genetic requirement for Ras in the transformation of fibroblasts
and hematopoietic cells by the Bcr-Abl oncogene. J Exp Med.
181:307–313. 1995. View Article : Google Scholar : PubMed/NCBI
|
|
30
|
Rahmani M, Nguyen TK, Dent P and Grant S:
The multikinase inhibitor sorafenib induces apoptosis in highly
imatinib mesylate-resistant BCR/ABL+ human leukemia cells in
association with STAT5 inhibition and MCL-1 down-regulation. Mol
Pharmacol. 72:788–795. 2007. View Article : Google Scholar : PubMed/NCBI
|
|
31
|
Bi S, Barton CM, Lemoine NR, Cross NC and
Goldman JM: Retroviral transduction of Philadelphia-positive
chronic myeloid leukemia cells with a human mutant p53 cDNA and its
effect on in vitro proliferation. Exp Hematol. 22:95–99.
1994.PubMed/NCBI
|
|
32
|
Clark RE: Immunotherapeutic strategies in
chronic myeloid leukemia. Curr Hematol Malig Rep. 2:89–94. 2007.
View Article : Google Scholar : PubMed/NCBI
|
|
33
|
Pendergast AM, Gishizky ML, Havlik MH and
Witte ON: SH1 domain autophosphorylation of P210 BCR/ABL is
required for transformation but not growth factor independence. Mol
Cell Biol. 13:1728–1736. 1993. View Article : Google Scholar : PubMed/NCBI
|
|
34
|
Lugo TG, Pendergast AM, Muller AJ and
Witte ON: Tyrosine kinase activity and transformation potency of
bcr-abl oncogene products. Science. 247:1079–1082. 1990. View Article : Google Scholar : PubMed/NCBI
|
|
35
|
Waight JD, Banik D, Griffiths EA, Nemeth
MJ and Abrams SI: Regulation of the interferon regulatory factor-8
(IRF-8) tumor suppressor gene by the signal transducer and
activator of transcription 5 (STAT5) transcription factor in
chronic myeloid leukemia. J Biol Chem. 289:15642–15652. 2014.
View Article : Google Scholar : PubMed/NCBI
|
|
36
|
Rossi DJ, Jamieson CH and Weissman IL:
Stems cells and the pathways to aging and cancer. Cell.
132:681–696. 2008. View Article : Google Scholar : PubMed/NCBI
|
|
37
|
Pawarode A, Sait SN, Nganga A, Coignet LJ,
Barcos M and Baer MR: Acute myeloid leukemia developing during
imatinib mesylate therapy for chronic myeloid leukemia in the
absence of new cytogenetic abnormalities. Leuk Res. 31:1589–1592.
2007. View Article : Google Scholar : PubMed/NCBI
|
|
38
|
Kovitz C, Kantarjian H, Garcia-Manero G,
Abruzzo LV and Cortes J: Myelodysplastic syndromes and acute
leukemia developing after imatinib mesylate therapy for chronic
myeloid leukemia. Blood. 108:2811–2813. 2006. View Article : Google Scholar : PubMed/NCBI
|
|
39
|
Găman AM, Dobrea C and Rotaru I: A case of
non-Hodgkin lymphoma in a patient with chronic myeloid leukemia.
Rom J Morphol Embryol. 54:1141–1145. 2013.PubMed/NCBI
|