Introduction
Gastric cancer has become an important health risk,
as it is the fourth most common cancer after breast, lung and
ovarian cancer and the second leading cause of cancer mortality
worldwide (1). It is estimated
that ~934,000 novel cases are diagnosed and that there are ~700,000
mortalities annually (2). In
China, there are >220,000 mortalities due to gastric cancer
annually, which is approximately one-half of the global gastric
cancer mortalities (3).
Gastric cancer has been subdivided into two primary
subtypes based on histological appearance, including the
well-differentiated intestinal type and the poorly differentiated
diffuse type (4). Gastric cancer
has a poor prognosis, as the 5-year survival for patients with
gastric cancer in China is only 30% (5). However, the majority of gastric
cancer cases are diagnosed in the middle to late stage (6). Therefore, the development of methods
for timely diagnosis and effective symptomatic treatment of gastric
cancer is urgent. Therefore, the present study investigated the
potential biomarkers of gastric cancer using bioinformatics tools
and aimed to provide guidance on the diagnosis and treatment of
gastric cancer.
Bioinformatics tools, techniques and resources are
critical to biomarker discovery, assessment, validation,
qualification, standardization and market acceptance into clinical
practice. Major scientific efforts and economic investment over the
past 20 years have resulted in thousands of novel candidate
biomarkers for diseases; however, relatively few biomarkers have
been used in clinical practice (7).
The present study used a high-throughput
bioinformatics platform to analyze microarray data and identify
differentially expressed genes (DEGs) for further investigation.
The current study used the microarray dataset GSE54129, which was
downloaded from Gene Expression Omnibus (GEO; www.ncbi.nlm.nih.gov/geo/), containing 111 human
gastric cancer tissues and 21 non-cancerous gastric tissues. The
present study used R software to obtain the expression profiles and
DEGs. Gene enrichment analysis and network analysis were also used
to provide interpretation of high-throughput results. To confirm
whether the hub genes associated with poor prognosis were involved
in the pathogenesis of gastric cancer, gastric cancer and
para-carcinoma tissues from 12 patients were subjected to reverse
transcription-quantitative polymerase chain reaction (RT-qPCR)
analysis. The present study identified potential biomarkers for
further research.
Materials and methods
Patients and ethics statement
The use of human gastric cancer specimens and the
database was approved by the institutional review board of the
Hospital of Qingdao University (Qingdao, China). Human tissues used
in this study were obtained from patients with gastric cancer
(recruited between September 2014 and September 2016; mean age,
62.5 years; range, 54 to 72 years; male, 58.3%, female 41.7%)
following resection at the Hospital of Qingdao University. All
patients received standard adjuvant radiotherapy following surgery.
Written informed consent was obtained from all patients.
RNA isolation and RT-qPCR
analysis
Total RNA was isolated from cells using TRIzol
reagent (cat. no. 15596026; Invitrogen; Thermo Fisher Scientific,
Inc., Waltham, MA, USA). A total of 4 µg RNA was reverse
transcribed into cDNA using the RevertAid First Strand cDNA
Synthesis kit (cat. no. 1622; Fermentas; Thermo Fisher Scientific,
Inc.). qPCR was performed using the Power SYBR Green PCR Master Mix
(cat. no. 4367659; Applied Biosystems; Thermo Fisher Scientific,
Inc.) on a 7500 system (Applied Biosystems; Thermo Fisher
Scientific, Inc.). The following primers were used to perform qPCR:
Adenylate cyclase 3 (ADCY3), 5′-TCTCCGAGCCCGAATACT-3′ (forward) and
5′-GTTCCGGACCGAGATTTCAT-3′ (reverse); lysophosphatidic acid
receptor 2 (LPAR2), 5′-TGACTGGAGGCCCAGAT-3′ (forward) and
5′-GCTCTTTGCCACTGTTG-3′ (reverse); sphingosine-1-phosphate receptor
1 (S1PR1), 5′-GCTCTCCGAACGCAACTT-3′ (forward) and
5′-CGATGAGTGATCCAGGC-3′ (reverse); tetraspanin 4 (TSPAN4),
5′-CGTCAAGTACCTCATGTTC-3′ (forward) and 5′-ACGGGAAGGAAGAGGAC-3′
(reverse); and GAPDH (reference gene) 5′-TCTCTCCGTCCTCGGAT-3′
(forward) and 5′-CGTAGTTGTGCTGATG-3′ (reverse). The thermocycling
conditions were as follows: Pre-denaturation at 94°C for 5 min; 40
cycles of denaturation at 94°C for 30 sec, annealing at 60°C for 20
sec and extension at 72°C for 20 sec; and a final extension at 72°C
for 10 min. All RT-qPCR reactions yielded products with a single
dissociation peak. Results were analyzed using the
2−ΔΔCq method (8).
5-bromo-2-deoxyuridine (BrdU)
assay
To perform the BrdU assay, cells were grown in
96-well plates (1×10⁴ cells/well) (Sigma-Aldrich; Merck
KGaA, Darmstadt, Germany; cat. no. CLS3595-50EA). After 18 h, BrdU
(10 µg/ml; Sigma-Aldrich; Merck KGaA) was added to each well. A
total of 3 h subsequently, the culture media were discarded, and
BrdU incorporation was measured using a Cell Proliferation ELISA
kit (cat. no. 11647229001; Roche Diagnostics, Basel, Switzerland),
according to the manufacturer's protocol. Absorbance was normalized
to the cell number.
Transfection
Transfection with plasmids and short hairpin (sh)RNA
experiments were performed according to protocols provided by
Invitrogen (Thermo Fisher Scientific, Inc.). DNA oligonucleotides
carrying shRNA were constructed into the pLKO.1 plasmid (Addgene,
Inc., Cambridge, MA, USA). Packaging plasmid psPAX2 (4 µg/ml) and 4
µg envelope plasmid pMD2.G (both from Addgene, Inc.) were
co-transfected into 293 cells (American Type Culture Collection,
Manassas, VA, USA) achieving 80% density with 4 µg recombinant
plasmids using Lipofectamine® 3000 (Thermo Fisher
Scientific, Inc.). The 293 cells were grown in DMEM (Gibco; Thermo
Fisher Scientific, Inc.) supplemented with 10% fetal bovine serum
(FBS; Gibco; Thermo Fisher Scientific, Inc.), streptomycin (100
ug/ml), and penicillin (100 U/ml) and incubated at 37°C with 5%
CO2 in a humidified atmosphere. The supernatant
containing lentivirus particles was collected after 48 h. Target
cells were infected 3 times with medium containing lentivirus
(108 TU/ml) for 6 h, and recovered in normal growth
medium for 24 h before next infection. The purchased shRNA target
oligos were as follows: TSPAN4 shRNA#1,
5′-CTGAGCACCGCCTGGTCTCTT-3′; TSPAN4 shRNA#2,
5′-GCCTTTGTCATGGCCATCGGC-3′; TSPAN4 shRNA#3,
5′-GGTGGCCACGTGCTGGCTGCG-3′; and control shRNA (non-targeting),
5′-AACTGGACTTCCAGAAGAACA-3′.
Microarray data
The microarray dataset, GSE54129, was downloaded
from the GEO database. It was based on the Affymetrix GPL570
platform (Affymetrix Human Genome U133 Plus 2.0 Array). This
expression profile contained 132 samples; 111 human gastric cancer
samples and 21 non-cancerous gastric samples were analyzed by
high-density oligonucleotide microarray.
DEG identification
The expression profiles GSE54129 contained 132 CEL
files, and in order to obtain the expression data the present study
used the Affy package version 1.52.0 in R (version 3.3.1) (9) and the ‘rma’ method to perform the
background correction, normalization and expression calculations.
Subsequently, the limma package version 3.0.1 (10) was used obtain the DEGs, with the
Benjamini-Hochberg adjustment method to identify DEGs with
log2|fold-change (FC)| >1 and adjusted P-value
cut-off <0.05 as statistically significant candidate genes. When
the DEGs were obtained, the gplot package version 3.3.2 (11) was used to draw a heatmap that
revealed the regulation of the top 100 DEGs (50 upregulated and 50
downregulated), and a volcano plot for the distribution of the DEGs
in this dataset.
Kyoto Encyclopedia of Genes and
Genomes (KEGG) and Gene Ontology (GO) analysis
The KEGG database (www.kegg.jp) may
provide functional meanings to genes and genomes at the molecular
and higher levels (12). GO
(www.geneontology.org) is a
community-based bioinformatics resource that supplies information
about gene product functions using ontologies to represent
biological knowledge. The GO database may be used to identify the
molecular function, cellular component and biological process of
input gene sets (13). The present
study placed all DEGs in the online analysis tool Database for
Annotation, Visualization and Integrated Discovery (DAVID) to
obtain the relevant biological annotation. DAVID integrates a
variety of online gene annotation tools, which facilitate the
comprehensive analysis of gene function (14).
Disease module search
After the DEGs were obtained from the gene
expression profiles, the interactions between DEGs were determined
using the Search Tool for the Retrieval of Interacting Genes
(STRING) database. The STRING database contains information on
>5,200,000 proteins from >2,000 organisms. It provides
assessment and integration of protein-protein interactions,
including direct (physical) and indirect (functional) associations
(15). All DEGs were mapped to
STRING and only interactions with a high interaction score >0.9
were selected. The DEG network was constructed using Cytoscape
software (version 3.2.1; http://www.cytoscape.org/), disease modules were
extracted from the whole DEG network using the MCODE application in
Cytoscape, with the following criteria: MCODE score >10 and each
node >3 degrees.
Survival analysis
Kaplan Meier plots (KMplots) are capable of
assessing the effect of 54,675 genes on survival using 10,293
cancer samples. These include 5,143 breast, 1,648 ovarian, 2,437
lung and 1,065 gastric cancer patients with a mean follow-up period
of 69, 40, 49, and 33 months, respectively. The primary purpose of
the tool is a meta-analysis based biomarker assessment (16). The top 10 hub genes of the disease
module were placed in the KMplot database to examine the
association between alterations in their gene expression levels and
the 5-year survival rate of a patient.
Tumor xenografts
All animal experiments were approved by Qingdao
University (Qingdao, China) and performed in accordance with the
Institutional Animal Care and Use Committee guidelines. All
experiments were performed with female FOX CHASE severe combined
immunodeficient (SCID) mice (purchased from Model Animal Research
Center of Nanjing University). SCID mice were used for experiments
when 6 weeks old. The weight of the mice was 18–20 g and there were
5 mice in both the control and the test group. The mice were housed
at 22±2°C with a relative humidity of ~50–80%, a working
illumination of 50~300 lx, 12-h light/dark cycle, ventilation
frequency of ~16 −20 times/h with an airflow speed, <0.18 m/sec
and an ammonia concentration, <20 ppm. NCI-N87 or SGC-7901 (both
American Type Culture Collection, Manassas, VA, USA) cells with
stably downregulated TSPAN4 or control cells were subcutaneously
injected into mice. When the tumor diameter in the right flank of
mice reached 5 mm, mice were sacrificed using an injection of
pentobarbital and tumor tissue was collected.
Statistical analysis
Statistical analyses were calculated in GraphPad
Prism 5 (GraphPad Software, Inc., La Jolla, CA, USA) using the test
appropriate for each comparison. Data are presented as the mean ±
standard deviation for continuous data. One-way analysis of
variance or multivariate analysis of variance was used and
Dunnett's test was used for pairwise comparisons of multiple
treatment groups. All experimental groups were compared with the
control groups. P<0.05 was considered to indicate a
statistically significant difference.
Results
DEG identification
The dataset GSE54129 used in the present study
contains 132 samples: 21 normal tissues samples and 111 tumor
tissue samples. Each sample set was read and analyzed using the
Affy and limma packages in R software. Following preprocessing,
results for the whole dataset were obtained using the ‘rma’ method
in the Affy package, with P<0.05 and fold control
(log2|FC|) >1 as thresholds to screen out
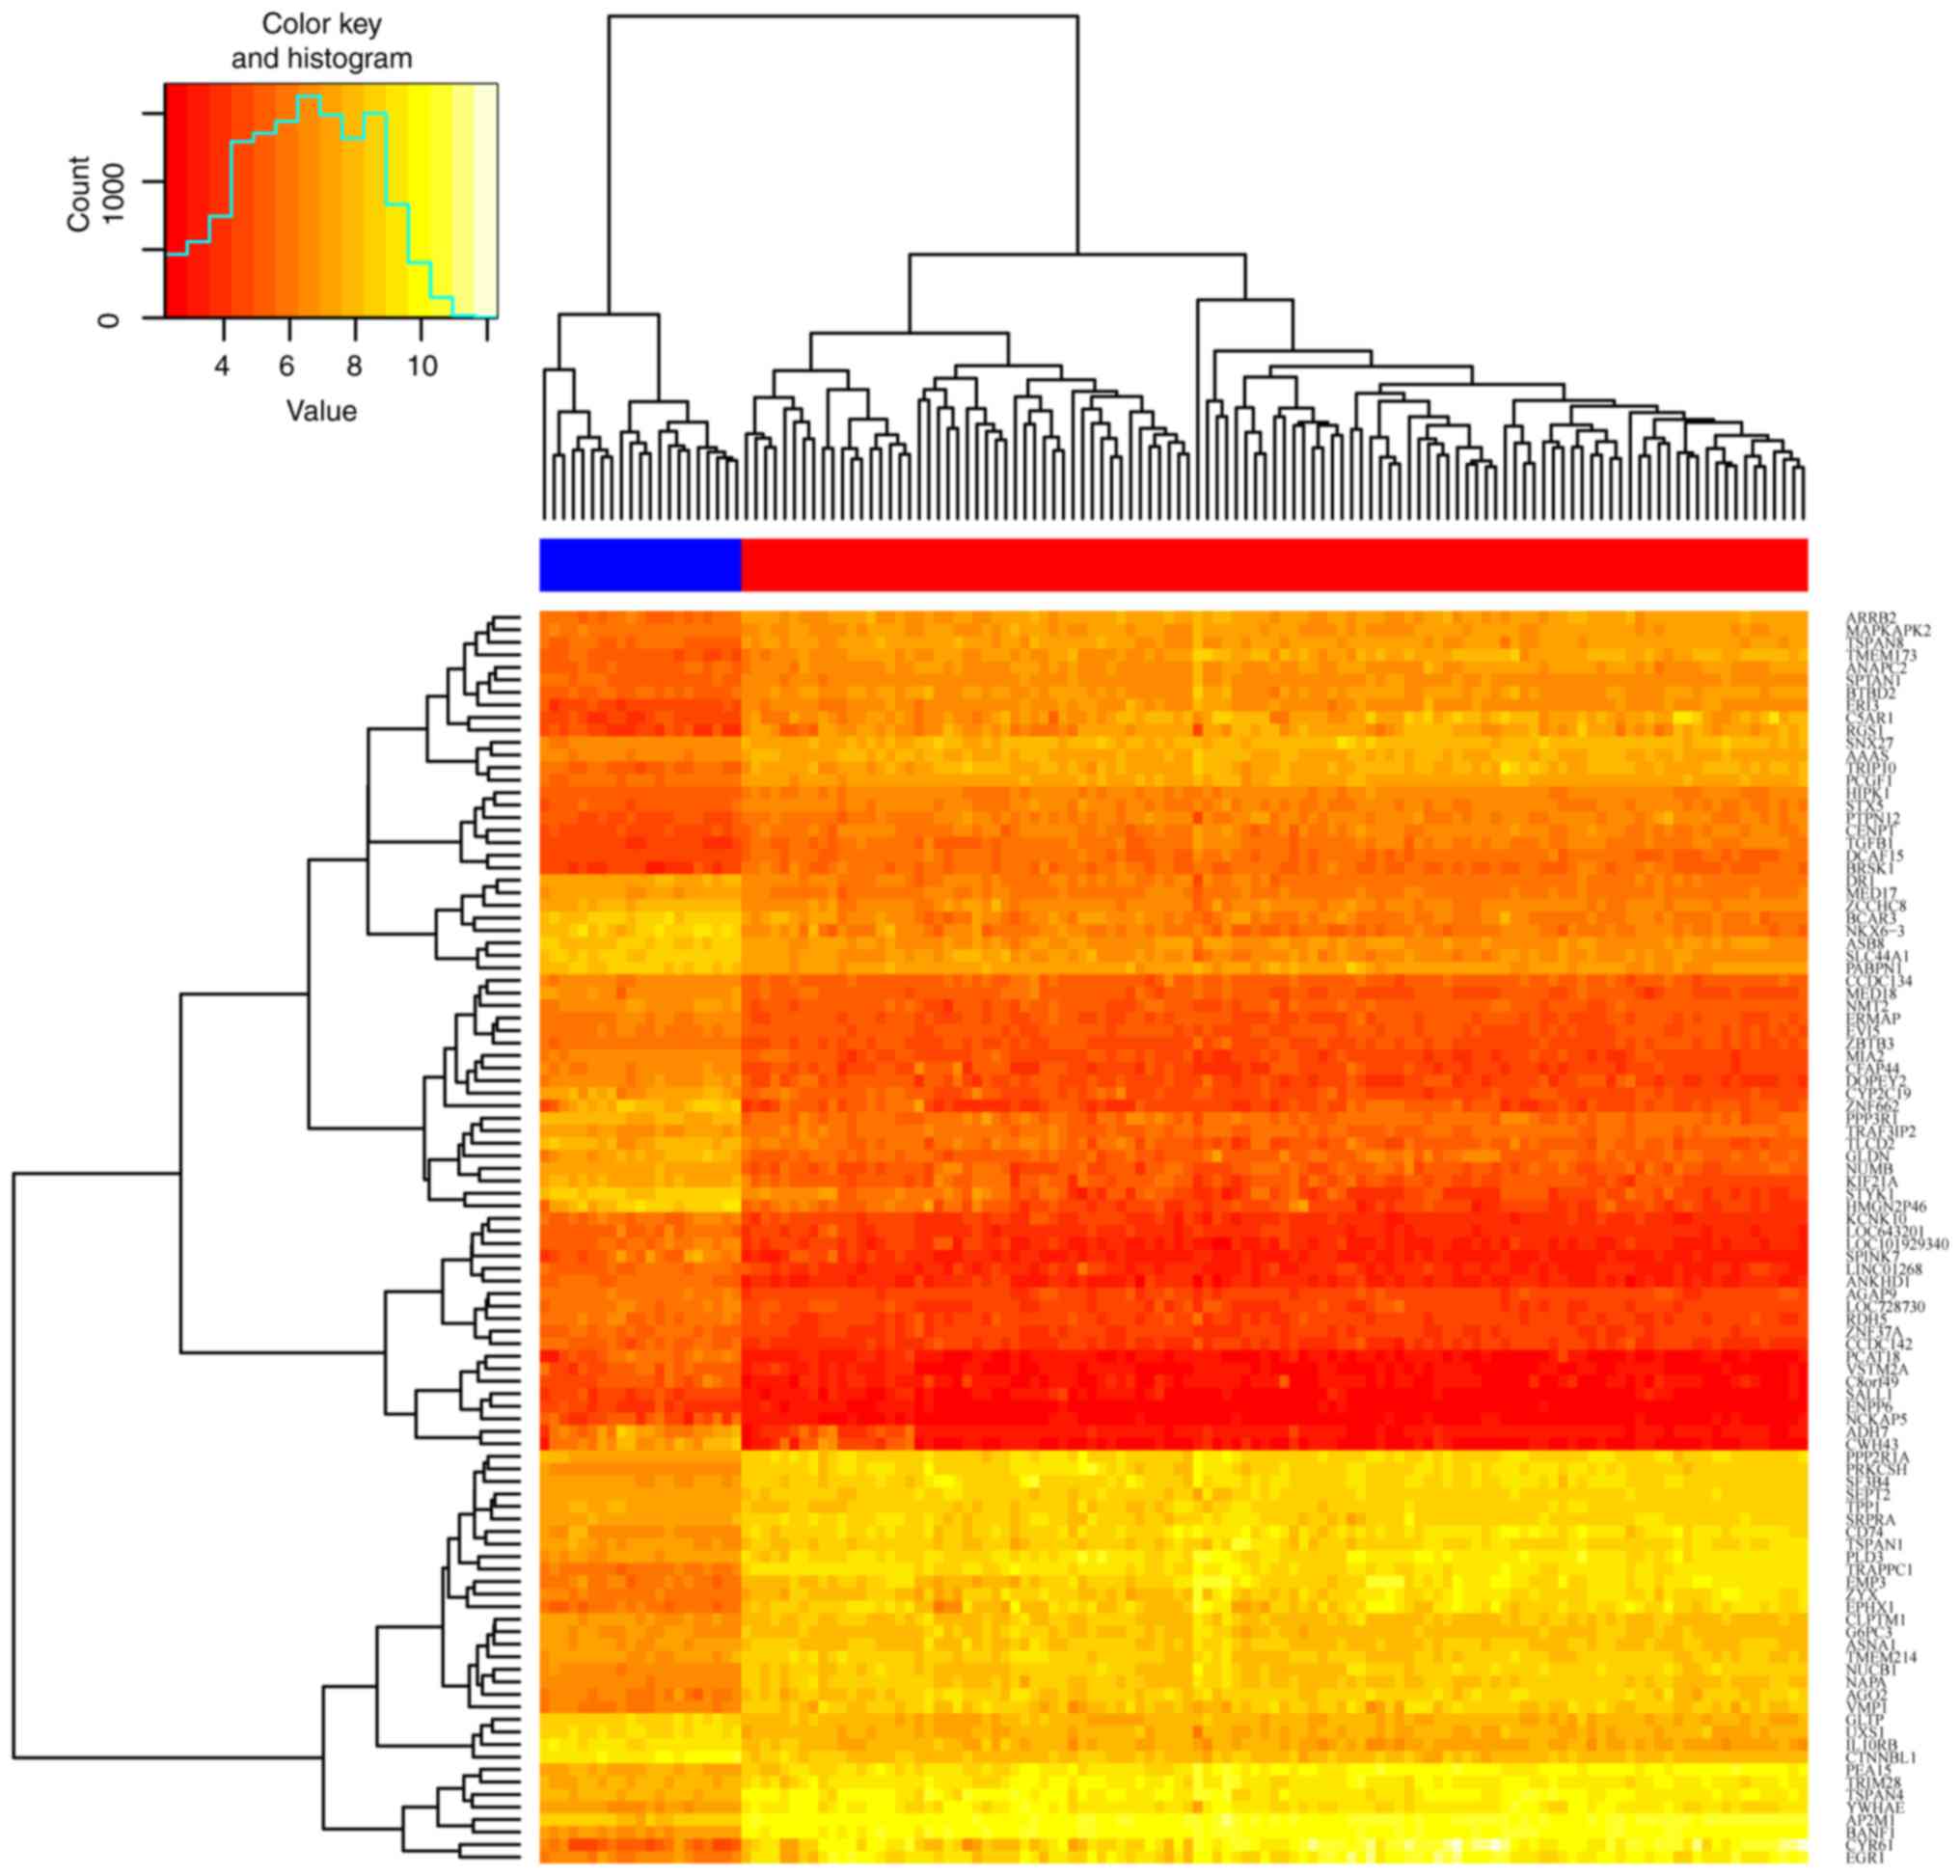
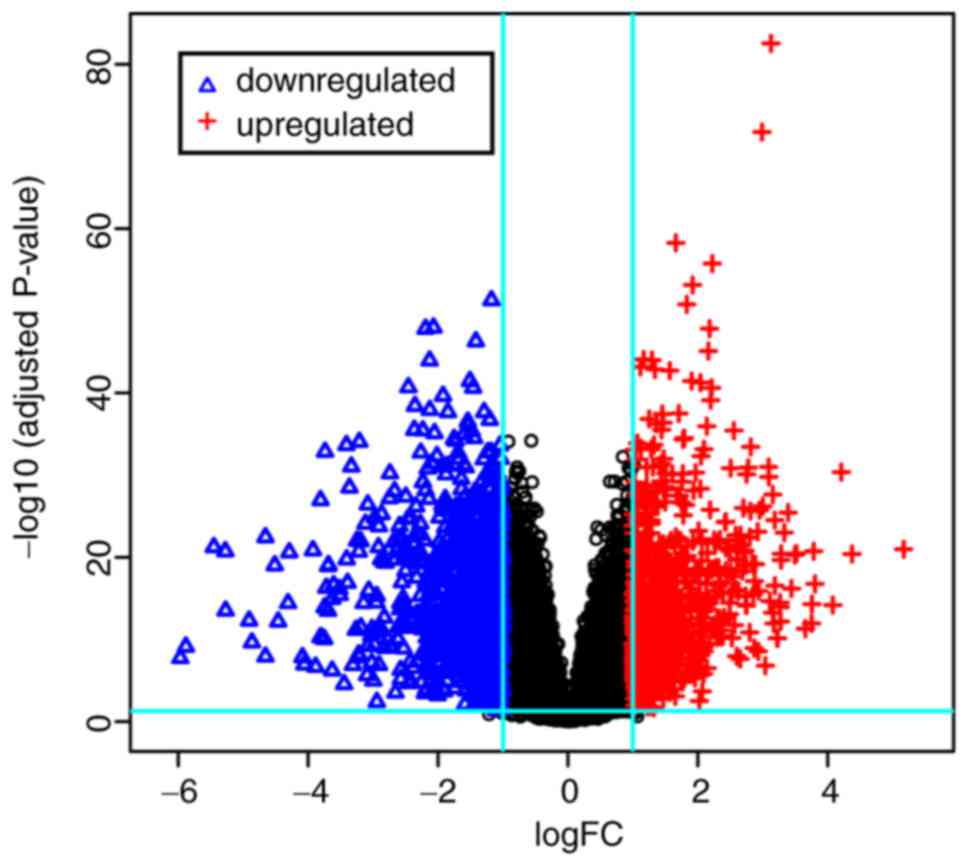
satisfactory DEGs from the expression matrix. A total of 1,829 DEGs
were identified, in which there were 838 upregulated genes and 991
downregulated genes. To obtain a brief overview of these DEGs, the
top 100 DEGs (50 up-regulated & 50 down-regulated) were
captured in a heatmap using the gplot package (Fig. 1), and a volcano plot to illustrate
the distributions of all DEGs (Fig.
2).
KEGG pathway analysis
KEGG pathway analysis and GO enrichment results were
obtained by uploading all DEGs to the online tool DAVID. The
results of the KEGG analysis (Table
I) illustrated the most significantly enriched pathways of DEGs
in gastric cancer (top five upregulated and top five
downregulated). The upregulated DEGs were significantly enriched in
‘ECM-receptor interaction’, ‘focal adhesion’, ‘PI3K-Akt signaling
pathway’, ‘staphylococcus aureus infection’ and ‘protein digestion
and absorption’, while the downregulated DEGs were significantly
enriched in ‘chemical carcinogenesis’, ‘metabolism of xeno-biotics
by cytochrome P450’, ‘peroxisome’, ‘fatty acid degradation’ and
‘gastric acid secretion’.
 | Table I.Kyoto Encyclopedia of Genes and
Genomes pathway analysis of differentially expressed genes
associated with gastric cancer. |
Table I.
Kyoto Encyclopedia of Genes and
Genomes pathway analysis of differentially expressed genes
associated with gastric cancer.
| A, Upregulated |
|---|
|
|---|
| Pathway ID | Name | Count | P-value | Genes |
|---|
| hsa04512 | ECM-receptor
interaction | 26 |
2.17×10⁻¹² | TNC, COL3A1, COMP,
COL6A3, THBS2, COL6A2, COL6A1, LAMC1, THBS1, COL11A1, SPP1, FN1,
THBS4, COL4A2, COL4A1, HSPG2, ITGA1, ITGA4, COL5A3, ITGA7, COL5A2,
COL5A1, LAMA4, ITGA5, COL1A2, COL1A1 |
| hsa04510 | Focal adhesion | 40 | 3.37×10⁻¹² | TNC, COL3A1, MYL9,
RAC2, COMP, ILK, COL6A3, ZYX, COL6A2, COL6A1, THBS4, THBS1,
COL11A1, THBS2, PIK3R1, SPP1, FN1, IGF1, COL4A2, COL4A1, ITGA1,
ACTN1, ITGA4, FLNC, COL5A3, PARVB, COL5A2, COL5A1, FLNA, KDR,
VEGFC, LAMA4, FYN, ITGA5, ITGA7, COL1A2, PDGFRB, COL1A1, LAMC1,
MYLK |
| hsa04151 | PI3K-Akt signaling
pathway | 49 |
2.87×10⁻¹² | HSP90AB1, OSMR,
FGF10, TLR4, CSF3R, PIK3AP1, MYC, ANGPT2, COL11A1, PPP2R1A, TP53,
VEGFC, COL1A2, PDGFRB, GNB4, COL1A1, LAMC1, MCL1, TNC, COL3A1,
BCL2L1, IL7R, G6PC3, COMP, COL6A3, SPP1, COL6A2, COL6A1, IL2RG,
THBS1, THBS2, PIK3R1, THBS4, FN1, CSF1R, IL6, COL4A2, IL2RA,
COL4A1, ITGA1, IGF1, ITGA4, COL5A3, YWHAE, KDR, COL5A2, COL5A1,
ITGA5, ITGA7 |
| hsa05150 | Staphylococcus
aureus infection | 17 | 1.35×10⁻⁸ | ICAM1, SELP, C3AR1,
C5AR1, C3, FPR3, C1R, ITGB2, C1S, HLA-DMB, C1QA, C1QB, FPR1, C1QC,
HLA-DQA1, HLA-DPA1, FCGR3B |
| hsa04974 | Protein digestion
and absorption | 21 | 3.16×10⁻⁸ | COL18A1, COL4A2,
COL4A1, COL21A1, COL3A1, ELN, COL15A1, ATP1A2, COL5A3, COL5A2,
COL5A1, SLC1A5, COL14A1, COL6A3, COL1A2, COL6A2, COL12A1, COL6A1,
COL1A1, COL11A1, COL10A1 |
|
| B,
Downregulated |
|
| Pathway
ID | Name | Count | P-value | Genes |
|
| hsa05204 | Chemical
carcinogenesis | 18 | 2.86×10⁻⁷ | CYP3A5, CYP2C19,
SULT2A1, CYP2C9, CYP2C18, NAT1, ADH1C, ADH1A, ADH7,
CYP3A7-CYP3A51P, MGST2, ALDH3A1, CBR1, SULT1A1, SULT1A2, GSTP1,
UGT2A3, UGT2B15 |
| hsa00980 | Metabolism of
xeno-biotics by cytochrome P450 | 16 | 2.72×10⁻⁶ | CYP3A5, SULT2A1,
CYP2C9, ADH1C, ADH1A, ADH7, ALDH3A1, AKR1C2, CBR1, AKR1C4, AKR7A3,
UGT2A3, UGT2B15, AKR1C1, GSTP1, MGST2 |
| hsa04146 | Peroxisome | 16 | 1.2×10⁻⁵ | XDH, ACOX1, NUDT12,
EHHADH, EPHX2, PRDX5, PHYH, PEX7, ACOX3, PEX11A, FAR1, PXMP2, IDH1,
ACSL3, SCP2, SLC27A2 |
| hsa00071 | Fatty acid
degradation | 11 | 4.57×10⁻⁵ | ACOX1, CPT2,
EHHADH, ADH1C, ALDH2, ADH1A, ADH7, HADH, ACSL3, ALDH3A2, ACOX3 |
| hsa04971 | Gastric acid
secretion | 11 | 3.2×10⁻³ | KCNJ16, KCNJ15,
PLCB3, PLCB4, ATP4A, ATP4B, KCNE2, GAST, CA2, SST, KCNK10 |
GO enrichment analysis
The results of the GO analysis (Table II) demonstrated that with respect
to biological processes (BP), upregulated DEGs were significantly
enriched in ‘extracellular matrix organization’, ‘cell adhesion’
and ‘inflammatory response’, while downregulated DEGs were
significantly enriched in ‘xenobiotic metabolic process’,
‘oxidation-reduction process’ and ‘steroid metabolic process’. With
respect to molecular function (MF), upregulated DEGs were
significantly enriched in ‘heparin binding’, ‘extracellular matrix
structural constituent’ and ‘integrin binding’, while downregulated
DEGs were significantly enriched in ‘oxidoreductase activity’,
‘NAD+ binding’ and ‘aldo-keto reductase (NADP) activity’. With
respect to cellular component, upregulated DEGs were significantly
enriched in ‘extracellular matrix’, ‘extracellular region’ and
‘proteinaceous extracellular matrix’, while downregulated DEGs were
significantly enriched in ‘extracellular exosome’, ‘peroxisomal
matrix’ and ‘apical plasma membrane’.
| Table II.GO analysis of differentially
expressed genes associated with gastric cancer. |
Table II.
GO analysis of differentially
expressed genes associated with gastric cancer.
| A, Upregulated
BP |
|---|
|
|---|
| GO term | Function | Count | P-value |
|---|
| GO:0030198 | Extracellular
matrix organization | 60 |
8.71×10⁻³³ |
| GO:0007155 | Cell adhesion | 84 |
2.77×10⁻²⁸ |
| GO:0006954 | Inflammatory
response | 71 |
4.15×10⁻²³ |
| GO:0030574 | Collagen catabolic
process | 27 |
7.35×10⁻¹⁹ |
| GO:0050900 | Leukocyte
migration | 44 |
4.32×10⁻¹⁶ |
|
| B, Upregulated
MF |
|
| GO term |
Function | Count | P-value |
|
| GO:0008201 | Heparin
binding | 40 |
5.50×10⁻¹⁹ |
| GO:0005201 | Extracellular
matrix structural constituent | 27 |
1.27×10⁻¹⁸ |
| GO:0005178 | Integrin
binding | 30 |
6.20×10⁻¹⁶ |
| GO:0005515 | Protein
binding | 466 | 3.03×10⁻¹⁰ |
| GO:0050840 | Extracellular
matrix binding | 12 |
4.26×10⁻⁹ |
|
| C, Upregulated
CC |
|
| GO term |
Function | Count | P-value |
|
| GO:0031012 | Extracellular
matrix | 88 |
2.87×10−48 |
| GO:0005576 | Extracellular
region | 186 |
1.45×10−36 |
| GO:0005578 | Proteinaceous
extracellular matrix | 71 |
2.96×10⁻³⁵ |
| GO:0005615 | Extracellular
space | 161 |
5.22×10⁻³³ |
| GO:0070062 | Extracellular
exosome | 225 |
1.94×10⁻²¹ |
|
| D, Downregulated
BP |
|
| GO term |
Function | Count | P-value |
|
| GO:0006805 | Xenobiotic
metabolic process | 24 |
5.27×10⁻¹³ |
| GO:0055114 | Oxidation-reduction
process | 67 |
3.82×10⁻¹¹ |
| GO:0008202 | Steroid metabolic
process | 16 |
4.19×10⁻¹⁰ |
| GO:0030855 | Epithelial cell
differentiation | 16 |
6.14×10⁻⁷ |
| GO:0007586 | Digestion | 15 |
9.10×10⁻⁷ |
|
| E, Downregulated
MF |
|
| GO term |
Function | Count | P-value |
|
| GO:0016491 | Oxidoreductase
activity | 26 |
7.08×10⁻⁶ |
| GO:0070403 | NAD+ binding | 6 |
2.06×10⁻⁴ |
| GO:0004033 | Aldo-keto reductase
(NADP) activity | 6 |
4.44×10⁻⁴ |
| GO:0004062 | Aryl
sulfotransferase activity | 5 |
1.7×10⁻³ |
| GO:0004022 | Alcohol
dehydrogenase (NAD) activity | 4 |
3.1×10⁻³ |
|
| F, Downregulated
CC |
|
| GO term |
Function | Count | P-value |
|
| GO:0070062 | Extracellular
exosome | 198 |
2.96×10⁻⁹ |
| GO:0005782 | Peroxisomal
matrix | 12 |
7.33×10⁻⁶ |
| GO:0016324 | Apical plasma
membrane | 32 |
2.21×10⁻⁵ |
| GO:0005789 | Endoplasmic
reticulum membrane | 69 |
2.47×10⁻⁵ |
| GO:0016021 | Integral component
of membrane | 295 |
9.53×10⁻⁵ |
Disease module search
To understand the interactions among the collected
DEGs, we the STRING database was used to obtain the protein-protein
interaction (PPI) information for each DEG. During this step, PPIs
with the highest interaction scores (confidence >0.9) were
selected. Using Cytoscape software to analyze the PPI information,
the degree of each node was ranked and the top 10 hub nodes with
higher degrees were obtained. These hub genes included tumor
protein P53 (TP53), C-X-C motif chemokine ligand 8 (CXCL8),
tetraspanin 4 (TSPAN4), lysophosphatidic acid receptor 2 (LPAR2),
adenylate cyclase 3 (ADCY3), phosphoinositide-3-kinase regulatory
subunit 1 (PIK3R1), neuromedin U (NMU), C-X-C motif chemokine
ligand 12 (CXCL12), fos proto-oncogene, AP-1 transcription factor
subunit (FOS) and sphingosine-1-phosphate receptor 1 (S1PR1). Among
these genes, TP53 had the highest node degree (degree=53; Table III). In addition, it was noted
that TSPAN4 appeared in the heat map of the top 100 DEGs, and a
further two tetraspanin family genes, TSPAN1 and TSPAN8, also
appeared in it. Tetraspanin family genes may be a highlight
biomarker of gastric cancer.
| Table III.Top 10 hub genes ranked by
degree. |
Table III.
Top 10 hub genes ranked by
degree.
| Gene symbol | Full name | Degree |
|---|
| TP53 | Tumor protein
P53 | 53 |
| CXCL8 | C-X-C motif
chemokine ligand 8 | 53 |
| TSPAN4 | Tetraspanin 4 | 51 |
| LPAR2 | Lysophosphatidic
acid receptor 2 | 50 |
| ADCY3 | Adenylate cyclase
3 | 49 |
| PIK3R1 |
Phosphoinositide-3-kinase regulatory
subunit 1 | 48 |
| NMU | Neuromedin U | 44 |
| CXCL12 | C-X-C motif
chemokine ligand 12 | 44 |
| FOS | Fos proto-oncogene,
AP-1 transcription factor subunit | 44 |
| S1PR1 |
Sphingosine-1-phosphate receptor 1 | 41 |
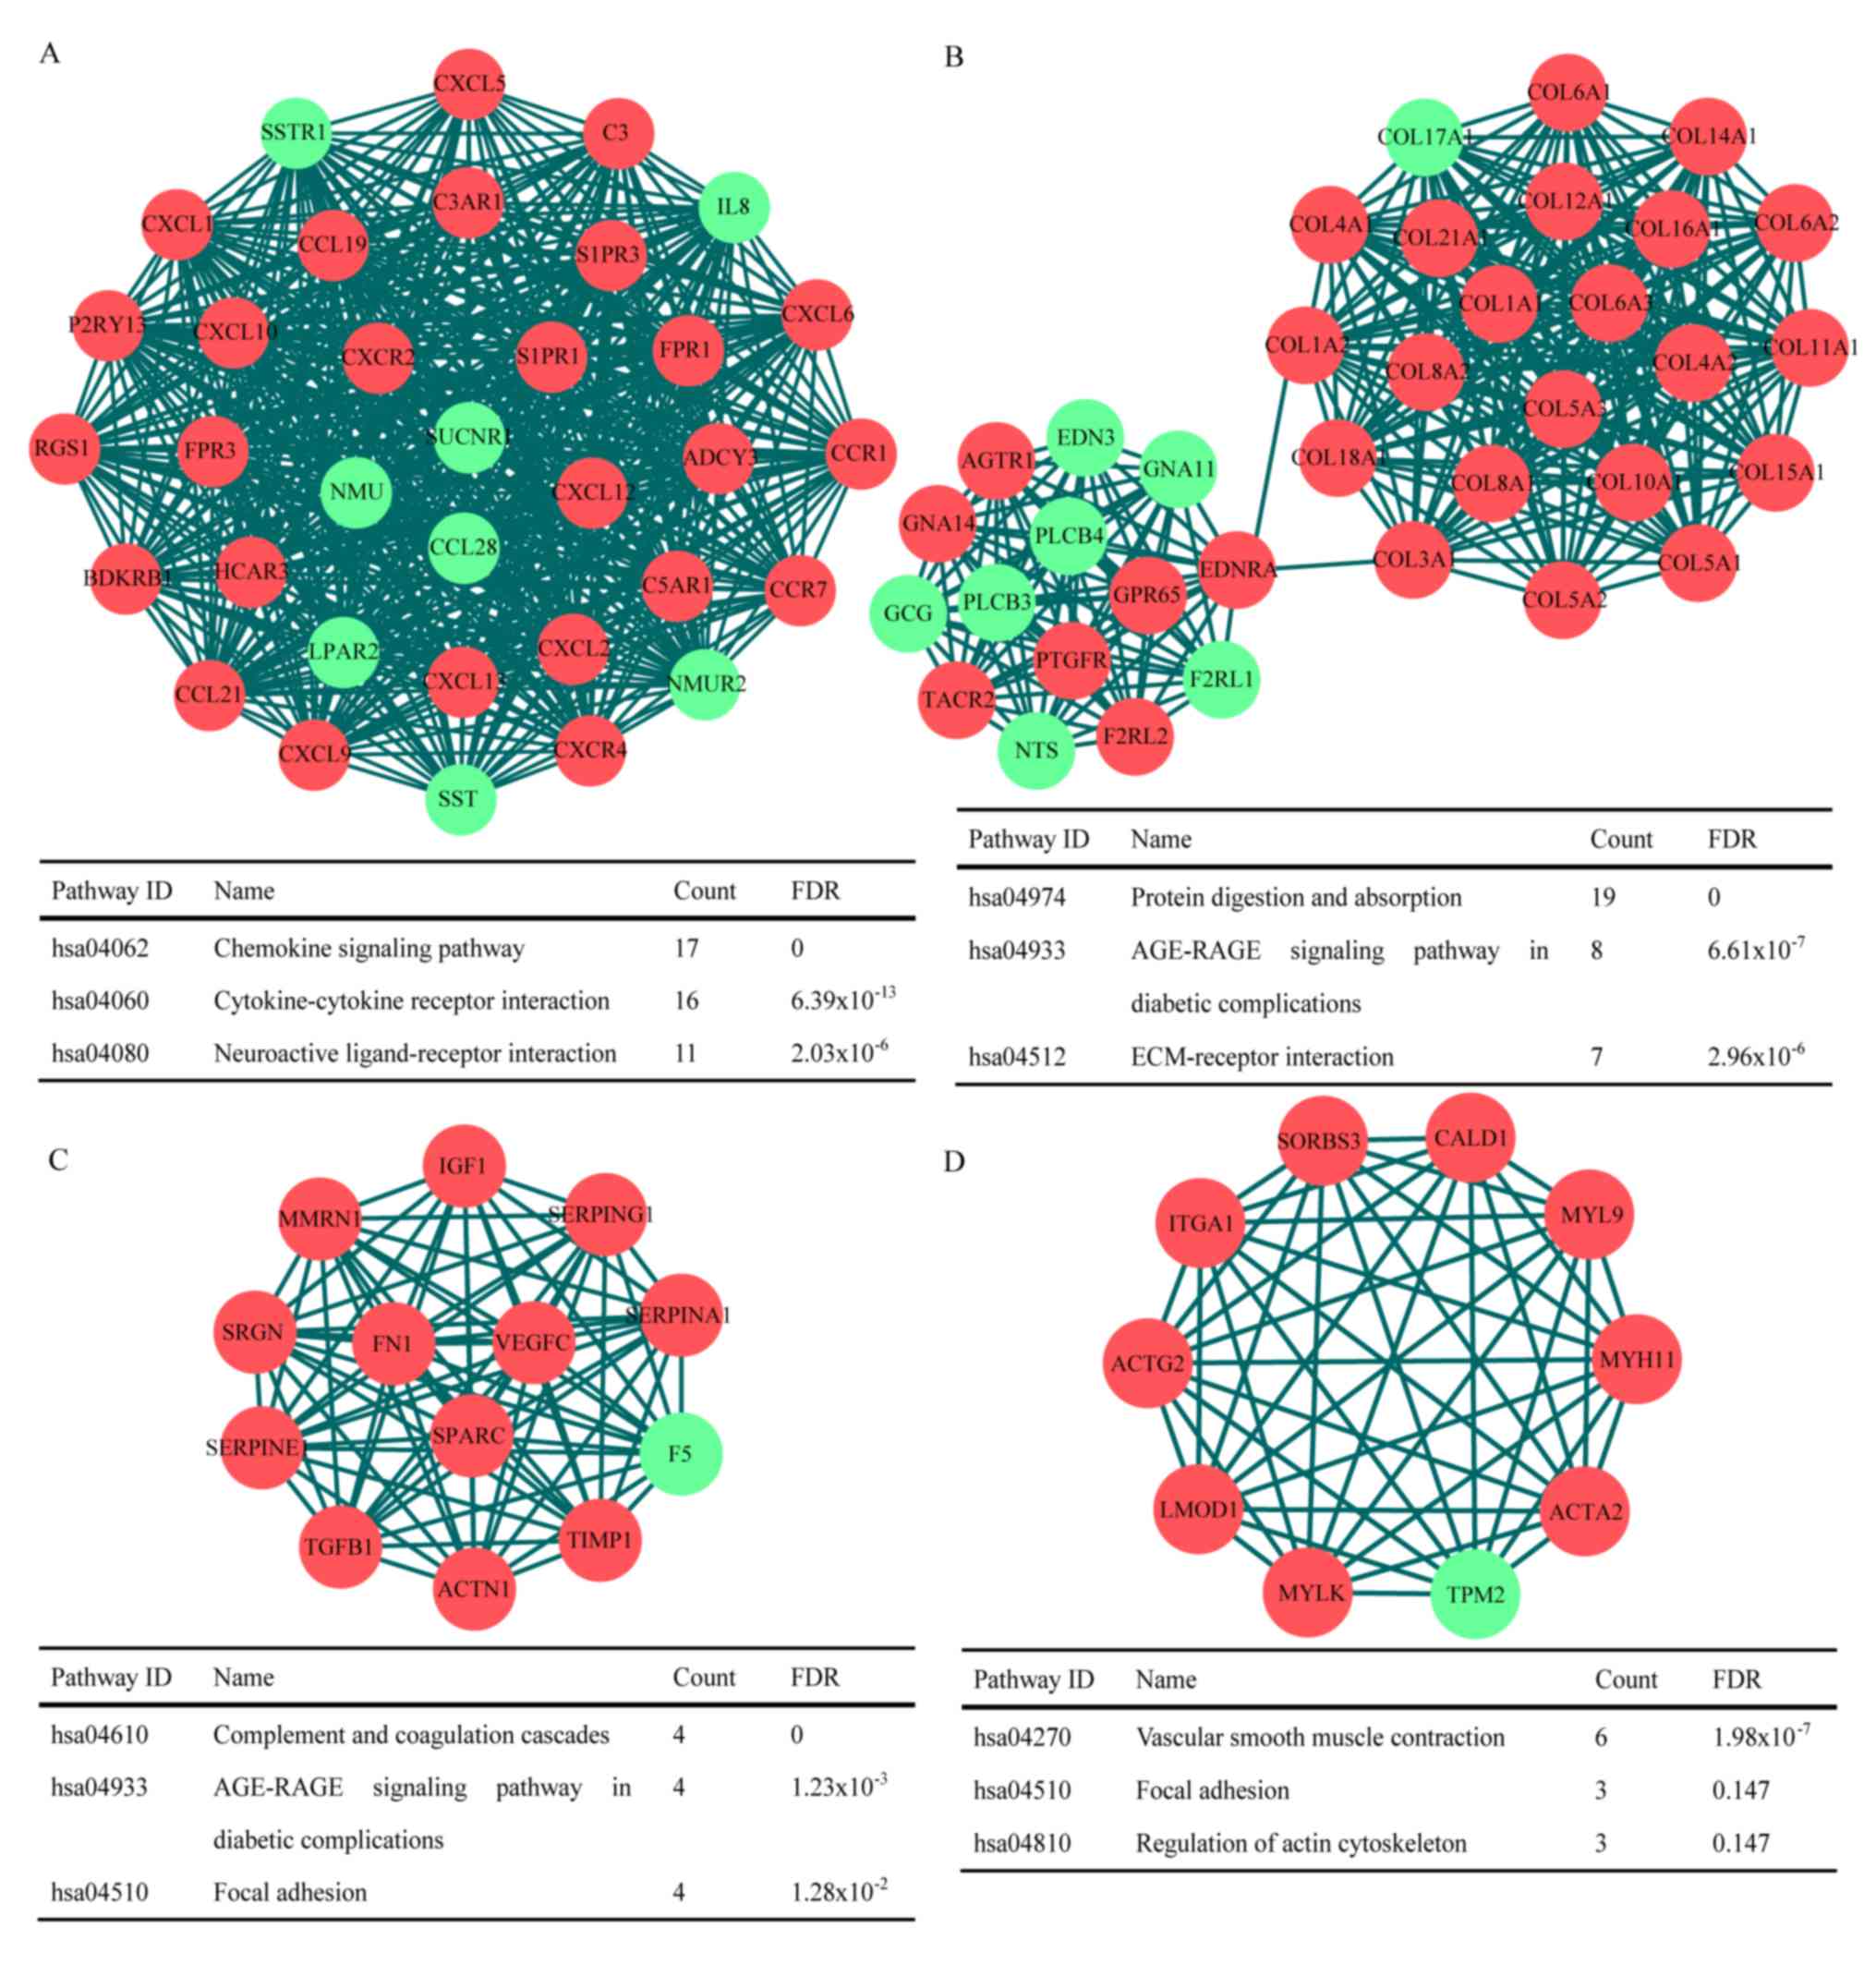
Furthermore, the interact information of 1,829 DEGs
and 2,901 edges was used to construct the top 4 MCODE score disease
modules of gastric cancer using the MCODE application in Cytoscape
software. KEGG pathway enrichment results were obtained for each
gene contained within the modules (Fig. 3). The results demonstrated that the
genes contained in the modules were significantly enriched in
‘chemokine signaling pathway’, ‘protein digestion and absorption’,
‘complement and coagulation cascades’ and ‘AGE-RAGE signaling
pathway in diabetic complications’.
Survival analysis
It was necessary to validate the 10 hub genes
screened from the DEGs. KMplot analysis was used to elucidate the
influence on survival rate of the differential expression of hub
genes. Among the 10 hub genes, increased expression of four genes
was associated with a decreased survival rate; they were ADCY3,
LPAR2, S1PR1 and TSPAN4. The increased expression of five genes was
associated with an increased survival rate; they were TP53, CXCL8,
FOS, NMU and PIK3R1 (Fig. 4).
Quantitative alterations in the expression of CXCL12 were not
significantly associated with survival rate.
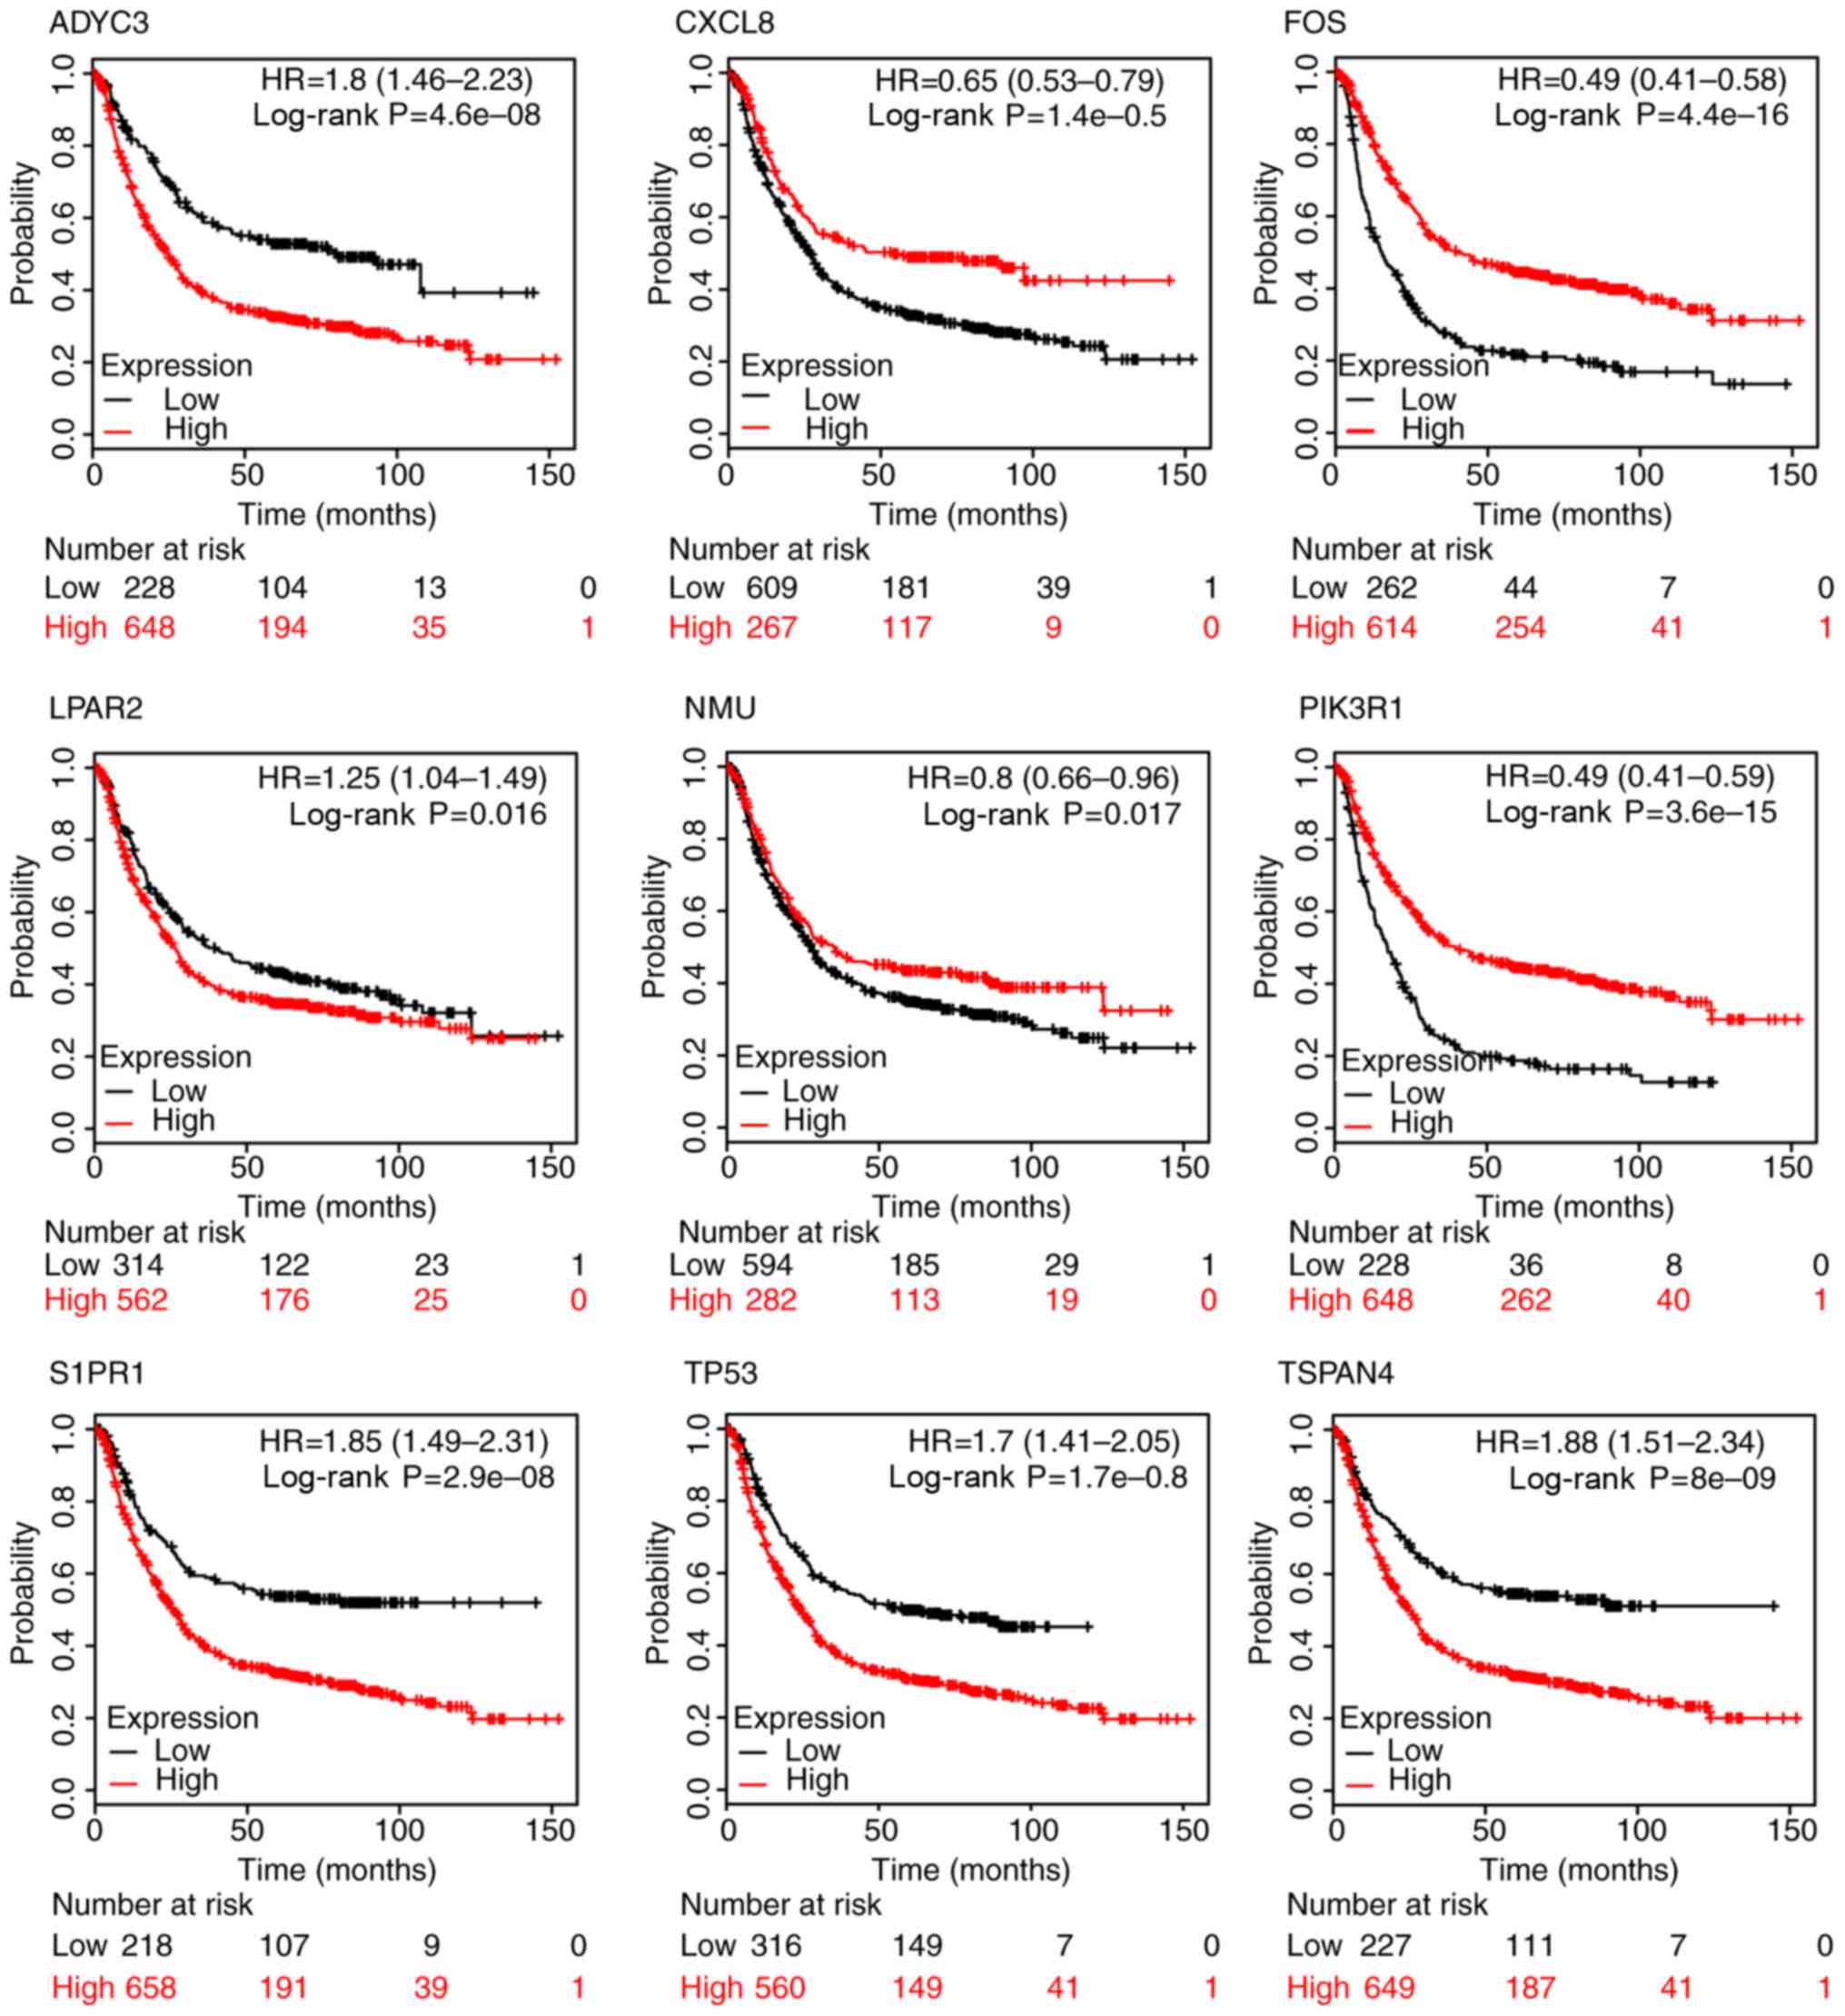 | Figure 4.Survival analysis of hub genes which
have a significant association with survival rate. ADCY3, adenylate
cyclase 3; CXCL8, C-X-C motif chemokine ligand 8; FOS, fos
proto-oncogene, AP-1 transcription factor subunit; LPAR2,
lysophosphatidic acid receptor 2; NMU, neuromedin U; PIK3R1,
phosphoinositide-3-kinase regulatory subunit 1; S1PR1,
sphingosine-1-phosphate receptor 1; TP53, tumor protein p53;
TSPAN4, tetraspanin 4. |
Tumor xenografts
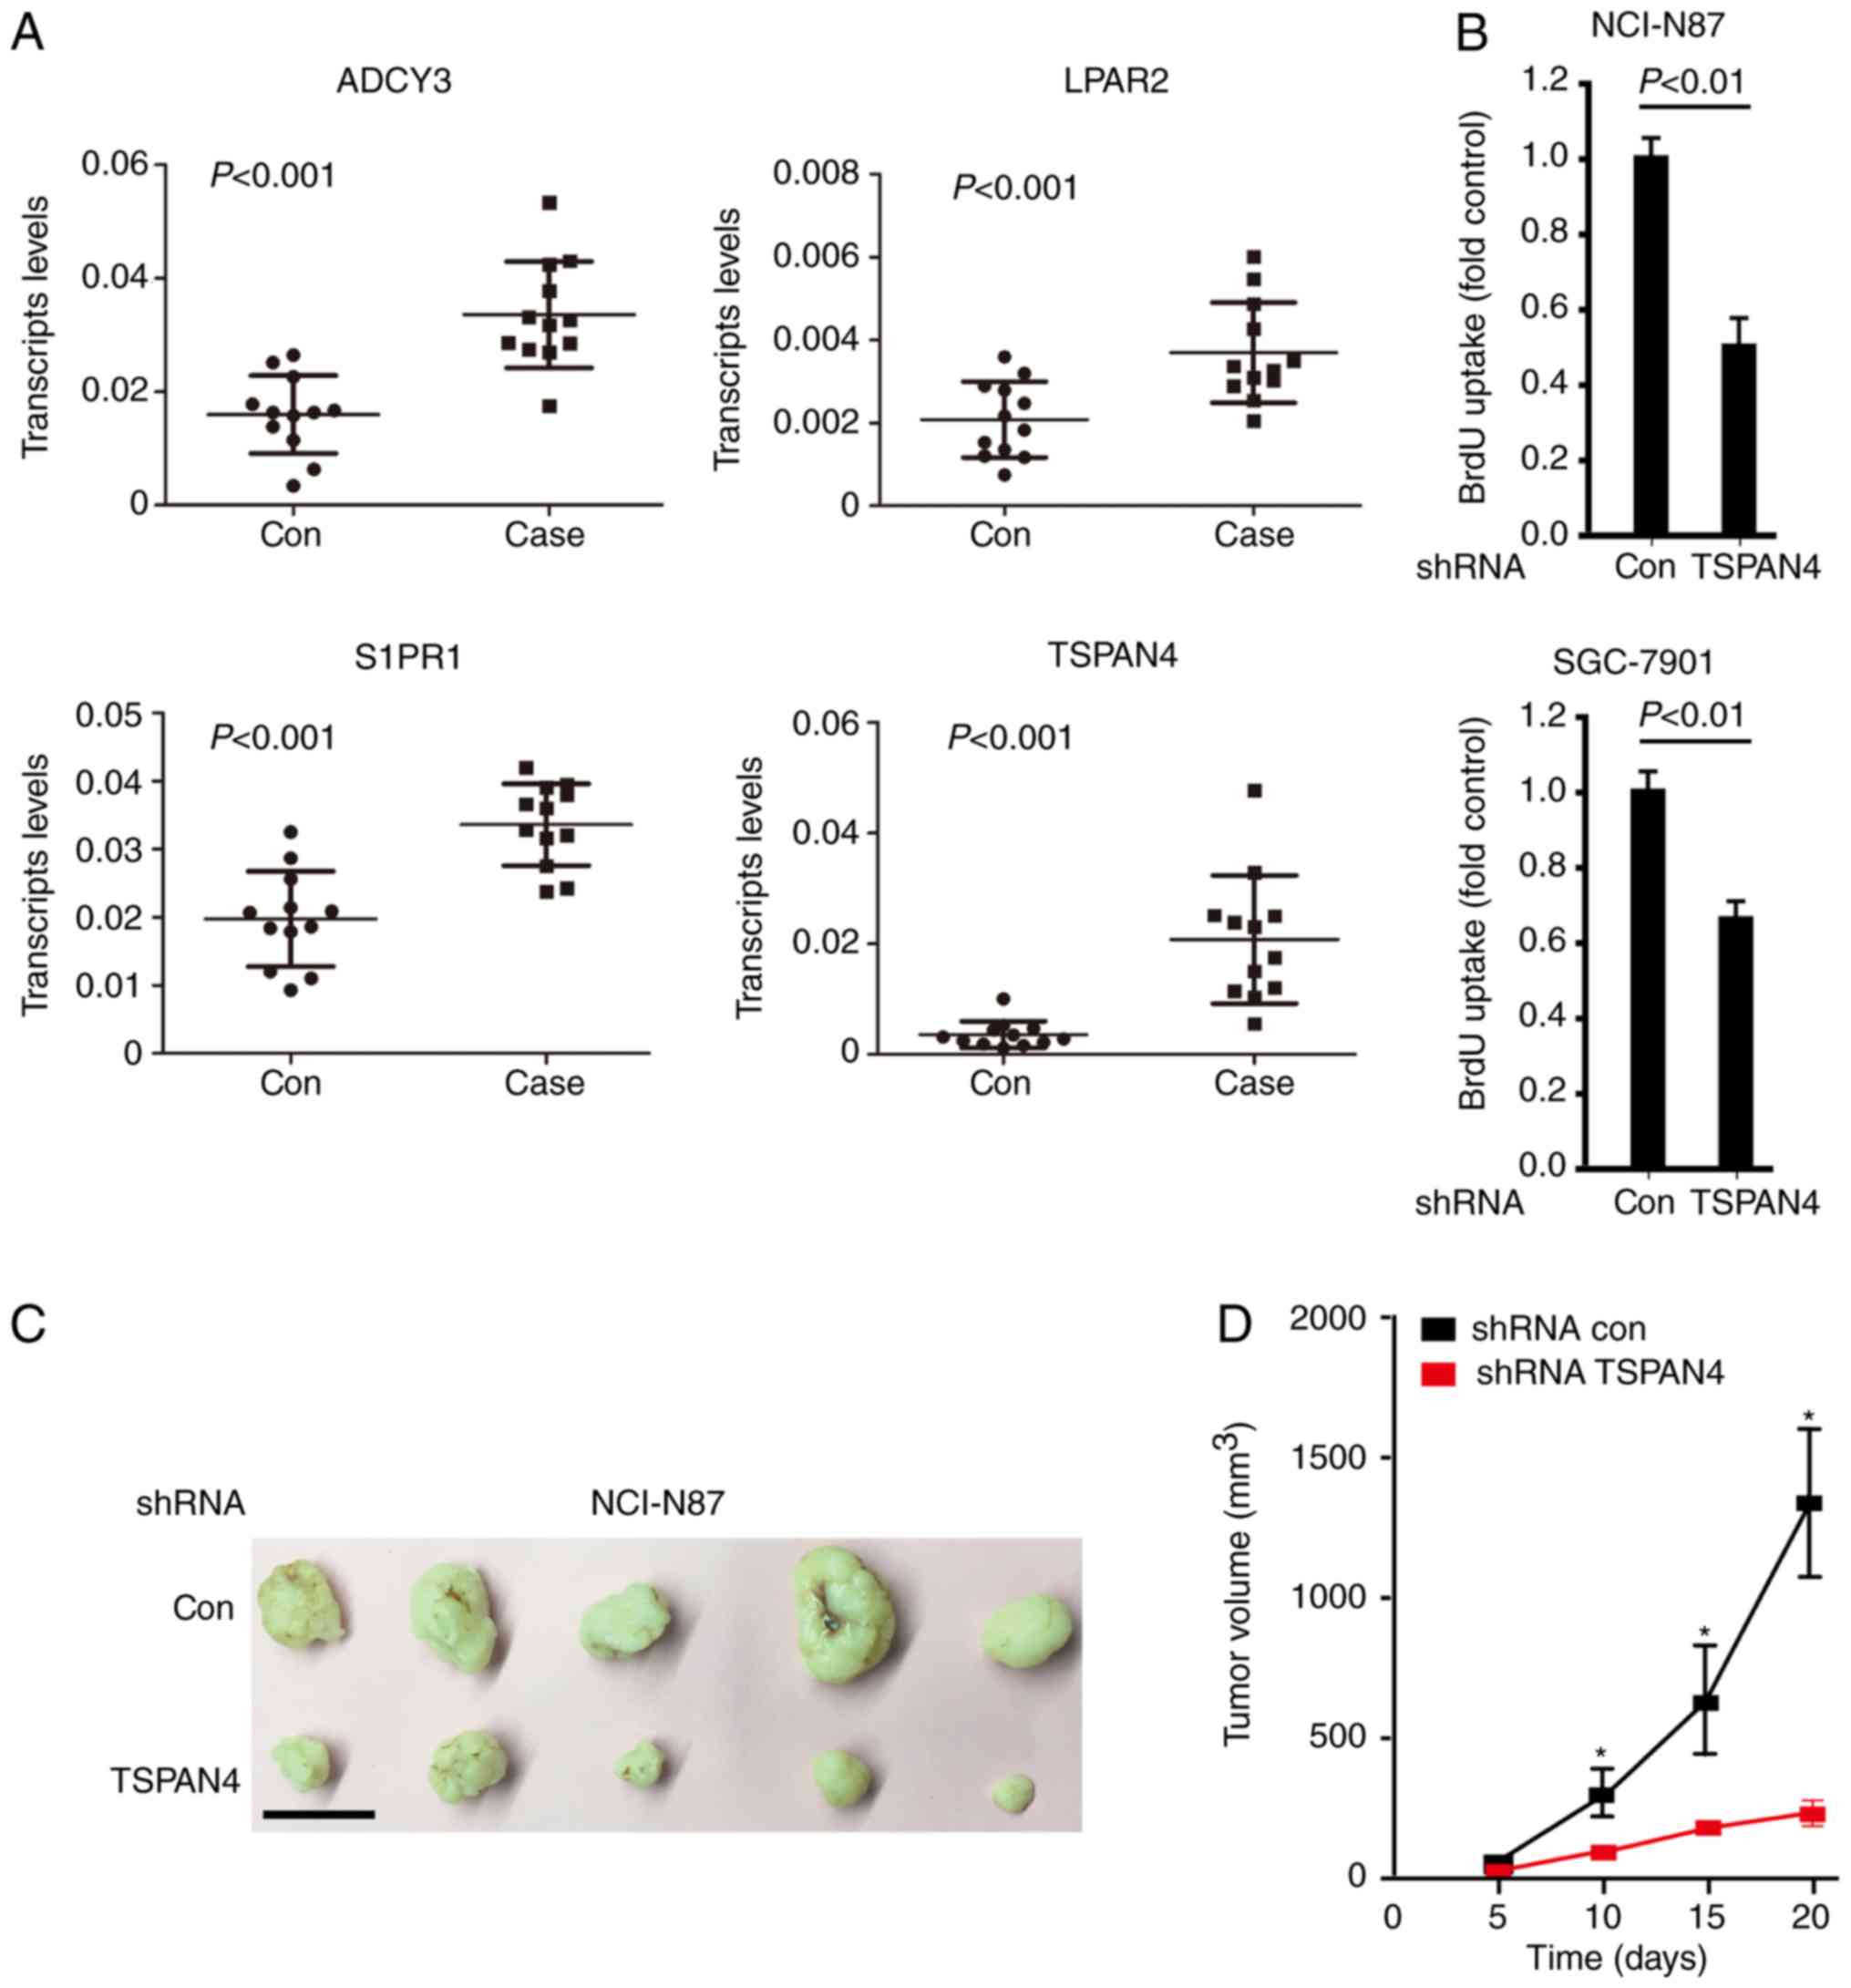
To examine whether the four hub genes associated
with poor prognosis were involved in pathogenesis of gastric
cancer, gastric cancer and para-carcinoma tissues from 12 patients
were subjected to qPCR analysis. It was observed that four genes
were highly expressed in gastric cancer tissue compared with
para-carcinoma tissue in the 12 patients (Fig. 5A). However, the increased TSPAN4
was most significant (>5-fold). To investigate whether TSPAN4
was associated with the proliferation of gastric cancer cells, a
BrdU assay was performed. The results indicated that the
downregulation of TSPAN4 markedly decreased the proliferation of
NCI-N87 and SGC-7901 cells (Fig.
5B). To examine the role of TSPAN4 in tumorigenesis in vivo,
TSPAN4 was stably downregulated in NCI-N87 cells using a lentivirus
carrying TSPAN4 shRNA, and NCI-N87 cells with stably downregulated
TSPAN4 or control cells were subcutaneously injected into athymic
nude mice. A total of 20 days subsequently, all the control cells
formed visible xenograft tumors; conversely, mice injected with
NCI-N87 cells with stably downregulated TSPAN4 exhibited
significantly delayed xenograft tumor growth, with a decreased mean
tumor weight compared with the control group (P<0.01; Fig. 5C and D). Similar results were
obtained when using SGC-7901 cells (data not shown), validating
TSPAN4as a potential therapeutic target in gastric cancer caused by
TSPAN4 overexpression.
Discussion
The incidence and mortality of gastric cancer has
made it the 4th most common cancer with the 2nd highest mortality
rate (17). Due to the complex
etiology of gastric cancer, identifying biomarkers and biological
pathways has become valuable for the diagnosis and treatment of the
disease. The dataset GSE54129 was used in the present study and for
a comprehensive bioinformatics analysis, and 838 upregulated and
991 downregulated DEGs were identified.
In the KEGG analysis of the DEGs, the upregulated
genes were significantly mapped in ‘ECM-receptor interaction’,
‘focal adhesion’, ‘PI3K-Akt signaling pathway’, ‘staphylococcus
aureus infection’ and ‘protein digestion and absorption’. In
previous studies, ‘ECM-receptor interaction’ and ‘focal adhesion’
were identified as representing some of the main differences
between normal and tumor tissues of gastric cancer at a molecular
level (18,19). Guo et al (20), demonstrated that focal adhesion
kinase (FAK) was negatively correlated with olfactomedin 4 with
respect to lymph node metastasis in gastric cancer tissues. In
addition, FAK was positively correlated with the expression of
caveolin 1, which is known as both a tumor promoter and suppressor
in different cancer types (21).
Furthermore, hepatocyte growth factor is able to upregulate
heparanase expression and induce tumor cell migration via the
phosphatidylinositol 3-kinase-RAC-α serine/threonine-protein kinase
signaling pathway (22). In the
present study, the downregulated DEGs were significantly enriched
in ‘chemical carcinogenesis’, ‘metabolism of xeno-biotics by
cytochrome P450’, ‘peroxisome’, ‘fatty acid degradation’ and
‘gastric acid secretion’. These results also coincided with the
results of previous studies (23–27).
The results of the GO analysis demonstrated that in
BP, the downregulated DEGs were significantly enriched in
‘oxidation-reduction process’ and ‘steroid metabolic process’ and
previous structure-activity relationship analysis has demonstrated
that the 7-methyl-substituted and 15-methyl-substituted steroid
analogs lead to a marked increase in potency against the human
gastric cancer cell line MGC-803 (28).
During the disease module construction based on the
PPI network from STRING, ten hub genes from DEGs were screened out:
TP53, CXCL8, TSPAN4, LPAR2, ADCY3, PIK3R1, NMU, CXCL12, FOS and
S1PR1. From the results of the KM analysis, it was identified that
the increased expression of five genes was negatively correlated
with the 5-year survival rate. They were TP53, ADCY3, LPAR2, S1PR1
and TSPAN4. TP53 had the top degree among all DEGs. TP53 encodes a
tumor suppressor protein containing transcriptional activation, DNA
binding and oligomerization domains. These proteins induce cell
cycle arrest, apoptosis, senescence, DNA repair or alterations in
metabolism (29–32). Previous research has proved the
association between TP53 and gastric cancer. Ando et al
(33) studied 182 clinical samples
of gastric cancer and observed that TP53-positive tumors were
invaded more deeply and had more lymph node and liver metastases,
and that some genes (PICT1, RPL11) participate in the cancer
progression via TP53 (34). TP53
mutations occur late in gastric carcinogenesis, contributing to the
final transition to cancer (35).
LPAR2, a lysophosphatidic acid (LPA) receptor, contributes to
Ca2+ mobilization, a critical cellular response to LPA
in cells, through its association with Gi and Gq proteins.
Experimental results have observed that LPAR2 is highly expressed
in SGC-7901 cells, a human gastric cancer cell line, and the
LPAR2/Gq/11/p38 pathway regulates LPA-induced gastric cancer cell
line migration (36). ADCY3 is a
membrane-associated enzyme and catalyzes the formation of the
secondary messenger cyclic adenosine monophosphate (cAMP); a study
reported that the expression of ADCY3 was regulated through an
epigenetic mechanism, thus ADCY3 overexpression may exert its
tumor-promoting effects via the cAMP/protein kinase A/cAMP
response-element binding protein pathway (37). S1PR1, which is highly expressed in
endothelial cells, has also been suggested to be a therapeutic
target for gastric cancer in another study (38). S1PR1 was demonstrated to have a
markedly increased expression level in benign tissues compared with
malignant human tissues by Wang et al (39). TSPAN4 serves a role in the
regulation of cell development, activation, growth and motility.
TSPAN1 and TSPAN8 were additionally screened out from the top 100
DEGs, which are members of the transmembrane 4 superfamily. A study
by Chen et al (40)
suggested that the overexpression of TSPAN1 is positively
correlated with clinical stage and negatively correlated with
survival rate (at 3 and 5 years). The overexpression of TSPAN1 was
reported to be negatively correlated with carcinoma
differentiation, and TSPAN1 is positively correlated with the
infiltration and lymph node status of a tumor (40). Furthermore, Lu et al
(41) reported that the
miR-573/TSPAN1 axis is important in the control of gastric
carcinogenesis. In addition, TSPAN8 was suggested to be associated
with tumor progression and is an independent prognostic factor in
patients with gastric cancer; it has been reported to promote
gastric cancer cell growth and metastasis, at least partially
through the activation of the extracellular signal-regulated
kinase/mitogen-activate protein kinase pathway (42,43).
The other genes, PIK3R1, NMU, FOS, CXCL8 and CXCL12,
have a significant positive correlation with the 5-year survival
rate. PIK3R1 is involved in the regulation of cell function,
including proliferation and survival. PIK3R1 serves a critical role
in the formation of a number of types of malignant tumors. The
results reported by Fu et al (44) further demonstrated that
downregulated PIK3R1 exerts inhibitory effects on the proliferation
and invasion of SGC7901 and U251 cells. NMU has been regarded to
have promoting effect on the generation of a biologically active
neuropeptide which serves a role in pain, stress immune-mediated
inflammatory diseases and feeding regulation; the gene has been
reported to exhibit early alterations associated with cancer
(45). NMU was observed to be the
second most upregulated gene in HT29 colon cancer cells in a recent
study (46). The FOS gene family
consists of 4 members: FOS, FosB proto-oncogene, AP-1 transcription
factor subunit, FOS like 1, AP-1 transcription factor subunit, and
FOS like 2, AP-1 transcription factor subunit; they encode leucine
zipper proteins that are able to dimerize with proteins of the JUN
family, thereby forming the transcription factor complex AP-1.
Research has demonstrated that AP-1 and the AP-1 binding sites of
the matrix metalloproteinase (MMP)9 promoter (−670/MMP9) are
activated by IL-1β-induced p38 activation, increased the migration
of gastric adenocarcinoma cells (47).
CXCL8 and CXCL12 appeared in the top 10 genes. CXCL8
functions as a chemoattractant and is also a potent angiogenic
factor. CXCL8 is able to modulate host immunity,
neovascularization, and the growth and invasive behavior of tumors.
Research has demonstrated that CXC chemokines have the ability to
stimulate the formation of new blood vessels, facilitating tumor
progression (48); this may
explain why the high expression of CXCL8 was positively correlated
with survival rate in the KM analysis performed in the present
study. It is noteworthy that although CXCL12 did not have a
significant association with survival rate in the KM analysis, high
CXCL12 expression levels were significantly associated with larger
tumor size, increased tumor depth, lymphatic invasion and poor
prognosis in gastric cancer in the study of Izumi et al
(49).
In conclusion, by combining bioinformatics methods
and tools, the present study provided a comprehensive analysis of
DEGs from gastric cancer. A number of pathways and biomarkers in
the progression of gastric cancer were identified, which may
provide guidance for further molecular biological study.
Furthermore, via tumor xenografts, it was observed that
downregulating TSPAN4 expression was able to inhibit tumorigenesis,
indicating that the gene may have a delaying effect on the
progression of gastric cancer. As a complex disease, the biological
mechanisms of gastric cancer remain to be completely elucidated.
Further research is required, including biological experiments and
bioinformatics analysis.
Acknowledgements
The authors would like to thank Yichen Yang from the
Bioinfomatics Laboratory of Tianjin Medical University (Tianjin,
China) for guidance on software.
Funding
The present study was supported by National Natural
Science Foundation of China (grant nos. 81472338 and 81602068).
Availability of data and materials
The datasets used and/or analyzed during the current
study are available from the corresponding author on reasonable
request.
Authors' contributions
WWQ and LS drafted the manuscript and took part in
planning the execution of the high-throughput analysis experiments.
NL took part in the development of the analysis code. JL collected
the expression data and screened the different expressed genes. SZ
produced the qPCR analysis. WSQ designed this experiment and
revised the manuscript. All authors have read and approved the
final manuscript.
Ethics approval and consent to
participate
The use of human gastric cancer specimens and the
database was approved by the institutional review board of the
Hospital of Qingdao University (Qingdao, China). Written informed
consent was obtained from all patients. All animal experiments were
approved by Qingdao University and performed in accordance with the
Institutional Animal Care and Use Committee guidelines.
Patient consent for publication
Written informed consent was obtained from all
patients.
Competing interests
The authors declare that they have no competing
interests.
References
|
1
|
Crew KD and Neugut AI: Epidemiology of
gastric cancer. World J Gastroenterol. 12:354–362. 2006. View Article : Google Scholar : PubMed/NCBI
|
|
2
|
Parkin DM, Bray F, Ferlay J and Pisani P:
Global cancer statistics, 2002. CA Cancer J Clin. 55:74–108. 2005.
View Article : Google Scholar : PubMed/NCBI
|
|
3
|
World Health Organization (WHO), .
GLOBOCAN 2012: Estimated Cancer Incidence, Mortality and Prevalence
Worldwide in 2012. WHO; Geneva: 2012, http://globocan.iarc.fr/Pages/fact_sheets_cancer.aspx
|
|
4
|
Liu P, Wang X, Hu CH and Hu TH:
Bioinformatics analysis with graph-based clustering to detect
gastric cancer-related pathways. Genet Mol Res. 11:3497–3504. 2012.
View Article : Google Scholar : PubMed/NCBI
|
|
5
|
Tian J, Wang XD and Chen ZC: Survival of
patients with stomach cancer in Changle city of China. World J
Gastroenterol. 10:1543–1546. 2004. View Article : Google Scholar : PubMed/NCBI
|
|
6
|
Wagner AD, Grothe W, Haerting J, Kleber G,
Grothey A and Fleig WE: Chemotherapy in advanced gastric cancer: A
systematic review and meta-analysis based on aggregate data. J Clin
Oncol. 24:2903–2909. 2006. View Article : Google Scholar : PubMed/NCBI
|
|
7
|
Bejjani BA and Shaffer LG: Clinical
utility of contemporary molecular cytogenetics. Annu Rev Genomics
Hum Genet. 9:71–86. 2008. View Article : Google Scholar : PubMed/NCBI
|
|
8
|
Arocho A, Chen B, Ladanyi M and Pan Q:
Validation of the 2-DeltaDeltaCt calculation as an alternate method
of data analysis for quantitative PCR of BCR-ABL P210 transcripts.
Diagn Mol Pathol. 15:56–61. 2006. View Article : Google Scholar : PubMed/NCBI
|
|
9
|
Gautier L, Cope L, Bolstad BM and Irizarry
RA: affy-analysis of Affymetrix GeneChip data at the probe level.
Bioinformatics. 20:307–315. 2004. View Article : Google Scholar : PubMed/NCBI
|
|
10
|
Phipson B, Lee S, Majewski IJ, Alexander
WS and Smyth GK: Robust hyperparameter estimation protects against
hypervariable genes and improves power to detect differential
expression. Ann Appl Stat:. 10:946–963. 2016. View Article : Google Scholar : PubMed/NCBI
|
|
11
|
Warnes GR, Bolker B, Bonebakker L,
Gentleman R, Andy Liaw WH, Lumley T, Maechler M, Magnusson A,
Moeller S, Schwartz M and Venables B: gplots: Various R Programming
Tools for Plotting Data. https://cran.r-project.org/web/packages/gplots/index.htmlMarch
30–2016
|
|
12
|
Kanehisa M: The KEGG database. Novartis
Found Symp. 247:91–101; discussion 101–103, 119–128. 244–252. 2002.
View Article : Google Scholar : PubMed/NCBI
|
|
13
|
Martucci D, Masseroli M and Pinciroli F:
Gene ontology application to genomic functional annotation,
statistical analysis and knowledge mining. Stud Health Technol
Inform. 102:108–131. 2004.PubMed/NCBI
|
|
14
|
Dennis G Jr, Sherman BT, Hosack DA, Yang
J, Gao W, Lane HC and Lempicki RA: DAVID: Database for annotation,
visualization, and integrated discovery. Genome Biol. 4:P32003.
View Article : Google Scholar : PubMed/NCBI
|
|
15
|
Szklarczyk D, Franceschini A, Wyder S,
Forslund K, Heller D, Huerta-Cepas J, Simonovic M, Roth A, Santos
A, Tsafou KP, et al: STRING v10: Protein-protein interaction
networks, integrated over the tree of life. Nucleic Acids Res.
43(Database Issue): D447–D452. 2015. View Article : Google Scholar : PubMed/NCBI
|
|
16
|
Szász AM, Lánczky A, Nagy Á, Förster S,
Hark K, Green JE, Boussioutas A, Busuttil R, Szabó A and Győrffy B:
Cross-validation of survival associated biomarkers in gastric
cancer using transcriptomic data of 1,065 patients. Oncotarget.
7:49322–49333. 2016. View Article : Google Scholar : PubMed/NCBI
|
|
17
|
Ferro A, Peleteiro B, Malvezzi M, Bosetti
C, Bertuccio P, Levi F, Negri E, La Vecchia C and Lunet N:
Worldwide trends in gastric cancer mortality (1980–2011), with
predictions to 2015, and incidence by subtype. Eur J Cancer.
50:1330–1344. 2014. View Article : Google Scholar : PubMed/NCBI
|
|
18
|
Yang S, Shin J, Park KH, Jeung HC, Rha SY,
Noh SH, Yang WI and Chung HC: Molecular basis of the differences
between normal and tumor tissues of gastric cancer. Biochim Biophys
Acta. 1772:1033–1040. 2007. View Article : Google Scholar : PubMed/NCBI
|
|
19
|
Zhao Z, Song Y, Piao D, Liu T and Zhao L:
Identification of genes and long non-coding RNAs associated with
the pathogenesis of gastric cancer. Oncol Rep. 34:1301–1310. 2015.
View Article : Google Scholar : PubMed/NCBI
|
|
20
|
Guo LL, He ZC, Yang CQ, Qiao PT and Yin
GL: Epigenetic silencing of olfactomedin-4 enhances gastric cancer
cell invasion via activation of focal adhesion kinase signaling.
BMB Rep. 48:630–635. 2015. View Article : Google Scholar : PubMed/NCBI
|
|
21
|
Nam KH, Lee BL, Park JH, Kim J, Han N, Lee
HE, Kim MA, Lee HS and Kim WH: Caveolin 1 expression correlates
with poor prognosis and focal adhesion kinase expression in gastric
cancer. Pathobiology. 80:87–94. 2013. View Article : Google Scholar : PubMed/NCBI
|
|
22
|
Hao NB, Tang B, Wang GZ, Xie R, Hu CJ,
Wang SM, Wu YY, Liu E, Xie X and Yang SM: Hepatocyte growth factor
(HGF) upregulates heparanase expression via the PI3K/Akt/NF-κB
signaling pathway for gastric cancer metastasis. Cancer Lett.
361:57–66. 2015. View Article : Google Scholar : PubMed/NCBI
|
|
23
|
Cho SJ, Kook MC, Lee JH, Shin JY, Park J,
Bae YK, Choi IJ, Ryu KW and Kim YW: Peroxisome
proliferator-activated receptor γ upregulates galectin-9 and
predicts prognosis in intestinal-type gastric cancer. Int J Cancer.
136:810–820. 2015. View Article : Google Scholar : PubMed/NCBI
|
|
24
|
Choi JM, Park WS, Song KY, Lee HJ and Jung
BH: Development of simultaneous analysis of tryptophan metabolites
in serum and gastric juice-an investigation towards establishing a
biomarker test for gastric cancer diagnosis. Biomed Chromatogr.
30:1963–1974. 2016. View
Article : Google Scholar : PubMed/NCBI
|
|
25
|
Leung WK, Wu KC, Wong CY, Cheng AS, Ching
AK, Chan AW, Chong WW, Go MY, Yu J, To KF, et al: Transgenic
cyclooxygenase-2 expression and high salt enhanced susceptibility
to chemical-induced gastric cancer development in mice.
Carcinogenesis. 29:1648–1654. 2008. View Article : Google Scholar : PubMed/NCBI
|
|
26
|
Kim HS, Kwack SJ and Lee BM: Alteration of
cytochrome P-450 and glutathione S-transferase activity in normal
and malignant human stomach. J Toxicol Environ Health A.
68:1611–1620. 2005. View Article : Google Scholar : PubMed/NCBI
|
|
27
|
Song H, Peng JS, Yao DS, Liu DL, Yang ZL,
Du YP and Xiang J: Metabolic disorders of fatty acids and fatty
acid amides associated with human gastric cancer morbidity. Chin
Med J (Engl). 125:757–763. 2012.PubMed/NCBI
|
|
28
|
Li C, Qiu W, Yang Z, Luo J, Yang F, Liu M,
Xie J and Tang J: Stereoselective synthesis of some
methyl-substituted steroid hormones and their in vitro cytotoxic
activity against human gastric cancer cell line MGC-803. Steroids.
75:859–869. 2010. View Article : Google Scholar : PubMed/NCBI
|
|
29
|
Nicolai S, Rossi A, Di Daniele N, Melino
G, Annicchiarico-Petruzzelli M and Raschellà G: DNA repair and
aging: The impact of the p53 family. Aging (Albany NY).
7:1050–1065. 2015. View Article : Google Scholar : PubMed/NCBI
|
|
30
|
Rufini A, Tucci P, Celardo I and Melino G:
Senescence and aging: The critical roles of p53. Oncogene.
32:5129–5143. 2013. View Article : Google Scholar : PubMed/NCBI
|
|
31
|
Wawryk-Gawda E, Chylińska-Wrzos P,
Lis-Sochocka M, Chłapek K, Bulak K, Jędrych M and Jodłowska-Jędrych
B: P53 protein in proliferation, repair and apoptosis of cells.
Protoplasma. 251:525–533. 2014. View Article : Google Scholar : PubMed/NCBI
|
|
32
|
Yuan L, Zhang Y, Xia J, Liu B, Zhang Q,
Liu J, Luo L, Peng Z, Song Z and Zhu R: Resveratrol induces cell
cycle arrest via a p53-independent pathway in A549 cells. Mol Med
Rep. 11:2459–2464. 2015. View Article : Google Scholar : PubMed/NCBI
|
|
33
|
Ando K, Oki E, Zhao Y, Ikawa-Yoshida A,
Kitao H, Saeki H, Kimura Y, Ida S, Morita M, Kusumoto T and Maehara
Y: Mortalin is a prognostic factor of gastric cancer with normal
p53 function. Gastric Cancer. 17:255–262. 2014. View Article : Google Scholar : PubMed/NCBI
|
|
34
|
Uchi R, Kogo R, Kawahara K, Sudo T,
Yokobori T, Eguchi H, Sugimachi K, Maehama T, Mori M, Suzuki A, et
al: PICT1 regulates TP53 via RPL11 and is involved in gastric
cancer progression. Br J Cancer. 109:2199–2206. 2013. View Article : Google Scholar : PubMed/NCBI
|
|
35
|
Busuttil RA, Zapparoli GV, Haupt S,
Fennell C, Wong SQ, Pang JM, Takeno EA, Mitchell C, Di Costanzo N,
Fox S, et al: Role of p53 in the progression of gastric cancer.
Oncotarget. 5:12016–12026. 2014. View Article : Google Scholar : PubMed/NCBI
|
|
36
|
Yang D, Yang W, Zhang Q, Hu Y, Bao L and
Damirin A: Migration of gastric cancer cells in response to
lysophosphatidic acid is mediated by LPA receptor 2. Oncol Lett.
5:1048–1052. 2013. View Article : Google Scholar : PubMed/NCBI
|
|
37
|
Hong SH, Goh SH, Lee SJ, Hwang JA, Lee J,
Choi IJ, Seo H, Park JH, Suzuki H, Yamamoto E, et al: Upregulation
of adenylate cyclase 3 (ADCY3) increases the tumorigenic potential
of cells by activating the CREB pathway. Oncotarget. 4:1791–1803.
2013. View Article : Google Scholar : PubMed/NCBI
|
|
38
|
Luo Y, Zhang C, Tang F, Zhao J, Shen C,
Wang C, Yu P, Wang M, Li Y, Di JI, et al: Bioinformatics
identification of potentially involved microRNAs in Tibetan with
gastric cancer based on microRNA profiling. Cancer Cell Int.
15:1152015. View Article : Google Scholar : PubMed/NCBI
|
|
39
|
Wang C, Mao J, Redfield S, Mo Y, Lage JM
and Zhou X: Systemic distribution, subcellular localization and
differential expression of sphingosine-1-phosphate receptors in
benign and malignant human tissues. Exp Mol Pathol. 97:259–265.
2014. View Article : Google Scholar : PubMed/NCBI
|
|
40
|
Chen L, Li X, Wang GL, Wang Y, Zhu YY and
Zhu J: Clinicopathological significance of overexpression of
TSPAN1, K167 and CD34 in gastric carcinoma. Tumori. 94:531–538.
2008. View Article : Google Scholar : PubMed/NCBI
|
|
41
|
Lu Z, Luo T, Nie M, Pang T, Zhang X, Shen
X, Ma L, Bi J, Wei G, Fang G and Xue X: TSPAN1 functions as an
oncogene in gastric cancer and is downregulated by miR-573. FEBS
Lett. 589:1988–1994. 2015. View Article : Google Scholar : PubMed/NCBI
|
|
42
|
Anami K, Oue N, Noguchi T, Sakamoto N,
Sentani K, Hayashi T, Naito Y, Oo HZ and Yasui W: TSPAN8,
identified by Escherichia coli ampicillin secretion trap, is
associated with cell growth and invasion in gastric cancer. Gastric
Cancer. 19:370–380. 2016. View Article : Google Scholar : PubMed/NCBI
|
|
43
|
Wei L, Li Y and Suo Z: TSPAN8 promotes
gastric cancer growth and metastasis via ERK MAPK pathway. Int J
Clin Exp Med. 8:8599–8607. 2015.PubMed/NCBI
|
|
44
|
Fu Y, Zhang Q, Kang C, Zhang J, Zhang K,
Pu P, Wang G and Wang T: Inhibitory effects of adenovirus mediated
Akt1 and PIK3R1 shRNA on the growth of malignant tumor cells in
vitro and in vivo. Cancer Biol Ther. 8:1002–1009. 2009. View Article : Google Scholar : PubMed/NCBI
|
|
45
|
Yamashita K, Upadhyay S, Osada M, Hoque
MO, Xiao Y, Mori M, Sato F, Meltzer SJ and Sidransky D:
Pharmacologic unmasking of epigenetically silenced tumor suppressor
genes in esophageal squamous cell carcinoma. Cancer Cell.
2:485–495. 2002. View Article : Google Scholar : PubMed/NCBI
|
|
46
|
Przygodzka P, Papiewska-Pajak I, Bogusz H,
Kryczka J, Sobierajska K, Kowalska MA and Boncela J: Neuromedin U
is upregulated by Snail at early stages of EMT in HT29 colon cancer
cells. Biochim Biophys Acta. 1860:2445–2453. 2016. View Article : Google Scholar : PubMed/NCBI
|
|
47
|
Huang Q, Lan F, Wang X, Yu Y, Ouyang X,
Zheng F, Han J, Lin Y, Xie Y, Xie F, et al: IL-1β-induced
activation of p38 promotes metastasis in gastric adenocarcinoma via
upregulation of AP-1/c-fos, MMP2 and MMP9. Mol Cancer. 13:182014.
View Article : Google Scholar : PubMed/NCBI
|
|
48
|
Verbeke H, Geboes K, Van Damme J and
Struyf S: The role of CXC chemokines in the transition of chronic
inflammation to esophageal and gastric cancer. Biochim Biophys
Acta. 1825:117–129. 2012.PubMed/NCBI
|
|
49
|
Izumi D, Ishimoto T, Miyake K, Sugihara H,
Eto K, Sawayama H, Yasuda T, Kiyozumi Y, Kaida T, Kurashige J, et
al: CXCL12/CXCR4 activation by cancer-associated fibroblasts
promotes integrin β1 clustering and invasiveness in gastric cancer.
Int J Cancer. 138:1207–1219. 2016. View Article : Google Scholar : PubMed/NCBI
|