Introduction
The worldwide prevalence of obesity has almost
tripled since 1975 (1). According
to the most recent data reported by the World Health Organization
(updated in October 2017), mortality associated with being
overweight or obese as opposed to being underweight is greater in
the vast majority of countries (1). Adipose tissue serves a primary role
in lipid and glucose metabolism as a storage site for fatty acids,
and produces a large number of hormones and cytokines as an
endocrine organ (2). Adipose
tissue dysfunction triggers a number of obesity-associated
metabolic derangements, such as type 2 diabetes, insulin resistance
and cardiovascular diseases (2,3).
Cellular heterogeneity is a characteristic feature
of adipose tissue, which contains several types of cells, including
adipocytes, preadipocytes, fibroblasts, endothelial cells and
multipotent stem cells (4).
Adipocytes are the major component of adipose tissue and are
considered to be the cornerstone of the steady-state control of
systemic metabolism. Their main function is to control the energy
balance by mobilizing triglycerides during times of energy
starvation and storing triglycerides during periods of excessive
energy. Preadipocytes undergo proliferation and differentiation,
eventually forming mature adipocytes. This process determines the
ability of adipose tissues to expand throughout the lifespan of
humans (4), leading to central
obesity (5). Adipocytes are
replaced via the constant generation of new adipocytes, with
renewal of nearly 50% of adipocytes in the human subcutaneous
adipose tissue every 8 years (6).
At the cellular level, an increase in the number and volume of
adipocytes can fundamentally lead to hyperplastic and hypertrophic
obesity, respectively (7). In
severely obese individuals, the increase in the number of
adipocytes is more prominent in comparison with the increase in the
volume of adipocytes (8).
As the most abundant tissue in the body, white
adipose tissue (WAT) serves a variety of physiological roles,
mainly associated with metabolic and endocrine functions (9). The metabolic functions of WAT include
the storage and mobilization of energy. Energy is stored in the
body in the form of triglycerides through lipogenesis, while the
stored triglycerides are hydrolyzed through lipolysis to meet the
body's continuing energy needs (10). Specific enzymes acquired during
adipocyte differentiation contribute to the two aforementioned
processes, which are regulated by several pathways, including the
insulin, adrenergic and atrial natriuretic hormone pathways
(11). In addition, WAT is an
endocrine organ that produces an abundance of peptides, proteins
and lipids (9). Factors including
hormones, cytokines, extracellular matrix components and fatty
acid-derived products can act systemically in WAT and other tissues
to influence metabolic homeostasis (9). Over the past several decades, a large
number of studies have addressed the function of fat- and
obesity-associated diseases. However, details regarding the
molecular mechanisms of adipose tissue remain unclear. To
thoroughly investigate the role of adipose tissue in energy
homeostasis and obesity-associated diseases caused by adipose
dysfunction, it is necessary to understand the key genes required
for maintaining the normal physiological functions of WAT.
High-throughput molecular biology techniques,
represented by gene chip technology, can provide large-scale gene
expression data through the measurement of transcript abundance in
diverse tissues or cells (12).
The Gene Expression Omnibus (GEO) database stores originally
submitted records obtained using common commercial arrays, such as
Affymetrix, Agilent, Illumina or NimbleGen (12). Recently, there has been impressive
progress in identifying and detailing nodes through various
microarray data analyses of adipose tissue or adipocytes, and
subsequent experimental verification (13,14).
However, few studies have attempted to identify the key genes in
adipose tissue based on the comparative analysis of multiple
tissues.
In view of the extremely close association between
adipose tissue and obesity, the identification of fat-driven genes
is particularly important. In obese individuals, intra-abdominal
fat accumulation is more strongly associated with the development
of related diseases as opposed to subcutaneous fat accumulation
(15). Therefore, in the present
study, the mRNA expression profiles of epididymal adipose tissue (a
type of WAT) were compared with 17 types of non-adipose tissues in
order to identify adipose-specific genes in WAT. These genes were
then extensively analyzed using several bioinformatics methods,
including process and pathway enrichment analyses, protein-protein
interaction (PPI) network construction, molecular complex detection
(MCODE) analysis and co-expression network analysis. These analyses
attempted to provide a more in-depth understanding of adipose
performance at the molecular level, and to identify the key genes
required for the function of WAT and metabolic disorders caused by
adipose dysfunction.
Materials and methods
Microarray data
mRNA expression profiles from the GSE9954 data
series were downloaded from the GEO database (16). The GSE9954 data series (Affymetrix
Mouse Genome 430 2.0 Array; Affymetrix, Inc., Santa Clara, CA, USA)
included the profiles of 58 wild-type tissue samples obtained from
10–12-week-old C57BL/6 male mice, including 3 epididymal adipose, 3
liver, 3 diaphragm, 3 salivary gland, 3 spleen, 4 muscle, 3 brain,
3 lung, 3 kidney, 3 adrenal gland, 4 bone marrow, 5 pituitary
gland, 3 seminal vesicle, 3 thymus, 3 testis, 3 heart, 3 small
intestine and 3 eye tissue samples.
Identification of differentially
expressed genes (DEGs)
The impute (Imputation for microarray data;
www.bioconductor.org/packages/release/bioc/html/impute.html)
(17) and limma (Linear Models for
Microarray Data; www.bioconductor.org/packages/release/bioc/html/limma.html)
(18) packages were used to
identify DEGs between adipose and non-adipose tissues. The
thresholds used in DEG screening were an adjusted P-value of
<0.05 and a |log fold-change (FC)| of >0.5. All the packages
used in the present study were deployed in the R programming
language (version 3.3.3; http://www.r-project.org/).
Process and pathway enrichment
analyses
For the functional annotation of the DEGs, process
and pathway enrichment analyses were performed using the online
software DAVID (https://david.ncifcrf.gov/) (19) and KOBAS (http://kobas.cbi.pku.edu.cn/) (20,21).
The Gene Ontology (GO) and Kyoto Encyclopedia of Genes and Genomes
(KEGG) pathway analyses were used as ontology sources. Significant
enrichment was considered at P<0.01.
PPI network and module analysis
The assessment of PPI information and the
construction of a functional protein association network were
performed using the Search Tool for the Retrieval of Interacting
Genes/Proteins (STRING) database (version 10.5; http://string-db.org/) (22). To evaluate the intensity of
interaction among the input genes, the genes were mapped in STRING
using a combined score (experimentally validated interactions) of
>0.4 as the cut-off criterion. Next, the PPI network was
constructed and visualized with Cytoscape software (version 3.6.0;
http://www.cytoscape.org/) (23). The MCODE plug-in (http://apps.cytoscape.org/apps/mcode)
(24) was used to scan the PPI
network in order to identify densely connected regions.
Gene co-expression network
analysis
Weighted gene co-expression network analysis (WGCNA)
can be used to describe the network of gene expression estimates
based on a correlation (25).
Highly connected nodes in the co-expression network are often
considered as key components affecting the expression of the whole
network. In the current study, co-expression network analysis was
performed using the WGCNA package (https://cran.r-project.org/web/packages/WGCNA/index.html)
(25), with a threshold for weight
set at >0.6.
Results
Identification of adipose-specific
genes
First, the raw data of GSE9954 in text format were
downloaded from the GEO database. Gene expression values were
normalized and imputed using the packages impute and limma in R.
The gene expression profiles of adipose tissue were compared with
those of 17 other types of non-adipose tissues in order to identify
DEGs, employing an adjusted P-value of <0.05 and a |logFC| of
>0.5 as the cut-off criteria. The overlap of these comparative
results revealed 219 DEGs which were commonly upregulated (215) or
downregulated (4) in adipose
tissue compared with all the other tissues (Table I). Next, 13 genes that could not be
recognized were excluded, and the remaining 202 common upregulated
genes were considered to be adipose-specific genes. These included
several important genes, such as acetyl-CoA carboxylase α (Acaca),
peroxisome proliferator-activated receptor γ (Pparg) and leptin
(Lep), as well as adiponectin, C1Q and collagen domain containing
(Adipoq), and fatty acid synthase (Fasn). Employing the heatmap
package in the R programming language, a heat map of the
adipose-specific genes was developed using gene expression data
from the 58 samples of 18 tissue types included in the data series
(Fig. 1).
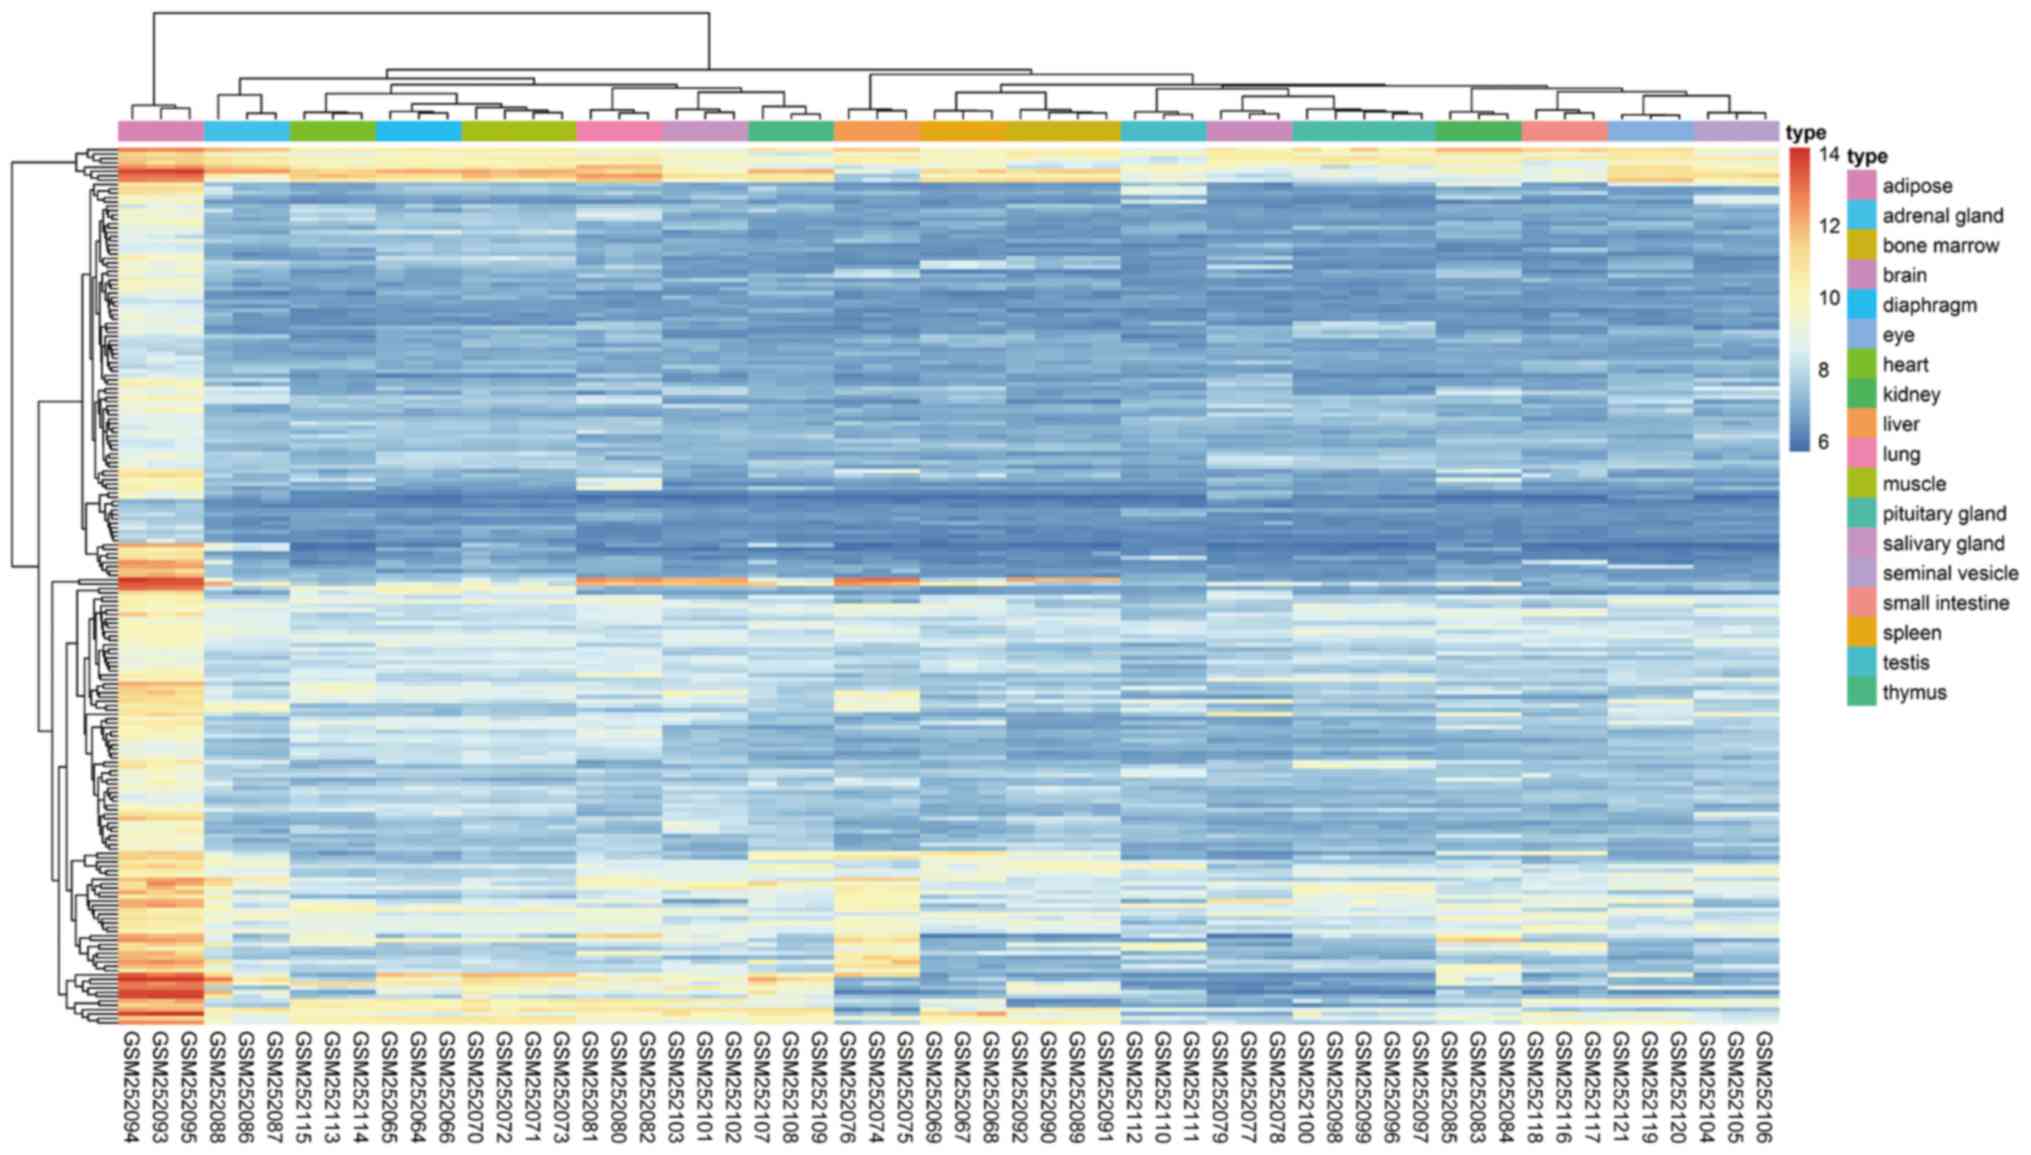 | Figure 1.Hierarchical clustering analysis of
adipose-specific genes in 58 samples from 18 tissue types included
in the GSE9954 data series. Each row represents one gene, with a
total of 202 adipose-specific genes. Each column represents one
tissue sample (GEO sample number), including 3 epididymal adipose,
3 liver, 3 diaphragm, 3 salivary gland, 3 spleen, 4 muscle, 3
brain, 3 lung, 3 kidney, 3 adrenal gland, 4 bone marrow, 5
pituitary gland, 3 seminal vesicle, 3 thymus, 3 testis, 3 heart, 3
small intestine and 3 eye tissue samples. Relative gene expression
is indicated according to the color scale, where red indicates
elevated expression and blue indicates reduced expression. Gene
expression values were transformed into log2-based
values (distribution range, 6 and 14). |
 | Table I.Differentially expressed genes in
adipose tissue compared with 17 non-adipose tissues. |
Table I.
Differentially expressed genes in
adipose tissue compared with 17 non-adipose tissues.
| Group | Upregulated
genes | Downregulated
genes |
|---|
| Adipose vs. adrenal
gland | 2,149 | 2,266 |
| Adipose vs. bone
marrow | 3,402 | 3,231 |
| Adipose vs.
brain | 3,494 | 3,550 |
| Adipose vs.
diaphragm | 3,073 | 3,568 |
| Adipose vs.
eye | 3,137 | 3,031 |
| Adipose vs.
heart | 3,143 | 2,890 |
| Adipose vs.
kidney | 2,446 | 2,260 |
| Adipose vs.
liver | 3,032 | 2,180 |
| Adipose vs.
lung | 1,706 | 1,986 |
| Adipose vs.
muscle | 2,891 | 2,565 |
| Adipose vs.
pituitary gland | 2,783 | 3,136 |
| Adipose vs.
salivary gland | 3,212 | 2,906 |
| Adipose vs. seminal
vesicle | 2,843 | 2,671 |
| Adipose vs. small
intestine | 3,152 | 2,551 |
| Adipose vs.
spleen | 2,894 | 3,095 |
| Adipose vs.
testis | 4,992 | 3,916 |
| Adipose vs.
thymus | 3,098 | 3,060 |
| Adipose vs. all 17
tissues | 215 | 4 |
Process and pathway enrichment
analyses
To investigate the role of the adipose-specific
genes in WAT, process and pathway enrichment analyses were
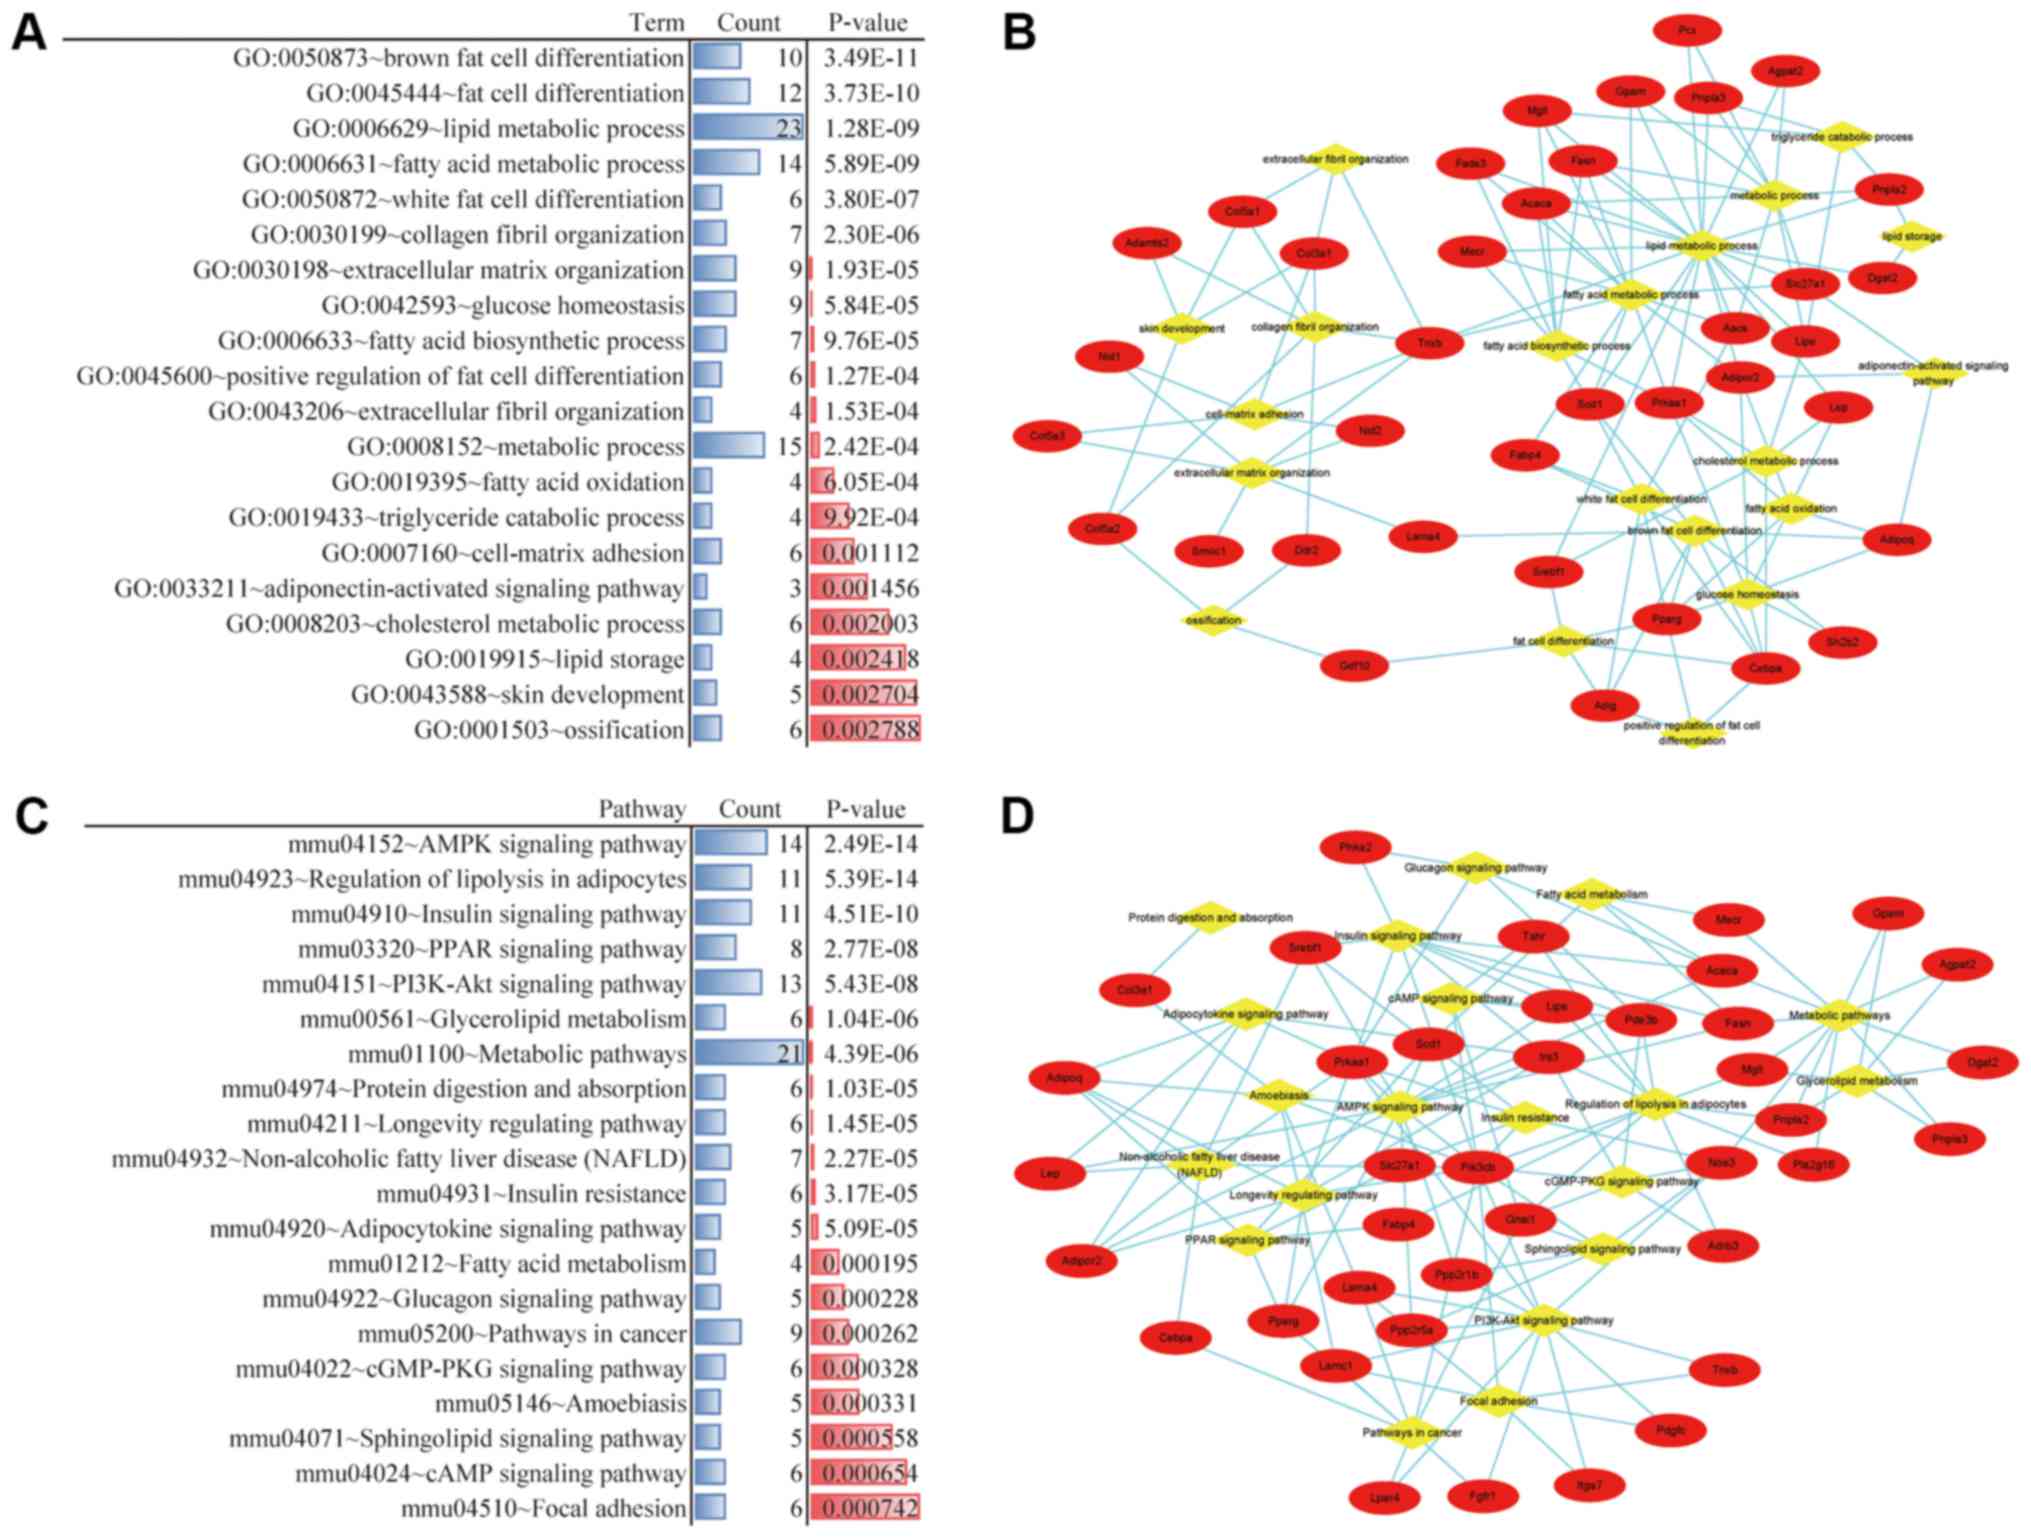
performed. The top 20 significant GO biological processes were
selected by DAVID online software (Fig. 2A). According to the results,
adipogenesis-associated biological processes, including brown fat
cell differentiation, fat cell differentiation and white fat cell
differentiation respectively displayed the highest, second highest
and fourth highest significance, while lipid metabolic processes
were considered the central biological process category according
to the exchanges among the terms (Fig.
2B). Therefore, fat cell differentiation and lipid metabolic
processes are considered to be key biological processes in WAT.
Furthermore, the top 20 significant KEGG pathways were identified
by KOBAS online software (Fig.
2C). The highest statistical significance was displayed by the
adenine monophosphate-activated protein kinase (AMPK) signaling
pathway, which was simultaneously considered as the central pathway
according to the exchanges among the pathways (Fig. 2D). Therefore, the AMPK signaling
pathway is considered to be a key pathway in WAT.
PPI network analysis and module
screening
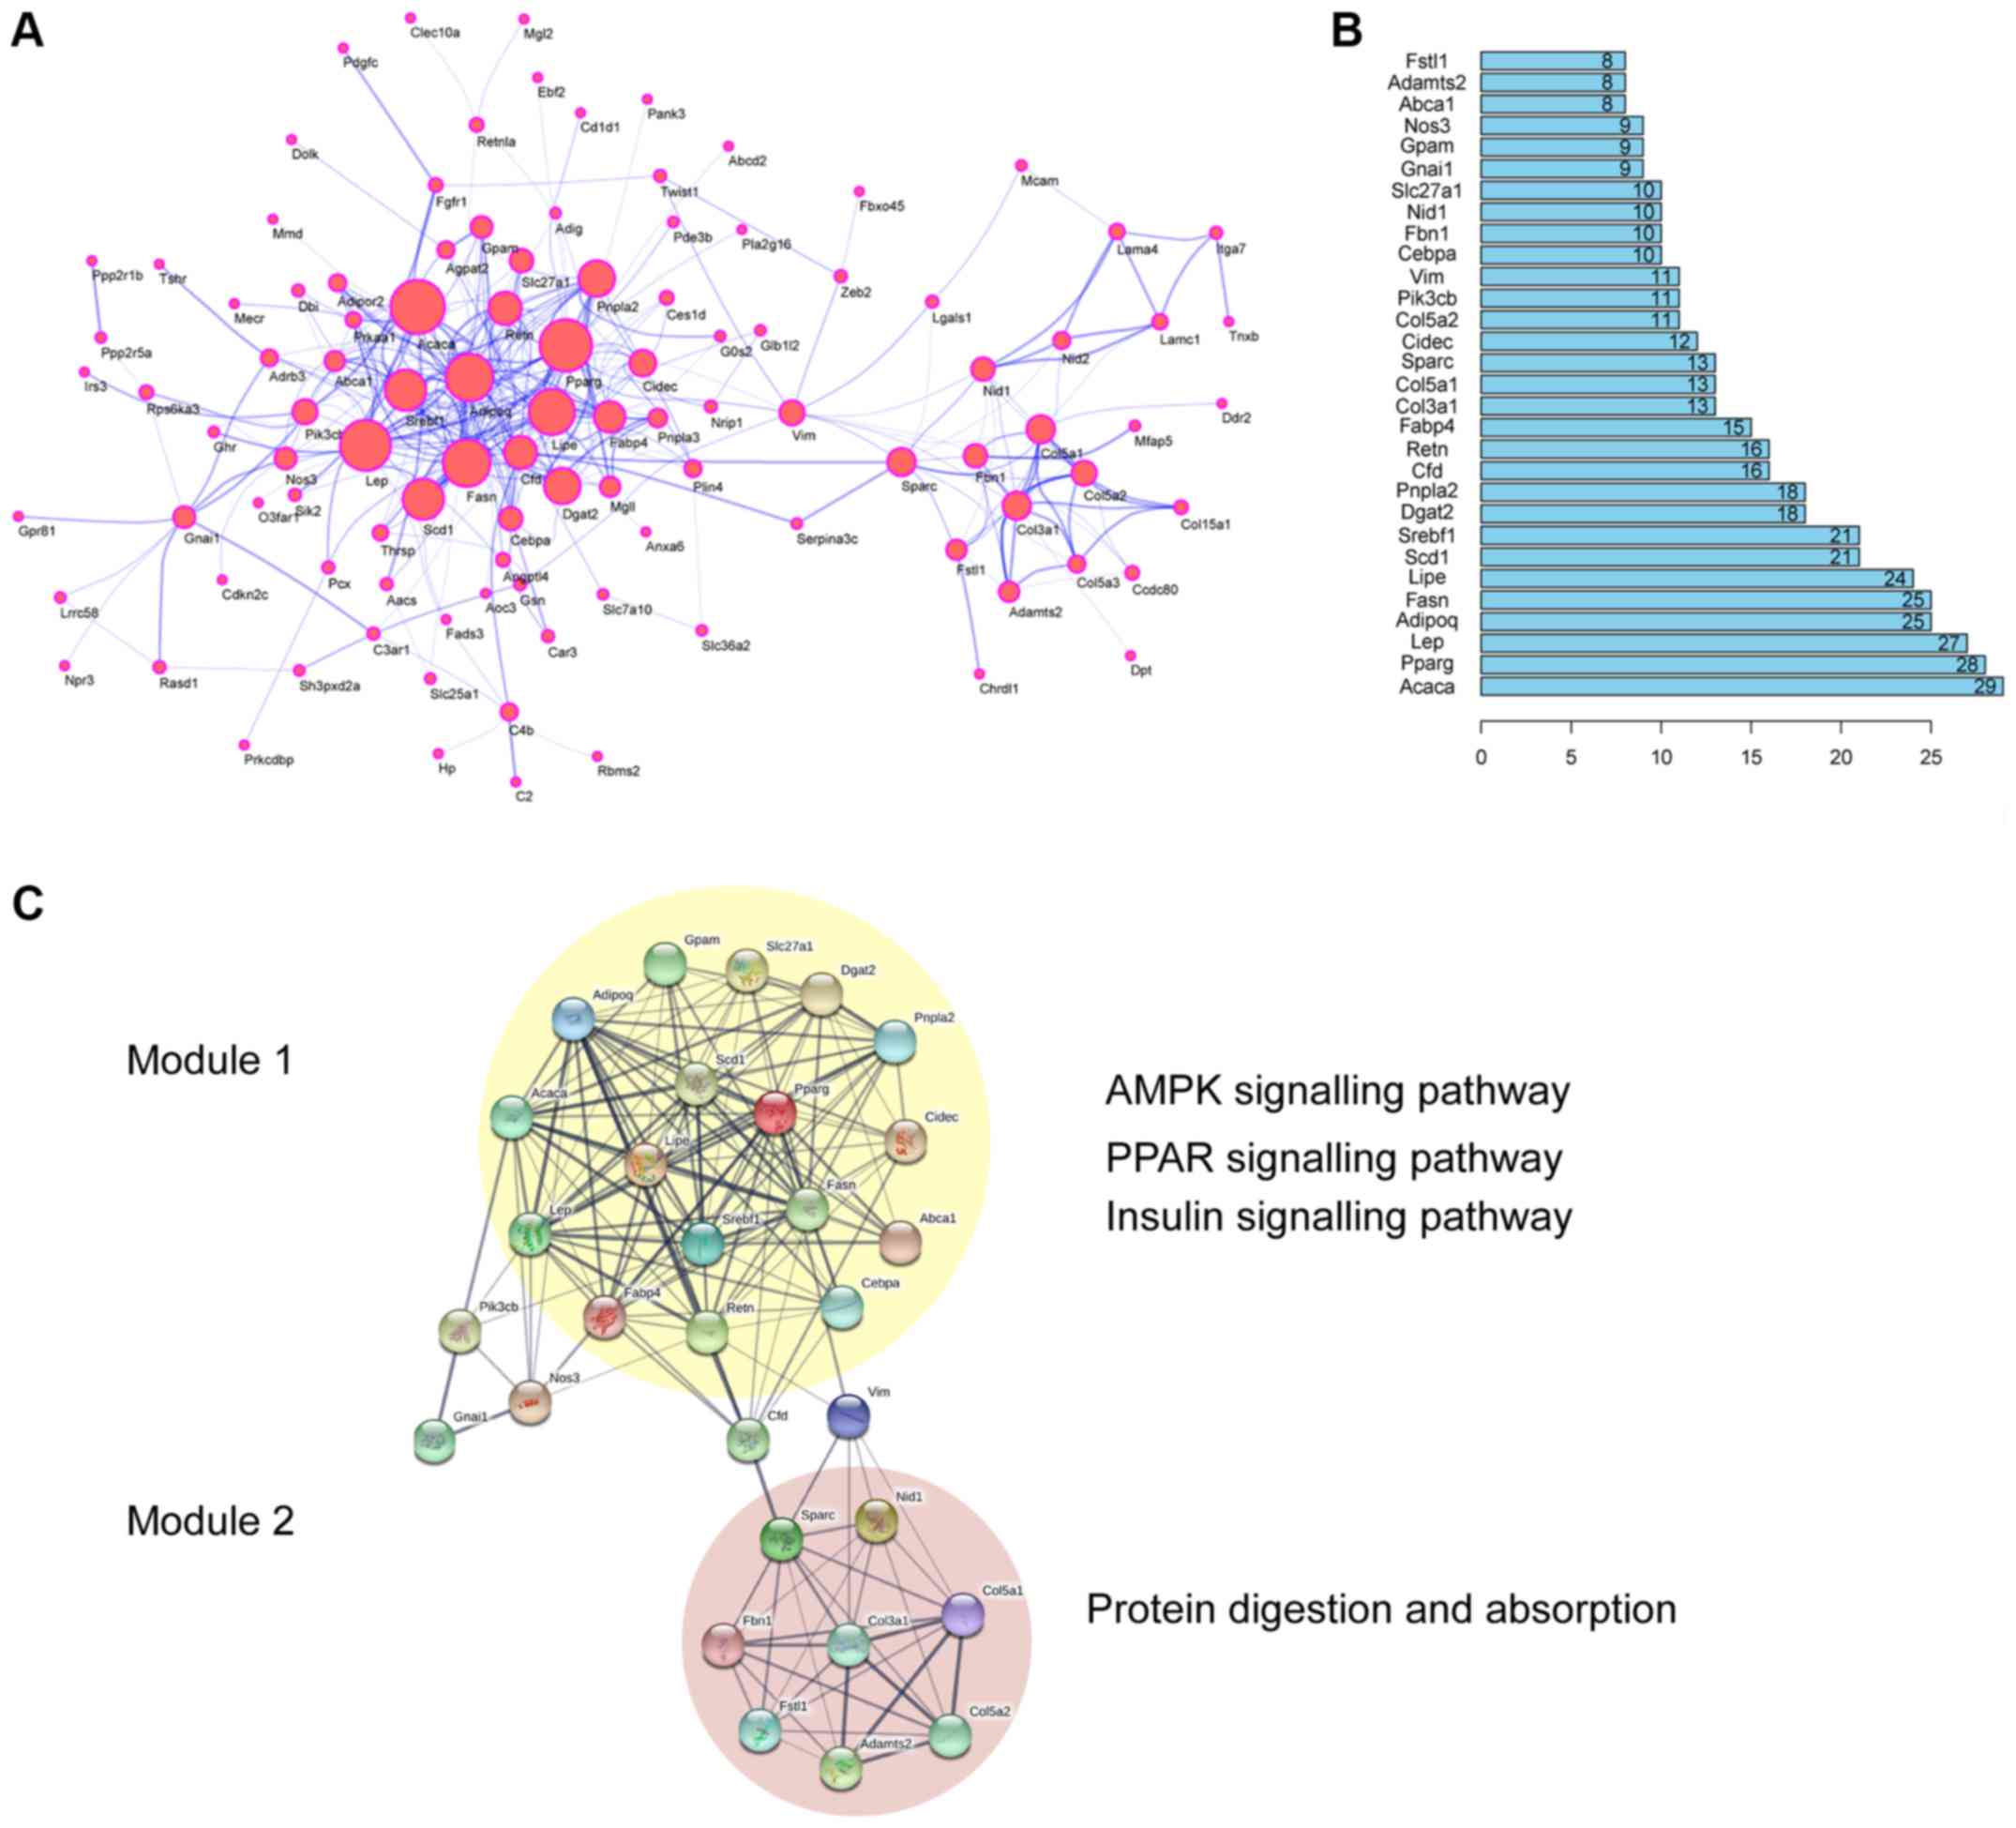
The adipose-specific genes were uploaded to the
STRING database, and a total of 118 nodes and 336 edges were
obtained with a combined score of >0.4 (Fig. 3A). Acaca was the hub gene in the
PPI network, exhibiting the highest node degree (Fig. 3B). Further analysis of the top 30
genes using the MCODE plug-in revealed two significant modules:
Module 1 (consisting of 17 genes) and module 2 (consisting of 8
genes) (Fig. 3C). Through KEGG
pathway analysis, module 1 was found to be significantly enriched
for the AMPK, PPAR and insulin signaling pathways, and module 2 was
found to be significantly enriched in protein digestion and
absorption. Notably, the top 13 genes (76% of module 1 genes)
exhibiting the highest degrees in the PPI network were all
classified into module 1. This analysis demonstrated that module 1
was the core cluster in WAT, and that the key genes in WAT included
17 genes from module 1. These genes were Acaca, Pparg, Lep, Adipoq,
Fasn, lipase (Lipe), sterol regulatory element-binding
transcription factor 1 (Srebf1), diacylglycerol O-acyltransferase 2
(Dgat2), patatin-like phospholipase domain containing 2 (Pnpla2),
complement factor D (Cfd), resistin (Retn), fatty acid-binding
protein 4 (Fabp4), cell death-inducing DFFA-like effector c
(Cidec), CCAAT/enhancer-binding protein α (Cebpa), solute carrier
family 27 member 1 (Slc27a1), glycerol-3-phosphate acyltransferase
mitochondrial (Gpam), and ATP-binding cassette sub-family A member
1 (Abca1).
Co-expression network analysis
In the aforementioned analysis, the key genes in WAT
were screened based on STRING database. However, in order to
determine whether other key candidate genes were excluded from
these results, co-expression analysis of the adipose-specific genes
in the 58 tissue samples from 18 types of mouse tissues was further
performed using the WGCNA package of the R programming language.
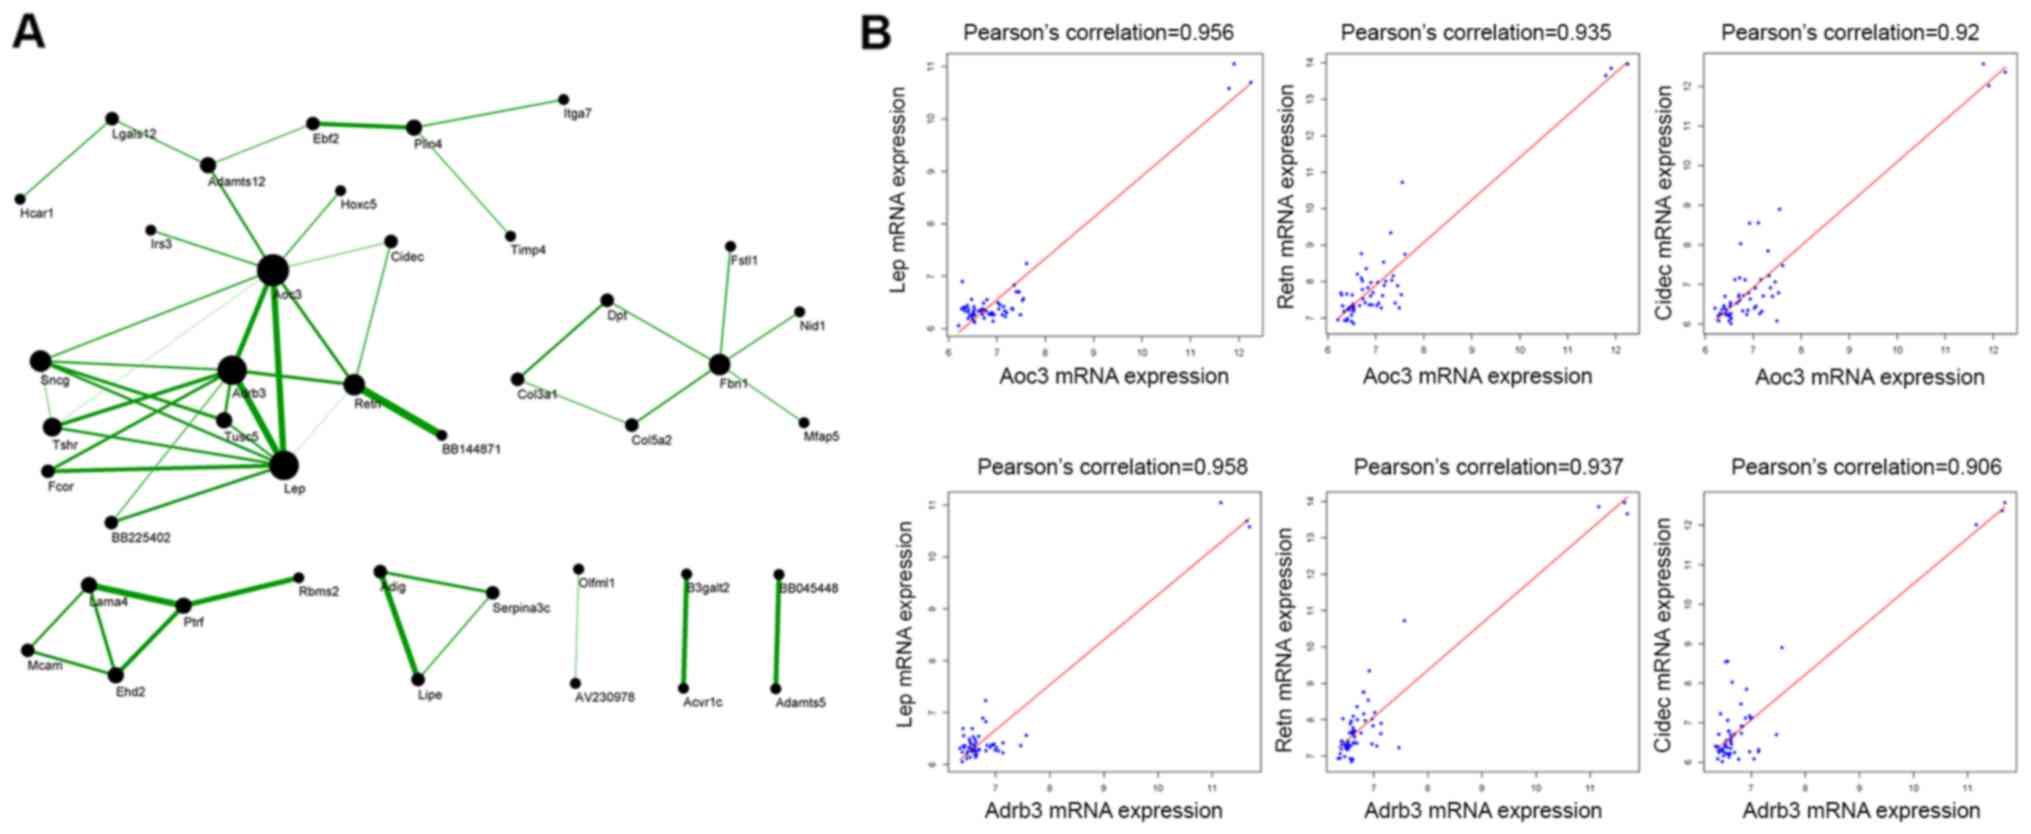
Next, a co-expression network was constructed and visualized using
Cytoscape software, according to the weight between the genes
(Fig. 4A). Amine oxidase copper
containing 3 (Aoc3) and adrenoceptor beta 3 (Adrb3) were the top 2
highly connected nodes in the network according to the number of
co-expressed genes. Furthermore, Aoc3 was strongly positively
correlated with the key genes Lep (Pearson's correlation
coefficient: r=0.956), Retn (r=0.935) and Cidec (r=0.92), while a
strong positive correlation of Adrb3 with Lep (r=0.958), Retn
(r=0.937) and Cidec (r=0.906) was also observed (Fig. 4B). These results suggested that
Aoc3 and Adrb3 may serve an important role in WAT development, and
thus these two genes may be potential key candidate genes in
WAT.
Discussion
In the present study, to accurately investigate the
underlying molecular mechanisms of WAT, 202 adipose-specific genes
were identified through comparative transcriptome analysis of
multiple tissues. The expression level of these genes was found to
be higher in adipose tissue as compared with that in the 17 other
tissue types examined. This gene set contains numerous well-known
adipose marker genes, such as Acaca, Pparg, Lep, Adipoq and Fasn.
In addition, several other genes were identified, of which the role
in fat has not been widely reported, such as Adamts2, Fstl1, Fbn1
and Sparc. Subsequent analysis was based on the 202
adipose-specific genes.
Process and pathway enrichment analyses were also
performed for the adipose-specific genes in the current study. In
WAT, the key biological processes are fat cell differentiation and
lipid metabolic process, while the AMPK signaling pathway is the
key pathway involved. During WAT development, fat cell
differentiation confers adipocytes and adipose tissue with the
typical functional properties associated with systemic metabolism
(26). Preadipocytes confer
adipose tissue with permanent functional plasticity for adipose
expansion through transformation into differentiated adipocytes
(26). A series of transcription
factors cooperate with cell cycle proteins, manage adipogenic gene
expression and give rise to adipocyte development during
adipogenesis (27). In addition,
triacylglycerol synthesis and degradation-associated enzymes
acquire increasing activity and expression levels, triggered by a
cascade of transcription factors in the terminal phase of
differentiation (11). Glucose and
fatty acid transporters and insulin receptors also demonstrate
increased levels (11). Beyond the
classical energy storage form of adipocytes, the synthesis of
adipocyte-secreted hormones and cytokines confers adipocytes as
extremely distinctive endocrine cells, which serve an important
role in various physiological activities (9,26).
One distinct characteristic of adipogenesis is the evident change
in morphology from a fibroblastic to spherical shape. In mature
adipocytes, single large lipid droplets ultimately occupy most of
the cell volume, and the nuclei and cytoplasm are pushed to the
periphery. Thus, fat cell differentiation confers lipid metabolic
abilities, including energy storage and mobilization abilities,
upon WAT (22). As an important
regulator of energy metabolism in WAT, AMPK activation inhibits
fatty acid synthesis by downregulating key lipogenic enzymes
(28), while promoting free fatty
acid oxidation (29).
In order to explore key genes in WAT, the
construction of a PPI network of adipose-specific genes and further
analyses were conducted in the present study. It was observed that
Acaca, Pparg and Lep were hub nodes in the PPI network, and that
there were two modules in the PPI network. Module 1 exhibited more
highly interconnected nodes with higher significance, and was
predicted to be the core cluster maintaining WAT development and
performance. In addition, module 1 mainly involved the AMPK, PPAR
and insulin signaling pathways. The 17 genes included in module 1
are known to participate in the development and various functions
of WAT, including the transcriptional regulation of adipogenesis
(Pparg, Cebpa and Srebf1) (30),
endocrine functions of adipose tissue (Lep, Adipoq, Cfd, Retn and
Abca1) (31–33), de novo fatty acid synthesis
(Fasn and Acaca) (34), fatty acid
transport (Fabp4 and Slc27a1) (35,36),
triacylglycerol synthesis (Gpam, Dgat2 and Cidec) (37–39),
and lipolysis and its regulation (Lipe and Pnpla2) (40). Based on the aforementioned results,
the 17 key genes identified stand out and are reliable, as
demonstrated by further screening of the node degrees and MCODE
modules of the PPI network.
The STRING database contains known and predicted
interactions between proteins based on experiments, text mining,
database contents and bioinformatics methods. Therefore, the
current study next investigated whether there were any other key
genes in addition to these 17 key genes that were overlooked due to
their lack of priority in the STRING PPI network. To identify other
key candidate genes, a co-expression analysis of adipose-specific
genes was performed using the expression data from 58 samples from
18 mouse tissues. The results revealed that Aoc3 and Adrb3 were
communication hubs in the co-expression network. In particular,
Aoc3 and Adrb3 were strongly positively correlated with the key
genes Lep, Retn and Cidec. Thus, artificially altering the
expression levels of Aoc3 and Adrb3, as highly connected hubs, may
influence the expression patterns of numerous other
adipose-specific genes or communicate changes that occur elsewhere
in the co-expression network, leading to the dysfunction of adipose
tissue. The Aoc3 gene encodes the enzyme vascular adhesion protein
(VAP-1), which is a member of the semicarbazide-sensitive amine
oxidase family and primarily localizes to the cell surface on the
adipocyte plasma membrane (41).
VAP-1 is associated with a number of vascular diseases (42), and may be involved in adipogenesis
and obesity (43). Furthermore,
the Adrb3 gene encodes a beta-adrenergic receptor that responds to
noradrenaline and mediates lipolysis in adipocytes (44). Trp64Arg (rs 4994), a single
nucleotide polymorphism of Adrb3, is associated with glucose
homeostasis, insulin sensitivity and obesity (45). Based on the aforementioned
information, it can be suggested that Aoc3 and Adrb3 may be key
candidate genes for the function of WAT.
In conclusion, 202 adipose specific genes were
identified in the current study by systematic comparative analysis
of multiple tissues at the transcriptome level. Several well-known
genes, as well as other genes with few studies reporting their role
in fat, were identified. Thus, the present study provided an
important target list for future WAT development studies.
Subsequently, the function of these genes as a whole was examined
by functional enrichment analysis, and construction of PPI and
co-expression networks. Key processes, pathways and genes that may
serve vital roles in the development and physiological function of
WAT were identified. Taken together, the current study indicated
several helpful targets for future research into the molecular
mechanisms and potential diagnostic biomarkers of
obesity-associated diseases caused by adipose dysfunction. However,
further experiments at the molecular and cellular levels are
required to verify the function of the identified genes.
Acknowledgements
Not applicable.
Funding
The present study was supported by grants from the
National Science and Technology Support Projects (no.
2015BAD03B04), the National Beef Yak Industry Technology System
(no. CARS-37), and the Major Agricultural Science and Technology
Innovation and Transformation Plan in Shaanxi Province (no.
NYKJ-2016-06).
Availability of data and materials
All data generated or analyzed during this study are
included in the published article.
Author's contributions
LZ, SZ and LW conceived and designed the study. SZ
performed data analysis and wrote the manuscript. The data analysis
in this study was largely provided by LW, who also provided
constructive suggestions for the manuscript and language
modification.
Ethics approval and consent to
participate
Not applicable.
Patient consent for publication
Not applicable.
Competing interests
The authors declare that they have no competing
interests.
Glossary
Abbreviations
Abbreviations:
|
WAT
|
white adipose tissue
|
|
GEO
|
Gene Expression Omnibus
|
|
DEGs
|
differentially expressed genes
|
|
KEGG
|
Kyoto Encyclopedia of Genes and
Genomes
|
|
GO
|
Gene Ontology
|
|
PPI
|
protein-protein interaction
|
|
MCODE
|
molecular complex detection
|
|
WGCNA
|
weighted gene co-expression network
analysis
|
|
Acaca
|
acetyl-CoA carboxylase α
|
|
Pparg
|
peroxisome proliferator-activated
receptor γ
|
|
Lep
|
leptin
|
|
Fasn
|
fatty acid synthase
|
|
AMPK
|
adenine monophosphate-activated
protein kinase
|
|
Retn
|
resistin
|
|
Cidec
|
cell death-inducing DFFA-like effector
c
|
|
Slc27a1
|
solute carrier family 27 member 1
|
|
Aoc3
|
amine oxidase copper containing 3
|
|
Adrb3
|
adrenoceptor beta 3
|
|
VAP-1
|
enzyme vascular adhesion protein
|
References
|
1
|
World Health Organization. Obesity and
overweight. http://www.who.int/news-room/fact-sheets/detail/obesity-and-overweightMarch
8–2018
|
|
2
|
Hajer GR, van Haeften TW and Visseren FL:
Adipose tissue dysfunction in obesity, diabetes, and vascular
diseases. Eur Heart J. 29:2959–2971. 2008. View Article : Google Scholar : PubMed/NCBI
|
|
3
|
Oda E: Historical perspectives of the
metabolic syndrome. Clin Dermatol. 36:3–8. 2018. View Article : Google Scholar : PubMed/NCBI
|
|
4
|
Moreno-Navarrete JM and Fernández-Real JM:
Adipocyte differentiation. Adipose tissue biology. ‘Vol’. Springer;
pp. 69–90. 2017, View Article : Google Scholar
|
|
5
|
Ali AT, Hochfeld WE, Myburgh R and Pepper
MS: Adipocyte and adipogenesis. Eur J Cell Biol. 92:229–236. 2013.
View Article : Google Scholar : PubMed/NCBI
|
|
6
|
Spalding KL, Arner E, Westermark PO,
Bernard S, Buchholz BA, Bergmann O, Blomqvist L, Hoffstedt J,
Näslund E, et al: Dynamics of fat cell turnover in humans. Nature.
453:783–787. 2008. View Article : Google Scholar : PubMed/NCBI
|
|
7
|
Gustafson B, Hedjazifar S, Gogg S,
Hammarstedt A and Smith U: Insulin resistance and impaired
adipogenesis. Trends Endocrin Metab. 26:193–200. 2015. View Article : Google Scholar
|
|
8
|
Hirsch J and Batchelor B: Adipose tissue
cellularity in human obesity. Clin Endocrinol Metab. 5:299–311.
1976. View Article : Google Scholar : PubMed/NCBI
|
|
9
|
Ahima RS and Flier JS: Adipose tissue as
an endocrine organ. Trends Endocrinol Metab. 11:327–332. 2000.
View Article : Google Scholar : PubMed/NCBI
|
|
10
|
Ducharme NA and Bickel PE: Lipid droplets
in lipogenesis and lipolysis. Endocrinology. 149:942–949. 2008.
View Article : Google Scholar : PubMed/NCBI
|
|
11
|
Gregoire FM, Smas CM and Sul HS:
Understanding adipocyte differentiation. Physiol Rev. 78:783–809.
1998. View Article : Google Scholar : PubMed/NCBI
|
|
12
|
Barrett T, Suzek TO, Troup DB, Wilhite SE,
Ngau WC, Ledoux P, Rudnev D, Lash AE, Fujibuchi W and Edgar R: NCBI
GEO: Mining millions of expression profiles-database and tools.
Nucleic Acids Res. 33:(Database Issue). D562–D566. 2005. View Article : Google Scholar : PubMed/NCBI
|
|
13
|
Kaplan S, Boztepe S and Arikoglu H: The
potential of microarray databases to identify tissue specific
genes. Kafkas Univ Vet Fak. 22:29–35. 2016.
|
|
14
|
Ullah M, Stich S, Häupl T, Eucker J,
Sittinger M and Ringe J: Reverse differentiation as a gene
filtering tool in genome expression profiling of adipogenesis for
fat marker gene selection and their analysis. PLoS One.
8:e697542013. View Article : Google Scholar : PubMed/NCBI
|
|
15
|
Fujioka S, Matsuzawa Y, Tokunaga K,
Kawamoto T, Kobatake T, Keno Y, Kotani K, Yoshida S and Tarui S:
Improvement of glucose and lipid metabolism associated with
selective reduction of intra-abdominal visceral fat in
premenopausal women with visceral fat obesity. Int J Obes.
15:853–859. 1991.PubMed/NCBI
|
|
16
|
Thorrez L, Van Deun K, Tranchevent LC, Van
Lommel L, Engelen K, Marchal K, Moreau Y, Van Mechelen I and Schuit
F: Using ribosomal protein genes as reference: A tale of caution.
PLoS One. 3:e18542008. View Article : Google Scholar : PubMed/NCBI
|
|
17
|
Hastie T, Tibshirani R, Narasimhan B and
Chu G: Impute: Imputation for microarray data. Bioinformatics.
17:520–525. 2001.PubMed/NCBI
|
|
18
|
Ritchie ME, Phipson B, Wu D, Hu Y, Law CW,
Shi W and Smyth GK: limma powers differential expression analyses
for RNA-sequencing and microarray studies. Nucleic Acids Res.
43:e472015. View Article : Google Scholar : PubMed/NCBI
|
|
19
|
Tripathi S, Pohl MO, Zhou Y,
Rodriguez-Frandsen A, Wang G, Stein DA, Moulton HM, DeJesus P, Che
J, Mulder LC, et al: Meta- and orthogonal integration of influenza
‘OMICs’ data defines a role for UBR4 in virus budding. Cell Host
Microbe. 18:723–735. 2015. View Article : Google Scholar : PubMed/NCBI
|
|
20
|
Wu J, Mao X, Cai T, Luo J and Wei L: KOBAS
server: A web-based platform for automated annotation and pathway
identification. Nucleic Acids Res. 34:W720–W724. 2006. View Article : Google Scholar : PubMed/NCBI
|
|
21
|
Xie C, Mao X, Huang J, Ding Y, Wu J, Dong
S, Kong L, Gao G, Li CY and Wei L: KOBAS 2.0: A web server for
annotation and identification of enriched pathways and diseases.
Nucleic Acids Res. 39:W316–W322. 2011. View Article : Google Scholar : PubMed/NCBI
|
|
22
|
Franceschini A, Szklarczyk D, Frankild S,
Kuhn M, Simonovic M, Roth A, Lin J, Minguez P, Bork P, von Mering C
and Jensen LJ: STRING v9.1: Protein-protein interaction networks,
with increased coverage and integration. Nucleic Acids Res.
41:(Database Issue). D808–D815. 2013. View Article : Google Scholar : PubMed/NCBI
|
|
23
|
Shannon P, Markiel A, Ozier O, Baliga NS,
Wang JT, Ramage D, Amin N, Schwikowski B and Ideker T: Cytoscape: A
software environment for integrated models of biomolecular
interaction networks. Genome Res. 13:2498–2504. 2003. View Article : Google Scholar : PubMed/NCBI
|
|
24
|
Bader GD and Hogue CW: An automated method
for finding molecular complexes in large protein interaction
networks. BMC Bioinformatics. 4:22003. View Article : Google Scholar : PubMed/NCBI
|
|
25
|
Langfelder P and Horvath S: WGCNA: An R
package for weighted correlation network analysis. BMC
Bioinformatics. 9:5592008. View Article : Google Scholar : PubMed/NCBI
|
|
26
|
Vázquez-Vela ME, Torres N and Tovar AR:
White adipose tissue as endocrine organ and its role in obesity.
Arch Med Res. 39:715–728. 2008. View Article : Google Scholar : PubMed/NCBI
|
|
27
|
Rosen ED, Walkey CJ, Puigserver P and
Spiegelman BM: Transcriptional regulation of adipogenesis. Genes
Dev. 14:1293–1307. 2000.PubMed/NCBI
|
|
28
|
Fernández-Galilea M, Pérez-Matute P,
Prieto-Hontoria PL, Sáinz N, López-Yoldi M, Houssier M, Martínez
JA, Langin D and Moreno-Aliaga MJ: α-lipoic acid reduces fatty acid
esterification and lipogenesis in adipocytes from overweight/obese
subjects. Obesity (Silver Spring). 22:2210–2215. 2014. View Article : Google Scholar : PubMed/NCBI
|
|
29
|
Minokoshi Y, Kim YB, Peroni OD, Fryer LG,
Müller C, Carling D and Kahn BB: Leptin stimulates fatty-acid
oxidation by activating AMP-activated protein kinase. Nature.
415:339–343. 2002. View
Article : Google Scholar : PubMed/NCBI
|
|
30
|
Rosen ED and MacDougald OA: Adipocyte
differentiation from the inside out. Nat Rev Mol Cell Biol.
7:885–896. 2006. View
Article : Google Scholar : PubMed/NCBI
|
|
31
|
Song NJ, Kim S, Jang BH, Chang SH, Yun UJ,
Park KM, Waki H, Li DY, Tontonoz P and Park KW: Small
molecule-induced complement factor D (Adipsin) promotes lipid
accumulation and adipocyte differentiation. PLoS One.
11:e1622282016.
|
|
32
|
Meier U and Gressner AM: Endocrine
regulation of energy metabolism: Review of pathobiochemical and
clinical chemical aspects of leptin, ghrelin, adiponectin, and
resistin. Clin Chem. 50:1511–1525. 2004. View Article : Google Scholar : PubMed/NCBI
|
|
33
|
Damen MSMA, Dos Santos JC, Hermsen R, Adam
van der Vliet J, Netea MG, Riksen NP, Dinarello CA, Joosten LAB and
Heinhuis B: Interleukin-32 upregulates the expression of ABCA1 and
ABCG1 resulting in reduced intracellular lipid concentrations in
primary human hepatocytes. Atherosclerosis. 271:193–202. 2018.
View Article : Google Scholar : PubMed/NCBI
|
|
34
|
Tanos R, Murray IA, Smith PB, Patterson A
and Perdew GH: Role of the Ah receptor in homeostatic control of
fatty acid synthesis in the liver. Toxicol Sci. 129:372–379. 2012.
View Article : Google Scholar : PubMed/NCBI
|
|
35
|
Stahl A: A current review of fatty acid
transport proteins (SLC27). Pflugers Arch. 447:722–727. 2004.
View Article : Google Scholar : PubMed/NCBI
|
|
36
|
Hertzel AV and Bernlohr DA: The mammalian
fatty acid-binding protein multigene family: Molecular and genetic
insights into function. Trends Endocrinol Metab. 11:175–180. 2000.
View Article : Google Scholar : PubMed/NCBI
|
|
37
|
Smith SJ, Cases S, Jensen DR, Chen HC,
Sande E, Tow B, Sanan DA, Raber J, Eckel RH and Farese RV Jr:
Obesity resistance and multiple mechanisms of triglyceride
synthesis in mice lacking Dgat. Nat Genet. 25:87–90. 2000.
View Article : Google Scholar : PubMed/NCBI
|
|
38
|
Takeuchi K and Reue K: Biochemistry,
physiology, and genetics of GPAT, AGPAT, and lipin enzymes in
triglyceride synthesis. Am J Physiol Endocrinol Metab.
296:E1195–E1209. 2009. View Article : Google Scholar : PubMed/NCBI
|
|
39
|
Li Y, Kang H, Chu Y, Jin Y, Zhang L, Yang
R, Zhang Z, Zhao S and Zhou L: Cidec differentially regulates lipid
deposition and secretion through two tissue-specific isoforms.
Gene. 641:265–271. 2018. View Article : Google Scholar : PubMed/NCBI
|
|
40
|
Reilich P, Horvath R, Krause S, Schramm N,
Turnbull DM, Trenell M, Hollingsworth KG, Gorman GS, Hans VH,
Reimann J, et al: The phenotypic spectrum of neutral lipid storage
myopathy due to mutations in the PNPLA2 gene. J Neurol.
258:1987–1997. 2011. View Article : Google Scholar : PubMed/NCBI
|
|
41
|
Hernandez-Guillamon M, Solé M, Delgado P,
García- Bonilla L, Giralt D, Boada C, Penalba A, García S, Flores
A, Ribó M, et al: VAP-1/SSAO plasma activity and brain expression
in human hemorrhagic stroke. Cerebrovasc Dis. 33:55–63. 2012.
View Article : Google Scholar : PubMed/NCBI
|
|
42
|
Schilter HC, Collison A, Russo RC, Foot
JS, Yow TT, Vieira AT, Tavares LD, Mattes J, Teixeira MM and
Jarolimek W: Effects of an anti-inflammatory VAP-1/SSAO inhibitor,
PXS-4728A, on pulmonary neutrophil migration. Resp Res. 16:422015.
View Article : Google Scholar
|
|
43
|
Bour S, Daviaud D, Gres S, Lefort C,
Prévot D, Zorzano A, Wabitsch M, Saulnier-Blache J, Valet P and
Carpéné C: Adipogenesis-related increase of semicarbazide-sensitive
amine oxidase and monoamine oxidase in human adipocytes. Biochimie.
89:916–925. 2007. View Article : Google Scholar : PubMed/NCBI
|
|
44
|
Manolio TA, Collins FS, Cox NJ, Goldstein
DB, Hindorff LA, Hunter DJ, McCarthy MI, Ramos EM, Cardon LR,
Chakravarti A, et al: Finding the missing heritability of complex
diseases. Nature. 461:747–753. 2009. View Article : Google Scholar : PubMed/NCBI
|
|
45
|
Nakashima H, Omae K, Nomiyama T, Yamano Y,
Takebayashi T and Sakurai Y: Beta-3-adrenergic receptor Trp64Arg
polymorphism: Does it modulate the relationship between exercise
and percentage of body fat in young adult Japanese males? Environ
Health Prev Med. 18:323–329. 2013. View Article : Google Scholar : PubMed/NCBI
|