Introduction
Ankylosing spondylitis (AS) is a common inflammatory
rheumatic disease, with an estimated prevalence (per 10,000) of
23.8 in Europe, 16.7 in Asia, 31.9 in North America, 10.2 in Latin
America and 7.4 in Africa (1). AS
mainly affects the spine and sacroiliac joints in the pelvis to
cause low back pain, stiffness and functional disability, which
seriously influence the quality of life of patients and impose a
heavy economic burden on both family and society (2). Therefore, there is a need for the
timely diagnosis and effective treatment of AS.
Although the pathogenesis remains not clearly
defined, accumulating evidence has suggested that AS is highly
heritable. Human leukocyte antigen (HLA)-B27, a class I surface
antigen encoded by B locus in the major histocompatibility complex
(MHC) on the short (p) arm of chromosome 6, is one of the
convincing genetic factors associated with AS (3). HLA-B27 was reported to be present in
94.3% of patients with AS, but only 9.34% in organ donors (4). The expression of HLA-B27 was
found to be significantly higher in patients with AS than that in
healthy subjects (5).
Meta-analyses indicated that HLA-B27 genetic polymorphism
B2704 and B2702 may be risk factors, while B2703, B2706, B2707,
B2727, B2729 and B2747 may be protective factors for AS (6,7).
HLA-B27-positive patients had a significantly younger age at
symptom onset, more uveitis, and a higher frequency of peripheral
and hip joint involvement than HLA-B27-negative patients (7,8).
Thus, HLA-B27 has been the most commonly used biomarker for
the diagnosis of AS (9). However,
twin and family studies suggest that HLA-B27 only can
explain less than 30% of the overall risk for AS (10,11),
meaning there are other genes related with the genetic disorder of
AS. Recently, scholars have also aimed to investigate other
inflammatory biomarkers for AS, including interleukin (IL)-8
(12), tumor necrosis factor
(TNF)-α (13), C-reactive
protein (hsCRP) (14) and
C-C motif chemokine 11 (CCL11) (15), but studies that have focused on the
genetic biomarkers are limited (16,17).
The aim of the present study was to integrate the
microarray data of mRNA and the single nucleotide polymorphism
(SNP) expression profile in whole blood of AS patients and healthy
controls to screen for differentially expressed genes (DEGs), and
those that also possess differential SNP loci, which has not been
previously performed. These SNP-related DEGs may be crucial genetic
biomarkers for AS.
Materials and methods
Microarray data
Three microarray datasets under accession nos.
GSE73754 (18), GSE25101 (19) and GSE39428 (20,21)
were downloaded from the Gene Expression Omnibus (GEO) database
(http://www.ncbi.nlm.nih.gov/geo/).
GSE73754 (platform: GPL10558; Illumina HumanHT-12 V4.0 expression
BeadChip) detected the gene expression profile in whole blood
samples from 52 AS and 20 healthy controls; GSE25101 (platform:
GPL6947; Illumina HumanHT-12 V3.0 expression BeadChip) compared the
gene expression profile in whole blood samples between 16 AS and 20
healthy controls; and GSE39428 (GPL15779; Illumina custom human SNP
VeraCode microarray) analyzed the SNPs in 384 genes of 51 AS and
163 healthy controls.
Data normalization
For the two expression data from the Illumina
platform, the TXT. data were downloaded and preprocessed using the
Linear Models for Microarray data (LIMMA) method (22) (version 3.34.0; http://www.bioconductor.org/packages/release/bioc/html/limma.html)
in the Bioconductor R package (version 3.4.1; http://www.R-project.org/), including base-2
logarithmic (log2) transformation and quantile normalization. The
SNP signal spectrum in the GSE39428 dataset was preprocessed using
hidden Markov model (HMM)-based program PennCNV (23) (version 1.0.4; http://penncnv.openbioinformatics.org/en/latest/),
including the following steps: i) the signal intensity of the A and
B alleles in each SNP were extracted and quantile normalized using
the quantile method; ii) the normalize_affy_geno_cluster.pl
procedure in the PennCNV package was used to calculate the Log R
ratio (LRR) and B allele frequency (BAF) in each SNP, resulting in
the generation of baf. files; the kcolumn.pl procedure in the
PennCNV package was utilized to split the baf. files to signal
intensity of single sample; the copy number variation (CNV) was
detected using the detect_cnv.pl procedure in the PennCNV
package.
Differential analysis of mRNAs and
SNPs
The DEGs between control and AS in the GSE73754 and
GSE25101 datasets were identified using the LIMMA method (22) based on the t-test where statistical
significance was set to |logFC(fold change)| >0.263 and
Benjamini and Hochberg adjusted (24) false discovery rate (FDR) <0.05.
Hierarchical clustering heatmap illustrating the expression
intensity and direction of the common DEGs in two mRNA datasets was
constructed using the pheatmap R package (version 1.0.8; http://cran.r-project.org/web/packages/pheatmap)
based on Euclidean distance. The differential SNPs were screened by
comparing the LRR between AS and controls by using the Student's
t-test. The genotype and allele frequencies of SNPs in DEGs between
AS and controls were also compared using the Chi-square test (or
Fisher's exact test), with P-value <0.05 set as the threshold
value.
PPI (protein-protein interaction)
network construction
The interaction pairs of the common DEGs were
retrieved from the STRING 10.0 (Search Tool for the Retrieval of
Interacting Genes; http://string
db.org/) database (25) and
then the PPI network was visualized using the Cytoscape software
(version 3.6.1; www.cytoscape.org/) (26). Four topological characteristics of
the genes in the PPI network, including degree [the number of edges
(interactions) of a node (protein)], betweenness centrality (BC,
the number of shortest paths that run through a node), closeness
centrality (CC, the average length of the shortest paths between
one node and any other node in the network) and average path length
(APL, the average of distances between all pairs of nodes), were
calculated using the CytoNCA plugin in Cytoscape software
(http://apps.cytoscape.org/apps/cytonca)
(27), the overlapped genes of the
top 35 in four parameters were suggested as crucial genes.
To identify functionally related and highly
interconnected clusters from the PPI network, module analysis was
carried out by using the Molecular Complex Detection (MCODE) plugin
of Cytoscape software under the followed parameters: Degree cutoff
=2, Node score cutoff =0.2 and K-core =2 (ftp://ftp.mshri.on.ca/pub/BIND/Tools/MCODE)
(28).
Function enrichment analysis
The underlying functions of common DEGs between two
mRNA datasets, genes in the PPI and modules enrichment analyses
were predicted using the Database for Annotation, Visualization and
Integrated Discovery (DAVID) online tool (version 6.8; http://david.abcc.ncifcrf.gov). P<0.05 was chosen
as the threshold to determine the significantly enriched Kyoto
Encyclopedia of Genes and Genomes (KEGG) pathways and Gene Ontology
(GO) terms which were visualized using R language.
Results
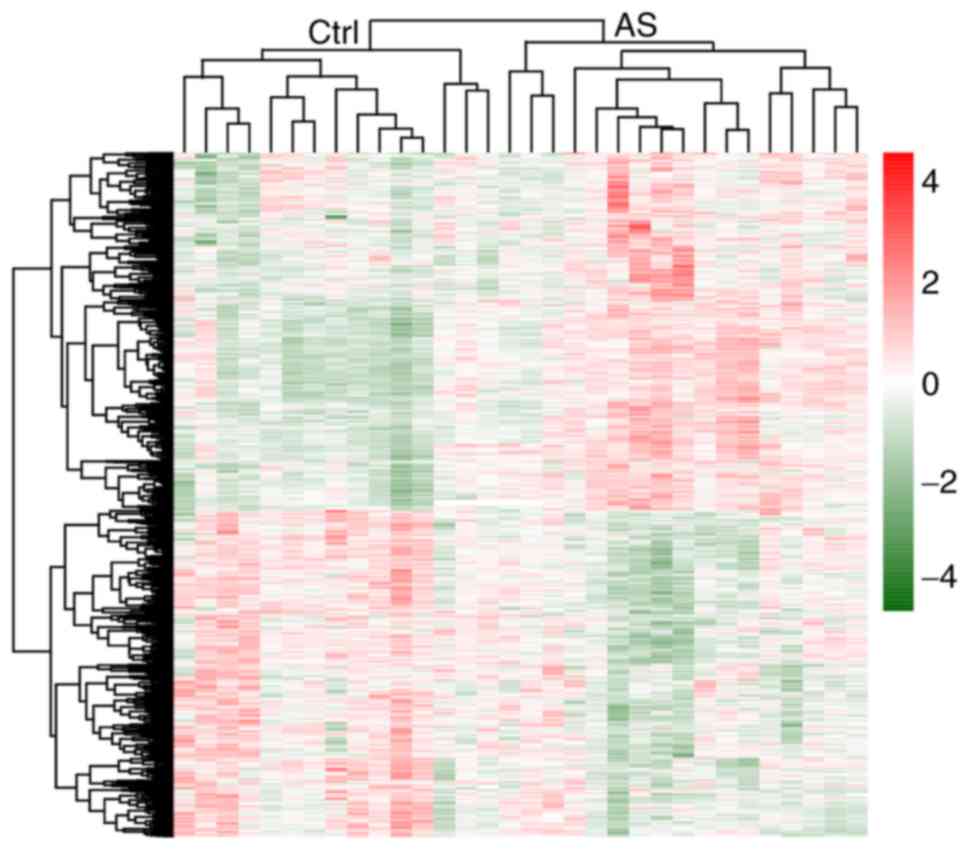
Identification of DEGs
Based on the threshold (FDR <0.05 and |logFC|
>0.263), a total of 1,056 and 1,073 DEGs were identified between
AS and controls for GSE73754 and GSE25101 datasets, respectively.
After comparison analysis, 105 upregulated and 129 downregulated
DEGs were found to be shared in both two datasets. The hierarchical
clustering heatmap suggested that these 234 common DEGs could well
distinguish AS from control samples (Fig. 1).
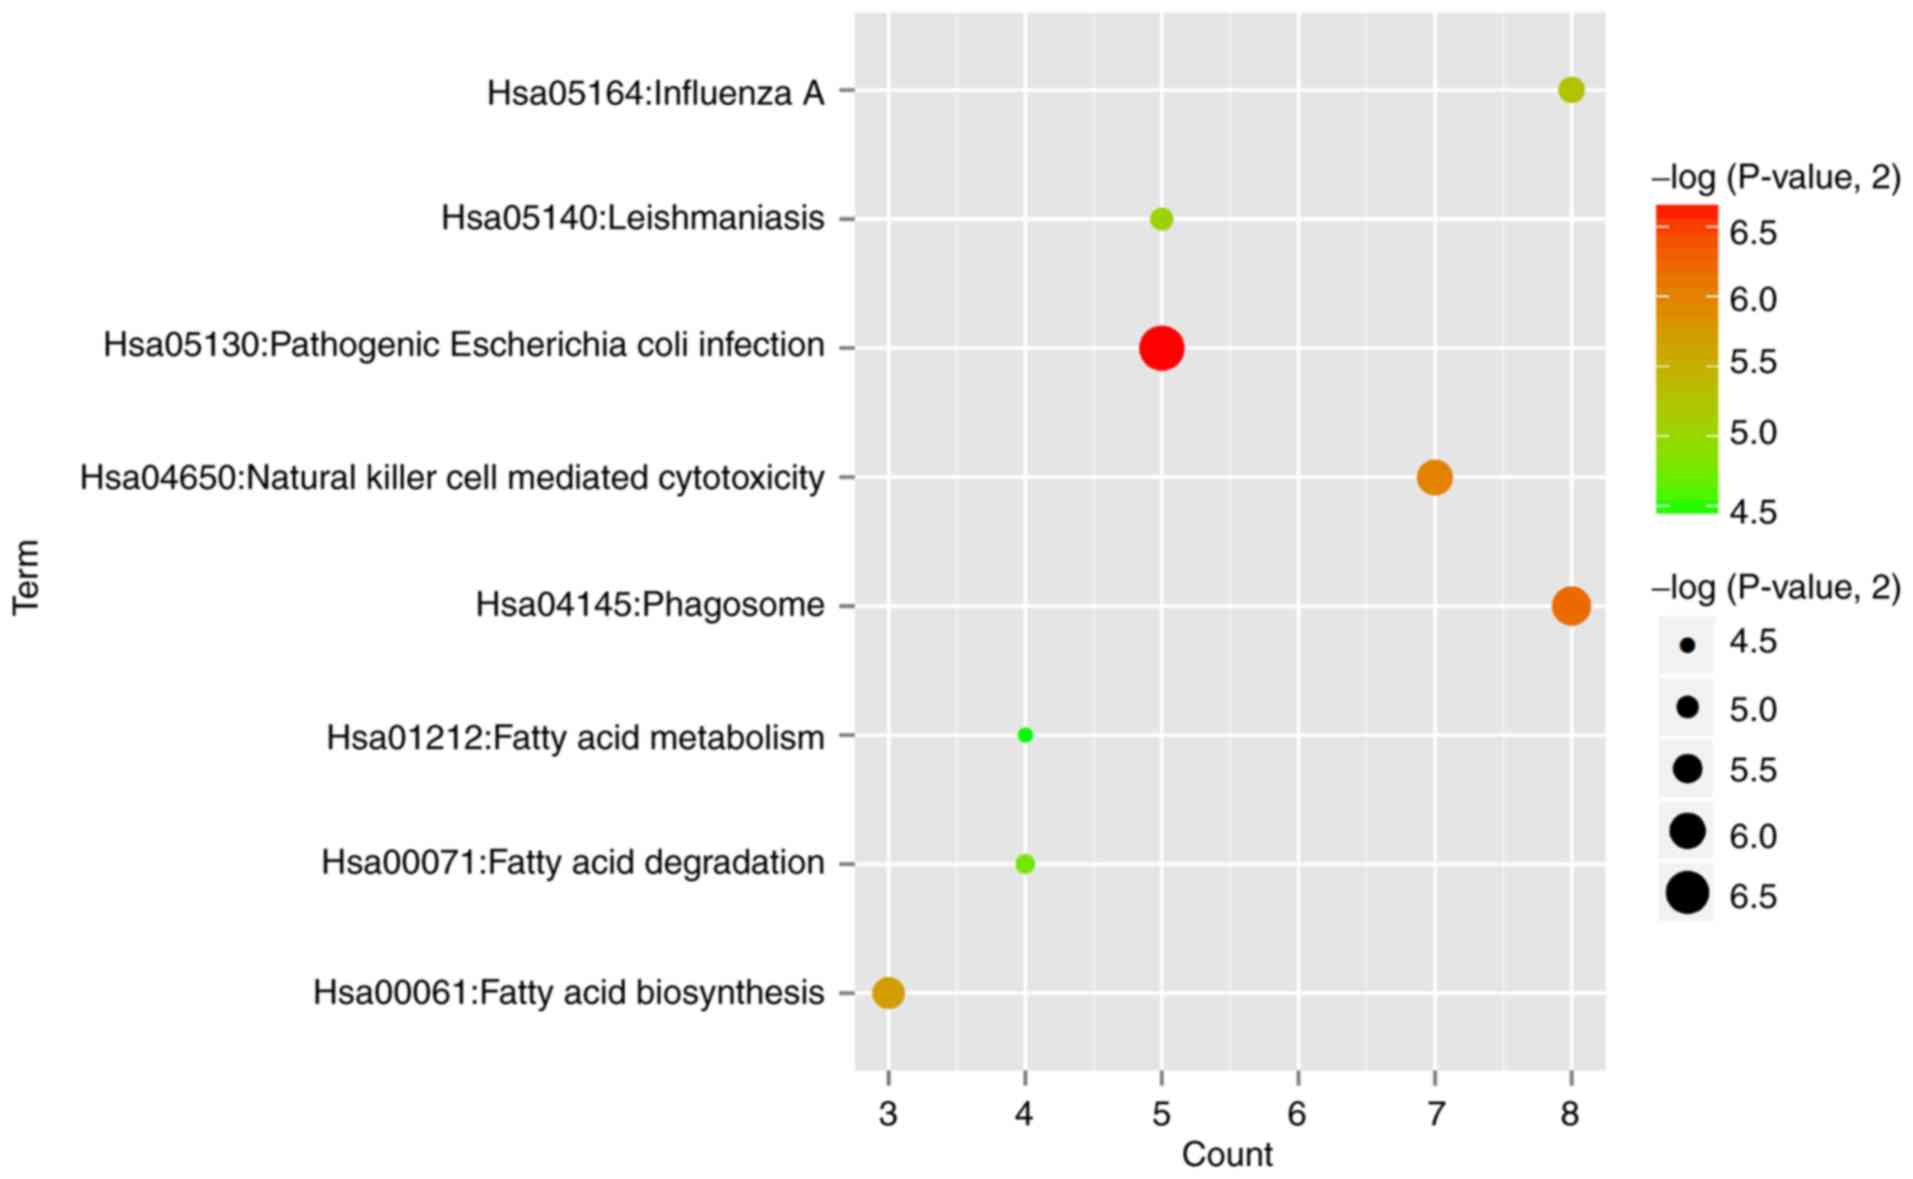
Function enrichment analysis for the
common DEGs
DAVID database was used to predict the underlying
functions of the common DEGs. The results showed that 8 significant
KEGG pathways (Fig. 2) were
enriched, such as hsa05130:Pathogenic Escherichia coli
infection (TLR4, toll like receptor 4) and
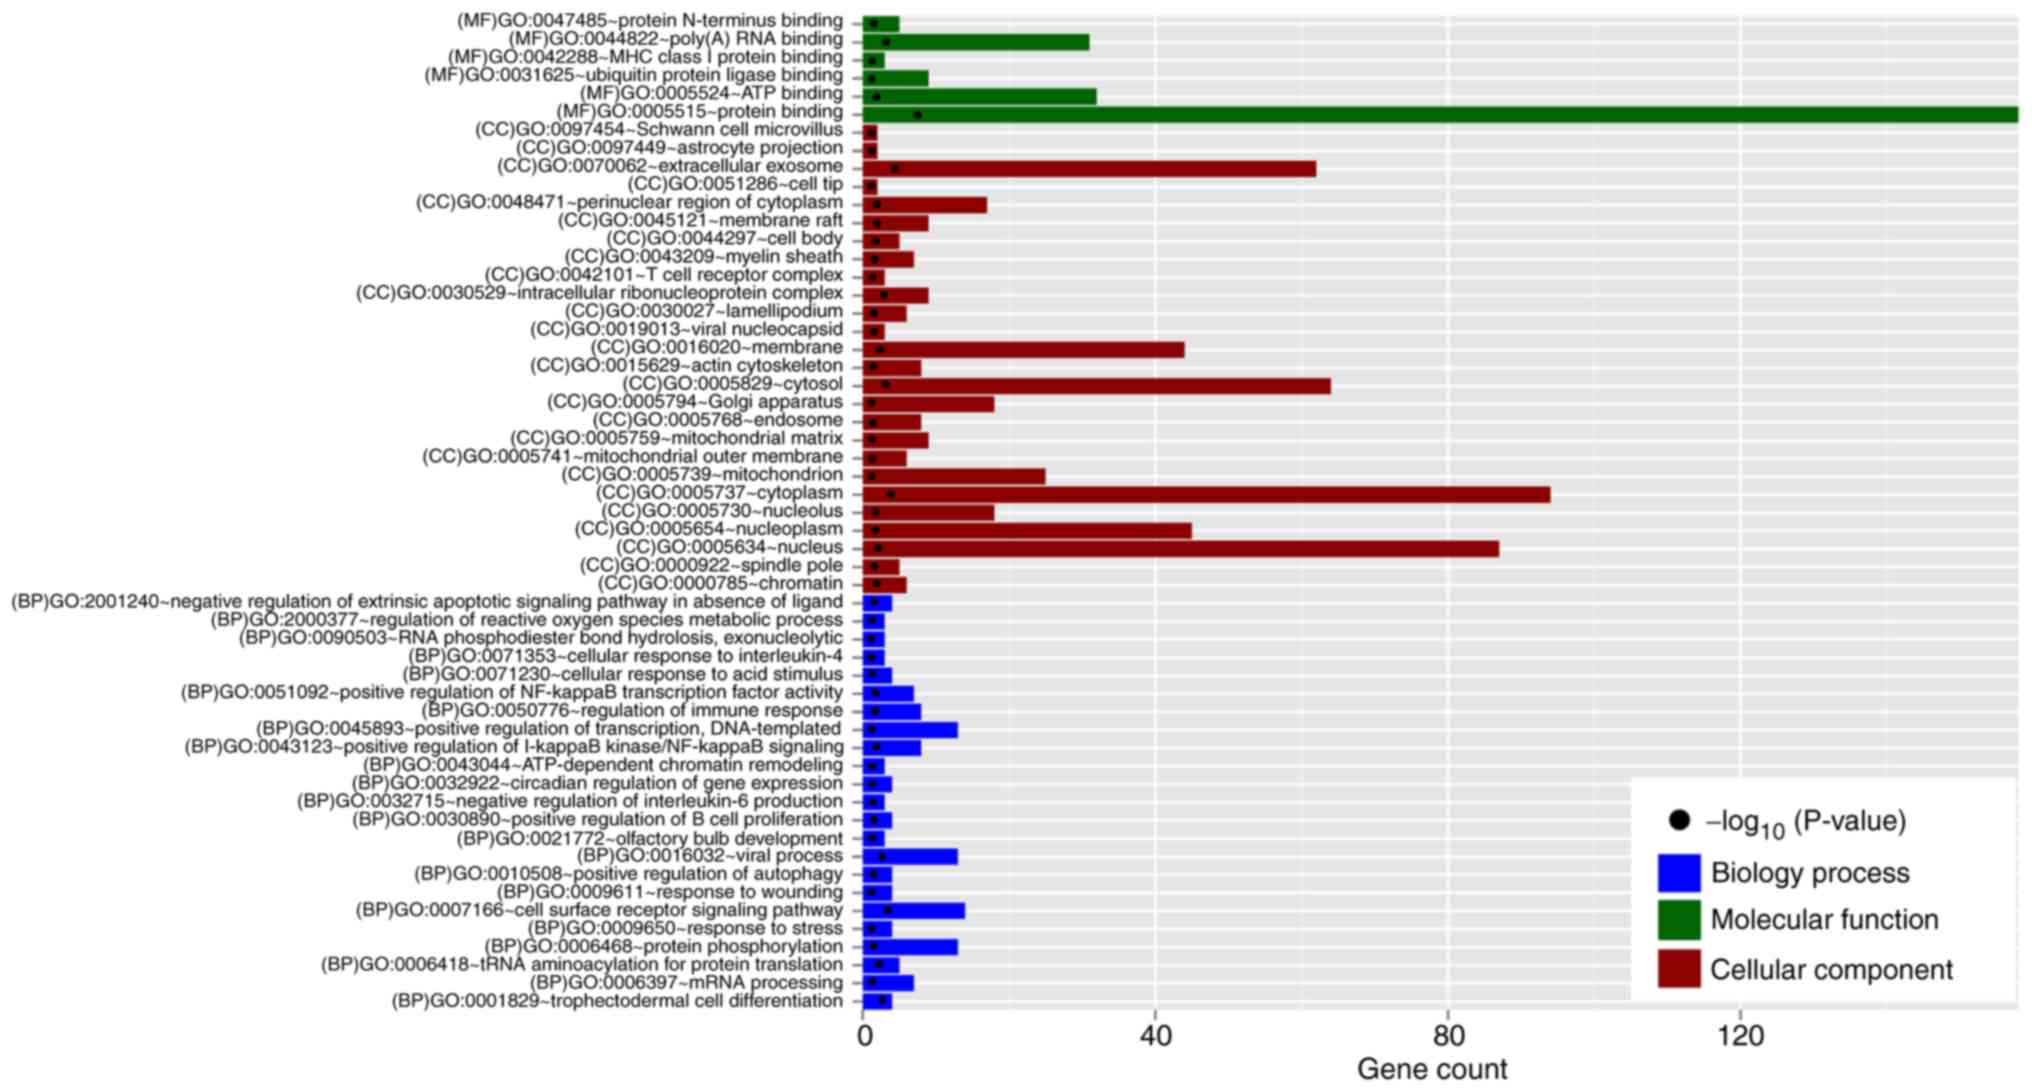
hsa04145:Phagosome (TLR4) (Table I). In addition, 23 significant GO
biological process (BP) terms including GO:0006418~tRNA
aminoacylation for protein translation (EEF1E1, eukaryotic
translation elongation factor 1 epsilon 1; YARS,
tyrosyl-tRNA synthetase), GO:0051092~positive regulation of NF-κB
transcription factor activity (TLR4), GO:0050776~regulation
of immune response (KLRD1, killer cell lectin like receptor
D1), and GO:0032715~negative regulation of interleukin-6 production
(TLR4); 6 significant GO molecular function (MF) terms,
consisting of GO:0005515~protein binding (SERPINA1, serpin
family A member 1; TLR4); and 6 significant GO molecular
function (MF), such as GO:0005515~protein binding (SERPINA1,
EEF1E1); 26 GO cell component (CC) terms, including
GO:0070062~extracellular exosome (SERPINA1, EEF1E1),
GO:0005737~cytoplasm (EEF1E1) and GO:0005829~cytosol
(EEF1E1); were enriched (Fig.
3 and Table I).
 | Table I.Function enrichment for the
differentially expressed genes between patients with ankylosing
spondylitis and controls. |
Table I.
Function enrichment for the
differentially expressed genes between patients with ankylosing
spondylitis and controls.
| Category | Term | P-value | Genes |
|---|
| KEGG_PATHWAY | hsa05130:Pathogenic
Escherichia coli infection | 9.97E-03 | ACTG1, TUBB,
EZR, TLR4, TUBA1B |
| KEGG_PATHWAY |
hsa04145:Phagosome | 1.36E-02 | ACTG1, TUBB,
NCF4, TLR4, FCGR2A, M6PR, TUBA1B, HLA-DRA |
| KEGG_PATHWAY | hsa04650:Natural
killer cell mediated cytotoxicity | 1.58E-02 | IFNAR2, TNFSF10,
TNF, CD247, KLRD1, SH2D1B, HCST |
| KEGG_PATHWAY | hsa00061:Fatty acid
biosynthesis | 1.90E-02 | ACSL1, FASN,
ACSL4 |
| KEGG_PATHWAY | hsa05164:Influenza
A | 2.56E-02 | ACTG1, IFNAR2,
TNFSF10, TNF, MAP2K4, TLR4, IVNS1ABP, HLA-DRA |
| KEGG_PATHWAY |
hsa05140:Leishmaniasis | 3.01E-02 | TNF, NCF4, TLR4,
FCGR2A, HLA-DRA |
| KEGG_PATHWAY | hsa00071:Fatty acid
degradation | 3.63E-02 | ACSL1, ECHS1,
ACSL4, ALDH9A1 |
| KEGG_PATHWAY | hsa01212:Fatty acid
metabolism | 4.52E-02 | ACSL1, FASN,
ECHS1, ACSL4 |
| GOTERM_BP_
DIRECT | GO:0007166~cell
surface receptor signaling pathway | 5.44E-05 | CD8A, CD247,
EVL, BIRC2, ADGRG1, IFNAR2, TNFSF10, ADRB2, KLRG1, NUP62, TDP2,
CD81, CDA, KLRD1 |
| GOTERM_BP_
DIRECT | GO:0006418~tRNA
aminoacylation for protein translation | 1.67E-03 | YARS, EEF1E1,
AARS, EPRS, QARS |
| GOTERM_BP_
DIRECT | GO:0043123~positive
regulation of I-kappaB kinase/NF-kappaB signaling | 4.76E-03 | CARD11, TNFSF10,
TNF, NUP62, PINK1, CXXC5, BIRC2, S100A12 |
| GOTERM_BP_
DIRECT | GO:0051092~positive
regulation of NF-kappaB transcription factor activity | 7.34E-03 | CARD11, IRAK3,
NLRC4, TNF, PRKCH, TLR4, S100A12 |
| GOTERM
BP_DIRECT_ |
GO:0050776~regulation of immune
response | 8.11E-03 | CARD11, CD96,
CD8A, CD247, CD81, KLRD1, SH2D1B, HCST |
| GOTERM_
BP_DIRECT | GO:2001240~negative
regulation of extrinsic apoptotic signaling pathway in absence of
ligand | 1.17E-02 | TNF, ZC3HC1,
MCL1, CX3CR1 |
| GOTERM_BP_
DIRECT | GO:0030890~positive
regulation of B cell proliferation | 1.35E-02 | CARD11, CD81,
TLR4, ADA |
| GOTERM_BP_
DIRECT |
GO:2000377~regulation of reactive oxygen
species metabolic process | 2.66E-02 | TNF, PINK1,
BIRC2 |
| GOTERM_BP_
DIRECT | GO:0071353~cellular
response to interleukin-4 | 3.74E-02 | XBP1, FASN,
TUBA1B |
| GOTERM_BP_
DIRECT | GO:0032715~negative
regulation of interleukin-6 production | 4.96E-02 | IRAK3, TNF,
TLR4 |
| GOTERM_MF_
DIRECT | GO:0005515~protein
binding | 3.50E-10 | PDLIM7, PPP2R5A,
TLR1, CNOT2, TLR4, RNF216, CCT3, ARID1A, TGFA, SERPINA1 |
| GOTERM_MF_
DIRECT | GO:0044822~poly(A)
RNA binding | 1.11E-04 | ABCF1, CCT3,
ZNF207, EXOSC10, HNRNPM, EZR, FASN, APEX1, YARS, MDH2 |
| GOTERM_MF_
DIRECT | GO:0005524~ATP
binding | 5.01E-03 | ABCF1, PINK1,
MAP4K1, QARS, CCT3, TRIB1, ACTG1, EPRS, ADK, EIF4A1 |
| GOTERM_MF_
DIRECT | GO:0042288~MHC
class I protein binding | 2.42E-02 | TUBB, CD8A,
ATP5A1 |
| GOTERM_MF_
DIRECT |
GO:0031625~ubiquitin protein ligase
binding | 3.16E-02 | ACTG1, RPA2,
TUBB, XBP1, SLC25A5, RALB, PINK1, TUBA1B, TRIB1 |
| GOTERM_MF_
DIRECT | GO:0047485~protein
N-terminus binding | 3.59E-02 | RPA2, HDAC1,
BIRC2, GLRX, FEZ1 |
| GOTERM_CC_
DIRECT |
GO:0070062~extracellular exosome | 3.20E-06 | HIST2H2AA3,
CAPZA2, PTGS1, CCT3, PDHB, RTN3, ACTG1, N4BP2L2, CCNY,
LILRA5 |
| GOTERM_CC_
DIRECT |
GO:0005737~cytoplasm | 1.87E-05 | ABCF1, C9ORF72,
E2F3, PDLIM7, AGTPBP1, PPP2R5A, PTGS1, CNOT2, PINK1, SHOC2 |
| GOTERM_CC_
DIRECT |
GO:0005829~cytosol | 1.39E-04 | ABCF1, AGTPBP1,
CAPZA2, CNOT2, PINK1, DPH2, RNF216, QARS, ARHGAP17, CCT3 |
| GOTERM_CC_
DIRECT |
GO:0030529~intracellular ribonucleoprotein
complex | 2.73E-04 | ZFP36L2, HNRNPM,
NUP62, CSNK1E, RPL22, SNRPB, EPRS, DYRK2, HNRNPR |
|
GOTERM_CC_DIRECT |
GO:0016020~membrane | 1.212E-03 | ABCF1, KCNJ15,
GNAI3, TNF, MCL1, PPP2R5A, CAPZA2, TLR1, CD247, CNOT2 |
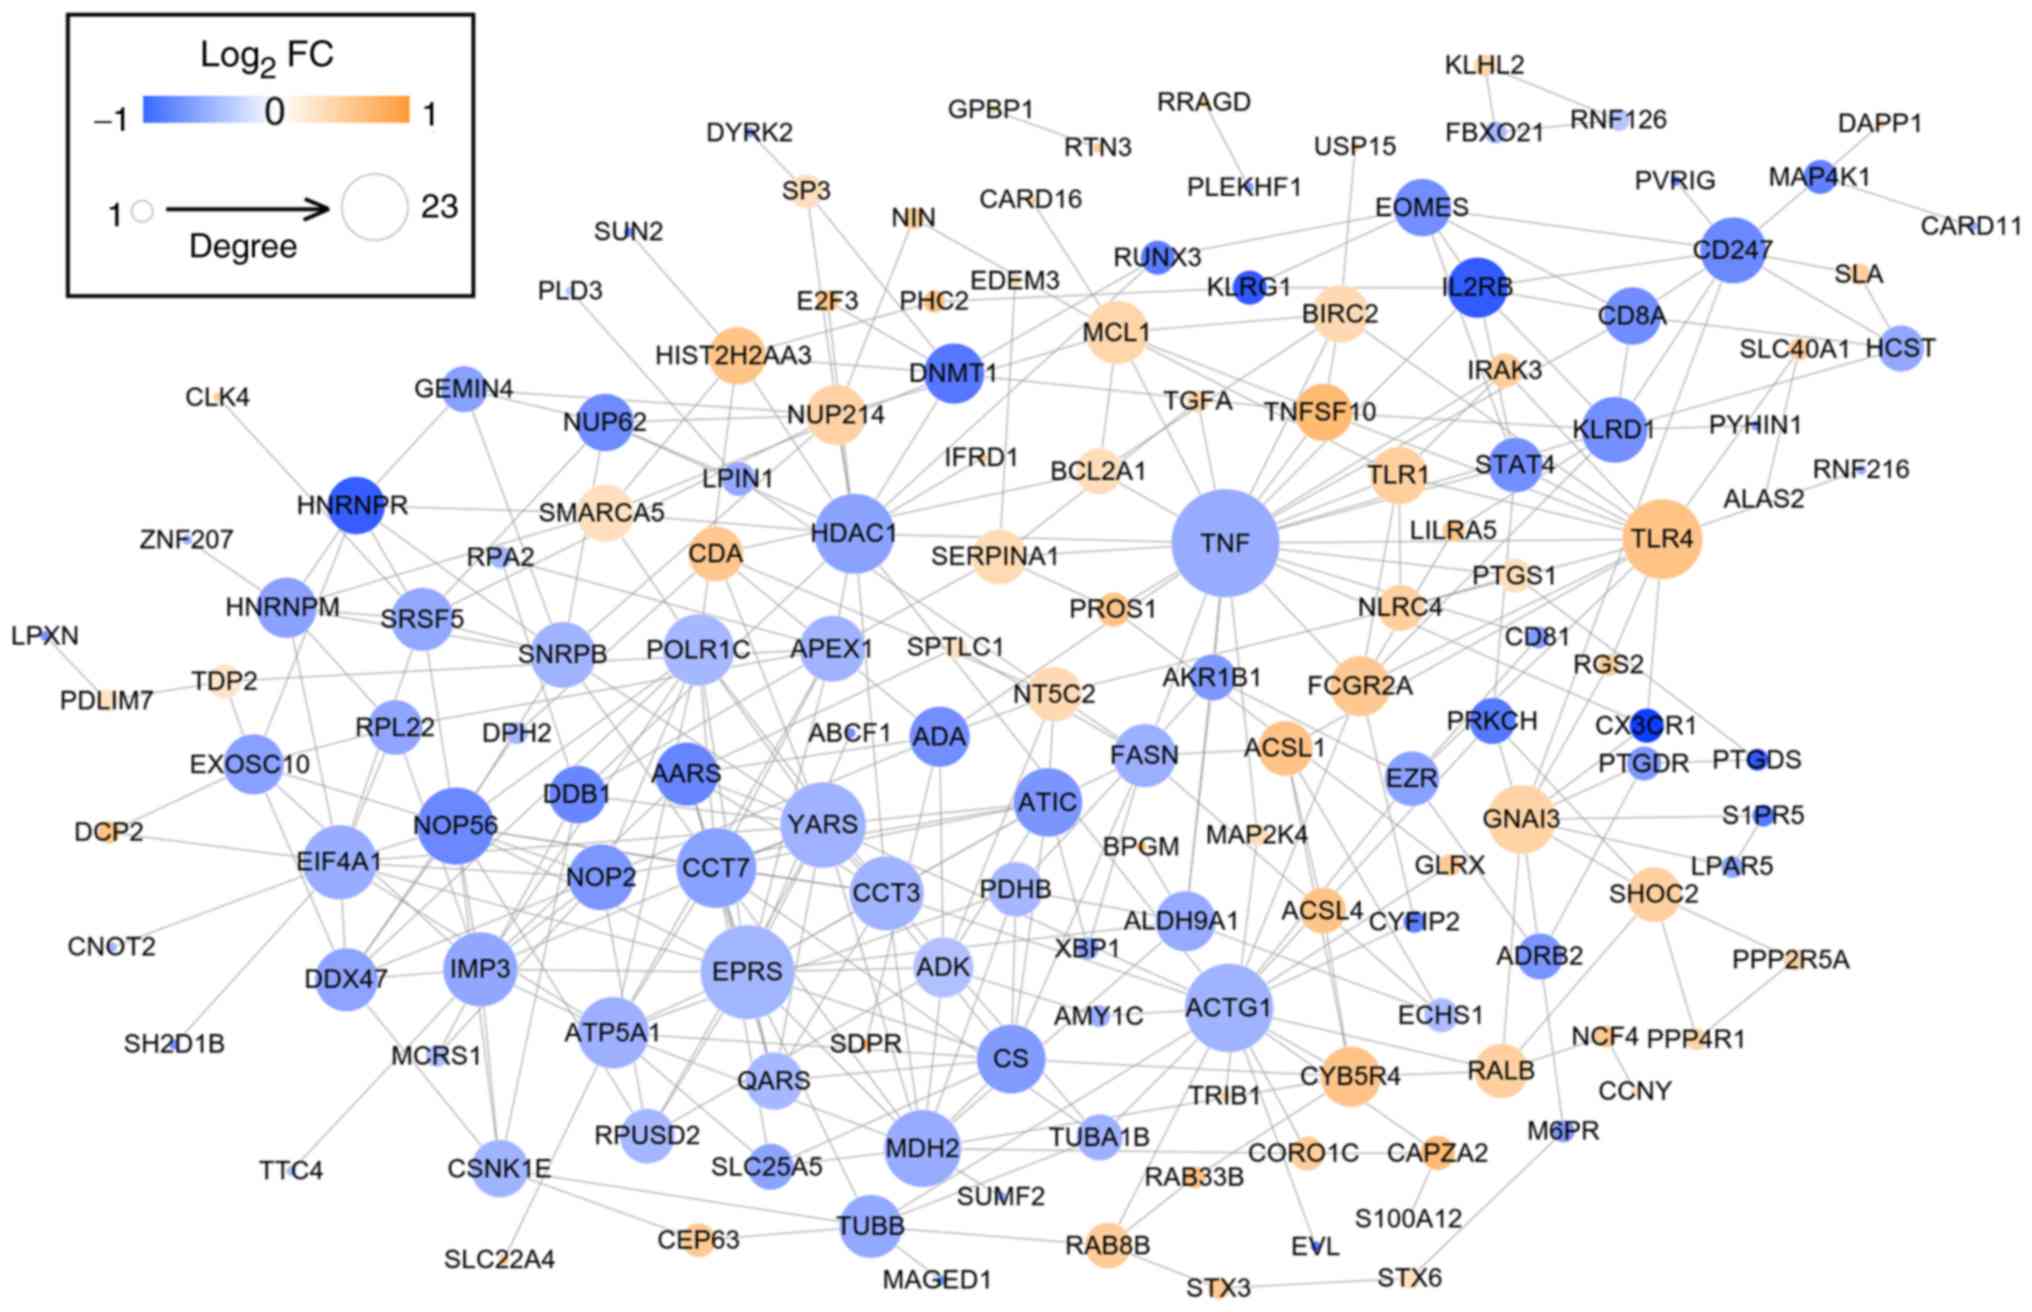
PPI network
After mapping the DEGs to the STRING database, 356
interaction pairs were obtained which were used for constructing
the PPI network where 154 nodes (64 upregulated and 88
downregulated) were included (Fig.
4). By calculating degree, BC, CC and APL, and comparing genes
ranked as the top 30, HDAC1 (histone deacetylase 1),
YARS, EPRS (glutamyl-prolyl-tRNA synthetase), APEX1
(apurinic/apyrimidinic endodeoxyribonuclease 1), ACTG1
(actin γ 1), MDH2 (malate dehydrogenase 2), TNF (tumor
necrosis factor), CCT3 (chaperonin containing TCP1 subunit
3), TLR4 (Toll-like receptor 4), TUBB (tubulin β
class I), FCGR2A (Fc fragment of IgG receptor IIa),
KLRD1 (killer cell lectin-like receptor D1) and FASN
(fatty acid synthase) were found to be shared by these 4
topological characteristics, suggesting they were hub genes for AS
(Tables II and III).
| Table II.Topological characteristics. |
Table II.
Topological characteristics.
| A, Degree |
|---|
|
|---|
| Genes | Value |
|---|
| TNF | 24 |
| EPRS | 19 |
| ACTG1 | 17 |
| YARS | 16 |
| TLR4 | 14 |
| HDAC1 | 14 |
| CCT7 | 14 |
| NOP56 | 13 |
| MDH2 | 13 |
| IMP3 | 12 |
| CCT3 | 12 |
| EIF4A1 | 12 |
| ATP5A1 | 11 |
| POLR1C | 11 |
| GNAI3 | 10 |
| CS | 10 |
| ATIC | 10 |
| APEX1 | 9 |
| NOP2 | 9 |
| SNRPB | 9 |
| CD247 | 9 |
| KLRD1 | 9 |
| DDX47 | 8 |
| AARS | 8 |
| MCL1 | 8 |
| SRSF5 | 8 |
| TUBB | 8 |
| FASN | 8 |
| FCGR2A | 7 |
|
| B, Closeness
centrality |
|
| Genes | Value |
|
| RNF126 | 1.0000 |
| KLHL2 | 1.0000 |
| FBXO21 | 1.0000 |
| GPBP1 | 1.0000 |
| PLEKHF1 | 1.0000 |
| RTN3 | 1.0000 |
| RRAGD | 1.0000 |
| TNF | 0.4000 |
| HDAC1 | 0.3946 |
| ACTG1 | 0.3852 |
| CCT3 | 0.3605 |
| YARS | 0.3596 |
| EPRS | 0.3570 |
| ALDH9A1 | 0.3510 |
| FCGR2A | 0.3427 |
| MDH2 | 0.3387 |
| APEX1 | 0.3349 |
| ADA | 0.3333 |
| FASN | 0.3318 |
| CS | 0.3288 |
| ATIC | 0.3281 |
| TLR4 | 0.3274 |
| EZR | 0.3244 |
| DDB1 | 0.3237 |
| CCT7 | 0.3230 |
| AARS | 0.3223 |
| KLRD1 | 0.3216 |
| TUBB | 0.3216 |
| CYB5R4 | 0.3216 |
|
| C, Betweenness
centrality |
|
| Genes | Value |
|
| TNF | 0.2996 |
| ACTG1 | 0.2278 |
| HDAC1 | 0.1883 |
| YARS | 0.0824 |
| EPRS | 0.0783 |
| TLR4 | 0.0753 |
| GNAI3 | 0.0745 |
| CD247 | 0.0743 |
| APEX1 | 0.0688 |
| RALB | 0.0622 |
| ALDH9A1 | 0.0559 |
| EIF4A1 | 0.0558 |
| ADA | 0.0508 |
| FASN | 0.0507 |
| KLRD1 | 0.0499 |
| TUBB | 0.0491 |
| FCGR2A | 0.0430 |
| MDH2 | 0.0382 |
| EZR | 0.0360 |
| CYB5R4 | 0.0359 |
| CCT3 | 0.0337 |
| PRKCH | 0.0316 |
| MCL1 | 0.0315 |
| NUP214 | 0.0289 |
|
HIST2H2AA3 | 0.0288 |
|
SERPINA1 | 0.0286 |
| TDP2 | 0.0282 |
| SHOC2 | 0.0274 |
| MAP4K1 | 0.0273 |
|
| D, Average path
length |
|
| Genes | Value |
|
| RNF126 | 1.0000 |
| KLHL2 | 1.0000 |
| FBXO21 | 1.0000 |
| GPBP1 | 1.0000 |
| PLEKHF1 | 1.0000 |
| RTN3 | 1.0000 |
| RRAGD | 1.0000 |
| TNF | 2.5000 |
| HDAC1 | 2.5342 |
| ACTG1 | 2.5959 |
| CCT3 | 2.7740 |
| YARS | 2.7808 |
| EPRS | 2.8014 |
| ALDH9A1 | 2.8493 |
| FCGR2A | 2.9178 |
| MDH2 | 2.9521 |
| APEX1 | 2.9863 |
| ADA | 3.0000 |
| FASN | 3.0137 |
| CS | 3.0411 |
| ATIC | 3.0479 |
| TLR4 | 3.0548 |
| EZR | 3.0822 |
| DDB1 | 3.0890 |
| CCT7 | 3.0959 |
| AARS | 3.1027 |
| KLRD1 | 3.1096 |
| TUBB | 3.1096 |
| CYB5R4 | 3.1096 |
| Table III.Overlapping DEGs according to
topological features (degree, closeness centrality, betweenness
centrality and average path length). |
Table III.
Overlapping DEGs according to
topological features (degree, closeness centrality, betweenness
centrality and average path length).
| Common genes | Expression |
|---|
| HDAC1 | Down |
| YARS | Down |
| EPRS | Down |
| APEX1 | Down |
| ACTG1 | Down |
| MDH2 | Down |
| TNF | Down |
| CCT3 | Down |
| TLR4 | Up |
| TUBB | Down |
| FCGR2A | Up |
| KLRD1 | Down |
| FASN | Down |
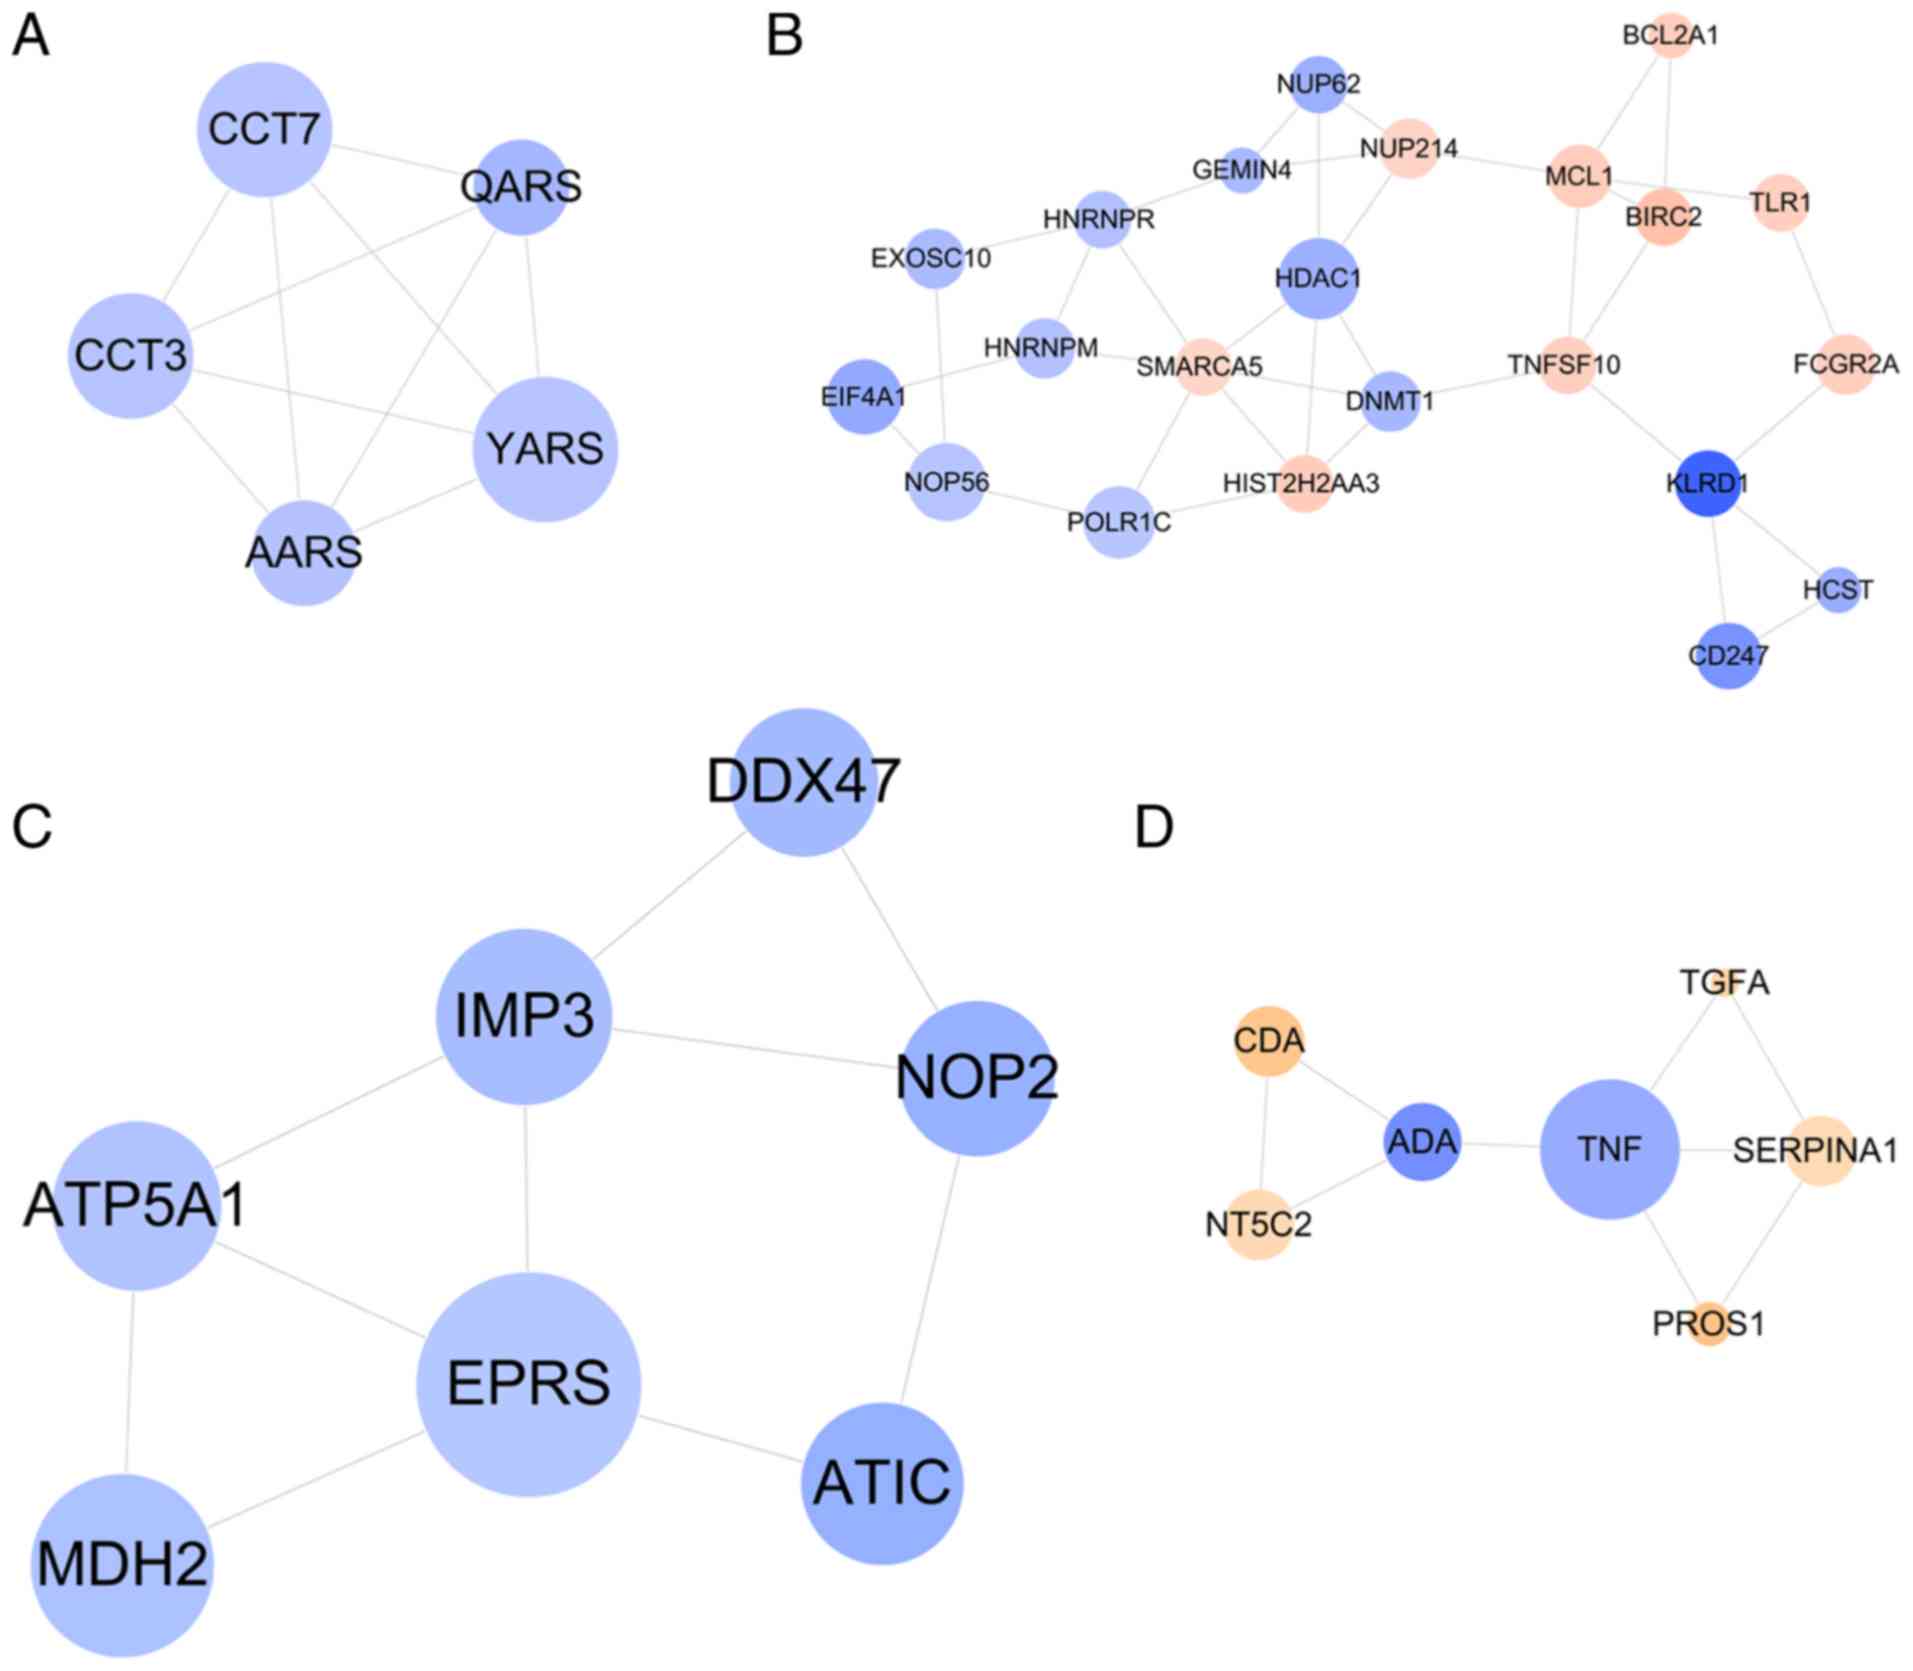
Subsequently, four functionally related and highly
interconnected modules were screened (Fig. 5). The genes in module 1 were
associated with aminoacyl-tRNA biosynthesis (YARS) (Fig. 5A); the genes in module 2 were
related with natural killer cell mediated cytotoxicity
(KLRD1) and immune response (KLRD1) (Fig. 5B); the genes in module 3 were
relevant with metabolic pathways (EPRS) (Fig. 5C); and the genes in module 4 were
enriched in GO terms of platelet degranulation (SERPINA1)
(Fig. 5D) (Table IV).
| Table IV.Function enrichment for genes in
modules. |
Table IV.
Function enrichment for genes in
modules.
|
| Category | Term | P-value | Genes |
|---|
| 1 | KEGG_PATHWAY |
hsa00970:Aminoacyl-tRNA biosynthesis | 8.99E-05 | YARS, AARS,
QARS |
|
|
GOTERM_BP_DIRECT | GO:0006418~tRNA
aminoacylation for protein translation | 3.31E-05 | YARS, AARS,
QARS |
|
|
GOTERM_BP_DIRECT | GO:0006457~protein
folding | 6.76E-04 | CCT7, AARS,
CCT3 |
|
|
GOTERM_BP_DIRECT | GO:1904871~positive
regulation of protein localization to Cajal body | 1.90E-03 | CCT7,
CCT3 |
|
|
GOTERM_BP_DIRECT | GO:1904874~positive
regulation of telomerase RNA localization to Cajal body | 3.57E-03 | CCT7,
CCT3 |
|
|
GOTERM_BP_DIRECT | GO:0032212~positive
regulation of telomere maintenance via telomerase | 7.60E-03 | CCT7,
CCT3 |
|
|
GOTERM_BP_DIRECT | GO:0007339~binding
of sperm to zona pellucida | 8.31E-03 | CCT7,
CCT3 |
|
|
GOTERM_BP_DIRECT | GO:1901998~toxin
transport | 8.55E-03 | CCT7,
CCT3 |
|
|
GOTERM_BP_DIRECT | GO:0050821~protein
stabilization | 3.20E-02 | CCT7,
CCT3 |
| 2 | KEGG_PATHWAY | hsa04650:Natural
killer cell mediated cytotoxicity | 4.23E-03 | TNFSF10, CD247,
KLRD1, HCST |
|
| KEGG_PATHWAY | hsa03013:RNA
transport | 1.10E-02 | NUP214, NUP62,
EIF4A1, GEMIN4 |
|
|
GOTERM_BP_DIRECT | GO:0007166~cell
surface receptor signaling pathway | 3.33E-04 | TNFSF10, NUP62,
CD247, BIRC2, KLRD1 |
|
|
GOTERM_BP_DIRECT | GO:0016032~viral
process | 4.64E-04 | NUP214, NUP62,
HDAC1, CD247, EIF4A1 |
|
|
GOTERM_BP_DIRECT | GO:0043066~negative
regulation of apoptotic process | 2.21E-03 | MCL1, NUP62,
HDAC1, BCL2A1, BIRC2 |
|
|
GOTERM_BP_DIRECT | GO:0043123~positive
regulation of I-kappaB kinase/NF-kappaB signaling | 1.70E-02 | TNFSF10, NUP62,
BIRC2 |
|
|
GOTERM_BP_DIRECT |
GO:0050776~regulation of immune
response | 2.06E-02 | CD247, KLRD1,
HCST |
|
|
GOTERM_BP_DIRECT |
GO:0043044~ATP-dependent chromatin
remodeling | 2.84E-02 | HDAC1,
SMARCA5 |
|
|
GOTERM_BP_DIRECT | GO:0006364~rRNA
processing | 2.90E-02 | EXOSC10, NOP56,
GEMIN4 |
|
|
GOTERM_BP_DIRECT | GO:0006409~tRNA
export from nucleus | 3.93E-02 | NUP214,
NUP62 |
|
|
GOTERM_BP_DIRECT |
GO:0010827~regulation of glucose
transport | 4.05E-02 | NUP214,
NUP62 |
|
|
GOTERM_BP_DIRECT |
GO:0097192~extrinsic apoptotic signaling
pathway in absence of ligand | 4.17E-02 | MCL1,
BCL2A1 |
| 3 | KEGG_PATHWAY | hsa01100:Metabolic
pathways | 1.94E-02 | ATIC, EPRS,
ATP5A1, MDH2 |
|
|
GOTERM_BP_DIRECT | GO:0006888~ER to
Golgi vesicle-mediated transport | 1.32E-03 | TGFA, SERPINA1,
PROS1 |
|
|
GOTERM_BP_DIRECT |
GO:0048566~embryonic digestive tract
development | 5.70E-03 | TNF,
ADA |
|
|
GOTERM_BP_DIRECT | GO:0048208~COPII
vesicle coating | 2.16E-02 | TGFA,
SERPINA1 |
| 4 |
GOTERM_BP_DIRECT | GO:0002576~platelet
degranulation | 3.62E-02 | SERPINA1,
PROS1 |
|
|
GOTERM_BP_DIRECT |
GO:0000187~activation of MAPK
activity | 3.76E-02 | TNF,
TGFA |
|
|
GOTERM_BP_DIRECT | GO:0010951~negative
regulation of endopeptidase activity | 4.25E-02 | SERPINA1,
PROS1 |
Integration of SNP microarray and
expression profile data
The LRR of each SNP for 384 genes in AS and control
samples was computed. The LRR in most samples were lower than 1,
indicating the presence of copy number deletions. Subsequently, the
statistical difference in LRR of each SNP between AS and control
samples were determined by Student's t-test, with 122 differential
SNP identified. After overlapping the genes having differential SNP
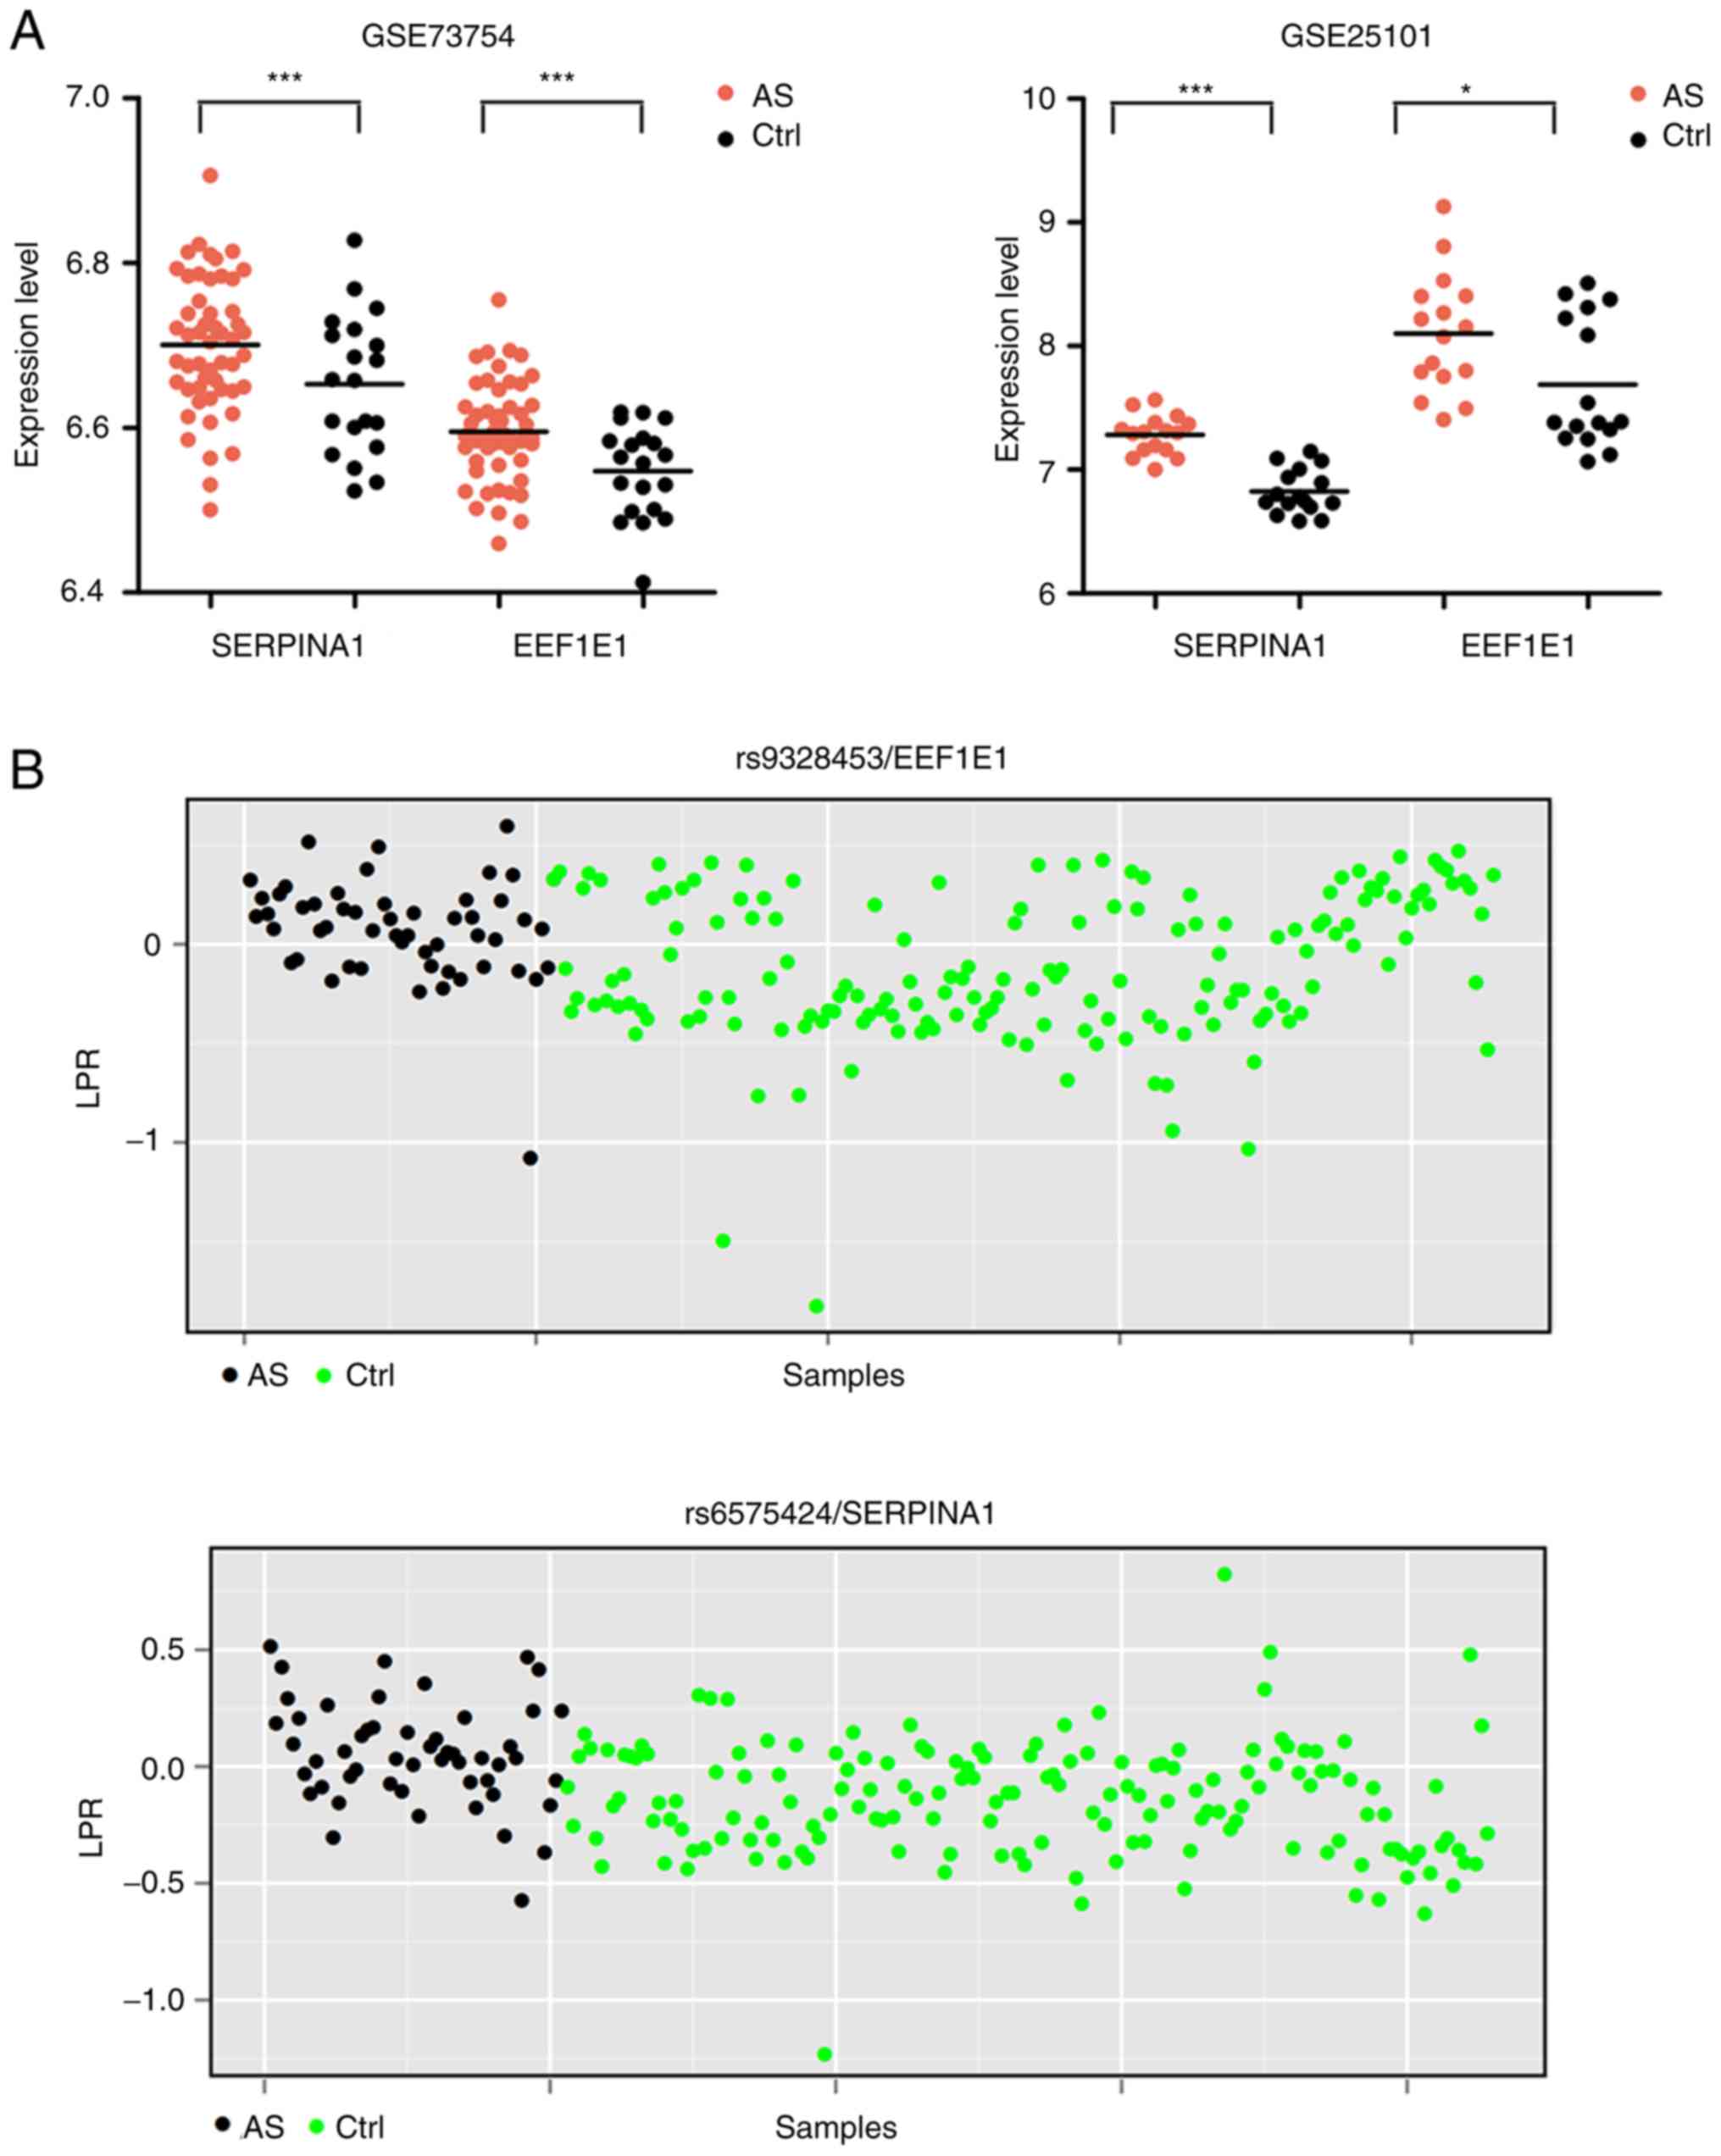
with the DEGs, two common genes (EEF1E1 and SERPINA1)
were obtained. SERPINA1 was upregulated in AS (Fig. 6A) and the average expression LRR of
the rs6575424 polymorphism in AS samples was significantly higher
than that in the controls (0.05 vs. −0.14, P=6.57E-07) (Fig. 6B); EEF1E1 was also
upregulated in AS (Fig. 6A) and
the average expression LRRs of rs7763907 (−4.88 vs. −5.91,
P=0.048), rs9328453 (0.07 vs. −0.12, P=3.69E-05) (Fig. 6B), rs7751386 (−0.85 vs. −1.49,
P=2.52E-04), and rs12660697 (0.08 vs. −0.02, P=0.02) polymorphisms
in AS samples were significantly higher than that in controls.
Furthermore, the genotype and allele frequencies of
SNPs in EEF1E1 and SERPINA1 between AS and controls
were compared using the Chi-square (or Fisher's exact) test. The
results showed there were significant differences in the genotype
and allele frequencies of rs7763907 between AS and control samples.
The genotype frequency of rs7751386 between AS and control samples
was also significantly differential. These findings suggest that
these two polymorphic sites of the EEF1E1 gene may be
associated with the susceptibility to acquire AS (Table V).
| Table V.Genotype and allele frequency of SNP
loci for SERPINA1 and EEF1E1. |
Table V.
Genotype and allele frequency of SNP
loci for SERPINA1 and EEF1E1.
|
|
|
| Genotype |
| Allele |
|---|
|
|
|
|
|
|
|
|---|
| Genes | SNP |
| AS | Control | P-value |
| AS | Control | P-value |
|---|
|
SERPINA1 | rs6575424 | AA | 9 | 12 | 0.077 | A | 25 | 79 | 0.665 |
|
|
| AB | 16 | 67 |
| B | 42 | 151 |
|
|
|
| BB | 26 | 84 |
|
|
|
|
|
| EEF1E1 | rs7763907 | AB | 1 | 0 | <0.001 | A | 4 | 4 | 0.047 |
|
|
| BB | 13 | 5 |
| B | 14 | 5 |
|
|
|
| NC | 37 | 154 |
|
|
|
|
|
|
|
| AA | 0 | 4 |
|
|
|
|
|
|
| rs9328453 | AB | 0 | 3 | 1.000 | A | 0 | 3 | 1.000 |
|
|
| BB | 51 | 163 |
| B | 51 | 166 |
|
|
| rs7751386 | AA | 7 | 2 | <0.001 | A | 12 | 41 | 1.000 |
|
|
| AB | 5 | 39 |
| B | 25 | 80 |
|
|
|
| BB | 20 | 41 |
|
|
|
|
|
|
|
| NC | 19 | 81 |
|
|
|
|
|
|
| rs12660697 | AA | 0 | 1 | 0.631 | A | 4 | 10 | 0.749 |
|
|
| AB | 4 | 9 |
| B | 51 | 162 |
|
|
|
| BB | 47 | 153 |
|
|
|
|
|
Discussion
In the present study, two crucial genes
(EEF1E1 and SERPINA1) were identified for the
diagnosis of ankylosing spondylitis (AS) by analyzing two mRNA
expression profile datasets and one single nucleotide polymorphism
(SNP) dataset. Their expression levels were significantly
upregulated and the average expression LRRs of SNP sites in these
genes were significantly higher in AS patients that those in the
controls. EEF1E1 was involved in AS by influencing
aminoacyl-tRNA biosynthesis, while SERPINA1 may be
associated with AS by participating in platelet degranulation.
EEF1E1, also known as aminoacyl-tRNA
synthetase-interacting multifunctional protein 3 (AIMP3/p18), was
initially found to encode an auxiliary component of the
macromolecular aminoacyl-tRNA synthase complex that catalyzes the
ligation of a specific amino acid to its compatible cognate tRNA to
form an aminoacyl-tRNA to initiate protein translation (29,30).
Thus, EEF1E1 may be upregulated to promote the development
of various types of cancer (31).
However, recent studies indicate that EEF1E1 may also function as a
tumor-suppressor (32,33) by upregulating the growth factor- or
Ras-dependent induction of p53 (34,35).
Cells with loss of EEF1E1 were found to exhibit impaired p53
transactivity and genomic instability and thus were found to became
susceptible to cell malignant transformation (34,36),
while overexpression of EEF1E1 induced cellular senescence
phenotypes (37). It was also
demonstrated that the p53 level was significantly higher in the
peripheral blood supernatant of a rheumatoid arthritis (RA) group
than the level in control groups and there was a positive
correlation between p53 levels and the disease activity score in
the RA group (38). In addition,
in RA synovial tissues, 80% of p53-positive cells were found to be
TUNEL-positive (39). These
results indicate that upregulation of the p53 gene may result in
chronic inflammation and apoptosis in RA patients. In addition,
other members of the AIMP families, such as AIMP1, were also
found to promote the expression of pro-inflammatory genes in
monocytes/macrophages and dendritic cells (40) and induce cytokine (i.e.
TNF-α)-dependent apoptosis (41).
The antibody atliximab was reported to neutralize the expression of
AIMP1 and then block the AIMP1-mediated production of inflammatory
cytokines, ultimately attenuating collagen-induced arthritis
(42). Accordingly, we speculate
that EEF1E1 may also be involved in inflammation of AS by
upregulating p53 and pro-inflammatory cytokines. In line with this
hypothesis, our results showed that EEF1E1 was upregulated
in the whole blood of AS patients compared with the control.
Upregulation of EEF1E1 may be attributed to genetic
mutations (rs7763907 and rs7751386) since the LRR of AS was
significantly higher than that of controls and the genotype and
allele frequencies were significantly different. However, further
experimental validation is needed as studies investigating the SNPs
of EEF1E1 are limited apart from the study of Liu et
al that showed the number of risk alleles of rs12199241 in
AIMP3 to be significantly associated with high DNA damage
level (43).
SERPINA1 is a gene that encodes
alpha-1-antitrypsin (AAT). It was found that the AAT concentration
was higher in AS patients under active phase than the patients with
remission/partial remission (44).
In addition, the carboxyl terminal fragment of AAT was demonstrated
to significantly induce the production of pro-inflammatory
molecules (gelatinase B, monocyte chemoattractant protein-1 and
IL-6) in human monocytes by interactions with the CD36 scavenger
receptor and low density lipoprotein (LDL) receptor (45). These findings suggest that
SERPINA1 may be a potential biomarker for the diagnosis of
AS and evaluation of the efficacy of treatment by influencing
inflammation. In line with these studies, we also found that
SERPINA1 was upregulated in AS patients and it participated
in GO terms of platelet degranulation. Platelet-specific
degranulation gene Munc13-4 knockout mice were shown to display a
reduction in airway hyper-responsiveness and eosinophilic
inflammation, indirectly confirming the pro-inflammatory roles of
SERPINA1 in AS (46). Importantly,
a study was conducted to use TaqMan method to genotype tag SNPs
(rs2753934, rs2749531 and rs6575424) in SERPINA1 of 56 AS
cases and 160 healthy controls. The results revealed an increased
expression of AAT in synovial membranes of AS compared with control
samples, but no significant association was observed between the
AAT polymorphism and AS (47).
This also seems to be in accordance with our results and indicates
that SERPINA1 may not be a genetically related biomarker for
AS.
However, there were some limitations to the present
study. First, this study was only performed to preliminarily screen
the potential genetic biomarkers for AS. Further experiments are
necessary, including clinical confirmation of the association
between the polymorphism of EEF1E1 and SERPINA1 and
the risk of AS and patient prognosis; clinical validation of the
expression of EEF1E1 and SERPINA1; clinical
(correlation analysis), in vitro (site-directed mutagenesis
to construct the expression vector with different alleles,
transfection of monocytes or osteoblasts followed by detection of
cell proliferation, inflammatory factor release or mineralization)
and in vivo (mutation knockout in animal models followed by
assessment of histology and bone joint) verification of the
association between gene polymorphisms and their expressions as
well as corresponding phenotypic changes. Second, the SNP
microarray used in this study only analyzed the SNPs in specific
384 genes, but not all the genes. Additional SNP discovery by deep
sequencing with a larger sample size is essential to obtain more
genetic biomarkers.
In conclusion, our findings preliminarily suggest
that EEF1E1 may be an underlying novel, important genetic
biomarker for the diagnosis of AS. Its rs7763907 and rs7751386
polymorphisms may lead to its upregulated expression and then
promote the transcription of p53 and pro-inflammatory cytokines,
leading to the development of AS.
Acknowledgements
Not applicable.
Funding
No funding was received.
Availability of data and materials
The microarray data GSE73754 (https://www.ncbi.nlm.nih.gov/geo/query/acc.cgi?acc=GSE73754),
GSE25101 (https://www.ncbi.nlm.nih.gov/geo/query/acc.cgi?acc=GSE25101)
and GSE39428 (https://www.ncbi.nlm.nih.gov/geo/query/acc.cgi?acc=GSE39428)
were downloaded from the GEO database in NCBI.
Authors' contributions
XF was involved in the conception and design,
analysis and interpretation of data and drafted the initial
manuscript. BQ collected the data. LM and FM contributed to the
interpretation of the data. BQ, LM and FM revised the manuscript
critically for important intellectual content. All authors read and
approved the manuscript and agree to be accountable for all aspects
of the research in ensuring that the accuracy or integrity of any
part of the work are appropriately investigated and resolved.
Ethics approval and consent to
participate
Not applicable.
Patient consent for publication
Not applicable.
Competing interests
The authors declare that they have no competing
interests.
References
|
1
|
Dean LE, Jones GT, MacDonald AG, Downham
C, Sturrock RD and Macfarlane GJ: Global prevalence of ankylosing
spondylitis. Rheumatology (Oxford). 53:650–657. 2014. View Article : Google Scholar : PubMed/NCBI
|
|
2
|
Healey EL, Haywood KL, Jordan KP, Garratt
AM and Packham JC: Patients with well-established ankylosing
spondylitis show limited deterioration in a ten-year prospective
cohort study. Clin Rheumatol. 32:67–72. 2013. View Article : Google Scholar : PubMed/NCBI
|
|
3
|
Chen B, Li J, He C, Li D, Tong W, Zou Y
and Xu W: Role of HLA-B27 in the pathogenesis of ankylosing
spondylitis. Mol Med Rep. 15:1943–1951. 2017. View Article : Google Scholar : PubMed/NCBI
|
|
4
|
Fernández-Sueiro JL, Alonso C, Blanco FJ,
Rodríguez-Gómez M, Galdo F and González-Gay MA: Prevalence of
HLA-B27 and subtypes of HLA-B27 associated with ankylosing
spondylitis in Galicia, Spain. Clin Exp Rheumatol. 22:465–468.
2004.PubMed/NCBI
|
|
5
|
Cauli A, Dessole G, Fiorillo MT, Vacca A,
Mameli A, Bitti P, Passiu G, Sorrentino R and Mathieu A: Increased
level of HLA-B27 expression in ankylosing spondylitis patients
compared with healthy HLA-B27-positive subjects: A possible further
susceptibility factor for the development of disease. Rheumatology
(Oxford) 41(12). 1375–1379. 2002. View Article : Google Scholar
|
|
6
|
Yang T, Duan Z, Wu S, Liu S, Zeng Z, Li G,
Wang S, Fan D, Ye D, Xu S, et al: Association of HLA-B27 genetic
polymorphisms with ankylosing spondylitis susceptibility worldwide:
A meta-analysis. Mod Rheumatol. 24:150–161. 2014. View Article : Google Scholar : PubMed/NCBI
|
|
7
|
Lin H and Gong YZ: Association of HLA-B27
with ankylosing spondylitis and clinical features of the
HLA-B27-associated ankylosing spondylitis: A meta-analysis.
Rheumatol Int. 37:1267–1280. 2017. View Article : Google Scholar : PubMed/NCBI
|
|
8
|
Kim TJ, Na KS, Lee HJ, Lee B and Kim TH:
HLA-B27 homozygosity has no influence on clinical manifestations
and functional disability in ankylosing spondylitis. Clin Exp
Rheumatol. 27:574–579. 2009.PubMed/NCBI
|
|
9
|
Zhang L, Zhang YJ, Chen J, Huang XL, Fang
GS, Yang LJ, Duan Y and Wang J: The association of HLA-B27 and
Klebsiella pneumoniae in ankylosing spondylitis: A systematic
review. Microb Pathog. 117:49–54. 2018. View Article : Google Scholar : PubMed/NCBI
|
|
10
|
Brown MA, Kennedy LG, Macgregor AJ, Darke
C, Duncan E, Shatford JL, Taylor A, Calin A and Wordsworth P:
Susceptibility to ankylosing spondylitis in twins: The role of
genes, HLA, and the environment. Arthritis Rheum. 40:1823–1828.
1997. View Article : Google Scholar : PubMed/NCBI
|
|
11
|
Brophy S, Hickey S, Menon A, Taylor G,
Bradbury L, Hamersma J and Calin A: Concordance of disease severity
among family members with ankylosing spondylitis? J Rheumatol.
31:1775–1778. 2004.PubMed/NCBI
|
|
12
|
Azevedo VF, Faria-Neto JR, Stinghen A,
Lorencetti PG, Miller WP, Gonçalves BP, Szyhta CC and Pecoits-Filho
R: IL-8 but not other biomarkers of endothelial damage is
associated with disease activity in patients with ankylosing
spondylitis without treatment with anti-TNF agents. Rheumatol Int.
33:1779–1783. 2013. View Article : Google Scholar : PubMed/NCBI
|
|
13
|
Gonza-Lezlopez L, Fajardo-Robledo NS,
Saldaña-Cruz AM, Moreno-Sandoval IV, Bonilla-Lara D, Zavaleta-Muñiz
S, Nava-Zavala AH, Hernandez-Cuervo P, Rocha-Muñoz A,
Rodriguez-Jimenez NA, et al: Association of adipokines,
interleukin-6, and tumor necrosis factor-α concentrations with
clinical characteristics and presence of spinal syndesmophytes in
patients with ankylosing spondylitis: A cross-sectional study. J
Int Med Res. 45:1024–1035. 2017. View Article : Google Scholar : PubMed/NCBI
|
|
14
|
Sundström B, Ljung L and Wållberg-Jonsson
S: Exercise habits and C-reactive protein may predict development
of spinal immobility in patients with ankylosing spondylitis. Clin
Rheumatol. 37:2881–2885. 2018. View Article : Google Scholar : PubMed/NCBI
|
|
15
|
Sohn DH, Jeong H, Roh JS, Lee HN, Kim E,
Koh JH and Lee SG: Serum CCL11 level is associated with
radiographic spinal damage in patients with ankylosing spondylitis.
Rheumatol Int. 38:1455–1464. 2018. View Article : Google Scholar : PubMed/NCBI
|
|
16
|
Ruan WF, Xie JT, Jin Q, Wang WD and Ping
AS: The diagnostic and prognostic role of interleukin 12B and
interleukin 6R gene polymorphism in patients with ankylosing
spondylitis. J Clin Rheumatol. 24:18–24. 2018.PubMed/NCBI
|
|
17
|
Ma HJ, Yin QF, Wu Y and Guo MH: TNF-α-308
polymorphism determines clinical manifestations and therapeutic
response of ankylosing spondylitis in Han chinese. Med Clin (Barc).
149:517–522. 2017. View Article : Google Scholar : PubMed/NCBI
|
|
18
|
Gracey E, Yao Y, Green B, Qaiyum Z,
Baglaenko Y, Lin A, Anton A, Ayearst R, Yip P and Inman RD: Sexual
dimorphism in the Th17 signature of ankylosing spondylitis.
Arthritis Rheumatol. 68:679–689. 2015. View Article : Google Scholar
|
|
19
|
Pimentel-Santos FM, Ligeiro D, Matos M,
Mourão AF, Costa J, Santos H, Barcelos A, Godinho F, Pinto P, Cruz
M, et al: Whole blood transcriptional profiling in ankylosing
spondylitis identifies novel candidate genes that might contribute
to the inflammatory and tissue-destructive disease aspects.
Arthritis Res Ther. 13:R572011. View
Article : Google Scholar : PubMed/NCBI
|
|
20
|
Chang X, Xu B, Wang L, Wang Y, Wang Y and
Yan S: Investigating a pathogenic role for TXNDC5 in tumors. Int J
Oncol. 43:1871–1884. 2013. View Article : Google Scholar : PubMed/NCBI
|
|
21
|
Chang X, Zheng Y, Yang Q, Wang L, Pan J,
Xia Y, Yan X and Han J: Carbonic anhydrase I (CA1) is involved in
the process of bone formation and is susceptible to ankylosing
spondylitis. Arthritis Res Ther. 14:R1762012. View Article : Google Scholar : PubMed/NCBI
|
|
22
|
Ritchie ME, Phipson B, Wu D, Hu Y, Law CW,
Shi W and Smyth GK: limma powers differential expression analyses
for RNA-sequencing and microarray studies. Nucleic Acids Res.
43:e472015. View Article : Google Scholar : PubMed/NCBI
|
|
23
|
Wang K, Li M, Hadley D, Liu R, Glessner J,
Grant SFA, Hakonarson H and Bucan M: PennCNV: An integrated hidden
Markov model designed for high-resolution copy number variation
detection in whole-genome SNP genotyping data. Genome Res.
17:1665–1674. 2007. View Article : Google Scholar : PubMed/NCBI
|
|
24
|
Benjamini Y, Drai D, Elmer G, Kafkafi N
and Golani I: Controlling the false discovery rate in behavior
genetics research. Behav Brain Res. 125:279–284. 2001. View Article : Google Scholar : PubMed/NCBI
|
|
25
|
Szklarczyk D, Franceschini A, Wyder S,
Forslund K, Heller D, Huerta-Cepas J, Simonovic M, Roth A, Santos
A, Tsafou KP, et al: STRING v10: Protein-protein interaction
networks, integrated over the tree of life. Nucleic Acids Res
43(Database Issue). D447–D452. 2015. View Article : Google Scholar
|
|
26
|
Kohl M, Wiese S and Warscheid B:
Cytoscape: Software for visualization and analysis of biological
networks. Methods Mol Biol. 696:291–303. 2011. View Article : Google Scholar : PubMed/NCBI
|
|
27
|
Tang Y, Li M, Wang J, Pan Y and Wu FX:
CytoNCA: A cytoscape plugin for centrality analysis and evaluation
of protein interaction networks. Biosystems. 127:67–72. 2015.
View Article : Google Scholar : PubMed/NCBI
|
|
28
|
Bader GD and Hogue CW: An automated method
for finding molecular complexes in large protein interaction
networks. BMC Bioinformatics. 4:22003. View Article : Google Scholar : PubMed/NCBI
|
|
29
|
Ku MJ and Lee SY: Contributions of
aminoacyl-tRNA synthetase-interacting multifunctional protein-3 to
mammalian translation initiation. Amino Acids. 44:1241–1245. 2013.
View Article : Google Scholar : PubMed/NCBI
|
|
30
|
Kang T, Kwon NH, Lee JY, Park MC, Kang E,
Kim HH, Kang TJ and Kim S: AIMP3/p18 controls translational
initiation by mediating the delivery of charged initiator tRNA to
initiation complex. J Mol Biol. 423:475–481. 2012. View Article : Google Scholar : PubMed/NCBI
|
|
31
|
Hassan MK, Kumar D, Naik M and Dixit M:
The expression profile and prognostic significance of eukaryotic
translation elongation factors in different cancers. PLoS One.
13:e01913772018. View Article : Google Scholar : PubMed/NCBI
|
|
32
|
Yu X, Zheng H, Chan MT and Wu WK: HULC: An
oncogenic long non-coding RNA in human cancer. J Cell Mol Med.
21:410–417. 2017. View Article : Google Scholar : PubMed/NCBI
|
|
33
|
Kim SS, Hur SY, Kim YR, Yoo NJ and Lee SH:
Expression of AIMP1, 2 and 3, the scaffolds for the multi-tRNA
synthetase complex, is downregulated in gastric and colorectal
cancer. Tumori. 97:380–385. 2011. View Article : Google Scholar : PubMed/NCBI
|
|
34
|
Park BJ, Oh YS, Park SY, Choi SJ, Rudolph
C, Schlegelberger B and Kim S: AIMP3 haploinsufficiency disrupts
oncogene-induced p53 activation and genomic stability. Cancer Res.
66:6913–6918. 2006. View Article : Google Scholar : PubMed/NCBI
|
|
35
|
Han JM, Park BJ, Sang GP, Oh YS, Choi SJ,
Sang WL, Hwang SK, Chang SH, Cho MH and Kim S: AIMP2/p38, the
scaffold for the multi-tRNA synthetase complex, responds to
genotoxic stresses via p53. Proc Natl Acad Sci USA.
105:11206–11211. 2008. View Article : Google Scholar : PubMed/NCBI
|
|
36
|
Gurung PM, Veerakumarasivam A, Williamson
M, Counsell N, Douglas J, Tan WS, Feber A, Crabb SJ, Short SC,
Freeman A, et al: Loss of expression of the tumour suppressor gene
AIMP3 predicts survival following radiotherapy in muscle-invasive
bladder cancer. Int J Cancer. 136:709–720. 2015.PubMed/NCBI
|
|
37
|
Lee S, Yu KR, Ryu YS, Oh YS, Hong IS, Kim
HS, Lee JY, Kim S, Seo KW and Kang KS: miR-543 and miR-590-3p
regulate human mesenchymal stem cell aging via direct targeting of
AIMP3/p18. Age (Dordr). 36:97242014. View Article : Google Scholar : PubMed/NCBI
|
|
38
|
Abou-Shousha SA, Salah E and Wagdy E:
Study of P53 in peripheral blood and synovial mononuclear cells of
rheumatoid arthritis and osteoarthritis patients and its relation
to the degree of disease activity. Egypt J Immunol. 12:61–70.
2005.PubMed/NCBI
|
|
39
|
Chou CT, Yang JS and Lee MR: Apoptosis in
rheumatoid arthritis-expression of Fas, Fas-L, p53, and Bcl-2 in
rheumatoid synovial tissues. J Pathol. 193:110–116. 2015.
View Article : Google Scholar
|
|
40
|
Liang D, Halpert MM, Konduri V and Decker
WK: Stepping out of the cytosol: AIMp1/p43 potentiates the link
between innate and adaptive immunity. Int Rev Immunol. 34:367–381.
2015. View Article : Google Scholar : PubMed/NCBI
|
|
41
|
Choi JW, Kim DG, Park MC, Um JY, Han JM,
Park SG, Choi EC and Kim S: AIMP2 promotes TNFalpha-dependent
apoptosis via ubiquitin-mediated degradation of TRAF2. J Cell Sci.
122:2710–2715. 2009. View Article : Google Scholar : PubMed/NCBI
|
|
42
|
Hong SH, Cho JG, Yoon KJ, Lim DS, Kim CH,
Lee SW and Park SG: The antibody atliximab attenuates
collagen-induced arthritis by neutralizing AIMP1, an inflammatory
cytokine that enhances osteoclastogenesis. Biomaterials. 44:45–54.
2015. View Article : Google Scholar : PubMed/NCBI
|
|
43
|
Liu J, Zhu M, Chen W, Xie K, Shen W, Yuan
J, Cheng Y, Geng L, Wang Y, Jin G, et al: Genetic variants in
multisynthetase complex genes are associated with DNA damage levels
in chinese populations. Mutat Res. 786:8–13. 2016. View Article : Google Scholar : PubMed/NCBI
|
|
44
|
Ozgocmen S, Godekmerdan A and
Ozkurt-Zengin F: Acute-phase response, clinical measures and
disease activity in ankylosing spondylitis. Joint Bone Spine.
74:249–253. 2007. View Article : Google Scholar : PubMed/NCBI
|
|
45
|
Janciauskiene S, Moraga F and Lindgren S:
C-terminal fragment of alpha1-antitrypsin activates human monocytes
to a pro-inflammatory state through interactions with the CD36
scavenger receptor and LDL receptor. Atherosclerosis. 158:41–51.
2001. View Article : Google Scholar : PubMed/NCBI
|
|
46
|
Cardenas EI, Breaux K, Da Q, Flores JR,
Ramos MA, Tuvim MJ, Burns AR, Rumbaut RE and Adachi R: Platelet
Munc13-4 regulates hemostasis, thrombosis and airway inflammation.
Haematologica. 103:1235–1244. 2018. View Article : Google Scholar : PubMed/NCBI
|
|
47
|
Sun S, Fang K, Zhao Y, Yan X and Chang X:
Increased expression of alpha 1-anti-trypsin in the synovial
tissues of patients with ankylosing spondylitis. Clin Exp
Rheumatol. 30:39–44. 2012.PubMed/NCBI
|