Introduction
Colorectal cancer (CRC) is a global burden ranking
third in terms of incidence and second in terms of mortality, with
>1.8 million new CRC cases and 881,000 estimated deaths in 2018
(1). The main reason for the poor
5-year overall survival in CRC is late detection, when the
opportunity for treatment has passed. Despite progress in novel
therapies, early detection remains a challenge (2). A variety of tests are available for
screening and detecting CRC; all, however, have their disadvantages
(3–5). It is therefore urgent to identify
novel diagnostic and prognostic biomarkers for CRC.
In recent years, high-quality microarray and high-
throughput sequencing have been effective in detecting the
development and progression of CRC, and even in screening
biomarkers for CRC diagnosis, therapy and prognosis.
A number of gene profiles can be obtained from
public databases such as Gene Expression Omnibus (GEO) and The
Cancer Genome Atlas (TCGA), both of which can expand our
understanding of cancer. Limitations and inconsistent results may
exist, due to different microarray platforms and small sample
sizes, but integrated bioinformatics methods may overcome these
limitations.
Several recent studies have identified certain key
genes and pathways in CRC using bioinformatics analysis (6,7).
Based on these articles, updated datasets were selected and a gene
classification method (clusterProfiler package in R) was used for
Gene Ontology (GO) and Kyoto Encyclopedia of Genes and Genomes
(KEGG) enrichment analysis; the prognostic role of hub genes was
then ascertained using the TCGA dataset. In the present study,
integrated analysis was first performed to identify the common DEGs
from multiple microarrays (GSE113513, GSE9348 and GSE22598) and
TCGA CRC RNA-seq data. Next, GO and KEGG enrichment analysis was
conducted to identify the potential biological role of DEGs. A
protein-protein interaction (PPI) network created based on the
Search Tool for the Retrieval of Interacting Genes/Proteins
(STRING; version 10.5; http://string-db.org/) database, and the significant
modules and hub genes were then selected from the network. The
prognostic roles of hub genes were analyzed using TCGA.
Materials and methods
Gene expression profile data
The raw microarray data of CRC [GSE9348 (8), GSE22598 (9), GSE113513 (unpublished, 2018)] were
downloaded from the GEO database (10) (Table
I). All datasets fulfilled the following criteria: i) Human CRC
tissue samples were used for the profiles; ii) normal samples were
matched to the tumor tissues, when data could not be matched,
matching was based on patient information, such as age and sex; and
iii) The sample size per dataset was >10. The level 3 RNA
sequencing data of CRC and normal samples as well as the CRC
clinical information were downloaded from the Genomic Data Commons
(GDC) which were retrieved from TCGA (https://tcga-data.nci.nih.gov/tcga/) database.
 | Table I.Information on the datasets included
in the current study. |
Table I.
Information on the datasets included
in the current study.
| Dataset | Reference | Platform | No. of samples
(normal/tumor) |
|---|
| GSE9348 | Hong et al,
2010 (8) | [HG-U133_Plus_2]
Affymetrix Human Genome U133 Plus 2.0 Array | 12/12 |
| GSE22598 | Okazaki et
al, 2011 (9) | [HG-U133_Plus_2]
Affymetrix Human Genome U133 Plus 2.0 Array | 17/17 |
| GSE113513 | Peng et al,
2018 (unpublished) | [PrimeView]
Affymetrix Human Gene Expression Array | 14/14 |
| TCGA_CRC | The Cancer Genome
Atlas (TCGA) data portal | IlluminaHiseq
(Illumina, San Diego, CA) | 51/647 |
Data pre-processing and DEG
identification
CEL files from three Affymetrix microarrays were
downloaded from GEO, and pre-processed using the Affy package
(version 1.60.0; http://bioconductor.org/packages/release/bioc/html/affy.html)
in R software (version 3.4.3; http://www.r-project.org/). The Robust Multi-array
Average (RMA) method (11) was
used for the pre-processing, which included background correcting,
normalizing and calculating expression. The latest annotation files
were downloaded for re-annotation. The Limma package (version
3.34.8) (12) in R software was
subsequently used to screen DEGs between CRC and matched normal
tissues in the microarray. The RNA sequencing data were obtained
from TCGA and Ensembl Release 93 (http://jul2018.archive.ensembl.org/index.html) files
were used for annotation and all the data processing and
normalization were finished using the Perl (version 5.28.2;
http://www.perl.org/) and R scripts. The edgeR
package (version 3.24.3) (13) was
used for DEG screening and the trimmed mean of M-values
normalization method in edgeR was used to normalize the raw data.
Notably, |log2FC|>1, P<0.05 and adjusted P<0.05
were considered the cut-off criteria. Intersect function was used
to identify the common DEGs, and a Venn diagram was created using
Venny (version 2.1) (14). All
common DEGs in these datasets were selected for further study.
GO and KEGG pathway analyses
To elucidate the potential gene functional
annotation and pathway enrichment associated with the common DEGs.
GO (15,16) and KEGG (17–19)
analyses were performed using the clusterProfiler (version 3.10.1)
package (20). The enrichplot and
DOSE (21) packages were used to
supply enrichment result visualization to help interpretation.
P<0.05 and adjusted P<0.05 were set as the threshold
values.
PPI network construction and module
selection
The online STRING database was used to identify
potential interaction among the common DEGs, and a confidence score
of ≥0.4 was set as the threshold. Cytoscape (version 3.6.1)
(22) was used to visualize the
PPI network of common DEGs. The MCODE plug-in (23) was used to search sub-networks of
the PPI network and the default parameters (Degree cutoff ≥10, node
score cutoff ≥0.4, K-core ≥4, and max depth=100.) were set in the
functional interface of Cytoscape software. GO and KEGG enrichment
analyses of cluster modules were performed using ClueGO plug-in
(24) with default parameters. The
Cytohubba plug-in (25) was used
to explore hub genes, and the top ten were generated using Maximal
Clique Centrality (MCC), closeness and degree methods. The
intersect function was used to identify the common hub genes.
Survival analysis of hub genes
In order to identify the potential prognostic role
of hub genes, Kaplan-Meier analysis was performed based on the
expression and clinical data of TCGA, and Perl was used to merge
data. Hub genes were divided into two strata based on expression
level and median value. The survival (version 2.44–1.1; http://cran.r-project.org/web/packages/survival/index.html)
and survminer package (version 0.4.3; http://cran.r-project.org/web/packages/survminer/index.html)
in R were used.
Results
Identification of DEGs in GEO and
TCGA
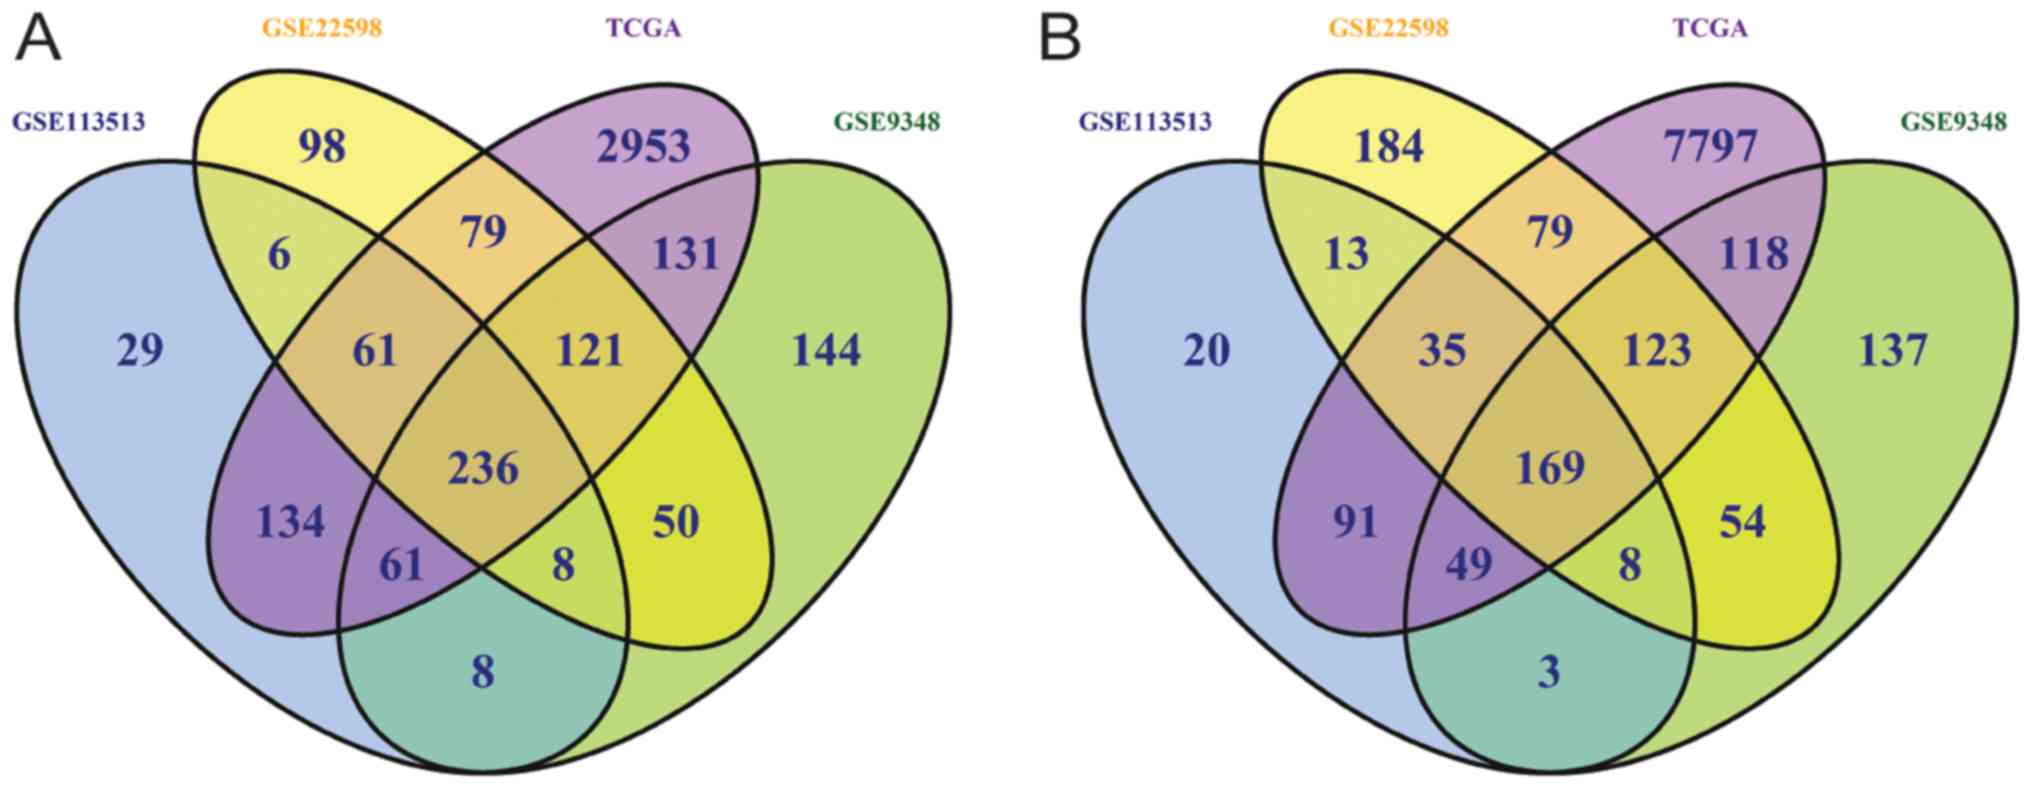
Following pre-processing of the raw data, DEGs were
identified by R package. In total, 931 DEGs (543 down- and 388
upregulated genes), 1,420 DEGs (759 down- and 661 upregulated
genes), 1,324 DEGs (659 down- and 665 upregulated genes) and 12,237
DEGs (3,776 down- and 8,461 upregulated genes) were screened from
the GSE113513, GSE9348, GSE22598 and TCGA datasets, respectively.
Heatmaps of DEGs are presented in Fig. S1, and volcano plots in Fig. S2. The intersect function revealed
405 common DEGs, including 236 down- and 169 upregulated DEGs from
four independent datasets (Fig.
1). The top 20 down- and upregulated DEGs from the four
datasets are listed in Table
II.
| Table II.Top 20 down- and upregulated
overlapping DEGs in GSE113513, GSE9348, GSE22598 and TCGA were
screened by intersected analysis. |
Table II.
Top 20 down- and upregulated
overlapping DEGs in GSE113513, GSE9348, GSE22598 and TCGA were
screened by intersected analysis.
| Genes | GSE113513 | GSE9348 | GSE22598 | TCGA | Regulation |
|---|
| AQP8 | −4.00 | −6.74 | −2.75 | −6.87 | Down |
| CLCA4 | −2.30 | −7.61 | −4.91 | −5.35 | Down |
| GUCA2B | −4.82 | −5.08 | −3.37 | −6.06 | Down |
| MS4A12 | −3.68 | −6.04 | −3.54 | −5.36 | Down |
| GUCA2A | −4.10 | −5.00 | −3.72 | −5.11 | Down |
| CA2 | −3.68 | −5.32 | −3.76 | −4.81 | Down |
| ABCG2 | −2.39 | −6.03 | −3.93 | −4.68 | Down |
| CLDN8 | −3.69 | −4.40 | −3.65 | −5.07 | Down |
| GCG | −4.57 | −3.92 | −4.15 | −4.13 | Down |
| ZG16 | −3.18 | −4.70 | −4.45 | −4.44 | Down |
| PKIB | −3.21 | −4.99 | −3.85 | −3.95 | Down |
| CA4 | −3.39 | −4.54 | −3.07 | −4.76 | Down |
| BEST4 | −3.50 | −2.72 | −3.66 | −5.85 | Down |
| CA1 | −3.33 | −3.20 | −1.94 | −6.51 | Down |
| MT1M | −3.29 | −3.90 | −3.35 | −4.30 | Down |
| CD177 | −2.84 | −4.29 | −2.35 | −5.22 | Down |
| HSD17B2 | −2.63 | −5.14 | −3.04 | −3.39 | Down |
| INSL5 | −3.31 | −2.03 | −3.00 | −5.82 | Down |
| ADH1C | −3.26 | −3.50 | −3.10 | −4.01 | Down |
| CLCA1 | −3.45 | −3.77 | −3.62 | −2.54 | Down |
| FOXQ1 | 4.47 | 5.16 | 5.55 | 6.47 | Up |
| KRT23 | 3.69 | 4.25 | 4.28 | 7.37 | Up |
| LY6G6D | 3.50 | 4.09 | 3.63 | 5.42 | Up |
| MMP7 | 3.15 | 3.11 | 2.38 | 7.03 | Up |
| CDH3 | 2.77 | 2.31 | 2.76 | 5.77 | Up |
| MMP3 | 2.91 | 2.94 | 2.77 | 4.83 | Up |
| CST1 | 1.25 | 2.42 | 1.00 | 8.33 | Up |
| CRNDE | 3.17 | 2.36 | 2.73 | 4.60 | Up |
| DPEP1 | 2.97 | 3.06 | 4.14 | 2.61 | Up |
| MMP1 | 2.46 | 2.59 | 3.14 | 4.56 | Up |
| EPHX4 | 3.01 | 2.32 | 2.95 | 4.43 | Up |
| CTHRC1 | 1.21 | 4.47 | 3.15 | 3.78 | Up |
| CLDN1 | 2.18 | 2.81 | 2.74 | 4.84 | Up |
| CEL | 1.56 | 2.53 | 2.37 | 6.10 | Up |
| CLDN2 | 1.54 | 2.57 | 2.75 | 5.57 | Up |
| SLC35D3 | 1.79 | 2.97 | 3.24 | 4.35 | Up |
| COL11A1 | 1.59 | 2.49 | 1.93 | 6.33 | Up |
| CXCL3 | 3.22 | 3.60 | 2.34 | 2.92 | Up |
| SLCO1B3 | 1.43 | 1.64 | 2.55 | 6.44 | Up |
| CKMT2 | 3.33 | 2.55 | 2.68 | 3.46 | Up |
GO and KEGG enrichment analysis
To explore the potential biological function of
common DEGs, GO and KEGG pathways enrichment analyses were
conducted using the ClusterProfiler package. In the present study,
downregulated DEGs were mainly enriched in ‘detoxification of
copper ion’ (BP), ‘oxidoreductase activity, acting on CH-OH group
of donors, NAD or NADP as acceptor’ (MF) and ‘brush border’ (CC)
respectively. Upregulated DEGs were mainly involved in ‘nuclear
division’ (BP), ‘snoRNA binding’ (MF) and ‘nucleolar part’
(CC).'The GO distribution of down- and upregulated DEGs is
presented in Fig. 2A and B and
details of the top 15 GO terms in Table III.
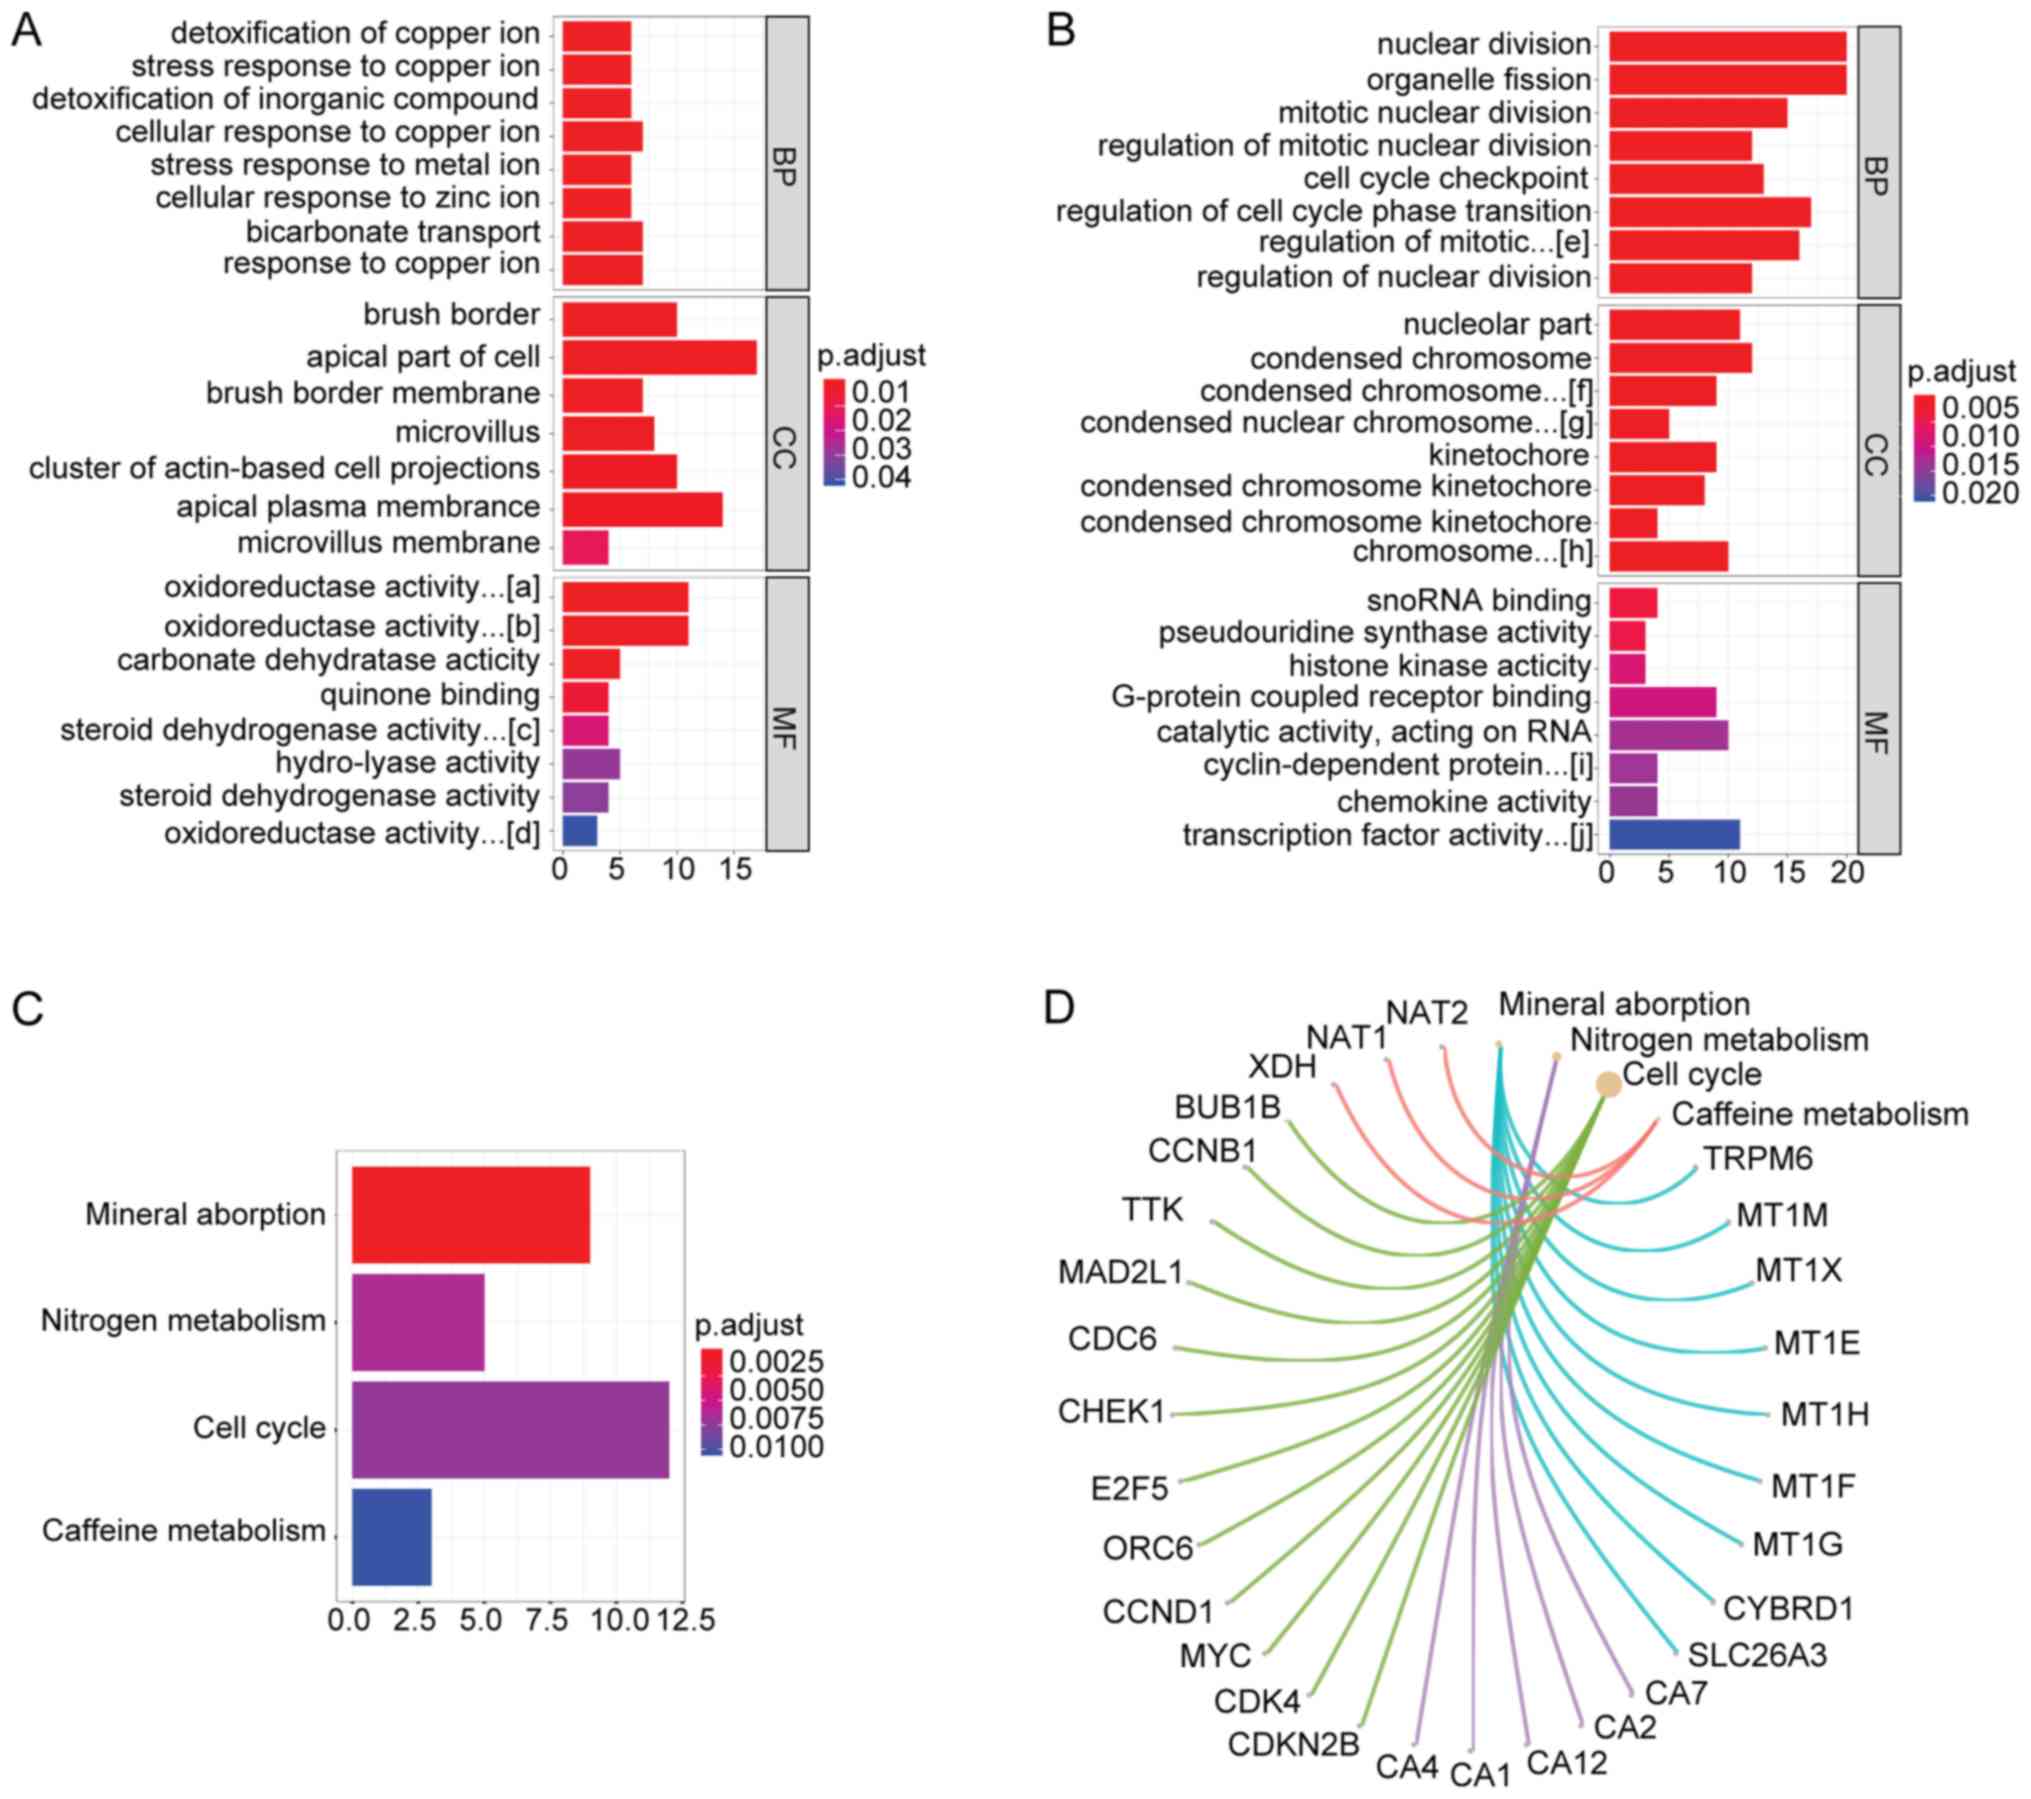 | Figure 2.GO and KEGG enrichment analysis of
the overlapping DEGs. (A and B) Top significantly enriched GO terms
of down- and upregulated DEGs, including BP, CC and MF. The x-axis
represents the number of DEGs involved in GO terms, and the y-axis
the significantly enriched GO terms. (C) KEGG pathway enrichment
analysis of overlapping DEGs. The x-axis indicates the number of
DEGs involved in the significant KEGG pathway, and the y-axis the
terms of the significant KEGG pathway. (D) DEGs associated with the
significant KEGG pathway. GO, gene ontology; KEGG, Kyoto
Encyclopedia of Genes and Genomes; DEGs, differentially expressed
genes. (a) Oxidoreductase activity, acting on the CH-OH group of
donors, NAD or NADP as acceptor; (b) oxidoreductase activity,
acting on CH-OH group of donors; (c) steroid dehydrogenase
activity, acting on the CH-OH group of donors, NAD or NADP as
acceptor; (d) oxidoreductase activity, acting on the CH-NH2 group
of donors, oxygen as acceptor; (e) regulation of mitotic cell cycle
phase transition; (f) condensed chromosome, centromeric region; (g)
condensed nuclear chromosome, centromeric region; (h) chromosome,
centromeric region; (i) cyclin-dependent protein serine/threonine
kinase regulator activity; (j) transcription factor activity, RNA
polymerase II proximal promoter sequence-specific DNA binding. |
| Table III.GO analysis of down- and upregulated
overlapping DEGs associated with CRC. |
Table III.
GO analysis of down- and upregulated
overlapping DEGs associated with CRC.
| Expression | Terms | ID | Description | q-value | Genes |
|---|
| Upregulated | BP | GO:0000280 | Nuclear
division |
4.33×10⁻⁷ |
RRS1/CKS2/TRIP13/CCND1/FIGNL1/TPX2/ANLN/UBE2C/CHEK1/NUF2/RAD54B/DLGAP5/CDC6/MAD2L1/TOP2A/TTK/CCNB1/ASPM/BUB1B/AURKA |
|
| BP | GO:0048285 | Organelle
fission |
1.16×10⁻⁶ |
RRS1/CKS2/TRIP13/CCND1/FIGNL1/TPX2/ANLN/UBE2C/CHEK1/NUF2/RAD54B/DLGAP5/CDC6/MAD2L1/TOP2A/TTK/CCNB1/ASPM/BUB1B/AURKA |
|
| BP | GO:0140014 | Mitotic nuclear
division |
6.51×10⁻⁶ |
RRS1/TRIP13/CCND1/TPX2/ANLN/UBE2C/CHEK1/NUF2/DLGAP5/CDC6/MAD2L1/TTK/CCNB1/BUB1B/AURKA |
|
| BP | GO:0007088 | Regulation of
mitotic nuclear division |
1.18×10⁻⁵ |
TRIP13/CCND1/ANLN/UBE2C/CHEK1/DLGAP5/CDC6/MAD2L1/TTK/CCNB1/BUB1B/AURKA |
|
| BP | GO:0000075 | Cell cycle
checkpoint |
1.18×10⁻⁵ |
TRIP13/CCND1/ARID3A/CHEK1/CDC6/MAD2L1/TOP2A/TTK/CCNB1/SOX4/BUB1B/AURKA/PROX1 |
|
| CC | GO:0044452 | Nucleolar part |
4.66×10⁻⁵ |
TAF1D/DKC1/UTP4/WDR43/NOP58/RRS1/RPP40/NUFIP1/ORC6/POLR1D/E2F5 |
|
| CC | GO:0000793 | Condensed
chromosome |
4.66×10⁻⁵ |
RRS1/SKA3/CHEK1/NUF2/CENPA/MAD2L1/TOP2A/CCNB1/SPC25/ERCC6L/BUB1B/AURKA |
|
| CC | GO:0000779 | Condensed
chromosome, centromeric region |
5.94×10⁻⁵ |
SKA3/NUF2/CENPA/MAD2L1/CCNB1/SPC25/ERCC6L/BUB1B/AURKA |
|
| CC | GO:0000780 | Condensed nuclear
Chromosome, centromeric region |
1.13×10⁻⁴ |
NUF2/CENPA/CCNB1/BUB1B/AURKA |
|
| CC | GO:0000776 | Kinetochore |
1.13×10⁻⁴ |
SKA3/NUF2/CENPA/MAD2L1/TTK/CCNB1/SPC25/ERCC6L/BUB1B |
|
| MF | GO:0030515 | snoRNA binding |
2.99×10⁻³ |
DKC1/NOP58/DDX21/NUFIP1 |
|
| MF | GO:0009982 | Pseudouridine
synthase activity |
3.70×10⁻³ | PUS1/PUS7/DKC1 |
|
| MF | GO:0035173 | Histone kinase
activity |
7.05×10⁻³ |
CHEK1/CCNB1/AURKA |
|
| MF | GO:0001664 | G protein-coupled
receptor binding |
8.09×10⁻³ |
CXCL3/RNF43/HOMER1/NMU/CXCL8/ZNRF3/CXCL1/CTHRC1/CXCL5 |
|
| MF | GO:0140098 | Catalytic activity,
acting on RNA |
1.15×10⁻² |
NOB1/PUS1/EXOSC5/NOP2/RPP40/DDX21/RNASEH2A/POLR1D/RAD54B/AZGP1 |
| Downregulated | BP | GO:0010273 | Detoxification of
copper ion |
1.22×10⁻⁵ |
MT1M/MT1X/MT1E/MT1H/MT1F/MT1G |
|
| BP | GO:1990169 | Stress response to
copper ion |
1.22×10⁻⁵ |
MT1M/MT1X/MT1E/MT1H/MT1F/MT1G |
|
| BP | GO:0061687 | Detoxification of
inorganic compound |
1.22×10⁻⁵ |
MT1M/MT1X/MT1E/MT1H/MT1F/MT1G |
|
| BP | GO:0071280 | Cellular response
to copper ion |
1.22×10⁻⁵ |
MT1M/MT1X/MT1E/MT1H/MT1F/MT1G/AOC1 |
|
| BP | GO:0097501 | Stress response to
metal ion |
1.35×10⁻⁵ |
MT1M/MT1X/MT1E/MT1H/MT1F/MT1G |
|
| CC | GO:0005903 | Brush border |
6.96×10⁻⁵ |
CDHR5/TRPM6/SCIN/CDHR2/CA4/LIMA1/CYBRD1/MYO1A/SLC26A3/SI |
|
| CC | GO:0045177 | Apical part of
cell |
3.15×10⁻⁴ |
ABCG2/CA2/RAB27A/CDHR5/PTPRH/TRPM6/AQP8/CDHR2/CA4/SCNN1B/CLCA4/CEACAM1/FABP1/CEACAM7/MYO1A/SLC26A3/SI |
|
| CC | GO:0031526 | Brush border
membrane |
3.15×10⁻⁴ |
CDHR5/TRPM6/CDHR2/CA4/LIMA1/CYBRD1/SLC26A3 |
|
| CC | GO:0005902 | Microvillus |
6.78×10⁻⁴ |
CA2/CDHR5/PTPRH/CDHR2/CEACAM1/CLCA1/AOC3/MYO1A |
|
| CC | GO:0098862 | Cluster of
actin-based cell projections |
8.31×10⁻⁴ |
CDHR5/TRPM6/SCIN/CDHR2/CA4/LIMA1/CYBRD1/MYO1A/SLC26A3/SI |
|
| MF | GO:0016616 | Oxidoreductase
activity, acting on the CH-OH group of donors, NAD or NADP as
acceptor |
6.48×10⁻⁵ |
UGDH/ADH1B/HPGD/LDHD/ADH1C/DHRS11/DHRS9/HSD17B2/AKR1B10/HSD11B2/BMP2 |
|
| MF | GO:0016614 | Oxidoreductase
activity, acting on CH-OH group of donors |
1.09×10⁻⁴ |
UGDH/ADH1B/HPGD/LDHD/ADH1C/DHRS11/DHRS9/HSD17B2/AKR1B10/HSD11B2/BMP2 |
|
| MF | GO:0004089 | Carbonate
dehydratase activity |
1.26×10⁻⁴ |
CA7/CA2/CA12/CA1/CA4 |
|
| MF | GO:0048038 | Quinone
binding |
4.90×10⁻³ |
ETFDH/TP53I3/AOC3/AOC1 |
|
| MF | GO:0033764 | Steroid
dehydrogenase activity, acting on the CH-OH group of donors, NAD or
NADP as acceptor |
1.52×10⁻² |
DHRS11/DHRS9/HSD17B2/HSD11B2 |
According to KEGG enrichment analysis, four
significant pathways of common DEGs were identified, including:
‘Mineral absorption’, ‘nitrogen metabolism’, ‘cell cycle’ and
‘caffeine metabolism’ (Fig. 2C).
The significant genes in these pathways are presented in Fig. 2D.
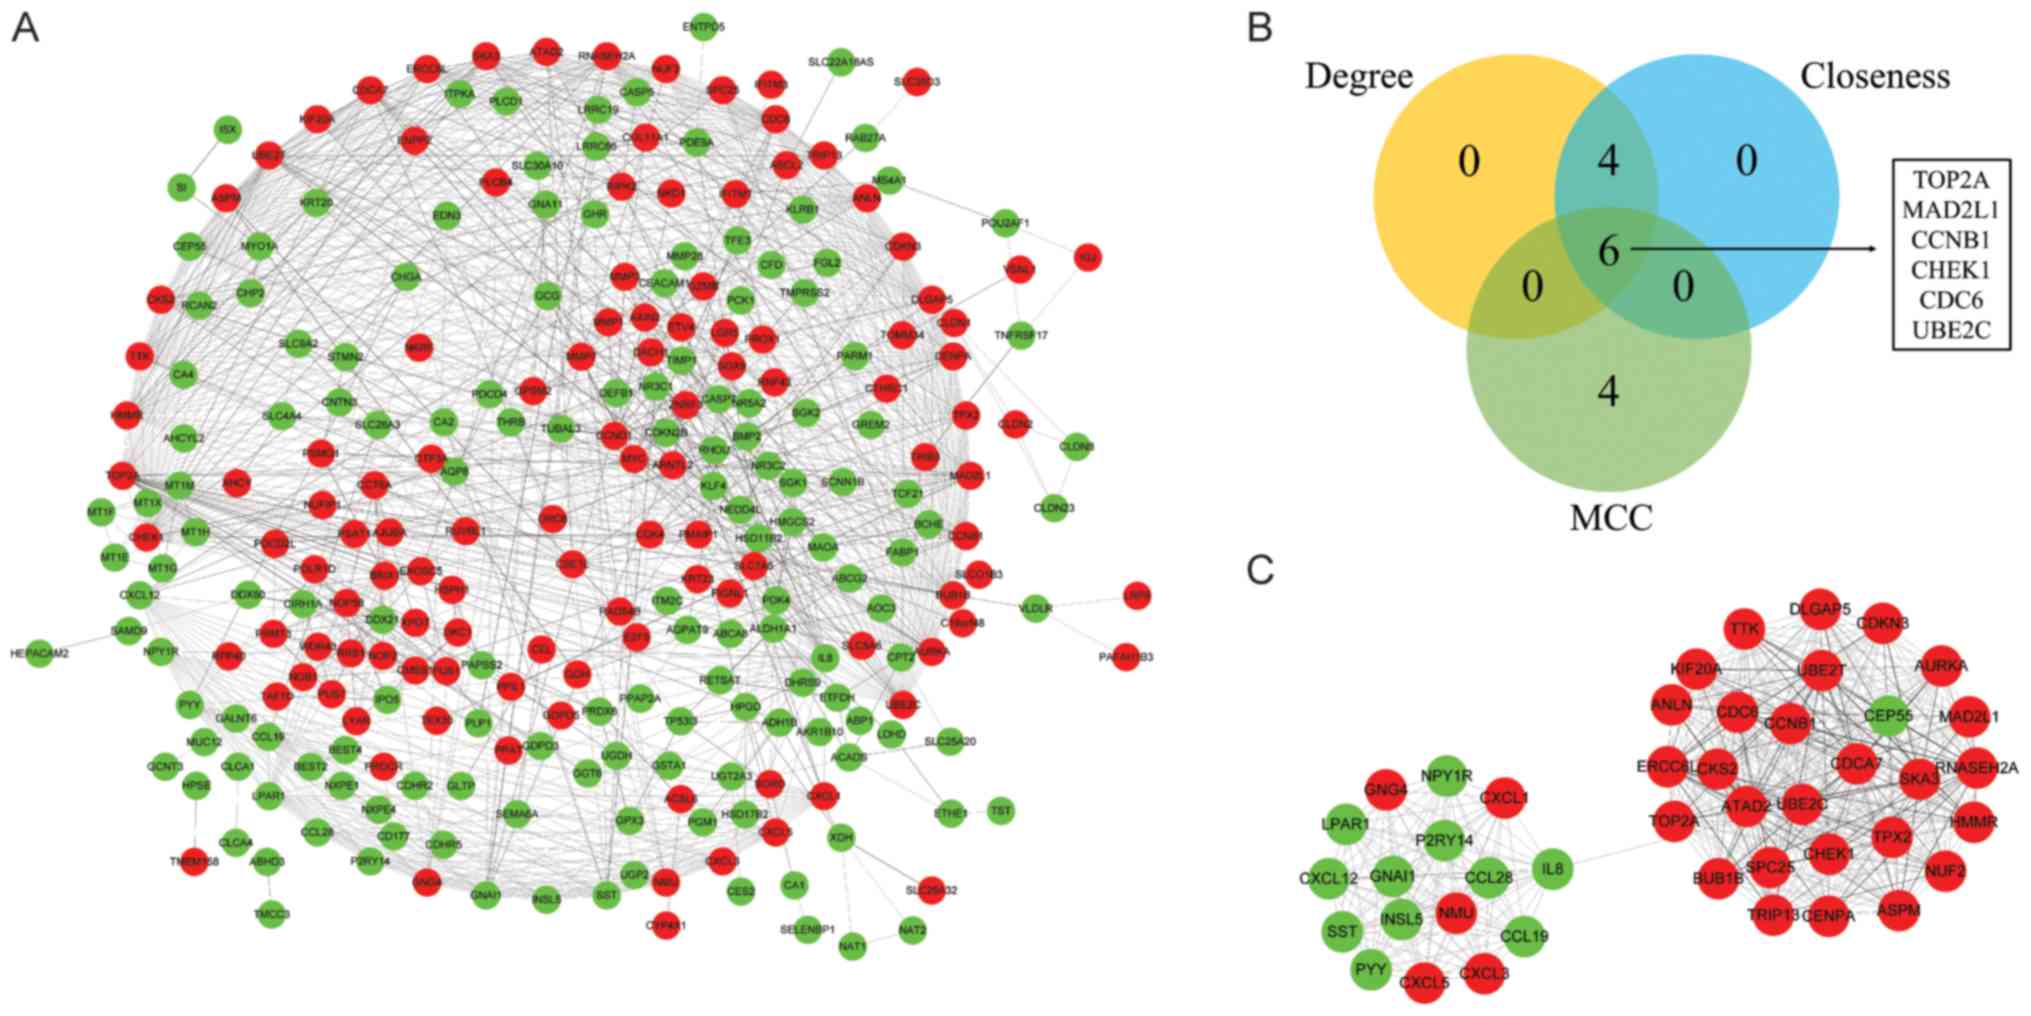
PPI network and module selection
The PPI network of DEGs was constructed with 268
nodes and 1,027 edges (Fig. 3A).
The Degree, MCC and Closeness methods were performed to calculate
the top 10 ranking hub genes. The results revealed 6 genes
identified as hub genes, including DNA topoisomerase II-α (TOP2A),
mitotic arrest deficient 2 like 1 (MAD2L1), cyclin B1 (CCNB1),
checkpoint kinase 1 (CHEK1), cell division cycle 6 (CDC6),
ubiquitin conjugating enzyme E2 C (UBE2C) (Fig. 3B). MCODE was used to identify the
significant cluster modules in the PPI network and the top module
was selected (Fig. 3C). Following
GO annotation screening, the module (44 nodes and 462 edges) was
revealed to be associated with ‘sister chromatid segregation’ (BP),
‘chemokine activity’ (MF), ‘condensed chromosome (CC)’ (Table IV) and KEGG pathway enrichment
analysis revealed that the top module was mainly enriched in ‘cell
cycle’, ‘progesterone-mediated oocyte maturation’, ‘chemokine
signaling pathway’, ‘IL-17 signaling pathway’, ‘legionellosis’ and
‘rheumatoid arthritis’; related information were represent in
Table V.
| Table IV.GO analysis of selected
module-associated DEGs. |
Table IV.
GO analysis of selected
module-associated DEGs.
| ID | GO Terms | Ontology | q-value | Genes |
|---|
| GO:0000819 | Sister chromatid
segregation | BP |
5.54×10⁻¹³ |
BUB1B/CCNB1/CDC6/CENPA/DLGAP5/ERCC6L/MAD2L1/NUF2/SPC25/TOP2A/TRIP13/TTK/UBE2C |
| GO:0007088 | Regulation of
mitotic nuclear division | BP |
8.77×10⁻¹² |
ANLN/AURKA/BUB1B/CCNB1/CDC6/CHEK1/DLGAP5/MAD2L1/TRIP13/TTK/UBE2C |
| GO:0098813 | Nuclear
chromosome | BP |
1.24×10⁻¹¹ segregation |
BUB1B/CCNB1/CDC6/CENPA/DLGAP5/ERCC6L/MAD2L1/NUF2/SPC25/TOP2A/TRIP13/TTK/UBE2C |
| GO:0051304 | Chromosome
separation | BP |
1.37×10⁻¹¹ |
BUB1B/CCNB1/CDC6/DLGAP5/MAD2L1/TOP2A/TRIP13/TTK/UBE2C |
| GO:0030071 | Regulation of
mitotic metaphase/anaphase transition | BP |
1.46×10⁻¹¹ |
BUB1B/CCNB1/CDC6/DLGAP5/MAD2L1/TRIP13/TTK/UBE2C |
| GO:0000793 | Condensed
chromosome | CC |
2.53×10⁻¹⁰ |
AURKA/BUB1B/CCNB1/CENPA/CHEK1/ERCC6L/MAD2L1/NUF2/SKA3/SPC25/TOP2A |
| GO:0000779 | Condensed
chromosome/centromeric region | CC |
5.40×10⁻¹⁰ |
AURKA/BUB1B/CCNB1/CENPA/ERCC6L/MAD2L1/NUF2/SKA3/SPC25 |
| GO:0000775 |
Chromosome/centromeric region | CC |
1.59×10⁻⁹ |
AURKA/BUB1B/CCNB1/CENPA/ERCC6L/MAD2L1/NUF2/SKA3/SPC25/TTK |
| GO:0000776 | Kinetochore | CC |
1.80×10⁻⁹ |
BUB1B/CCNB1/CENPA/ERCC6L/MAD2L1/NUF2/SKA3/SPC25/TTK |
| GO:0000777 | Condensed
chromosome kinetochore | CC |
8.17×10⁻⁹ |
BUB1B/CCNB1/CENPA/ERCC6L/MAD2L1/NUF2/SKA3/SPC25 |
| GO:0008009 | Chemokine
activity | MF |
1.41×10⁻⁹ |
CCL19/CCL28/CXCL1/CXCL12/CXCL3/CXCL5/CXCL8 |
| GO:0042379 | Chemokine receptor
binding | MF |
8.09×10⁻⁹ |
CCL19/CCL28/CXCL1/CXCL12/CXCL3/CXCL5/CXCL8 |
| GO:0045236 | CXCR chemokine
receptor binding | MF |
1.46×10⁻⁸ |
CXCL1/CXCL12/CXCL3/CXCL5/CXCL8 |
| GO:0035173 | Histone kinase
activity | MF |
1.99×10⁻⁴ |
AURKA/CCNB1/CHEK1 |
| Table V.KEGG pathway analysis of selected
module-associated DEGs. |
Table V.
KEGG pathway analysis of selected
module-associated DEGs.
| KEGG | Count | q-value | Genes |
|---|
| Cell cycle | 6 |
1.88×10⁻⁵ |
BUB1B/CCNB1/CDC6/CHEK1/MAD2L1/TTK |
|
Progesterone-mediated oocyte
maturation | 4 |
7.64×10⁻⁴ |
AURKA/CCNB1/GNAI1/MAD2L1 |
| Chemokine signaling
pathway | 9 |
4.69×10⁻⁸ |
CCL19/CCL28/CXCL1/CXCL12/CXCL3/CXCL5/CXCL8/GNAI1/GNG4 |
| IL-17 signaling
pathway | 4 |
9.02×10⁻⁴ |
CXCL1/CXCL3/CXCL5/CXCL8 |
| Legionellosis | 3 |
9.37×10⁻⁴ |
CXCL1/CXCL3/CXCL8 |
| Rheumatoid
arthritis | 4 |
1.06×10⁻³ |
CXCL1/CXCL12/CXCL5/CXCL8 |
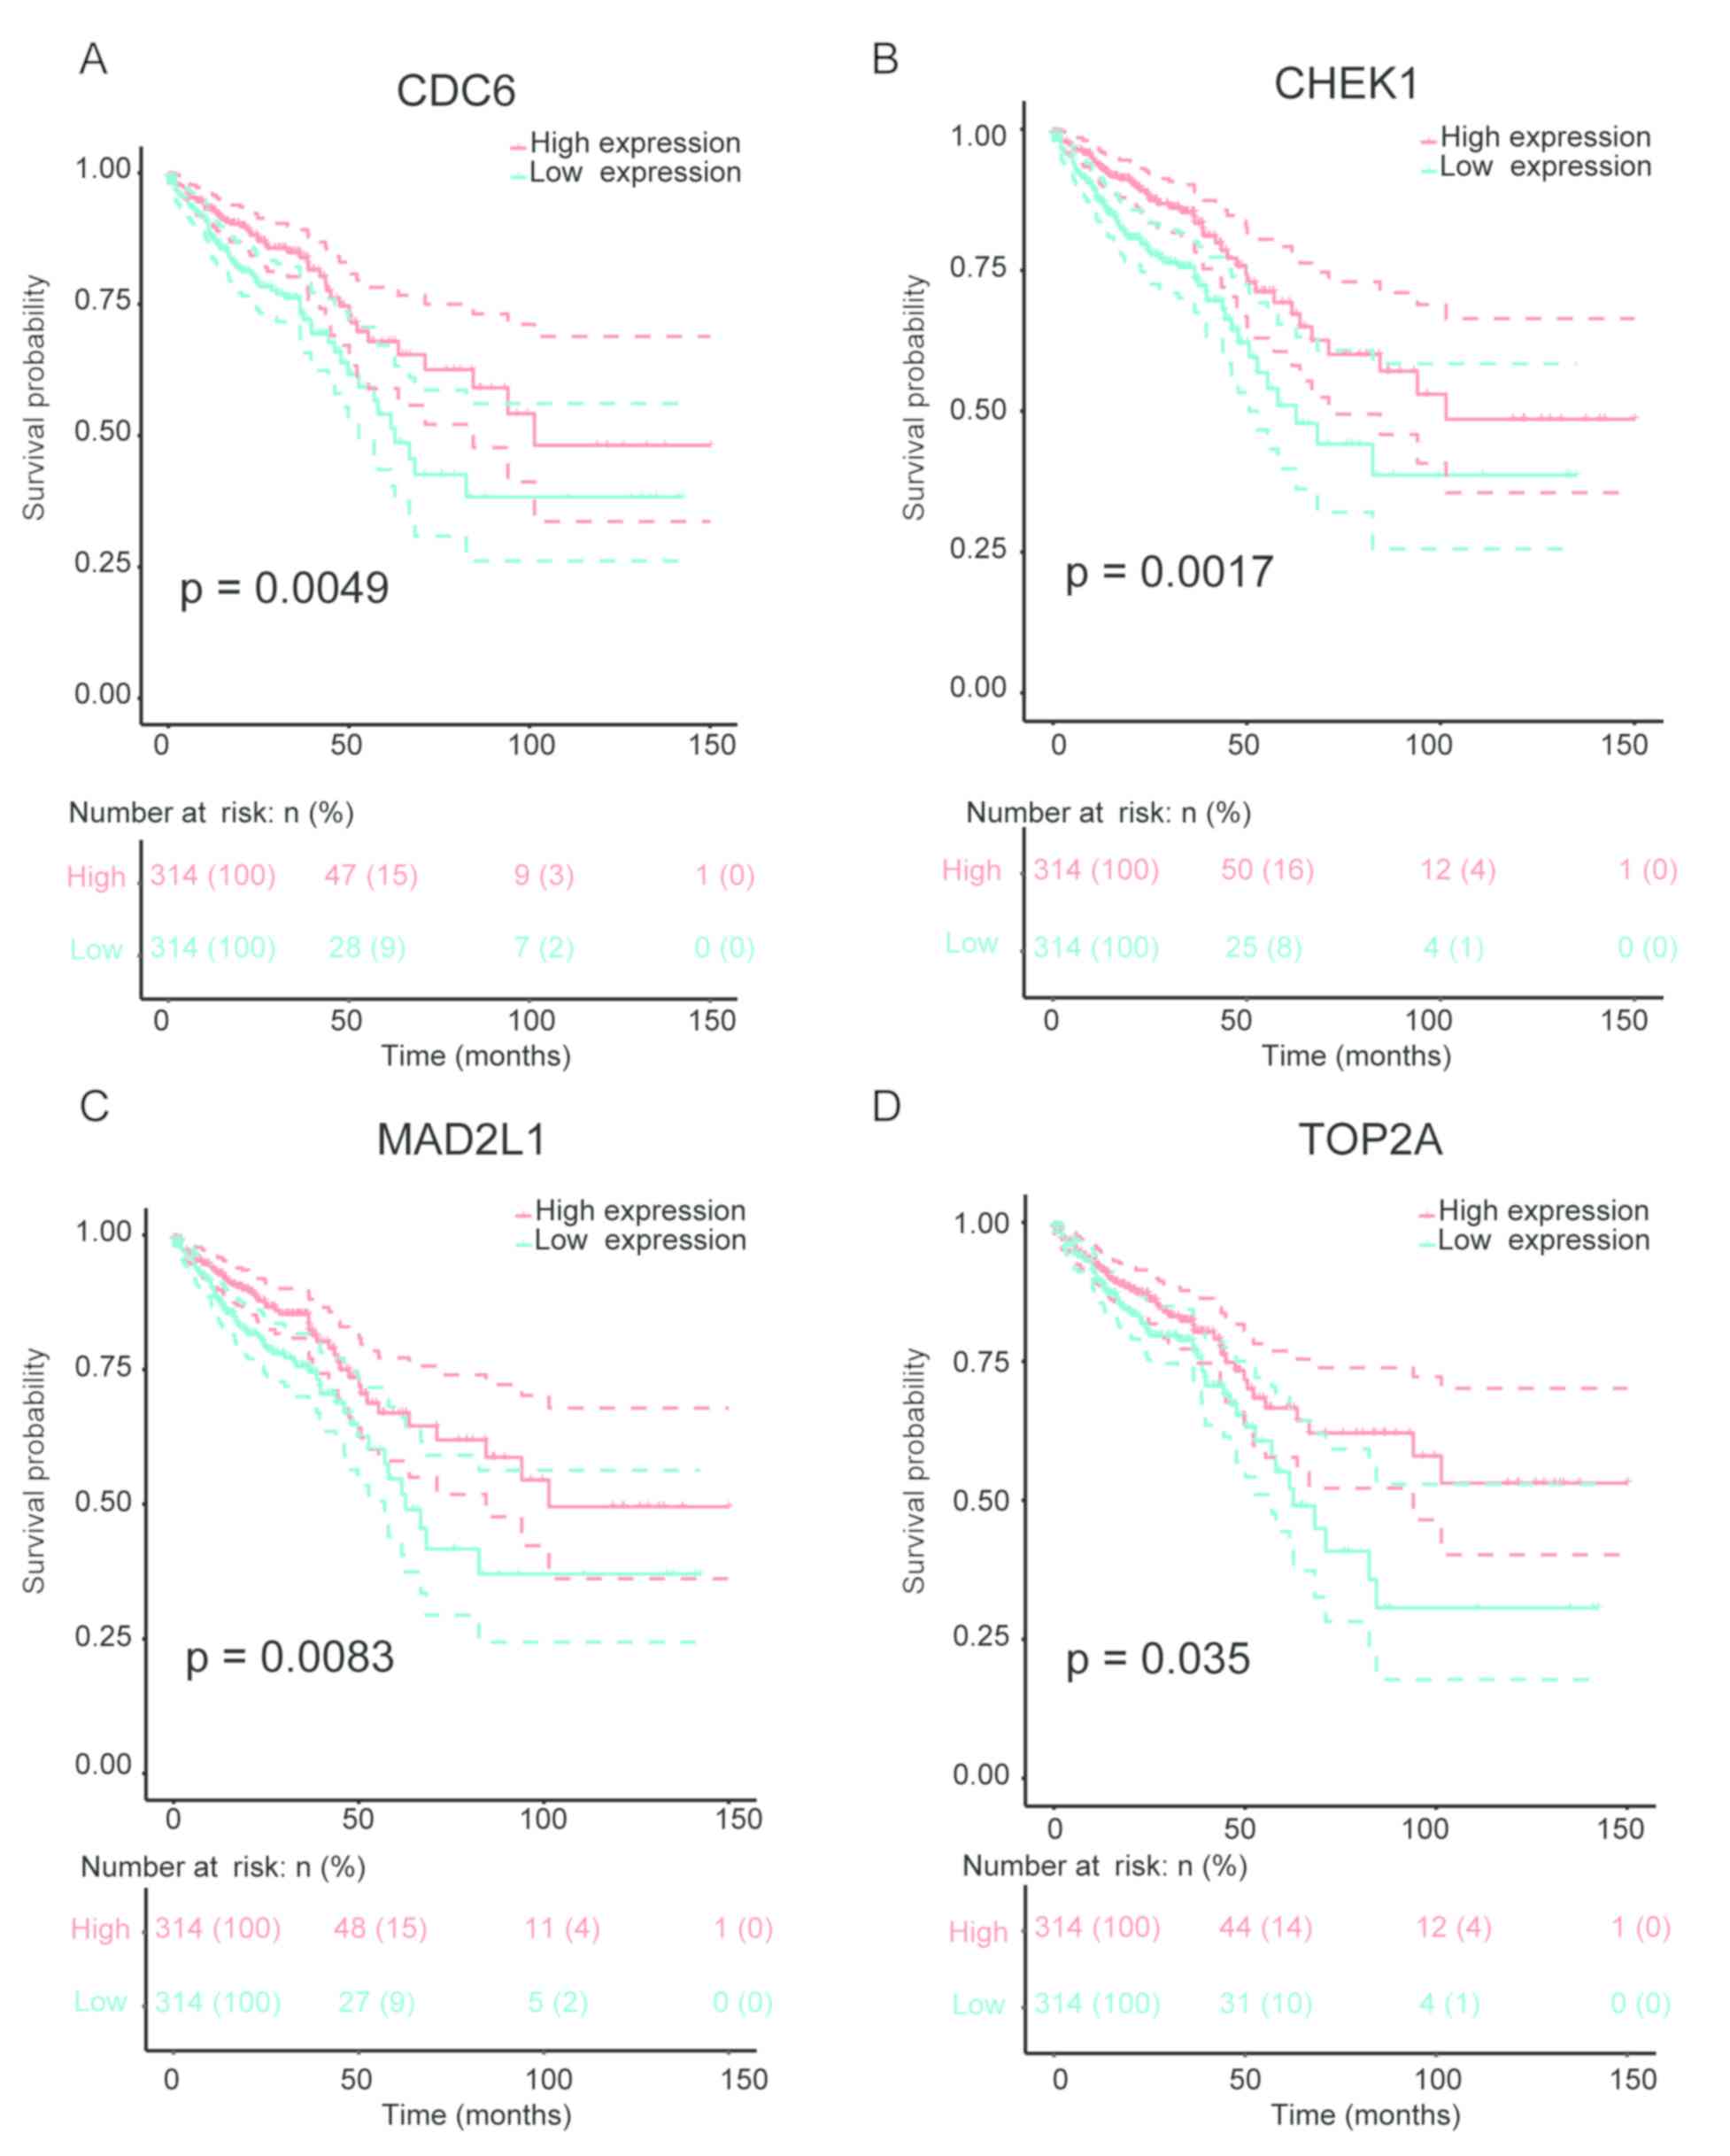
Survival analysis
The prognostic role of hub genes was analyzed using
Kaplan-Meier method based on the TCGA data. Among these hub genes,
a low expression of CDC6, CHEK1, MAD2L1 and TOP2A was associated
with poor prognosis in CRC patients (Fig. 4).
Discussion
In the present study, three GEOs and TCGA data were
integrated, and non-paired GEO data were manually matched to
increase accuracy and stabilization. In total, 236 down- and 169
upregulated DEGs were identified. The common downregulated DEGs
were mostly enriched in ‘detoxification of copper ion’ (BP),
‘oxidoreductase activity, acting on CH-OH group of donors, NAD or
NADP as acceptor’ (MF) and ‘brush border’ (CC), and the upregulated
DEGs were mainly associated with ‘nuclear division’ (BP), ‘snoRNA
binding’ (MF) and ‘nucleolar part’ (CC). Moreover, KEGG enrichment
analysis identified that the common DEGs were largely involved in
‘mineral absorption’, ‘nitrogen metabolism’, ‘cell cycle’ and
‘caffeine metabolism’. Investigating these significant pathways may
promote the understanding of CRC development.
Minerals are one of the five fundamental groups of
nutrients; regular mineral absorption plays a vital role in
sustaining life. Deficiency and insufficiency of minerals may be
associated with and increase the risk of cancer; for example,
efficient absorption of vitamin D may prevent CRC (26). The cell cycle is controlled by
various mechanisms, which ensure correct cell division; loss of
normal cell cycle control is a hallmark of cancer (27). An increasing number of studies has
revealed that targeting the deregulation of the cell cycle in
cancer is a potential therapeutic strategy (28). Therefore, investigating the cell
cycle pathway may promote the understanding of carcinogenic
mechanisms and insights into CRC treatment options. Nitrogen is an
essential component of life that is involved in processes of both
proteins and nucleic acids. Aberrant expression of nitrogen species
could affect the risk of cancer (29). Certain studies have reported that
caffeine could decrease the risk of CRC (30), inhibit colon cancer cell
proliferation (31,32). Metabolic profiling revealed that
caffeine metabolism differed significantly between colorectal
adenoma polyps and CRC patients which may influence CRC development
and outcome (33). Investigating
these significant pathways may elucidate the mechanism of CRC
progression.
Recently, certain important biomarkers, including
CCL19, CXCL1, CXCL5, CXCL11, CXCL12, GNG4, INSL5, NMU, PYY and SST,
were identified using integrated bioinformatics analysis.
Furthermore, a prognostic gene signature consisting of 9 genes was
also identified (34). In the
present study, data from three GEO datasets (GSE22598, GSE113513
and GSE9348) and TCGA were combined for screening stable DEGs, then
different calculation methods and intersect function analysis were
used, and potential biomarkers were revealed that had not been
previously screened out. A PPI network was constructed with DEGs,
and then 6 hub genes (TOP2A, MAD2L1, CCNB1, CHEK1, CDC6 and UBE2C)
were identified. Following survival analysis based on the TCGA
data, the low expression of CDC6, CHEK1, MAD2L1 and TOP2A was
revealed to be associated with poor prognosis. TOP2A was an
important nuclear enzyme involved in DNA transcription and
replication. Aberrant TOP2A expression has been identified in
several types of cancer, such as CRC, breast carcinomas, gastric
cancer and bladder carcinomas (35–38).
In addition, the high expression of TOP2A was revealed to be
correlated with a worse survival in breast cancer, small-cell lung
cancer and malignant melanoma, indicating that TOP2A can serve as a
prognostic biomarker (39–41). TOP2A was also revealed to be
associated with advanced CRC and chemotherapeutic resistance via
the inhibition of apoptosis (35).
Zhou et al (42) revealed
that TOP2A involvement in T-cell factor transcription may transmit
a mechanism of multidrug resistance to TOP2A inhibitors, which can
be an effective treatment option for CRC. Therefore, further
investigation is required to elucidate the mechanism of TOP2A in
the development, progression and treatment of CRC. CDC6 is
essential for the initiation of DNA replication and contains
ATP-binding and hydrolytic activities, which are required for the
formation of the pre-replicative complex (43,44).
It is also involved in the cell cycle by localizing to the
centrosomes during the S and G2 phases (45). It has been reported that CDC6
affects proliferation during the early differentiation stages
(46), and that the overexpression
of CDC6 in tumors could signify that it may be an oncogenic target.
CHEK1 is a serine/threonine kinase involved in delaying cell cycle
progression; it is also required for the activation of DNA repair
in response to the presence of DNA damage or unreplicated DNA
(47). MAD2L1 (also termed MAD2)
plays an important role in maintaining the spindle checkpoint
function. MAD2L1 was revealed to be correlated with disease outcome
in patients with breast cancer (48), and an increased MAD2L1 expression
in neuroblastoma cells to be associated with poor prognosis
(49).
The PPI network module analysis revealed that the
development of CRC was mainly associated with the cell cycle
pathway. It has been reported that cell cycle signaling pathways
play a vital role in controlling normal progression, and regulating
cell proliferation and apoptosis; an uncontrolled cell cycle may
result in cancer (27). Therefore,
cell cycle regulation is a useful way of interfering with the
development of CRC.
Recent studies have indicated that mRNAs, miRNAs and
lncRNAs play a crucial role in a variety of biological processes
associated with human diseases (50,51).
Chen et al (52–55), have constructed powerful
computational models to predict potential associations between
miRNAs/lncRNAs and human diseases, providing a reliable and
powerful tool for disease-association prediction. With the
application of computational models, more stable and effective
biomarkers (miRNAs/lncRNAs) would be revealed, and the pathogenesis
of CRC would be explained at different molecular levels.
The present results provided useful information for
early diagnosis and prevention, and supplied an effective
therapeutic target for CRC. However, the study has certain
limitations: i) By mixing all cancer types together, the focused
insights in genetic characteristics of different subtypes of tumors
may not be revealed, therefore, a stratification analysis of major
clinical information should be performed; ii) more databases should
be used for validation of the DEGs in future research; iii) in the
present study, all tumor samples were included for the evaluation
of the prognositic role of hub genes, however, it would be better
to exclude CRC without matching normal controls, which would reduce
the difference arising from different clinical information, and iv)
intersect function analysis of GEO and TCGA was performed to screen
DEGs, however, among these data sets, GSE22598 included colon
cancer treated with chemotherapy which may affect the results,
therefore, sample information should be more focused in future
research. In addition, biological experiments are required to
confirm these results. In conclusion, in the present study DEGs
were identified by integrated bioinformatics analysis, in order to
explore the role of DEGs in the progression and prognosis of CRC.
Consequently, 405 DEGs were screened out, and hub genes CDC6,
CHEK1, MAD2L1 and TOP2A were revealed to be promising prognostic
biomarkers among CRC patients.
Supplementary Material
Supporting Data
Acknowledgements
Not applicable.
Funding
The present study was supported by grants from the
National Natural Science Foundation of China (grant nos. 81472922
and 81673105).
Availability of data and materials
All data generated or analyzed during the present
study are included in this article, and the R codes are available
at https://github.com/Yuchang66/CRC-project.
Authors' contributions
All authors conceived and designed the experiments.
CY contributed to the bioinformatics analysis and drafted the
manuscript. CY, FC and JJ contributed to the data mining. HZ and MZ
contributed to the statistical analysis and modified the
manuscript. All authors read and approved the final version of the
manuscript and agree to be accountable for all aspects of the
research in ensuring that the accuracy or integrity of any part of
the work are appropriately investigated and resolved.
Ethics approval and consent to
participate
Not applicable.
Patient consent for publication
Not applicable.
Competing interests
The authors declare that they have no competing
interests.
References
|
1
|
Bray F, Ferlay J, Soerjomataram I, Siegel
RL, Torre LA and Jemal A: Global cancer statistics 2018: GLOBOCAN
estimates of incidence and mortality worldwide for 36 cancers in
185 countries. CA Cancer J Clin. 68:394–424. 2018. View Article : Google Scholar : PubMed/NCBI
|
|
2
|
O'Connell JB, Maggard MA and Ko CY: Colon
cancer survival rates with the new American joint committee on
cancer sixth edition staging. J Natl Cancer Inst. 96:1420–1425.
2004. View Article : Google Scholar : PubMed/NCBI
|
|
3
|
Aslinia F, Uradomo L, Steele A, Greenwald
BD and Raufman JP: Quality assessment of colonoscopic cecal
intubation: An analysis of 6 years of continuous practice at a
university hospital. Am J Gastroenterol. 101:721–731. 2006.
View Article : Google Scholar : PubMed/NCBI
|
|
4
|
Uraoka T, Ramberan H, Matsuda T, Fujii T
and Yahagi N: Cold polypectomy techniques for diminutive polyps in
the colorectum. Dig Endosc. 26 (Suppl 2):S98–S103. 2014. View Article : Google Scholar
|
|
5
|
Martín-López JE, Beltrán-Calvo C,
Rodríguez-López R and Molina-López T: Comparison of the accuracy of
CT colonography and colonoscopy in the diagnosis of colorectal
cancer. Colorectal Dis. 16:O82–O89. 2014. View Article : Google Scholar : PubMed/NCBI
|
|
6
|
Liang B, Li C and Zhao J: Identification
of key pathways and genes in colorectal cancer using bioinformatics
analysis. Med Oncol. 33:1112016. View Article : Google Scholar : PubMed/NCBI
|
|
7
|
Guo Y, Bao Y, Ma M and Yang W:
Identification of key candidate genes and pathways in colorectal
cancer by integrated bioinformatical analysis. Int J Mol Sci.
18(pii): E7222017. View Article : Google Scholar : PubMed/NCBI
|
|
8
|
Hong Y, Downey T, Eu KW, Koh PK and Cheah
PY: A ‘metastasis-prone’ signature for early-stage mismatch-repair
proficient sporadic colorectal cancer patients and its implications
for possible therapeutics. Clin Exp Metastasis. 27:83–90. 2010.
View Article : Google Scholar : PubMed/NCBI
|
|
9
|
Okazaki S, Ishikawa T, Iida S, Ishiguro M,
Kobayashi H, Higuchi T, Enomoto M, Mogushi K, Mizushima H, Tanaka
H, et al: Clinical significance of UNC5B expression in colorectal
cancer. Int J Oncol. 40:209–216. 2012.PubMed/NCBI
|
|
10
|
Barrett T, Wilhite SE, Ledoux P,
Evangelista C, Kim IF, Tomashevsky M, Marshall KA, Phillippy KH,
Sherman PM, Holko M, et al: NCBI GEO: Archive for functional
genomics data sets-update. Nucleic Acids Res 41 (Database Issue).
D991–D995. 2013.
|
|
11
|
Irizarry RA, Hobbs B, Collin F,
Beazer-Barclay YD, Antonellis KJ, Scherf U and Speed TP:
Exploration, normalization, and summaries of high density
oligonucleotide array probe level data. Biostatistics. 4:249–264.
2003. View Article : Google Scholar : PubMed/NCBI
|
|
12
|
Ritchie ME, Phipson B, Wu D, Hu Y, Law CW,
Shi W and Smyth GK: Limma powers differential expression analyses
for RNA-sequencing and microarray studies. Nucleic Acids Res.
43:e472015. View Article : Google Scholar : PubMed/NCBI
|
|
13
|
Robinson MD, McCarthy DJ and Smyth GK:
EdgeR: A bioconductor package for differential expression analysis
of digital gene expression data. Bioinformatics. 26:139–140. 2010.
View Article : Google Scholar : PubMed/NCBI
|
|
14
|
Oliveros JC: VENNY. An interactive tool
for comparing lists with Venn Diagrams. 2007.
|
|
15
|
Ashburner M, Ball CA, Blake JA, Botstein
D, Butler H, Cherry JM, Davis AP, Dolinski K, Dwight SS, Eppig JT,
et al: Gene ontology: Tool for the unification of biology. The gene
ontology consortium. Nat Genet. 25:25–29. 2000. View Article : Google Scholar : PubMed/NCBI
|
|
16
|
The Gene Ontology Consortium: The gene
ontology resource: 20 years and still GOing strong. Nucleic Acids
Res. 47(D1): D330–D338. 2019. View Article : Google Scholar : PubMed/NCBI
|
|
17
|
Kanehisa M, Sato Y, Furumichi M, Morishima
K and Tanabe M: New approach for understanding genome variations in
KEGG. Nucleic Acids Res. 47(D1): D590–D595. 2019. View Article : Google Scholar : PubMed/NCBI
|
|
18
|
Kanehisa M and Goto S: KEGG: Kyoto
encyclopedia of genes and genomes. Nucleic Acids Res. 28:27–30.
2000. View Article : Google Scholar : PubMed/NCBI
|
|
19
|
Kanehisa M, Furumichi M, Tanabe M, Sato Y
and Morishima K: KEGG: New perspectives on genomes, pathways,
diseases and drugs. Nucleic Acids Res. 45(D1): D353–D361. 2017.
View Article : Google Scholar : PubMed/NCBI
|
|
20
|
Yu G, Wang LG, Han Y and He QY:
clusterProfiler: An R package for comparing biological themes among
gene clusters. OMICS. 16:284–287. 2012. View Article : Google Scholar : PubMed/NCBI
|
|
21
|
Yu G, Wang LG, Yan GR and He QY: DOSE: An
R/Bioconductor package for disease ontology semantic and enrichment
analysis. Bioinformatics. 31:608–609. 2015. View Article : Google Scholar : PubMed/NCBI
|
|
22
|
Shannon P, Markiel A, Ozier O, Baliga NS,
Wang JT, Ramage D, Amin N, Schwikowski B and Ideker T: Cytoscape: A
software environment for integrated models of biomolecular
interaction networks. Genome Res. 13:2498–2504. 2003. View Article : Google Scholar : PubMed/NCBI
|
|
23
|
Bader GD and Hogue CW: An automated method
for finding molecular complexes in large protein interaction
networks. BMC Bioinformatics. 4:22003. View Article : Google Scholar : PubMed/NCBI
|
|
24
|
Bindea G, Mlecnik B, Hackl H, Charoentong
P, Tosolini M, Kirilovsky A, Fridman WH, Pagès F, Trajanoski Z and
Galon J: ClueGO: A cytoscape plug-in to decipher functionally
grouped gene ontology and pathway annotation networks.
Bioinformatics. 25:1091–1093. 2009. View Article : Google Scholar : PubMed/NCBI
|
|
25
|
Chin CH, Chen SH, Wu HH, Ho CW, Ko MT and
Lin CY: CytoHubba: Identifying hub objects and sub-networks from
complex interactome. BMC Syst Biol. 8 (Suppl 4):S112014. View Article : Google Scholar : PubMed/NCBI
|
|
26
|
Takada I and Makishima M: Control of
inflammatory bowel disease and colorectal cancer by synthetic
vitamin D receptor ligands. Curr Med Chem. 24:868–875. 2017.
View Article : Google Scholar : PubMed/NCBI
|
|
27
|
Vermeulen K, Van Bockstaele DR and
Berneman ZN: The cell cycle: A review of regulation, deregulation
and therapeutic targets in cancer. Cell Prolif. 36:131–149. 2010.
View Article : Google Scholar
|
|
28
|
Aarts M, Linardopoulos S and Turner NC:
Tumour selective targeting of cell cycle kinases for cancer
treatment. Curr Opin Pharmacol. 13:529–535. 2013. View Article : Google Scholar : PubMed/NCBI
|
|
29
|
Rieder G, Hofmann JA, Hatz RA, Stolte M
and Enders GA: Up-regulation of inducible nitric oxide synthase in
helicobacter pylori-associated gastritis may represent an increased
risk factor to develop gastric carcinoma of the intestinal type.
Int J Med Microbiol. 293:403–412. 2003. View Article : Google Scholar : PubMed/NCBI
|
|
30
|
Hashibe M, Galeone C, Buys SS, Gren L,
Boffetta P, Zhang ZF and La Vecchia C: Coffee, tea, caffeine
intake, and the risk of cancer in the PLCO cohort. Br J Cancer.
113:809–816. 2015. View Article : Google Scholar : PubMed/NCBI
|
|
31
|
Guertin KA, Loftfield E, Boca SM, Sampson
JN, Moore SC, Xiao Q, Huang WY, Xiong X, Freedman ND, Cross AJ and
Sinha R: Serum biomarkers of habitual coffee consumption may
provide insight into the mechanism underlying the association
between coffee consumption and colorectal cancer. Am J Clin Nutr.
101:1000–1011. 2015. View Article : Google Scholar : PubMed/NCBI
|
|
32
|
Merighi S, Benini A, Mirandola P, Gessi S,
Varani K, Simioni C, Leung E, Maclennan S, Baraldi PG and Borea PA:
Caffeine inhibits adenosine-induced accumulation of
hypoxia-inducible factor-1alpha, vascular endothelial growth
factor, and interleukin-8 expression in hypoxic human colon cancer
cells. Mol Pharmacol. 72:395–406. 2007. View Article : Google Scholar : PubMed/NCBI
|
|
33
|
Long Y, Sanchez-Espiridion B, Lin M, White
L, Mishra L, Raju GS, Kopetz S, Eng C, Hildebrandt MAT, Chang DW,
et al: Global and targeted serum metabolic profiling of colorectal
cancer progression. Cancer. 123:4066–4074. 2017. View Article : Google Scholar : PubMed/NCBI
|
|
34
|
Chen L, Lu D, Sun K, Xu Y, Hu P, Li X and
Xu F: Identification of biomarkers associated with diagnosis and
prognosis of colorectal cancer patients based on integrated
bioinformatics analysis. Gene. 692:119–125. 2019. View Article : Google Scholar : PubMed/NCBI
|
|
35
|
Coss A, Tosetto M, Fox EJ, Sapetto-Rebow
B, Gorman S, Kennedy BN, Lloyd AT, Hyland JM, O'Donoghue DP,
Sheahan K, et al: Increased topoisomerase IIalpha expression in
colorectal cancer is associated with advanced disease and
chemotherapeutic resistance via inhibition of apoptosis. Cancer
Lett. 276:228–238. 2009. View Article : Google Scholar : PubMed/NCBI
|
|
36
|
Bofin AM, Ytterhus B and Hagmar BM: TOP2A
and HER-2 gene amplification in fine needle aspirates from breast
carcinomas. Cytopathology. 14:314–319. 2003. View Article : Google Scholar : PubMed/NCBI
|
|
37
|
Kanta SY, Yamane T, Dobashi Y, Mitsui F,
Kono K and Ooi A: Topoisomerase IIalpha gene amplification in
gastric carcinomas: Correlation with the HER2 gene. An
immunohistochemical, immunoblotting, and multicolor fluorescence in
situ hybridization study. Hum Pathol. 37:1333–1343. 2006.
View Article : Google Scholar : PubMed/NCBI
|
|
38
|
Kruger S, Lange I, Kausch I and Feller AC:
Protein expression and gene copy number analysis of topoisomerase
2alpha, HER2 and P53 in minimally invasive urothelial carcinoma of
the urinary bladder-a multitissue array study with prognostic
implications. Anticancer Res. 25:263–271. 2005.PubMed/NCBI
|
|
39
|
Depowski PL, Rosenthal SI, Brien TP,
Stylos S, Johnson RL and Ross JS: Topoisomerase IIalpha expression
in breast cancer: Correlation with outcome variables. Mod Pathol.
13:542–547. 2000. View Article : Google Scholar : PubMed/NCBI
|
|
40
|
Dingemans AM, Witlox MA, Stallaert RA, van
der Valk P, Postmus PE and Giaccone G: Expression of DNA
topoisomerase IIalpha and topoisomerase IIbeta genes predicts
survival and response to chemotherapy in patients with small cell
lung cancer. Clin Cancer Res. 5:2048–2058. 1999.PubMed/NCBI
|
|
41
|
Mu XC, Tran TA, Ross JS and Carlson JA:
Topoisomerase II-alpha expression in melanocytic nevi and malignant
melanoma. J Cutan Pathol. 27:242–248. 2000. View Article : Google Scholar : PubMed/NCBI
|
|
42
|
Zhou Q, Abraham AD, Li L, Babalmorad A,
Bagby S, Arcaroli JJ, Hansen RJ, Valeriote FA, Gustafson DL,
Schaack J, et al: Topoisomerase IIα mediates TCF-dependent
epithelial-mesenchymal transition in colon cancer. Oncogene.
35:4990–4999. 2016. View Article : Google Scholar : PubMed/NCBI
|
|
43
|
Fernandez-Cid A, Riera A, Tognetti S,
Herrera MC, Samel S, Evrin C, Winkler C, Gardenal E, Uhle S, Speck
C, et al: An ORC/Cdc6/MCM2-7 complex is formed in a multistep
reaction to serve as a platform for MCM double-hexamer assembly.
Mol Cell. 50:577–588. 2013. View Article : Google Scholar : PubMed/NCBI
|
|
44
|
Randell JC, Bowers JL, Rodriguez HK and
Bell SP: Sequential ATP hydrolysis by Cdc6 and ORC directs loading
of the Mcm2-7 helicase. Mol Cell. 21:29–39. 2006. View Article : Google Scholar : PubMed/NCBI
|
|
45
|
Kim GS, Kang J, Bang SW and Hwang DS: Cdc6
localizes to S- and G2-phase centrosomes in a cell cycle-dependent
manner. Biochem Biophys Res Commun. 456:763–767. 2015. View Article : Google Scholar : PubMed/NCBI
|
|
46
|
Barkley LR, Hong HK, Kingsbury SR, James
M, Stoeber K and Williams GH: Cdc6 is a rate-limiting factor for
proliferative capacity during HL60 cell differentiation. Exp Cell
Res. 313:3789–3799. 2007. View Article : Google Scholar : PubMed/NCBI
|
|
47
|
Huang M, Miao ZH, Zhu H, Cai YJ, Lu W and
Ding J: Chk1 and Chk2 are differentially involved in homologous
recombination repair and cell cycle arrest in response to DNA
double-strand breaks induced by camptothecins. Mol Cancer Ther.
7:1440–1449. 2008. View Article : Google Scholar : PubMed/NCBI
|
|
48
|
van't Veer LJ, Dai H, van de Vijver MJ, He
YD, Hart AA, Mao M, Peterse HL, van der Kooy K, Marton MJ,
Witteveen AT, et al: Gene expression profiling predicts clinical
outcome of breast cancer. Nature. 415:530–536. 2002. View Article : Google Scholar : PubMed/NCBI
|
|
49
|
Hernando E, Nahle Z, Juan G,
Diaz-Rodriguez E, Alaminos M, Hemann M, Michel L, Mittal V, Gerald
W, Benezra R, et al: Rb inactivation promotes genomic instability
by uncoupling cell cycle progression from mitotic control. Nature.
430:797–802. 2004. View Article : Google Scholar : PubMed/NCBI
|
|
50
|
Chen X, Yan CC, Zhang X and You ZH: Long
non-coding RNAs and complex diseases: From experimental results to
computational models. Brief Bioinform. 18:558–576. 2017.PubMed/NCBI
|
|
51
|
Chen X, Xie D, Zhao Q and You ZH:
MicroRNAs and complex diseases: From experimental results to
computational models. Brief Bioinform. 20:515–539. 2019. View Article : Google Scholar : PubMed/NCBI
|
|
52
|
Chen X, Wang L, Qu J, Guan NN and Li JQ:
Predicting miRNA-disease association based on inductive matrix
completion. Bioinformatics. 34:4256–4265. 2018.PubMed/NCBI
|
|
53
|
Chen X, Xie D, Wang L, Zhao Q, You ZH and
Liu H: BNPMDA: Bipartite network projection for MiRNA-disease
association prediction. Bioinformatics. 34:3178–3186. 2018.
View Article : Google Scholar : PubMed/NCBI
|
|
54
|
Chen X, Yin J, Qu J and Huang L: MDHGI:
Matrix decomposition and heterogeneous graph inference for
miRNA-disease association prediction. PLoS Computat Biol.
14:e10064182018. View Article : Google Scholar
|
|
55
|
Chen X and Huang L: LRSSLMDA: Laplacian
regularized sparse subspace learning for MiRNA-disease association
prediction. PLoS Comput Biol. 13:e10059122017. View Article : Google Scholar : PubMed/NCBI
|