Introduction
Down syndrome is one of the most frequently
occurring chromosomal abnormalities in humans, with a worldwide
incidence of ~1:1,000 births annually (1). This disease is caused by the presence
of part or a full extra copy of chromosome 21 and therefore is also
called trisomy 21 (2). Down
syndrome is typically associated with craniofacial abnormalities,
intellectual disabilities, physical growth delays and a variety of
distinctive physical features, including slanted eyes and a large
tongue (3). Furthermore, sufferers
of Down syndrome have an increased susceptibility to certain
diseases, including leukemia, Alzheimer's disease, congenital heart
disease and thyroid disorders (4).
Nowadays, bioinformatics analysis has been widely performed to
investigate disease-associated genes and genes on human chromosome
21, as well as other chromosomes that have been linked to Down
syndrome (5,6). However, the roles of microRNAs (miRs)
and miR-mRNA connections in Down syndrome are largely unknown.
miRs represent a class of single-stranded noncoding
RNAs, which serve an important regulatory role in a variety of
biological processes including differentiation, proliferation and
apoptosis, through post-transcriptionally regulating gene
expression via binding with complementary targets (7,8). By
performing bioinformatic analyses, several known and novel miRs
that are differentially expressed in Down syndrome have been
identified. For example, miR-1246 has been identified as a link
between the p53 family and Down syndrome (9), and miR-138-5p and its target zeste
homolog 2 have been demonstrated to function in the hippocampus of
Down syndrome patients (10).
The extra genetic material on chromosome 21 in Down
syndrome subjects, in particular the material involving a critical
region on chromosome 21, leads to a global genomic dysregulation of
all chromosomes, including abnormalities of thymic structure and
function (11). The immune system
in Down syndrome is intrinsically deficient. Down syndrome patients
present abnormal thymuses characterized by lymphocyte depletion,
cortical atrophy and loss of corticomedullary delimitation
(12,13). To investigate epigenetic mechanisms
associated with the thymic gene co-expression network and Down
syndrome genomic dysregulation, Moreira-Filho et al
(14) performed miR target
analyses for differentially expressed miRs using a network-based
approach. RNA sequence (RNA-seq) data, including miR (GSE69210) and
mRNA (GSE70573) data collected from the thymic tissues of both Down
syndrome and karyotypically normal subjects, were deposited in a
public repository. In the present study, miR and mRNA databases
were downloaded to establish a comprehensive association between
miR expression and target mRNA expression in thymus tissues in Down
syndrome, as an initial step towards further understanding the
regulation of gene expression in this disease.
Materials and methods
Data collection and processing
The mRNA expression profile of GSE69210 (14), containing 10 thymus samples
collected from Down syndrome subjects and 10 thymus samples from
karyotypically normal subjects, was downloaded from the public
functional genomics data repository Gene Expression Omnibus (GEO)
of the National Center of Biotechnology Information (www.ncbi.nlm.nih.gov/geo/), platform GPL13497.
The miR expression profile of GSE70573 (14) was downloaded from the GEO database,
platform GPL13263 and contained eight human thymus samples from
Down syndrome subjects, and eight thymus samples from
karyotypically normal subjects.
According to the names of the thymus samples and the
clinical information of subjects, paired miR and mRNA expression
profiles were obtained from eight Down syndrome subjects and eight
karyotypically normal subjects. The raw probe-level data of both
miR and mRNA were converted into expression measures. The
expression values of all probes for a given gene were reduced to a
single value by taking their average expression value. Then,
RNA-seq data were log2-transformed and median normalized using the
limma package in R (version 3.3.3) (15,16).
Weighted gene co-expression network
analysis (WGCNA)
Following data normalization, the miR and mRNA
modules associated with Down syndrome using WGCNA in R were
screened (15). First, a measure
of similarity between miR or mRNA expression profiles that measures
the level of concordance between expression profiles was defined.
The absolute value of the Pearson correlation for each pair of
genes was used to denote this similarity measure. Then, the
similarity matrix was transformed into an adjacency matrix
following definition of an adjacency function based on scale-free
topology criterion. The Pearson correlation was transformed into a
matrix of the power adjacency functions (so-called soft threshold)
using the following formula: Power=|correlation|β. Next,
the parameters indicating the adjacency function, including the
sign function and the power function, were determined. Finally,
modules associated with Down syndrome were identified according to
the topological overlap matrix-based dissimilarity measure in
conjunction with a clustering method.
Identification of differentially
expressed genes (DEGs) and miRs (DEmiRs)
Differential miR or mRNA expression between Down
syndrome samples and karyotypically normal samples was determined
from the normalized data using the limma package for R, with
P<0.05 and |log2 Fold Chance (FC)|>0.585 set as
thresholds. The identified DEmiRs and DEGs were mapped to the miR
and mRNA modules screened by WGCNA, and overlapped miRs and mRNAs
were defined as DEGs or DEmiRs.
Bidirectional hierarchical clustering
analysis
Bidirectional hierarchical clustering (16) of DEGs or DEmiRs was performed based
on normalized expression values by employing the Euclidean distance
method (17) and the heatmap
package in R (18). The results
were then visualized on a heatmap. Bidirectional clustering
includes expression profile clustering as well as sample
clustering. Expression profile clustering can be used to link genes
with similar expression profiles together, which can aid
examination of the data; sample clustering based on expression
levels can help visually identify whether screened DEGs and DEmiRs
have sample specificity.
Co-expression network construction of
DEmiR-targeted gene pairs
DEmiR target sites were retrieved using a public
miRanda algorithm (19) found at
www.microRNA.org. Following target site
retrieval, target mRNAs were mapped to the mRNA modules screened by
WGCNA to identify DEmiR-targeted gene pairs.
Then, the Pearson correlation coefficients of
DEmiR-targeted gene pairs were calculated based on the expression
levels using the Cor function in R. Gene pairs with correlation
coefficient >0.6 were kept. Following this, the co-expression
network of DEmiRs and screened DEmiR-targeted gene pairs was
constructed and visualized using Cytoscape (version 3.4.0)
(20). The modules in the
co-expression network were identified and annotated using MCODE
(degree cutoff=2, node score cutoff=0.2 and k-core=2) and BiNGO
plugins (adjusted P-value<0.05) (21,22).
Gene Oncology (GO) annotation and
Kyoto Encyclopedia of Genes and Genomes (KEGG) pathway
enrichment
The functional characteristics of the genes in the
co-expression network were identified by GO analysis (gostat.wehi.edu.au/) (23). During GO analysis, genes were
connected to biological GO annotations. The most enriched GO terms
were statistically identified from thousands of GO annotation terms
by enrichment analysis based on the hypergeometric distribution
algorithm as follows, with P<0.05.
p=1-∑i=0H-1(Mi)(N-MK-H)(NK)
N represents the number of genes with GO-based
functional annotation; K represents the number of DEGs out of genes
with GO-based functional annotation; M represents the number of
genes that were annotated to the specific GO term; i represents the
specific GO term.
Additionally, KEGG orthology-based annotation system
(kobas.cbi.pku.edu.cn/home.do)
(24) analysis was applied to
predict the enriched pathway in the KEGG database of genes in the
co-expression network, based on the cumulative hypergeometric
distribution algorithm with P<0.05.
Results
Identification of Down
syndrome-associated miRs and mRNAs based on WGCNA
Following data normalization, the paired miR and
mRNA expression profiles collected from eight Down syndrome
subjects and eight karyotypically normal subjects were analyzed
using WGCNA.
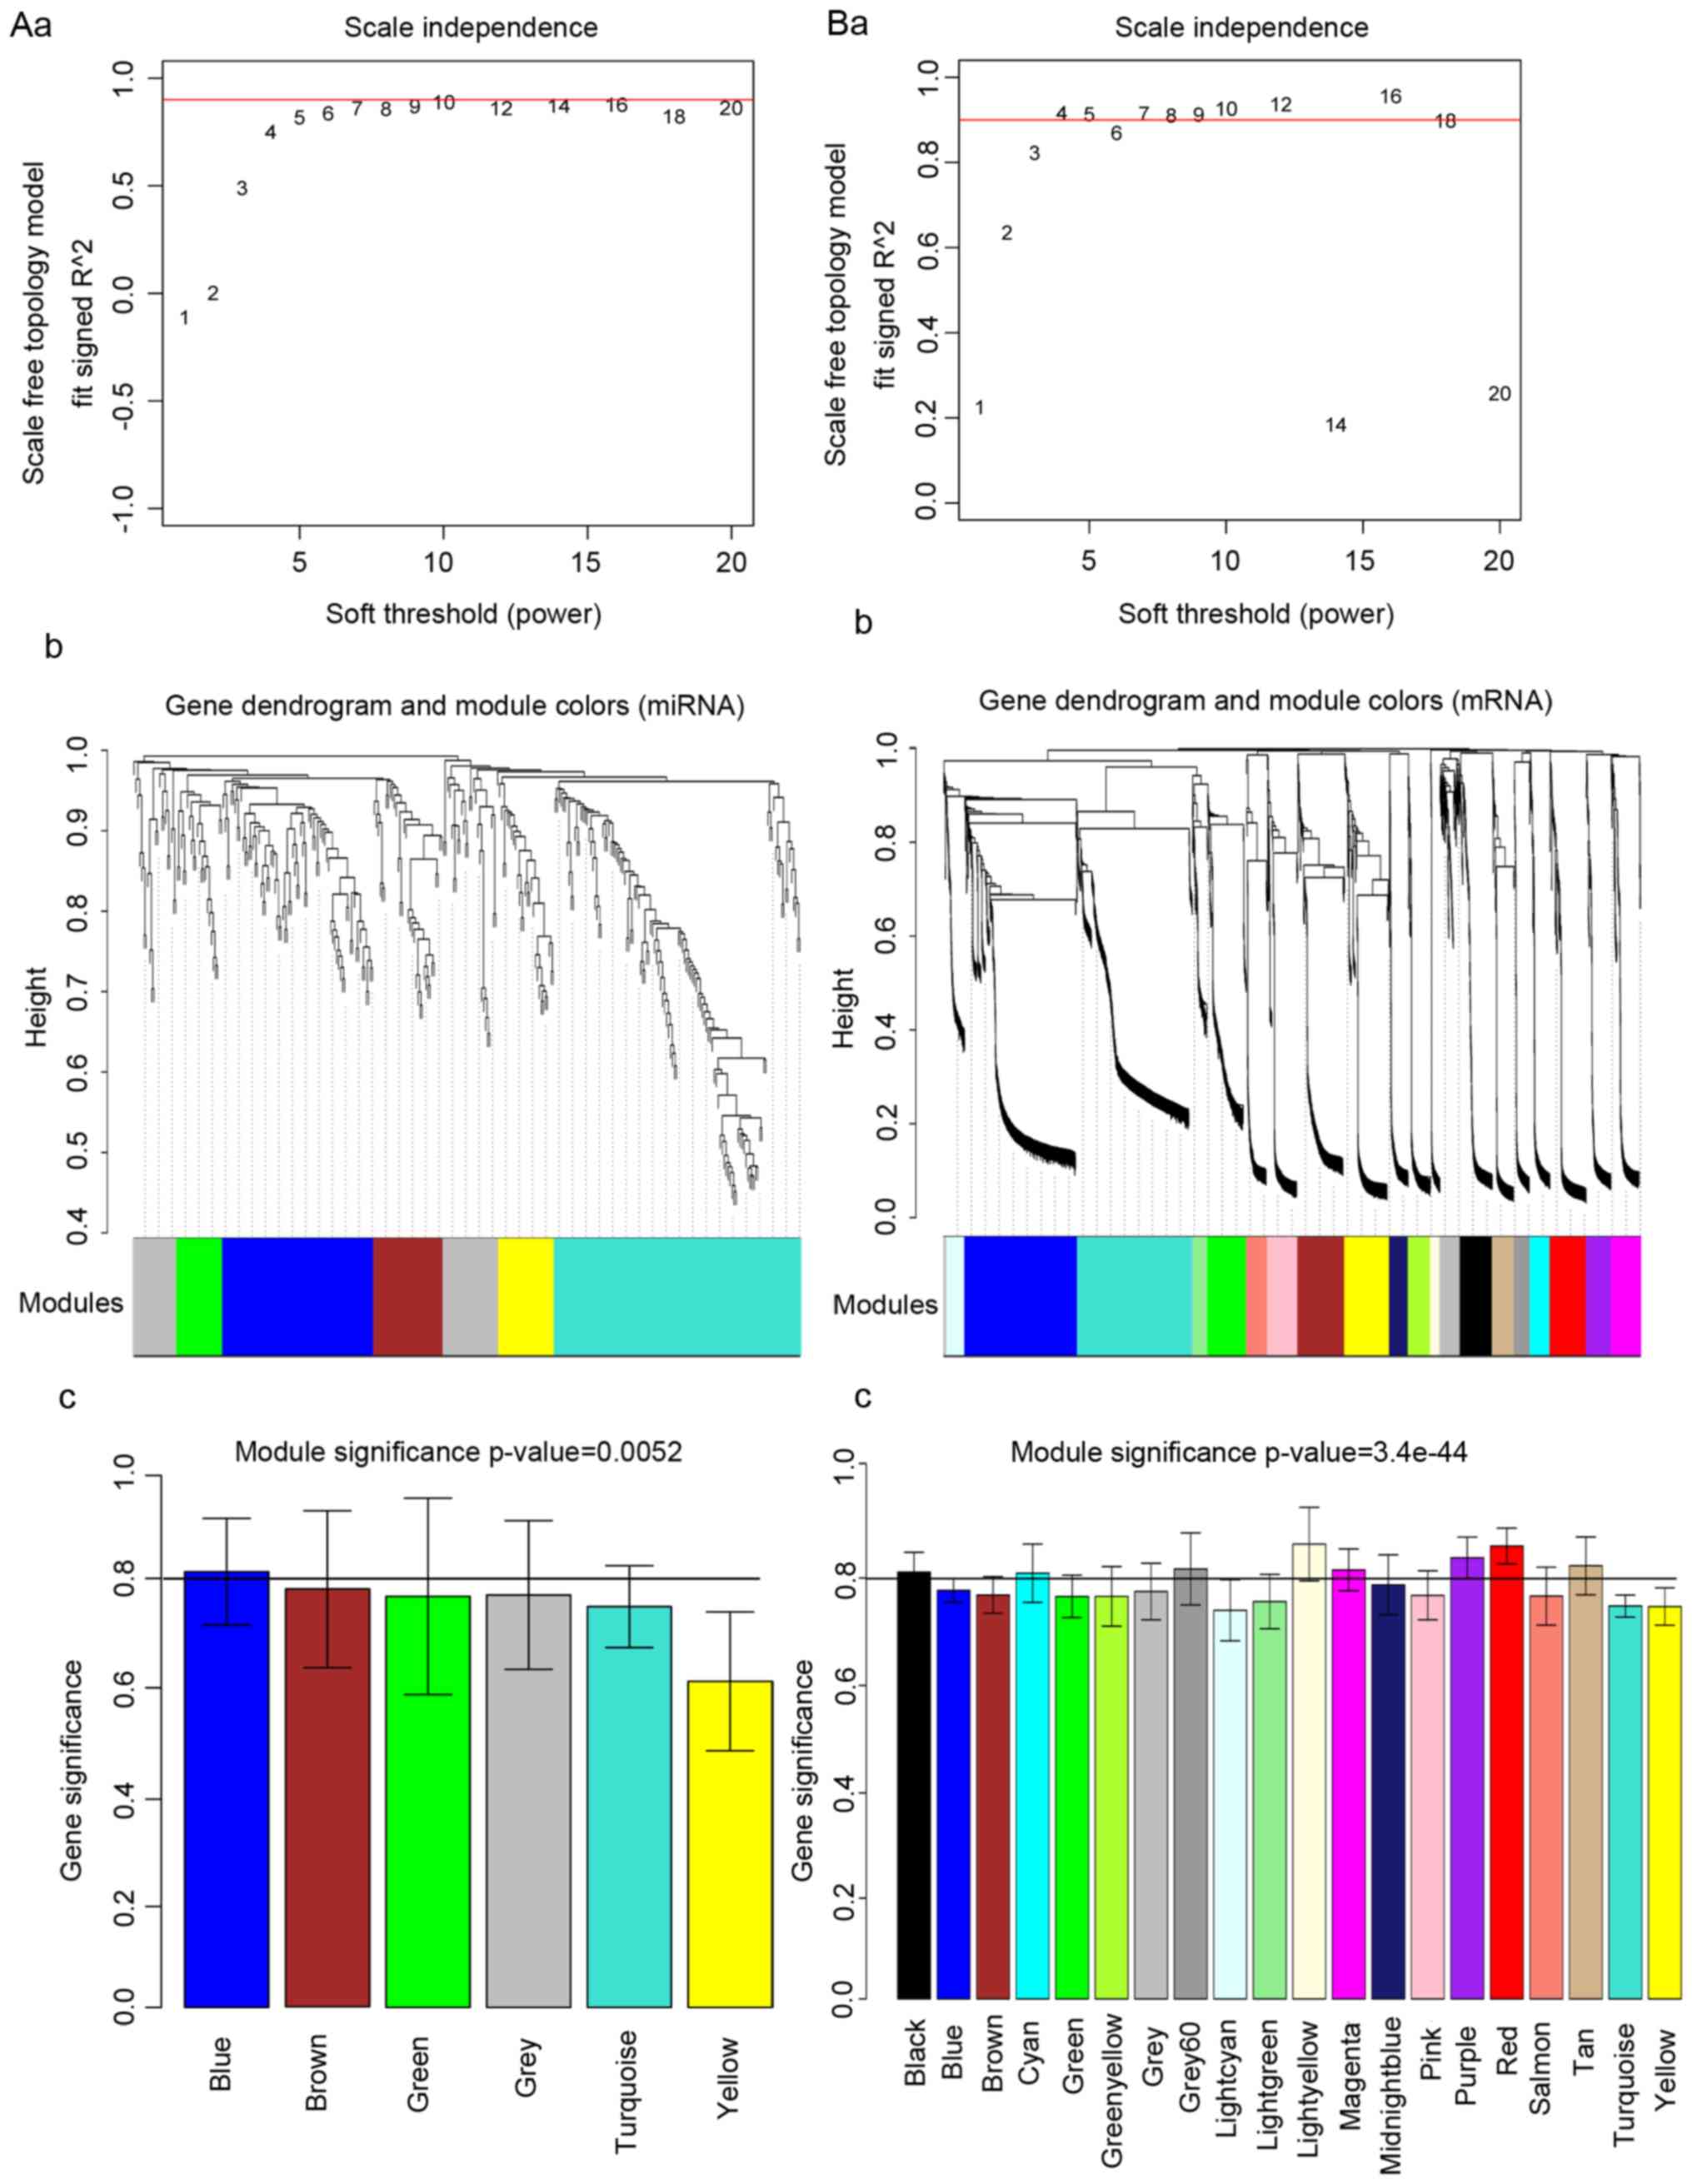
Definition of network adjacency
function
By applying approximate scale-free topology, the
value of power (also termed the soft threshold), a weighted
parameter of the network adjacency matrix, was investigated. The
definition of threshold parameters for network construction and
calculation of scale-free degree distributions is demonstrated
(Fig. 1). Higher values of the
square of correlation coefficient indicated a closer approximation
to scale-free distribution of the network. The value of power was
chosen to be the value of the square that first reached 0.9, which
was 10 and 4 for miR and mRNA data, respectively, as illustrated in
Fig. 1A and B.
Network construction and module
definition
After the network was established, the topological
overlap matrix was converted to a dissimilarity measure and
submitted to hierarchical clustering, creating a dendrogram that
clusters similarly expressed genes into discrete branches. Then,
modules containing at least 30 miRs and 100 mRNAs were assigned
using mixed dynamic tree-cutting algorithm criteria. Next, height
cutoffs of 0.95 were selected for miR and 0.90 for mRNA to cut
branches off the tree. A total of 6 miR modules and 20 mRNA modules
were obtained. The resulting branches corresponding to the miR and
mRNA modules are presented in Fig. 1Ab
and Bb, and replaced by the bottom row color-code.
Identification of Down
syndrome-associated miR and mRNA modules
The correlation coefficient between the eigenvalue
of each color module and the gene difference between Down syndrome
samples and normal samples, as well as the significance of
correlation, were calculated. As demonstrated in Fig. 1Ac and Bc, the modules with
correlation coefficients >0.8 were selected. For miR modules,
only one module (blue) containing 76 miRs was obtained; for mRNA
modules, a total of eight modules (black, cyan, grey, light yellow,
magenta, purple, red and salmon) containing 888 mRNAs were
selected.
Identification of DEmiRs and DEGs
For paired miR and mRNA expression profiles, a total
of 428 DEGs and 54 DEmiRs were obtained, at P<0.05 and
|log2 FC|>0.585. Following mapping of these miRs and
mRNAs to the miR and mRNA modules screened using WGNCA, 12
downregulated DEmiRs and 237 DEGs (26 downregulated and 211
upregulated) were obtained, all of which were significantly
associated with Down syndrome (P<0.05; data not shown).
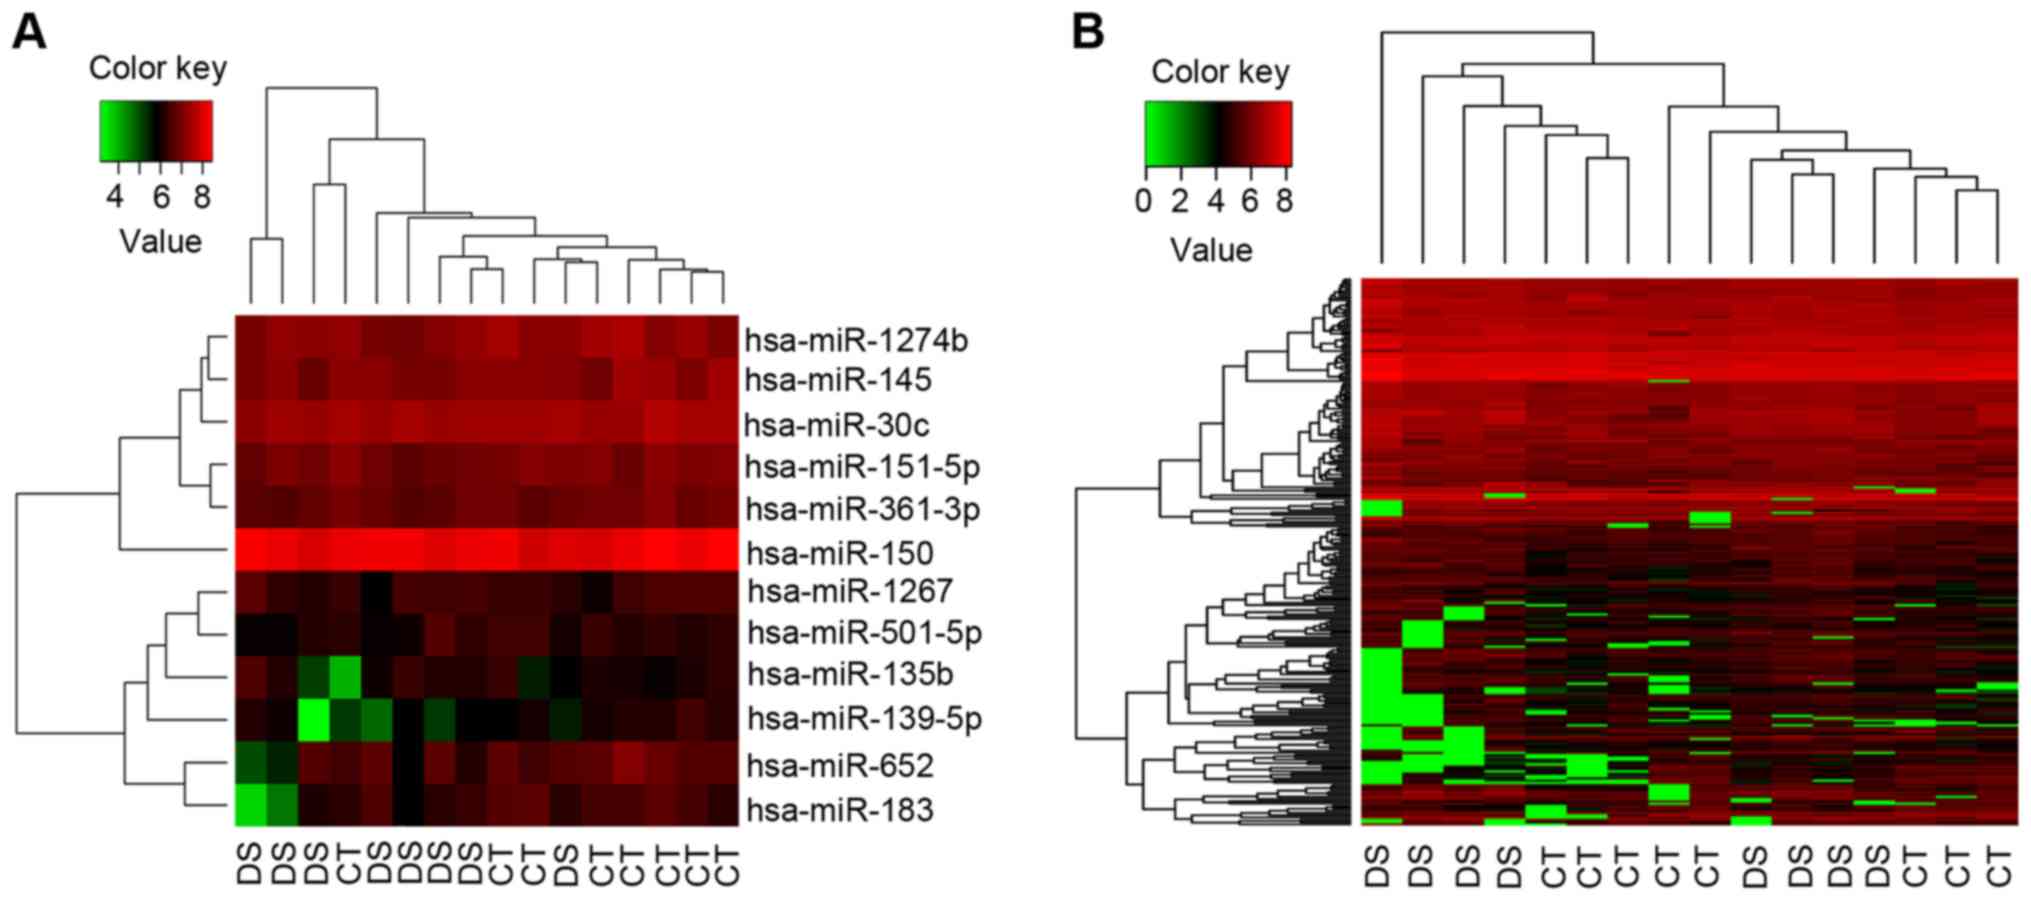
Bidirectional hierarchical clustering
analysis of DEGs and DEmiRs
According to gene expression patterns, 237 DEGs and
12 DEmiRs (downregulated) were clustered through bidirectional
hierarchical clustering analysis. Then, the Down syndrome samples
could be distinguished clearly from the control samples (Fig. 2A for miR and Fig. 2B for mRNA).
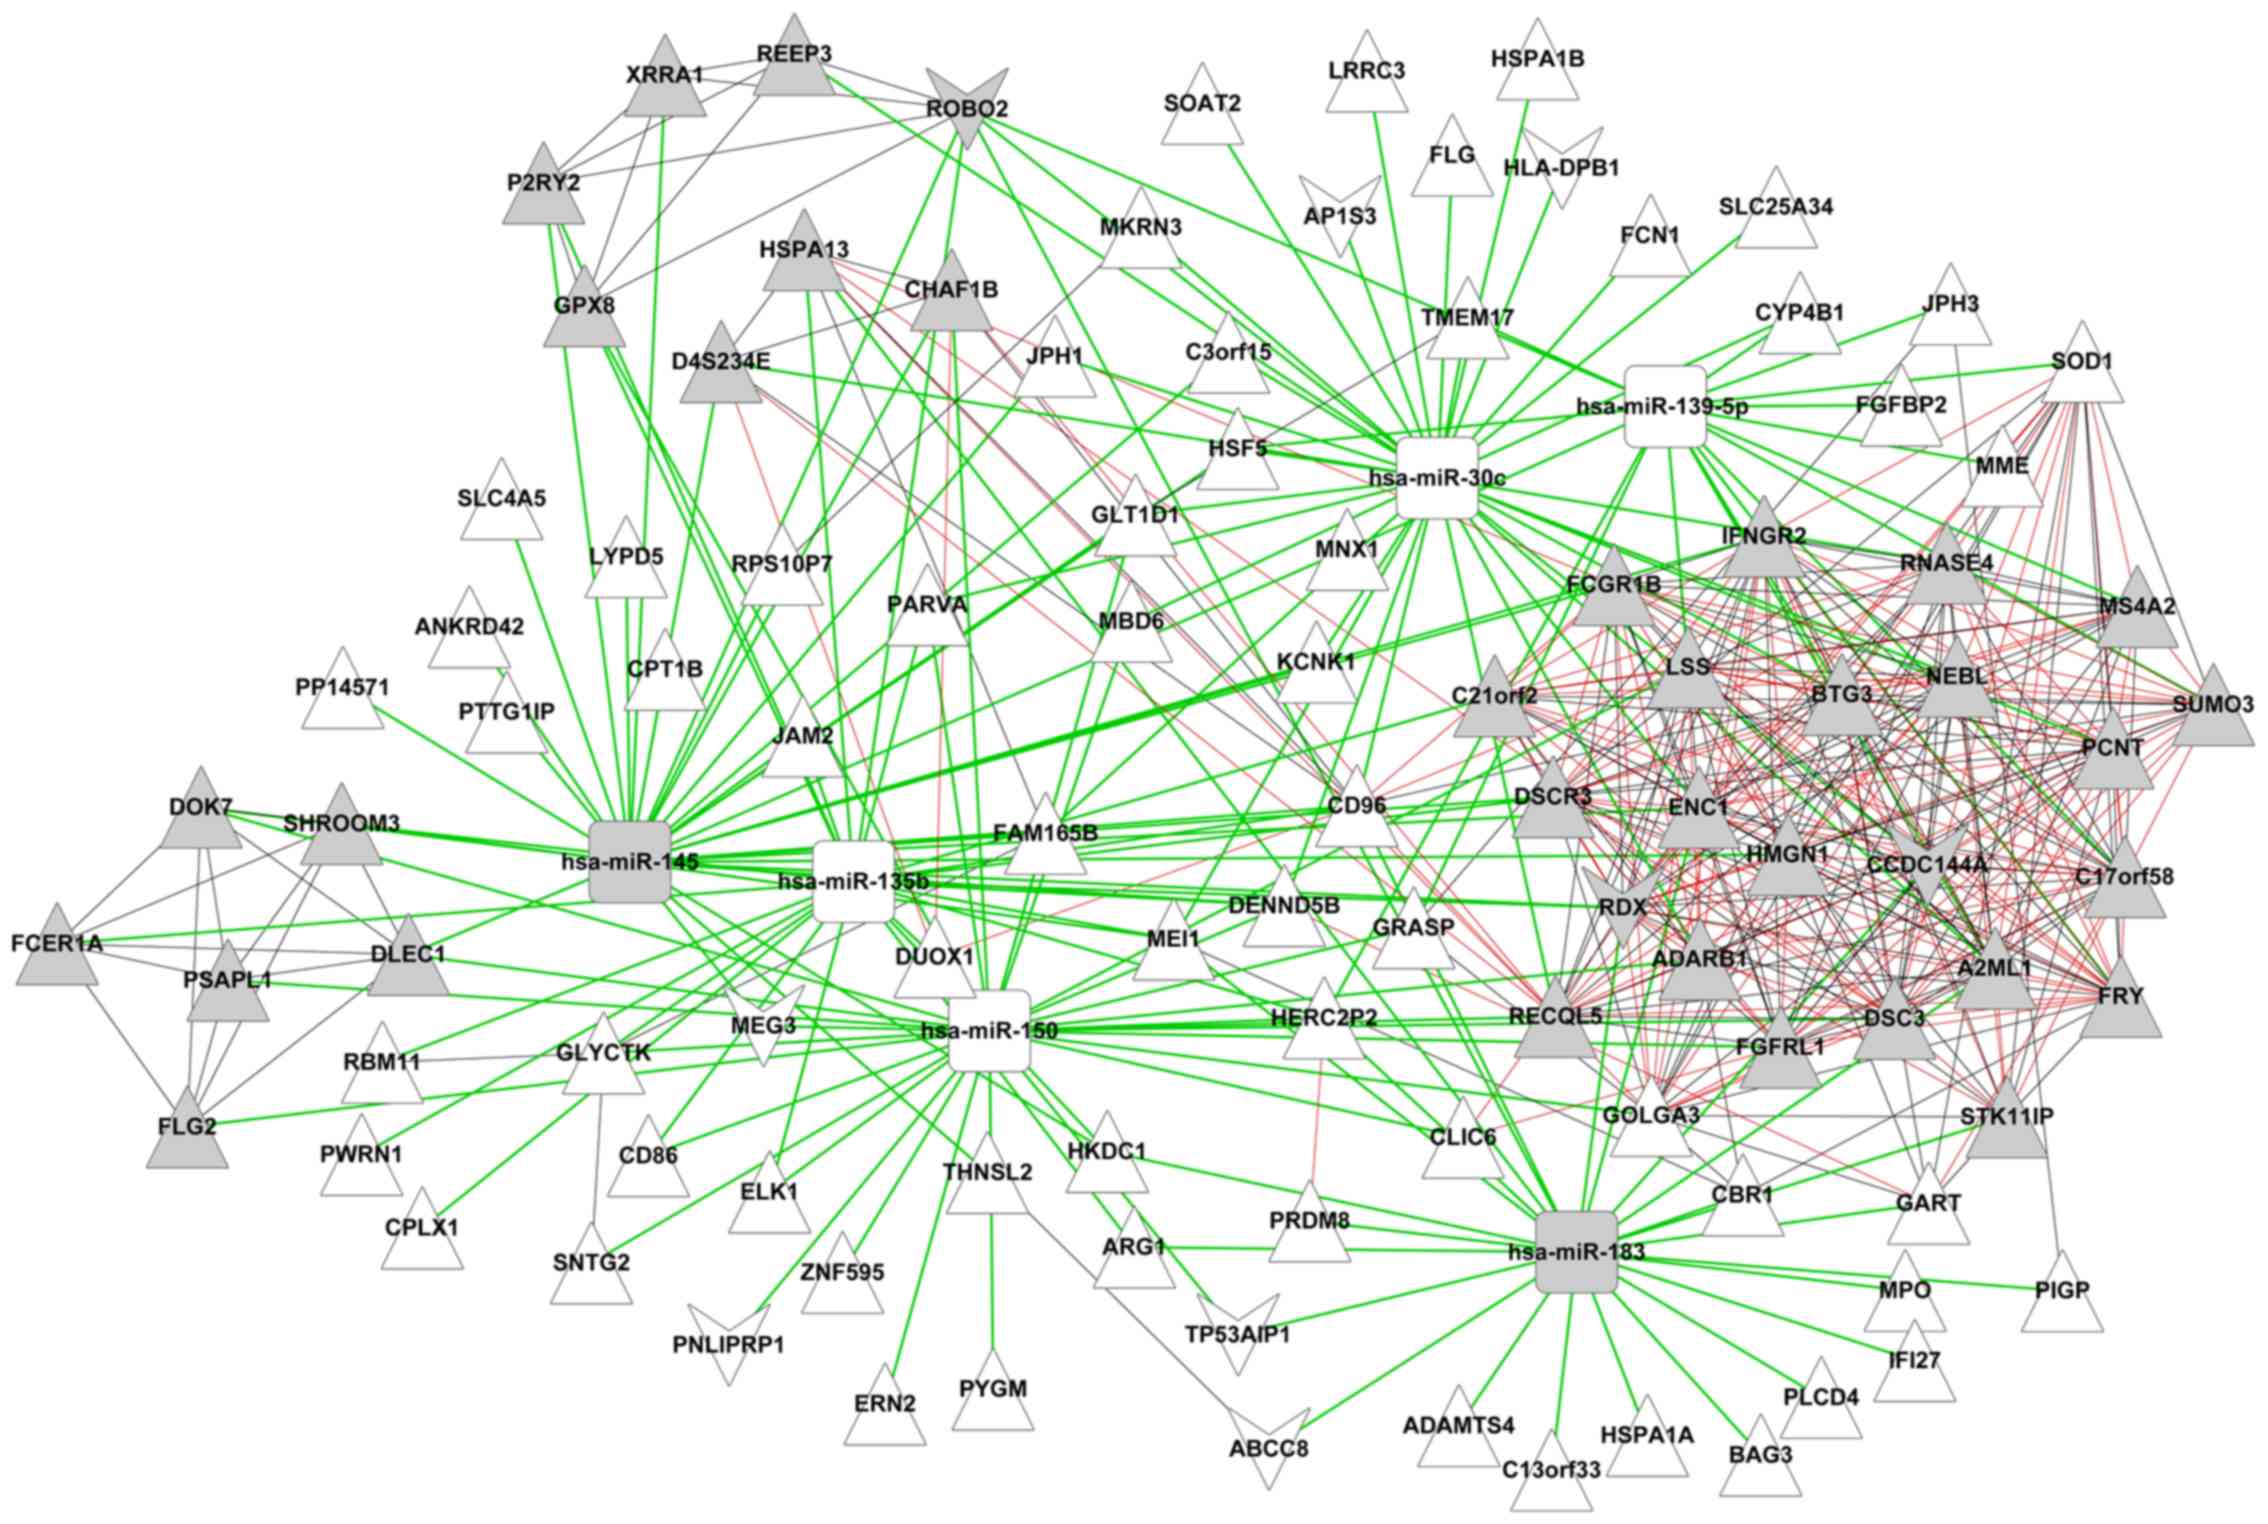
DEmiR-targeted gene co-expression
network
The target sites of 12 DEmiRs were retrieved from
the miRanda database and blasted with 237 DEGs. Then, 255
DEmiRs-DEGs pairs, including 6 DEmiRs and 106 DEGs were obtained.
Next, the expression correlation between two genes out of the 106
DEGs was evaluated at the expression correlation coefficient
>0.9; a total of 231 gene pairs were obtained. Finally, a
DEmiR-regulated gene co-expression network was constructed. As
demonstrated in Fig. 3, there were
112 nodes containing 6 downregulated miRs, 9 downregulated mRNAs
and 97 upregulated mRNAs, and 486 edges (255 miR-gene connections
and 231 gene-gene connections).
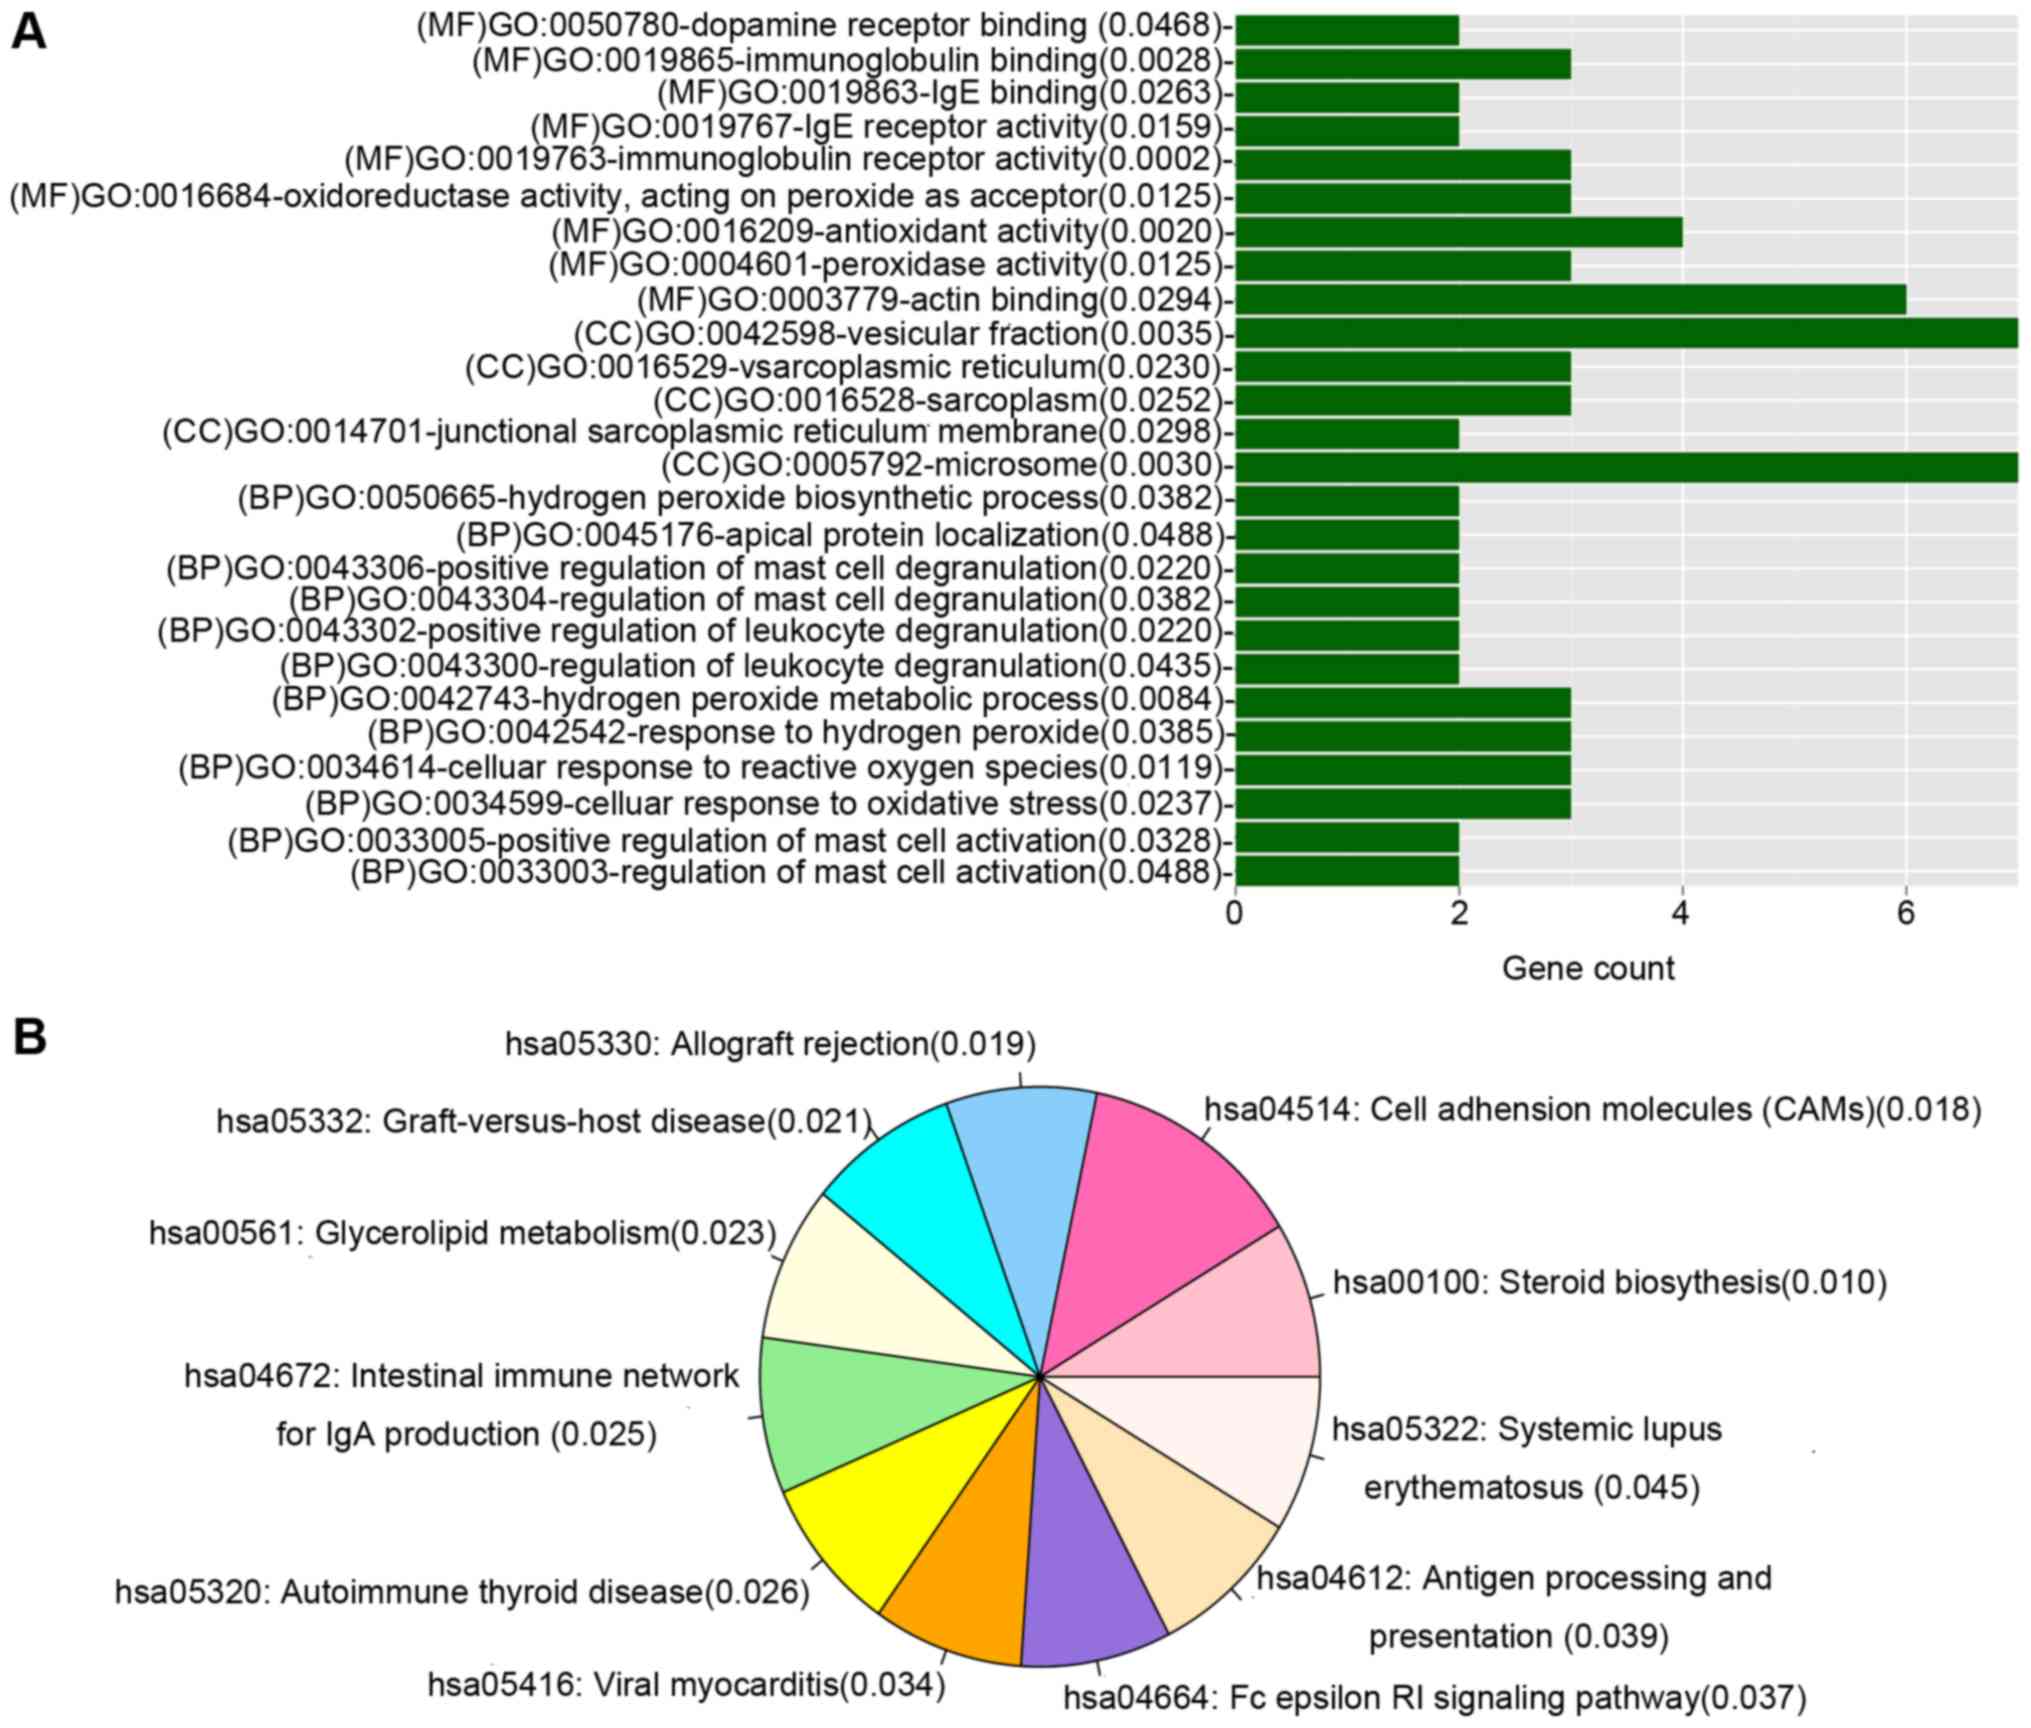
Functional enrichment analysis
GO and KEGG pathway enrichment analyses were
performed for genes in the DEmiR-regulated gene co-expression
network. Genes were enriched in multiple GO categories including
microsome, vesicular fraction and actin binding, and 11 KEGG
pathways, as demonstrated in Fig.
4.
Functional division of DEmiR-regulated
gene co-expression network
The co-expression network was further divided into
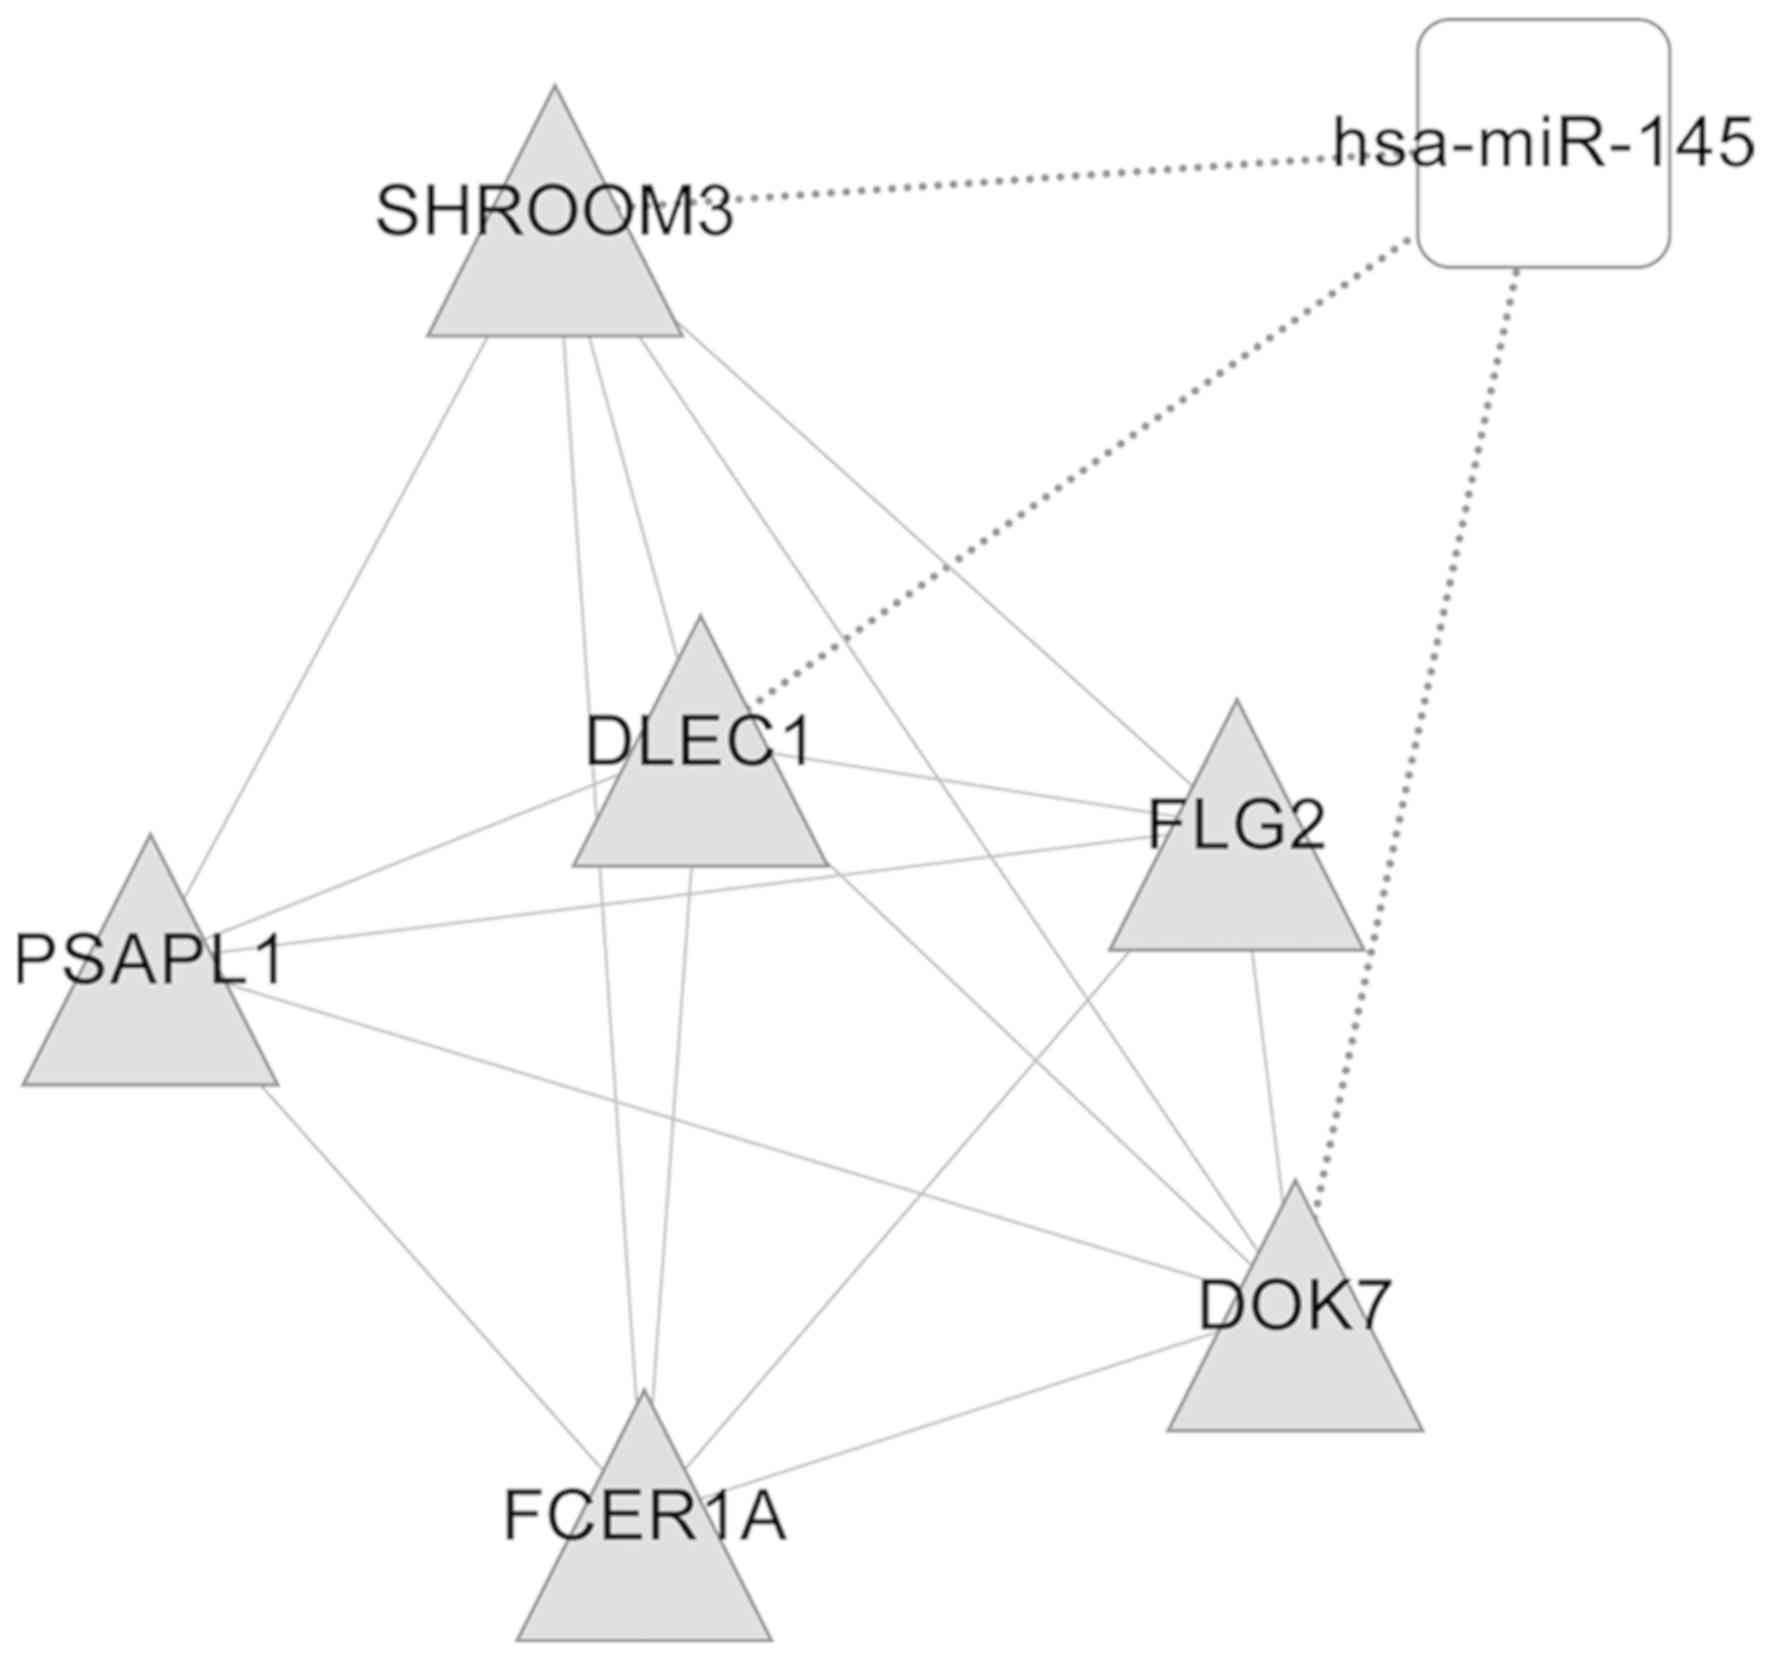
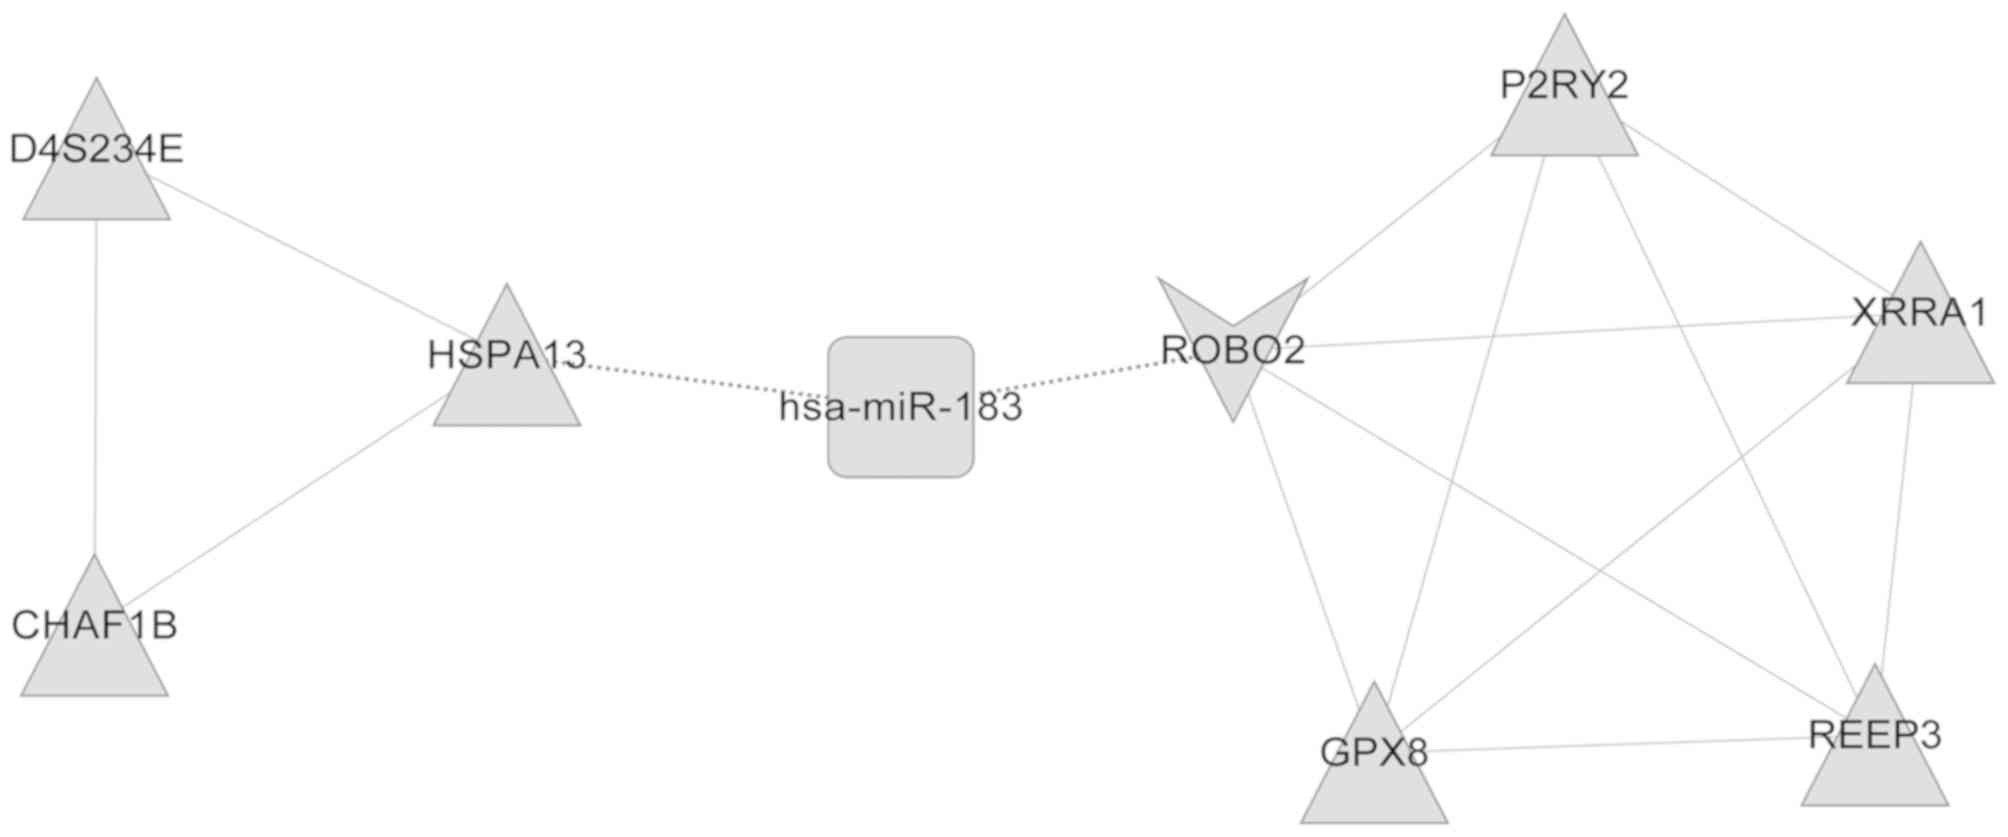
several functional modules. A total of two DEmiR (miR-145 and
miR-183)-regulated modules were then obtained (Figs. 5 and 6). The genes in these two modules, which
were enriched in nine GO categories including cellular lipid
metabolic process, lipid metabolic process and cellular response to
stimulus, and five GO categories including response to stimulus or
stress were functionally annotated, as illustrated in Tables I and II.
 | Table I.Gene Ontology annotation of
functional modules regulated by microRNA-145. |
Table I.
Gene Ontology annotation of
functional modules regulated by microRNA-145.
| GO-ID | Description | P-value | Genes in test
set |
|---|
| GO:0044255 | Cellular lipid
metabolic process |
8.41×10⁻³ | PSAPL1, FCER1A |
| GO:0006629 | Lipid metabolic
process |
1.88×10⁻² | PSAPL1, FCER1A |
| GO:0051716 | Cellular response
to stimulus |
2.60×10⁻² | SHROOM3,
FCER1A |
| GO:0051179 | Localization |
1.94×10⁻² | SHROOM3,
FCER1A |
| GO:0050794 | Regulation of
cellular process |
2.22×10⁻² | SHROOM3, FCER1A,
DLEC1 |
| GO:0050789 | Regulation of
biological process |
2.52×10⁻² | SHROOM3, FCER1A,
DLEC1 |
| GO:0050896 | Response to
stimulus |
2.68×10⁻² | SHROOM3,
FCER1A |
| GO:0065007 | Biological
regulation |
2.91×10⁻² | SHROOM3, FCER1A,
DLEC1 |
| 4GO:004237 | Cellular metabolic
process |
4.35×10⁻² | PSAPL1, FCER1A |
| Table II.Gene Ontology annotation of
functional modules regulated by microRNA-183. |
Table II.
Gene Ontology annotation of
functional modules regulated by microRNA-183.
| GO-ID | Description | P-value | Genes in test
set |
|---|
| GO:0050896 | Response to
stimulus |
4.99×10⁻³ | ROBO2, CHAF1B,
P2RY2, XRRA1, GPX8 |
| GO:0051716 | Cellular response
to stimulus |
5.59×10⁻³ | ROBO2, CHAF1B,
P2RY2 |
| GO:0042221 | Response to
chemical stimulus |
1.69×10⁻² | ROBO2, P2RY2,
GPX8 |
| GO:0006950 | Response to
stress |
2.84×10⁻² | CHAF1B, P2RY2,
GPX8 |
| GO:0023052 | Signaling |
1.23×10⁻² | ROBO2, P2RY2,
D4S234E |
Discussion
Down syndrome, or trisomy 21, is one of the most
frequently occurring chromosomal abnormalities in humans (2). To better understand the regulatory
mechanism of gene expression in Down syndrome, miR target gene
expression profiles were systematically analyzed in the present
study.
miR and mRNA expression profiles in the thymus
tissue of human Down syndrome patients were first downloaded from
GEO, a public functional genomics data repository, from a study by
Moreira-Filho et al (14).
These RNA-seq data were preliminarily screened using WGCNA. WGCNA
is a powerful statistical method of constructing co-expression
networks describing correlation patterns among genes across
microarray samples (14). In the
present study, WGCNA, as implemented in R, was used to identify
Down syndrome-associated miR and mRNA modules. Notably, DEGs and
DEmiRs based on the expression levels of miRs and mRNAs between
Down syndrome thymus samples and normal control samples were also
identified. Then, these DEGs and DEmiRs were mapped to the screened
miR or mRNA modules by WGCNA and were identified as DEGs and
DEmiRs. Next, a gene co-expression network regulated by six DEmiRs,
including miR-30c, miR-139-5p, miR-183, miR-145, miR-150 and
miR-135b, was constructed. Additionally, DEmiR target genes were
enriched in various biological processes and signaling pathways,
including those modulating response to stimulus and response to
stress.
miRs are known to post-transcriptionally regulate
gene expression by binding to complementary targets which are
involved in a wide range of important biological processes. They
also can be used as predictive tools and intervention targets for
several diseases. Previous studies have been performed
investigating the miRs and their predicted mRNAs in Down syndrome.
Using bioinformatics tools, Lim et al (25) profiled genome-wide miR expression
in placenta samples from euploid or Down syndrome fetuses and
predicted the functions of DEmiRs. A total of 34 placental miRs
were identified that were differentially expressed in euploid
fetuses with Down syndrome and proposed that a number of Down
syndrome-related genes on chromosome 21 are predicted targets of
these miRs. In the study of Li et al (26), the miRs from the brain and
peripheral tissues of Downs patients were screened and demonstrated
an upregulation of miR-155 and a decrease in the abundance of the
miR-155 mRNA target complement factor H (CFH). Therefore, it was
hypothesized that a generalized miR-155-mediated downregulation of
CFH may contribute to the immunopathological deficits associated
with Down's syndrome. In the hippocampus of the Ts65Dn Down
syndrome mouse model, the genome-wide regulatory effects of miR-155
and miR-802, which are overexpressed in Down syndrome individuals,
have been demonstrated by the lentiviral miR-sponge strategy
(27). An integrated analysis of
miR and mRNA expression in the hippocampus has been presented by
Shi et al (10). They
identified a number of DEmiRs and their predicted mRNAs. Of these
identified miR-mRNA interactions, miR-138 and its target
histone-lysine N-methyltransferase EZH2 have been demonstrated to
function in the hippocampus in Down syndrome (10). In addition, Moreira-Filho et
al (14) used whole thymic
tissue from Down syndrome, karyotypically normal subjects, and a
network-based approach for gene co-expression network to identify
modular transcriptional repertoires and the interactions between
all of the system's constituents. Down syndrome is described in the
study as a thymic tissue adaptation under trisomy 21 genomic
dysregulation, and this adaption may be driven by epigenetic
mechanisms acting at the chromatin level and through miR-based
control of transcriptional programs (14).
In the present study, the DEmiR and DEmiR-regulated
gene co-expression network in the thymus tissue of Down syndrome
patients suggested an association between these identified
miRs/mRNAs and the pathogenesis of Down syndrome, as well as the
development of several complications in Down syndrome patients. A
previous study identified that through binding to the
3′untranslated region of miR-30c, miR-30c can bind and
post-transcriptionally attenuate the expression of runt-related
transcription factor 1 (RUNX1), a key regulator of definitive
hematopoiesis in the embryo and adults, which resides on chromosome
21 (28). Due to the increased
gene dosage of RUNX1, patients with Down syndrome have an increased
risk of developing acute megakaryoblastic leukemia (29). In addition, patients with Down
syndrome have decreased expression of miR-30c, and increased
expression of RUNX1. In the present study, miR-30c was demonstrated
to target several other sites linked to Down syndrome in addition
to RUNX1, including heat shock 70 kDa protein 1B (HSPA1B), protein
BTG3 (BTG3), double-stranded RNA-specific editase 1 (ADARB1),
pericentrin (PCNT), DENN domain-containing protein 5B (DENND5B),
α-2-macroglobulin-like protein 1 (A2ML1) and ectoderm-neural cortex
protein 1 (ENC1). Patients who have Down syndrome are at high risk
of developing early-onset Alzheimer's disease. HSPA1B, has been
demonstrated to be associated with Alzheimer's disease
pathophysiology (30).
Additionally, as reported previously, there is an increased
expression of heat-shock proteins in patients with both Alzheimer's
disease and Down syndrome (31).
These results suggest that HSPA1B may be involved in the onset of
Alzheimer's disease in Down syndrome patients. BTG3, a candidate
tumor suppressor gene induced by p53 following DNA damage, which is
also located on chromosome 21 is significantly altered in adult
Down syndrome patients (32). As
previously described, BTG3 appears to be tightly regulated in Down
syndrome (2). ADARB1 is known to
serve a key role in brain development and function, and has been
reported to demonstrate a dosage imbalance in Down syndrome mouse
models at the transcriptional level (33). Furthermore, previous RNA expression
analysis identified that PCNT on chromosome 21, which is involved
in Down syndrome, is dose-sensitive (34). Furthermore, DENND5B, A2ML1 and ENC1
have been identified as differentially expressed in fibroblasts
carrying trisomy 21 compared with normal fibroblasts, following
transcriptome analysis of induced pluripotent stem cells from
monozygotic twins (35). The
results of the present study, together with evidence from previous
research, indicates that miR-30c-regulated gene co-expression
networks may serve an important role in the development of
detrimental phenotypes in Down syndrome patients, particularly
regarding Alzheimer's disease.
In the present study, the gene co-expression network
was further divided and miR-145, and miR-183 regulated functional
modules, and genes involved in these two modules, were demonstrated
to be associated with responses to stimuli and responses to stress.
miR-145 is known as a tumor-suppressive miR that is downregulated
in various types of cancer, including prostate, bladder, colon and
ovarian cancers (36). miR-183 is
located on human chromosome 7 and has been implicated in several
key cellular functions including neurosensory development (37). It is also reported to function as
an oncogene by targeting early growth response protein 1 and
promoting tumor cell migration (37). A previous study demonstrated that
oxidative stress occurs in the pathogenesis of Alzheimer's disease
with Down syndrome due to a deregulation of gene/protein expression
associated with trisomy 21 (38).
Increased production of reactive oxygen species accompanied by
mitochondrial dysfunction can trigger Alzheimer's disease onset in
Down syndrome patients (39). In
addition, it has been reported that levels of oxidative stress and
induction of heat-shock protein response in the amniotic fluid were
higher in women carrying Down syndrome fetuses compared with
non-Down syndrome controls (38).
Additionally, P2Y purinoceptor 2, regulated by miR-183, and widely
expressed by thymic epithelial cells (40), was identified by Moreira-Filho
et al (14) following miR
target interaction analysis in the thymus of Down syndrome
patients.
Although the present study presented an integrated
analysis of the miR-mRNA network in Down syndrome using
bioinformatics tools, the study is faced with an inherent
limitation; the lack of biological validation of the bioinformatics
results. The results obtained from this bioinformatics analysis
should be confirmed in further experimental studies.
In conclusion, the present study represents an
integrated analysis of miR and mRNA expression in the thymus in
Down syndrome patients. A gene co-expression network of six miRs
and 122 target mRNAs was constructed. These miRs and their targets,
particularly those of miR-30c, miR-145 an miR-183, may be involved
in the pathogenesis and development of complications in Down
syndrome. However, these results should be confirmed in further
experimental studies.
Acknowledgements
Not applicable.
Funding
No funding was received.
Availability of data and materials
The datasets used and/or analyzed during the current
study are available from the corresponding author on reasonable
request.
Authors' contributions
MC and LS participated in the design of the present
study and performed the statistical analysis. XHao, MZ, LZ and JB
conducted the study and analyses, and collected important
background information. XHan and CG drafted the manuscript, and
analyzed and interpreted the data. All authors read and approved
the final manuscript.
Ethics approval and consent to
participate
Not applicable.
Patient consent for publication
Not applicable.
Competing interests
The authors declare that they have no competing
interests.
References
|
1
|
Weijerman ME and de Winter JP: Clinical
practice: The care of children with Down syndrome. Eur J Pediatr.
169:1445–1452. 2010. View Article : Google Scholar : PubMed/NCBI
|
|
2
|
Patterson D: Molecular genetic analysis of
Down syndrome. Hum Genet. 126:195–214. 2009. View Article : Google Scholar : PubMed/NCBI
|
|
3
|
Gardiner KJ: Molecular basis of
pharmacotherapies for cognition in Down syndrome. Trends Pharmacol
Sci. 31:66–73. 2010. View Article : Google Scholar : PubMed/NCBI
|
|
4
|
Hickey F, Hickey E and Summar KL: Medical
update for children with Down syndrome for the pediatrician and
family practitioner. Adv Pediatr. 59:137–157. 2012. View Article : Google Scholar : PubMed/NCBI
|
|
5
|
Jin S, Lee YK, Lim YC, Zheng Z, Lin XM, Ng
DP, Holbrook JD, Law HY, Kwek KY, Yeo GS and Ding C: Global DNA
hypermethylation in down syndrome placenta. PLoS Genet.
9:e10035152013. View Article : Google Scholar : PubMed/NCBI
|
|
6
|
Costa V, Angelini C, D'Apice L, Mutarelli
M, Casamassimi A, Sommese L, Gallo MA, Aprile M, Esposito R, Leone
L, et al: Massive-scale RNA-Seq analysis of non ribosomal
transcriptome in human trisomy 21. PLoS One. 6:e184932011.
View Article : Google Scholar : PubMed/NCBI
|
|
7
|
Ambros V: The functions of animal
microRNAs. Nature. 431:350–355. 2004. View Article : Google Scholar : PubMed/NCBI
|
|
8
|
Bartel DP: MicroRNAs: Genomics,
biogenesis, mechanism, and function. Cell. 116:281–297. 2004.
View Article : Google Scholar : PubMed/NCBI
|
|
9
|
Liao JM, Zhou X, Zhang Y and Lu H:
MiR-1246: A new link of the p53 family with cancer and Down
syndrome. Cell Cycle. 11:2624–2630. 2012. View Article : Google Scholar : PubMed/NCBI
|
|
10
|
Shi WL, Liu ZZ, Wang HD, Wu D, Zhang H,
Xiao H, Chu Y, Hou QF and Liao SX: Integrated miRNA and mRNA
expression profiling in fetal hippocampus with Down syndrome. J
Biomed Sci. 23:482016. View Article : Google Scholar : PubMed/NCBI
|
|
11
|
Letourneau A, Santoni FA, Bonilla X,
Sailani MR, Gonzalez D, Kind J, Chevalier C, Thurman R, Sandstrom
RS, Hibaoui Y, et al: Domains of genome-wide gene expression
dysregulation in Down's syndrome. Nature. 508:345–350. 2014.
View Article : Google Scholar : PubMed/NCBI
|
|
12
|
Levin S, Schlesinger M, Handzel Z, Hahn T,
Altman Y, Czernobilsky B and Boss J: Thymic deficiency in Down's
syndrome. Pediatrics. 63:80–87. 1979.PubMed/NCBI
|
|
13
|
Larocca LM, Lauriola L, Ranelletti FO,
Piantelli M, Maggiano N, Ricci R and Capelli A: Morphological and
immunohistochemical study of Down syndrome thymus. Am J Med Genet.
(Suppl 37):225–230. 1990.
|
|
14
|
Moreira-Filho CA, Bando SY, Bertonha FB,
Silva FN, Costa Lda F, Ferreira LR, Furlanetto G, Chacur P, Zerbini
MC and Carneiro-Sampaio M: Modular transcriptional repertoire and
MicroRNA target analyses characterize genomic dysregulation in the
thymus of Down syndrome infants. Oncotarget. 7:7497–7533. 2016.
View Article : Google Scholar : PubMed/NCBI
|
|
15
|
Smyth GK: LIMMA: Linear models for
microarray data. Bioinformatics and Computational Biology Solutions
Using R and Bioconductor. Gentleman R, Carey V, Dudoit S, Irizarry
R and Huber W: Springer; New York, NY: pp. 397–420. 2005,
View Article : Google Scholar
|
|
16
|
R Core Team: R, . A Language and
environment for statistical computing. Version 3.3.3. R Foundation
for Statistical Computing; Vienna: 2017
|
|
17
|
Smyth G: Linear models and empirical bayes
methods for assessing differential expression in microarray
experiments. Stat Appl Genet Mol Biol. 3:Article32004. View Article : Google Scholar : PubMed/NCBI
|
|
18
|
Wang L, Cao C, Ma Q, Zeng Q, Wang H, Cheng
Z, Zhu G, Qi J, Ma H, Nian H and Wang Y: RNA-seq analyses of
multiple meristems of soybean: Novel and alternative transcripts,
evolutionary and functional implications. BMC Plant Biol.
14:1692014. View Article : Google Scholar : PubMed/NCBI
|
|
19
|
Betel D, Koppal A, Agius P, Sander C and
Leslie C: Comprehensive modeling of microRNA targets predicts
functional non-conserved and non-canonical sites. Genome Biol.
11:R902010. View Article : Google Scholar : PubMed/NCBI
|
|
20
|
Shannon P, Markiel A, Ozier O, Baliga NS,
Wang JT, Ramage D, Amin N, Schwikowski B and Ideker T: Cytoscape: A
software environment for integrated models of biomolecular
interaction networks. Genome Res. 13:2498–2504. 2003. View Article : Google Scholar : PubMed/NCBI
|
|
21
|
Ehsani Ardakani MJ, Safaei A, Arefi
Oskouie A, Haghparast H, Haghazali M, Mohaghegh Shalmani H,
Peyvandi H, Naderi N and Zali MR: Evaluation of liver cirrhosis and
hepatocellular carcinoma using Protein-Protein Interaction
Networks. Gastroenterol Hepatol Bed Bench. 9 (Suppl 1):S14–S22.
2016.PubMed/NCBI
|
|
22
|
Maere S, Heymans K and Kuiper M: BiNGO: A
Cytoscape plugin to assess overrepresentation of gene ontology
categories in biological networks. Bioinformatics. 21:3448–3449.
2005. View Article : Google Scholar : PubMed/NCBI
|
|
23
|
Beissbarth T and Speed TP: GOstat: Find
statistically overrepresented Gene Ontologies within a group of
genes. Bioinformatics. 20:1464–1465. 2004. View Article : Google Scholar : PubMed/NCBI
|
|
24
|
Wu J, Mao X, Cai T, Luo J and Wei L: KOBAS
server: A web-based platform for automated annotation and pathway
identification. Nucleic Acids Res. 34:W720–W724. 2006. View Article : Google Scholar : PubMed/NCBI
|
|
25
|
Lim JH, Kim DJ, Lee DE, Han JY, Chung JH,
Ahn HK, Lee SW, Lim DH, Lee YS, Park SY and Ryu HM: Genome-wide
microRNA expression profiling in placentas of fetuses with Down
syndrome. Placenta. 36:322–328. 2015. View Article : Google Scholar : PubMed/NCBI
|
|
26
|
Li YY, Alexandrov PN, Pogue AI, Zhao Y,
Bhattacharjee S and Lukiw WJ: miRNA-155 up-regulation and
complement factor H (CFH) deficits in Down's syndrome. Neuroreport.
23:168–173. 2012. View Article : Google Scholar : PubMed/NCBI
|
|
27
|
Bofill-De Ros X, Santos M, Vila-Casadesús
M, Villanueva E, Andreu N, Dierssen M and Fillat C: Genome-wide
miR-155 and miR-802 target gene identification in the hippocampus
of Ts65Dn Down syndrome mouse model by miRNA sponges. BMC Genomics.
16:9072015. View Article : Google Scholar : PubMed/NCBI
|
|
28
|
Ben-Ami O, Pencovich N, Lotem J, Levanon D
and Groner Y: A regulatory interplay between miR-27a and Runx1
during megakaryopoiesis. Proc Natl Acad Sci USA. 106:238–243. 2009.
View Article : Google Scholar : PubMed/NCBI
|
|
29
|
Izraeli S, Rainis L, Hertzberg L, Smooha G
and Birger Y: Trisomy of chromosome 21 in leukemogenesis. Blood
Cells Mol Dis. 39:156–159. 2007. View Article : Google Scholar : PubMed/NCBI
|
|
30
|
Clarimón J, Bertranpetit J, Boada M,
Tàrraga L and Comas D: HSP70-2 (HSPA1B) is associated with
noncognitive symptoms in late-onset Alzheimer's disease. J Geriatr
Psychiatry Neurol. 16:146–150. 2003. View Article : Google Scholar : PubMed/NCBI
|
|
31
|
Yoo B, Seidl R, Cairns N and Lubec G:
Heat-shock protein 70 levels in brain of patients with Down
syndrome and Alzheimer's disease. In: The Molecular Biology of Down
Syndrome. Springer; New York, NY: pp. 315–322. 1999,
|
|
32
|
Lockstone HE, Harris LW, Swatton JE,
Wayland MT, Holland AJ and Bahn S: Gene expression profiling in the
adult Down syndrome brain. Genomics. 90:647–660. 2007. View Article : Google Scholar : PubMed/NCBI
|
|
33
|
Kahlem P, Sultan M, Herwig R, Steinfath M,
Balzereit D, Eppens B, Saran NG, Pletcher MT, South ST, Stetten G,
et al: Transcript level alterations reflect gene dosage effects
across multiple tissues in a mouse model of down syndrome. Genome
Res. 14:1258–1267. 2004. View Article : Google Scholar : PubMed/NCBI
|
|
34
|
Pritchard M, Reeves RH, Dierssen M,
Patterson D and Gardiner KJ: Down syndrome and the genes of human
chromosome 21: Current knowledge and future potentials. Report on
the Expert workshop on the biology of chromosome 21 genes: Towards
gene-phenotype correlations in Down syndrome. Washington D.C.,
September 28-October 1, 2007. Cytogenet Genome Res. 121:67–77.
2008. View Article : Google Scholar : PubMed/NCBI
|
|
35
|
Hibaoui Y, Grad I, Letourneau A, Santoni
FA, Antonarakis SE and Feki A: Data in brief: Transcriptome
analysis of induced pluripotent stem cells from monozygotic twins
discordant for trisomy 21. Genomics Data. 2:226–229. 2014.
View Article : Google Scholar : PubMed/NCBI
|
|
36
|
Shenouda SK and Alahari SK: MicroRNA
function in cancer: Oncogene or a tumor suppressor? Cancer
Metastasis Rev. 28:369–378. 2009. View Article : Google Scholar : PubMed/NCBI
|
|
37
|
Sarver AL, Li L and Subramanian S:
MicroRNA miR-183 functions as an oncogene by targeting the
transcription factor EGR1 and promoting tumor cell migration.
Cancer Res. 70:9570–9580. 2010. View Article : Google Scholar : PubMed/NCBI
|
|
38
|
Perluigi M and Butterfield DA: Oxidative
stress and Down syndrome: A route toward Alzheimer-like dementia.
Curr Gerontol Geriatr Res. 2012:7249042011.PubMed/NCBI
|
|
39
|
Pagano G and Castello G: Oxidative stress
and mitochondrial dysfunction in Down syndrome. In:
Neurodegenerative Diseases. Springer; New York, NY: pp. 291–299.
2012, PubMed/NCBI
|
|
40
|
Glass R, Townsend-Nicholson A and
Burnstock G: P2 receptors in the thymus: Expression of P2X and P2Y
receptors in adult rats, an immunohistochemical and in situ
hybridisation study. Cell Tissue Res. 300:295–306. 2000. View Article : Google Scholar : PubMed/NCBI
|