Introduction
Hepatocellular carcinoma (HCC) is a common
malignancy and the leading cause of cancer-related mortality, with
an estimated 42,220 new cases diagnosed and 30,200 mortalities in
the United States in 2018 (1).
Despite curative surgical resection and recent advances in adjuvant
chemotherapy, radiotherapy and liver transplantation, recurrence
and metastasis occur frequently, leading to the overall 5-year
survival rate <20% (2).
Although multiple factors have been linked to the development and
progression of HCC, hepatitis virus infection is considered to be
the predominant underlying cause. It has been reported that the
burden of HCC parallels the prevalence of hepatitis C virus (HCV)
(3). The 10-year survival rate was
reported to be approximately 35% in HCC patients with HCV (4). Thus, it is necessary to explore the
molecular mechanisms of HCV-associated hepatocarcinogenesis to
screen novel prognostic biomarkers and to develop effective
therapeutic strategies.
Although the mechanism of the pathogenesis by which
HCV induces HCC is currently unclear, epigenetic changes (such as
DNA methylation) have been demonstrated to serve fundamental roles.
For example, aberrant hypermethylation of tumor suppressor genes or
hypomethylation of proto-oncogenes may result in the decrease or
increase in their expression levels and induce excessive
proliferation, migration and invasion of hepatocytes (5). Methylation of several genes has been
reported in HCV-associated HCC (6). For example, Ramadan et al
demonstrated that the frequency of aberrant methylation in the
promoter region of serine protease inhibitor kunitz-type 2 gene was
significantly higher in HCV-positive HCC cases compared with
HCV-positive cirrhosis and normal control patients (7). Takagi et al reported that CpG
islands in zygote arrest 1 exon 1 had a higher methylation level in
HCV-positive HCC compared with non-tumorous tissues (8). Tsunedomi et al not only
demonstrated a correlation between DNA methylation and mRNA
expression levels of ATP-binding cassette subfamily B member 6
(ABCB6), but also revealed that aberrant mRNA and DNA methylation
levels of ABCB6 may serve as predictive biomarkers for early
intrahepatic recurrence of HCV-positive HCC (9). In vitro studies by Mileo et
al (10) and Quan et al
(11) demonstrated that HCV may
promote the progression of HCC cells by downregulating the protein
and mRNA levels of proline rich protein BstNI subfamily 2/p130 and
secreted frizzled-related protein, a Wnt antagonist, by inducing
promoter hypermethylation. However, genes with aberrant DNA
methylation for HCV-positive HCC remain largely
under-investigated.
The aim of the present study was to identify novel
genes to explain the development of HCV-positive HCC by combining
mRNA expression profile and methylation profile microarrays, and to
confirm their transcriptional and translational expression using
The Cancer Genome Atlas (TCGA) datasets and Human Protein Atlas
database (HPA). The results of the present study may provide novel
therapeutic targets for HCV-positive HCC.
Materials and methods
Microarray data collection
Three microarray datasets: GSE19665 (12), GSE62232 (13) and GSE60753 (14) were downloaded from the Gene
Expression Omnibus database (http://www.ncbi.nlm.nih.gov/geo) on July 25, 2018. The
GSE19665 dataset [platform, GPL570 Affymetrix Human Genome U133
Plus 2.0 Array (HG-U133_Plus_2)] was used to analyze the gene
expression profile in 20 HCC and 20 matched non-cancerous tissues,
among which 5 pairs were HCV-positive; the GSE62232 dataset
(platform, HG-U133_Plus_2) was used to detect the gene expression
profile in 81 HCC (including 9 HCV-positive) and 10 normal liver
tissues; and the GSE60753 dataset (platform, GPL13534, Illumina
HumanMethylation450 BeadChip) was used to determine the DNA
methylation profile in 156 HCC (including 12 HCV-positive), 34
normal liver tissues and 1 HCC cell line. Normal liver tissues were
not matched with HCC in GSE62232 and GSE60753, but only collected
from patients without HCC (such as benign cysts). Only the
HCV-positive HCC and normal control samples were used for our
following analyses.
Microarray data preprocessing
For the GSE19665 and GSE62232 datasets, the raw data
were preprocessed using the oligo package (version 1.42.0;
http://www.bioconductor.org/packages/release/bioc/html/oligo.html)
in Bioconductor R package (version 3.4.1; http://www.R-project.org), including data
transformation, missing value imputation with median, background
correction with microarray analysis suite method and quantile
normalization. For the GSE60753 dataset, the DNA methylation β
values were downloaded and the genes were annotated according to
the annotation information from the corresponding platform.
Differential gene expression and
methylation analysis
Differentially expressed genes (DEGs) and
differentially methylated genes (DMGs) between HCV-positive HCC and
control samples were identified using the Linear Models for
Microarray Data method (version 3.34.0; http://bioconductor.org/packages/release/bioc/html/limma.html)
(15) in the Bioconductor R
package. False discovery rate (FDR) <0.05 and |logFC| >1 were
defined as the statistical threshold value; where FC is fold
change. Hierarchical clustering (16) was performed for the DEGs and DMGs
using pheatmap R package (version 1.0.8; http://cran.r-project.org/web/packages/pheatmap)
based on Euclidean distance and the results were displayed as a
heat map. The upregulated and downregulated shared DEGs in GSE19665
and GSE62232 datasets were then overlapped with the hypomethylated
and hypermethylated DMGs, respectively, to identify the
methylated-mediated genes. Additionally, the methylated-mediated
genes were compared with the human oncogenes downloaded from the
ONGene database (http://ongene.bioinfo-minzhao.org) (17) to screen for HCC-related
oncogenes.
Protein-protein interaction (PPI)
network construction and module analysis
The STRING database (version 10.0; http://string-db.org) (18) was used to predict the interactions
between DEGs, and a PPI network was constructed using the obtained
interaction pairs using the Cytoscape software (version 3.6.1;
http://www.cytoscape.org) (19). The topological characteristics of
the nodes (proteins) in the PPI network were computed using the
CytoNCA plugin in the Cytoscape software (http://apps.cytoscape.org/apps/cytonca) (20) to determine the hub genes, including
‘degree’ [the number of edges (interactions) of a node (protein)],
‘betweenness’ (the number of shortest paths that run through a
node), ‘closeness centrality’ (CC; the average length of the
shortest paths to access all other proteins in the network) and
‘average path length’ (APL; the average distance between all pairs
of nodes). Functionally related modules with well-interconnected
genes were further identified in the PPI network using the
Molecular Complex Detection (MCODE; version 1.4.2; http://apps.cytoscape.org/apps/mcode)
algorithm (21) with the following
scoring options: Degree cutoff=2; node score cutoff=0.2; K-core=2.
Modules with MCODE score (Density*Nodes) >3 and node number
>6 were considered to be significant.
Function enrichment analysis
Gene Ontology (GO) biological process terms and
Kyoto Encyclopedia of Genes and Genomes (KEGG) pathway enrichment
analyses were performed for the methylated-mediated DEGs using the
Database for Annotation, Visualization and Integrated Discovery
(DAVID) online tool (version 6.8; http://david.abcc.ncifcrf.gov) (22) and BinGO (23) plugin in Cytoscape to predict their
underlying functions. Statistical significance was defined as
P<0.05 or FDR <0.05.
Validation of the selected
methylation-mediated DEGs
The mRNA and methylation sequencing data of HCC
tissues and normal liver tissues from patients without HCC were
extracted from TCGA database (https://portal.gdc.cancer.gov) prior to July 25, 2018,
which were measured on the Illumina HiSeq 2000 RNA Sequencing
platform. Only the HCV-positive HCC samples were included in the
present study to confirm the expression consistency of the
methylated-mediated DEGs. The expression difference between HCC and
controls was determined by Student's independent t-test using the
TCGA data. P<0.05 was considered to indicate a statistically
significant difference.
In addition, protein expression levels of the
methylated-mediated DEGs were also validated by the HPA database
(version 18; http://www.proteinatlas.org) (24), which was used to evaluate the
translational levels of the DEGs by immunohistochemistry. Results
are presented as the sum of scores of staining intensity (negative,
weak, moderate or strong) and the percentage of stained cells
(<25, 25–75 or >75%): Negative-not detected; weak +
<25%-not detected; weak + 25–75 or 75%-low; moderate
<25%-low; moderate + 25–75 or 75%-medium; strong <25%-medium,
strong + 25–75 or 75%-high.
Results
Differential gene expression and
methylation
A flowchart depicting the analytical process is
presented as Fig. 1. Following
preprocessing, a total of 1,306 (735 downregulated and 571
upregulated) and 1,249 (330 downregulated and 919 upregulated) DEGs
were identified between HCV-positive HCC and control tissues in
GSE19665 and GSE62232 datasets, respectively, using the cut-off
criteria FDR <0.05 and |logFC| >1. The
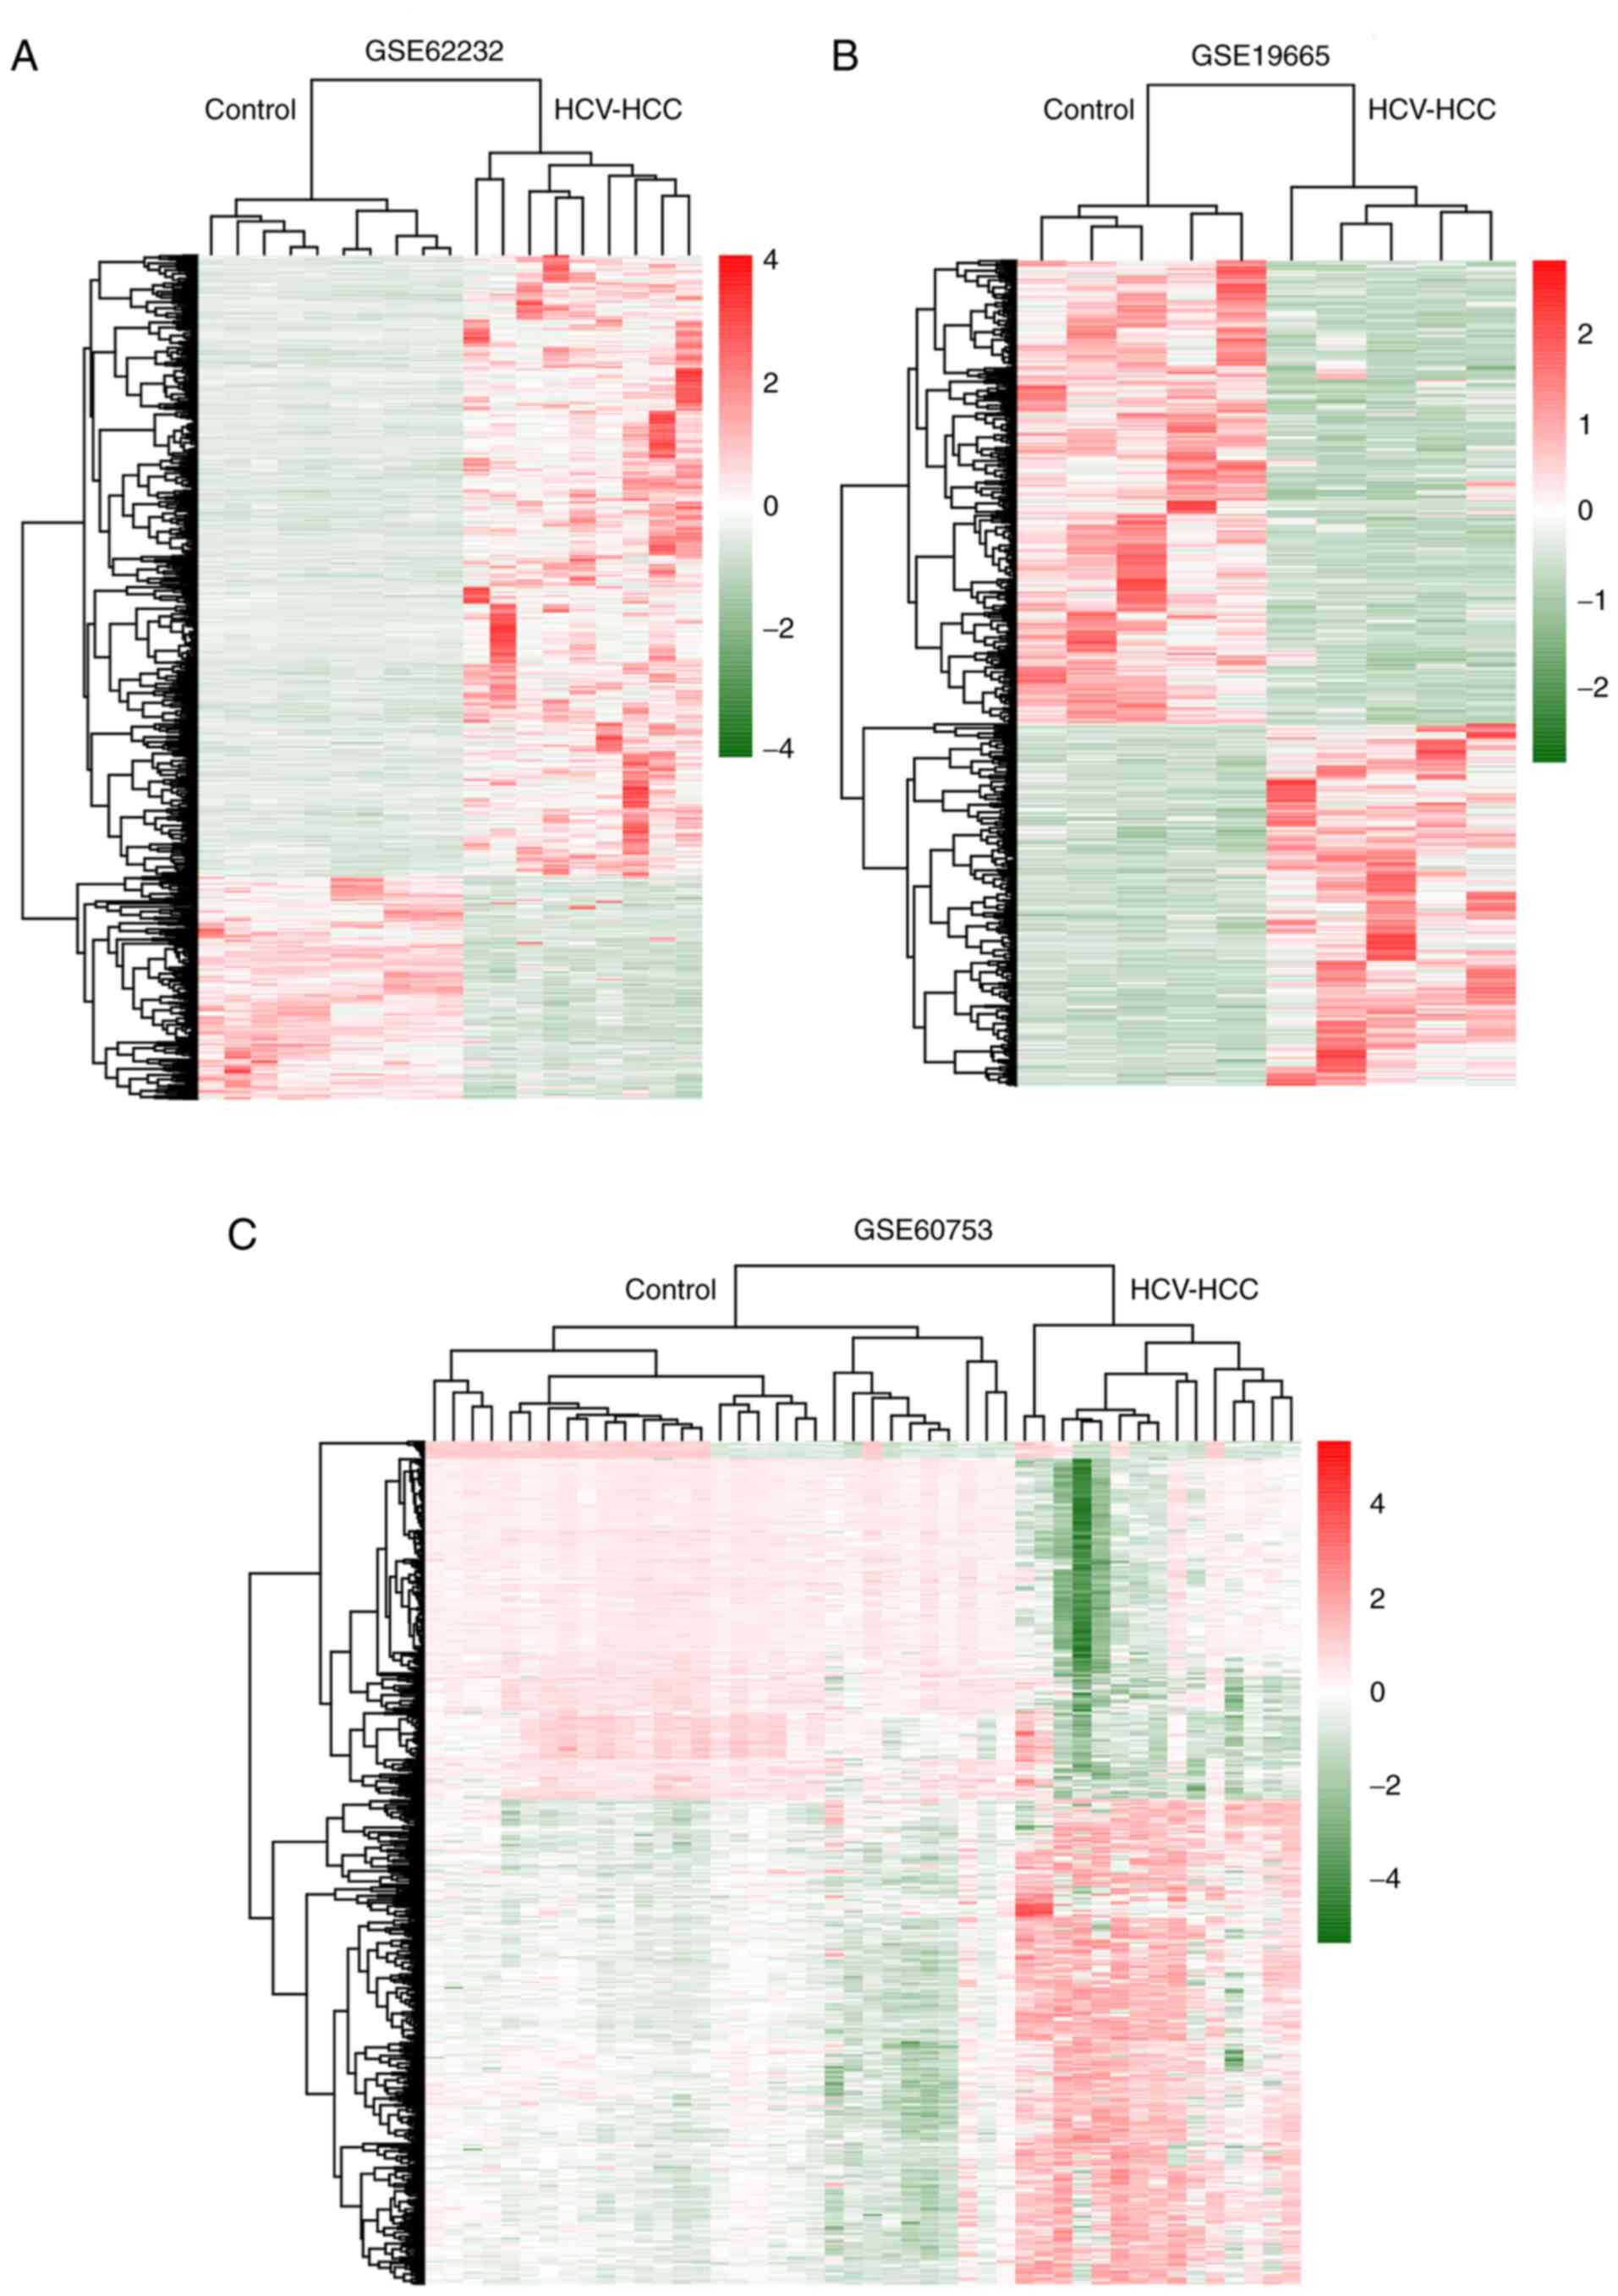
hierarchical-clustering heat map (Fig.
2A and B) indicated that DEGs may be used to distinguish
HCV-positive HCC from control samples.
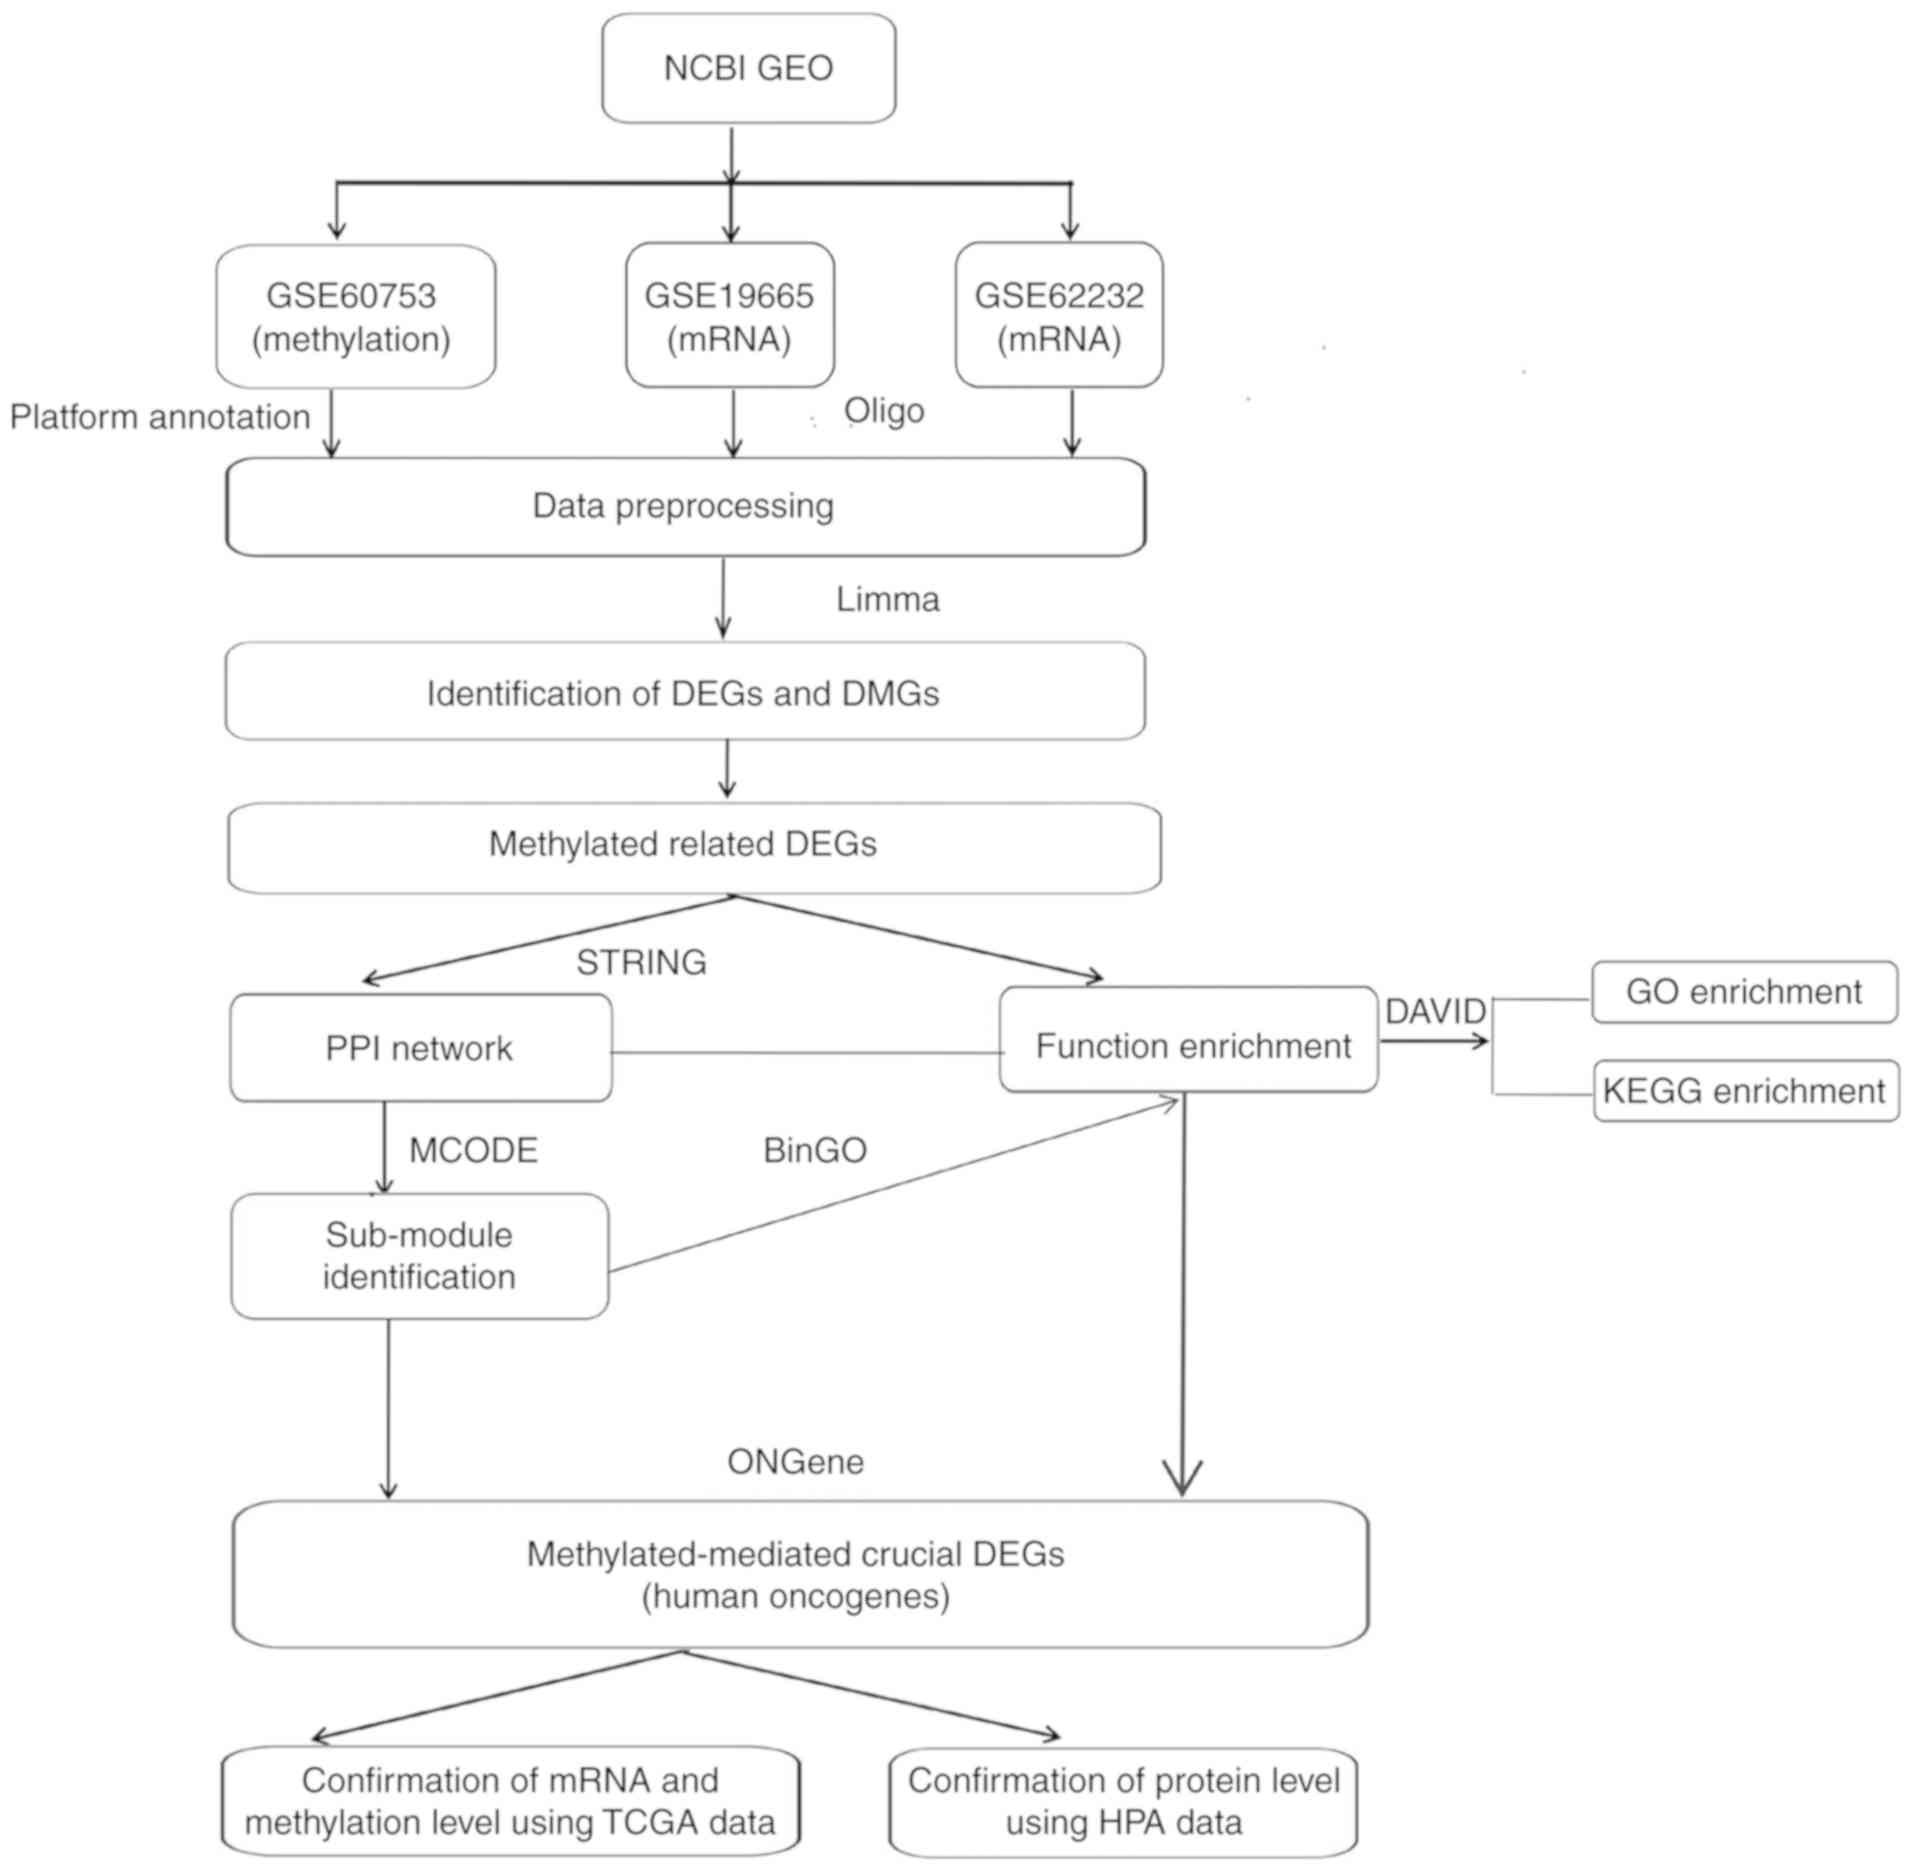 | Figure 1.Analysis plan. The key genes were
determined by integrating the methylation and mRNA expression
profile microarray datasets and then confirmed using TCGA and HPA
data. DAVID, Database for Annotation, Visualization and Integrated
Discovery; DEGs, differentially expressed genes; DMGs,
differentially methylated genes; GEO, Gene Expression Omnibus; GO,
Gene Ontology; HPA, Human Protein Atlas; KEGG, Kyoto Encyclopedia
of Genes and Genomes; limma, Linear Models for Microarray Data;
PPI, protein-protein interaction; TCGA, The Cancer Genome
Atlas. |
A total of 23,408 methylated probes were annotated
to genes in the GSE60753 dataset. By comparing with normal samples,
1,448 DMGs (903 hypomethylated and 545 hypermethylated) were also
obtained in HCV-positive HCC tissues. The hierarchical-clustering
heat map (Fig. 2C) revealed that
DMGs were different between HCV-positive HCC and control
samples.
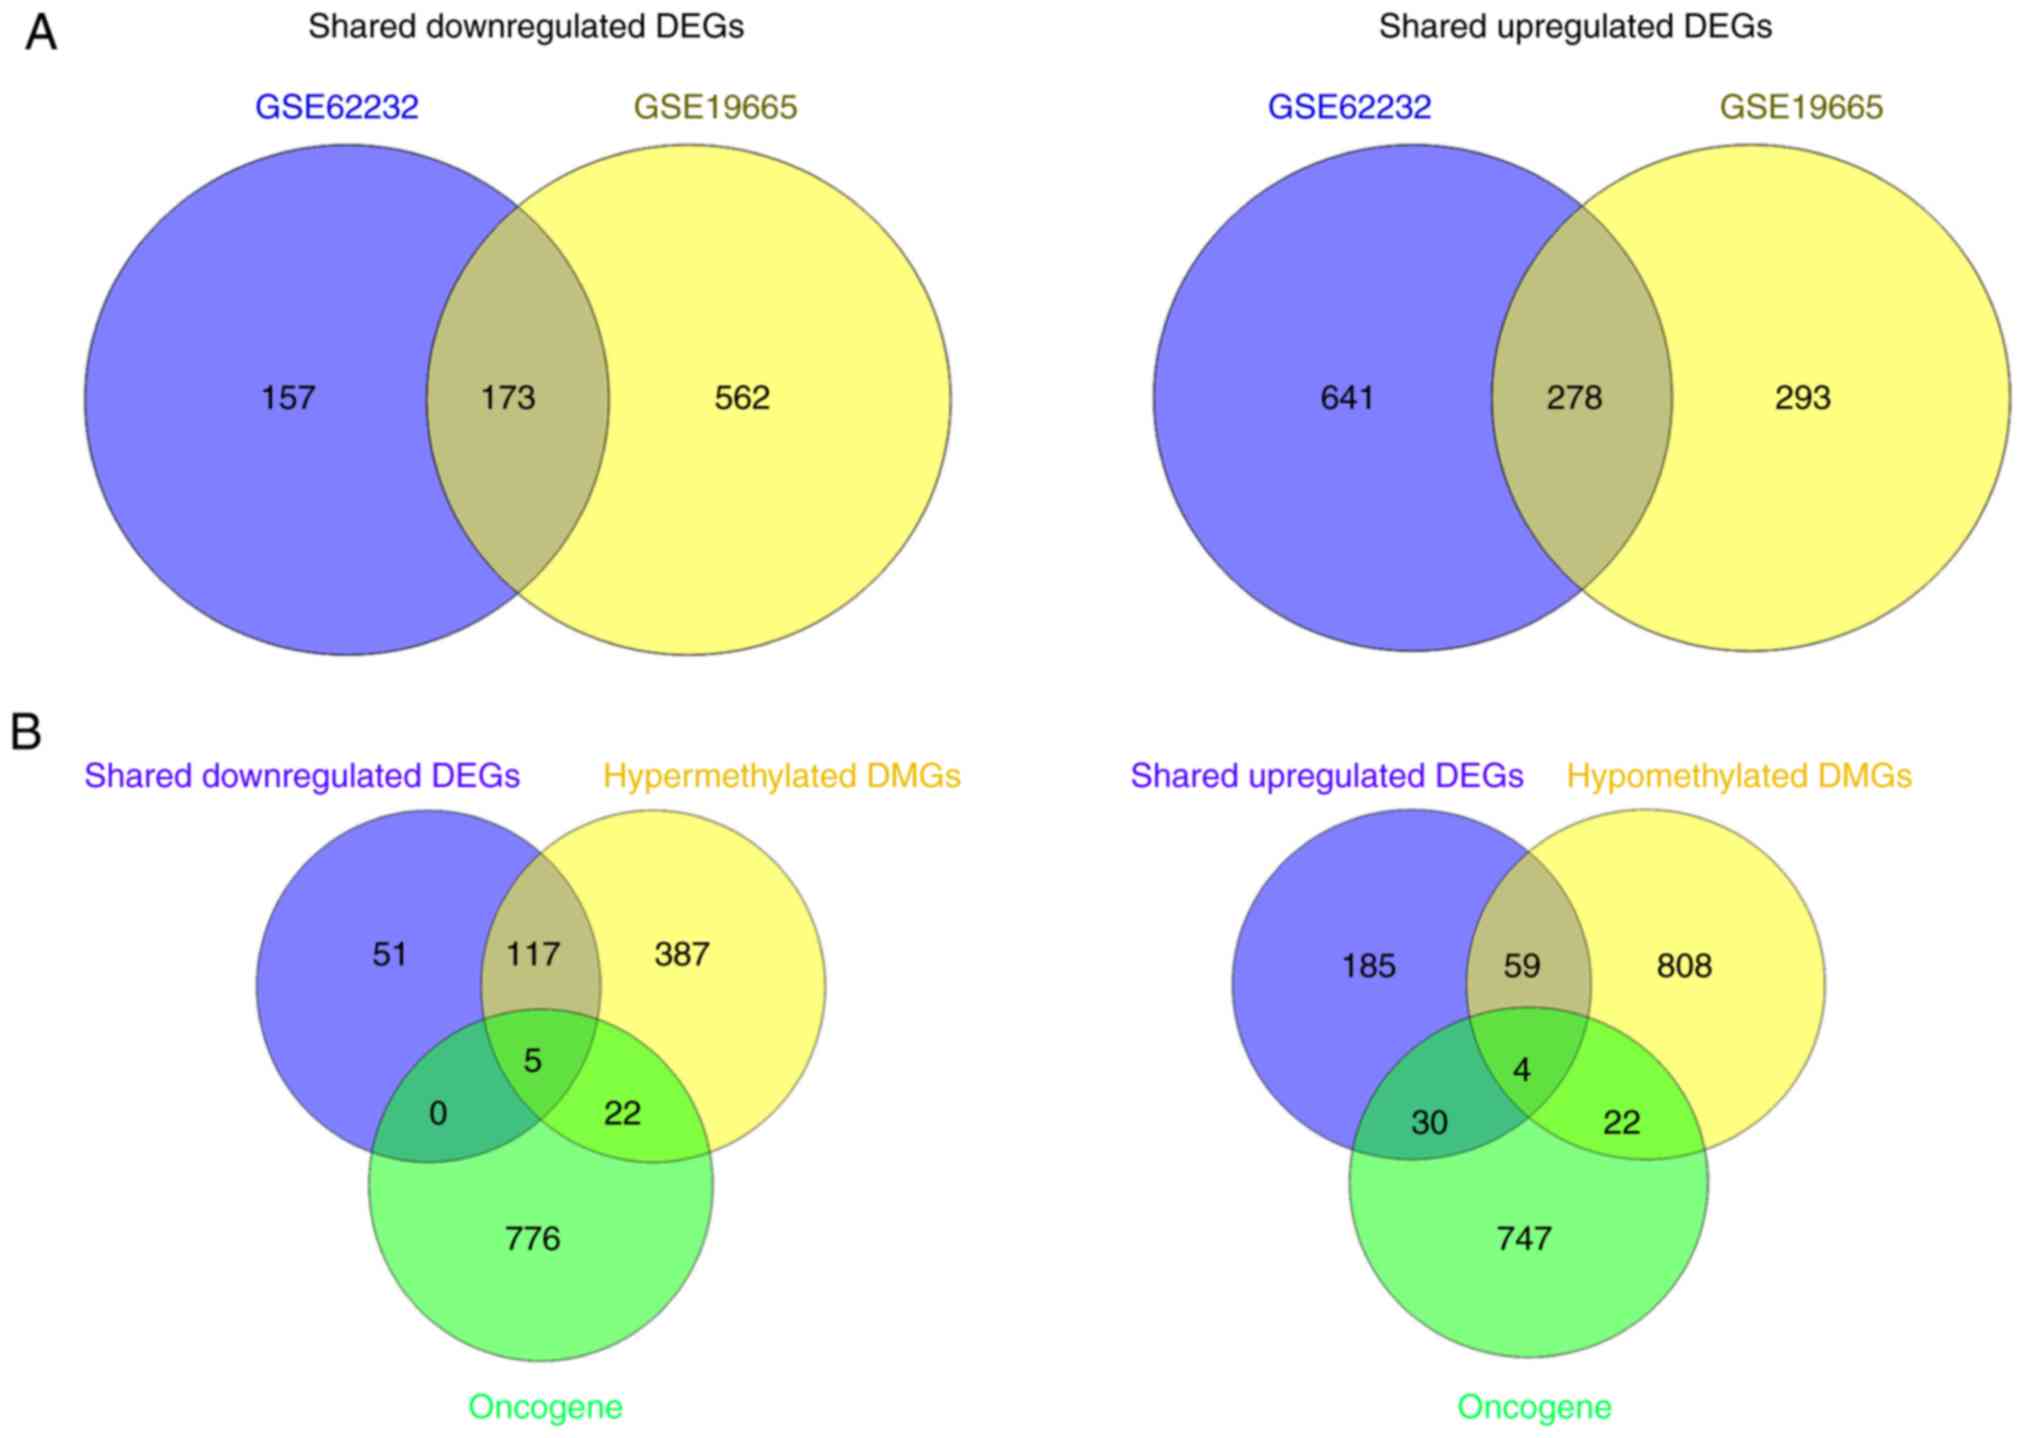
Following comparison of the DEGs identified in
GSE19665 and GSE62232 datasets, 173 downregulated and 278
upregulated DEGs were revealed to be common and their expression
trends were consistent in the two datasets (Fig. 3A). Further integration with the
DMGs found 122 DEGs were downregulated by DNA hypermethylation and
63 DEGs were upregulated by DNA hypomethylation (Fig. 3B). Among the methylated DEGs, nine
were suggested as human oncogenes according to the prediction by
ONGene database; five were downregulated: Inhibitor of DNA binding
1, HLH protein (ID1), epithelial cell adhesion molecule (EPCAM),
Fos proto-oncogene, AP-1 transcription factor subunit (FOS), ID2
and placenta specific 8 (PLAC8), whereas four were upregulated:
Aurora kinase A (AURKA), ubiquitin conjugating enzyme E2 C (UBE2C),
erb-b2 receptor tyrosine kinase 3 (ERBB3) and cyclin-dependent
kinase inhibitor 3 (CDKN3).
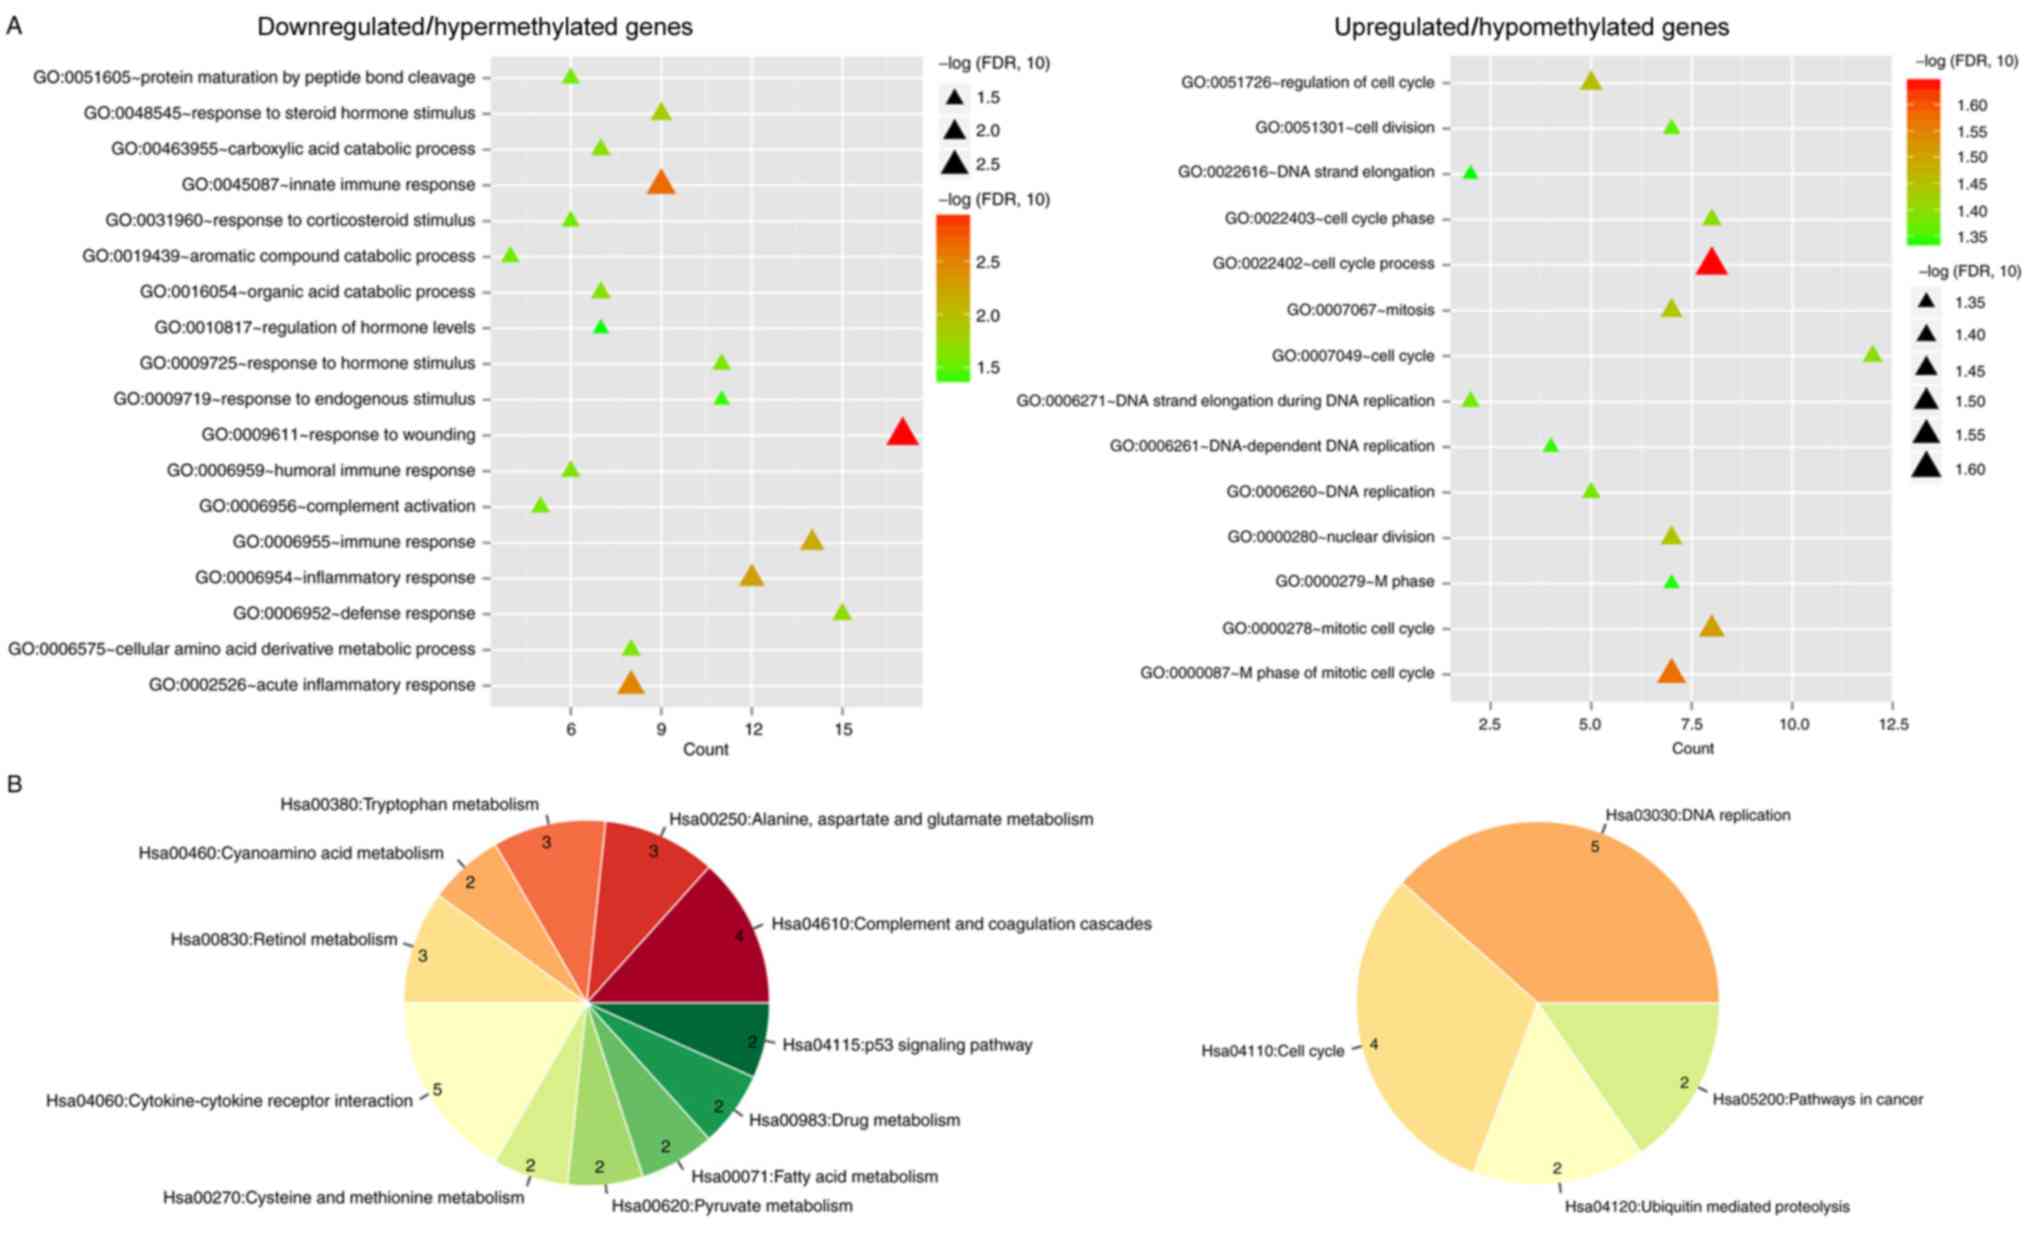
Functional enrichment for the
DEGs
The 122 downregulated/hypermethylated and 63
upregulated/hypomethylated DEGs were respectively uploaded to DAVID
to predict their functions. Using the threshold value of FDR
<0.05, 18 GO biological process terms were obtained for the
downregulated/hypermethylated DEGs, including ‘response to
wounding’ (FOS) and ‘inflammatory response’ (FOS), whereas 14 GO
biological process terms were enriched for the
upregulated/hypomethylated DEGs, including ‘cell cycle process’
(AURKA, CDKN3 and UBE2C) and ‘cell cycle’ (CDKN3 and MCM6)
(Fig. 4A; Table I). Furthermore, KEGG pathway
enrichment analysis was also performed, which resulted in 11 KEGG
pathways identified as enriched for downregulated/hypermethylated
and 4 enriched for upregulated/hypomethylated DEGs, using the
threshold value of P<0.05 (FDR >0.05 for all pathways)
(Fig. 4B; Table II). The KEGG pathway enrichment
results were consistent with GO biological process term analysis,
in which inflammatory-related ‘cytokine-cytokine receptor
interaction’ pathway was enriched for downregulated/hypermethylated
DEGs, and ‘DNA replication’ and ‘cell cycle’ were enriched for
upregulated/hypomethylated DEGs.
 | Table I.GO enrichment for methylation-related
differentially expressed genes. |
Table I.
GO enrichment for methylation-related
differentially expressed genes.
| A,
Downregulated/hypermethylated genes |
|---|
| GO ID | GO term | FDR | Genes |
|---|
| 0051605 | Protein maturation
by peptide bond cleavage |
2.87×10⁻² | CFP, C8B, C7, FCN3,
KLKB1, C1R |
| 0048545 | Response to steroid
hormone stimulus |
1.47×10⁻² | PRSS8, FOS, GOT1,
CCL2, ACADS, WFDC1, CA2, NPY1R, GHR |
| 0046395 | Carboxylic acid
catabolic process |
2.18×10⁻² | ASPA, GOT1, ACADS,
IDO2, KMO, UROC1, PON3 |
| 0045087 | Innate immune
response |
2.26×10⁻³ | CFP, C8B, C7, FCN3,
IL1RAP, VNN1, C1R, CD1D, GCH1 |
| 0031960 | Response to
corticosteroid stimulus |
2.93×10⁻² | PRSS8, FOS, GOT1,
CCL2, ACADS, GHR |
| 0019439 | Aromatic compound
catabolic process |
2.70×10⁻² | EPHX2, IDO2, KMO,
PON3 |
| 0016054 | Organic acid
catabolic process |
2.18×10⁻² | ASPA, GOT1, ACADS,
IDO2, KMO, UROC1, PON3 |
| 0010817 | Regulation of
hormone levels |
4.64×10⁻² | ALDH8A1, SHBG,
LY6E, CRHBP, CYP26A1, SRD5A1, BCO2 |
| 0009725 | Response to hormone
stimulus |
2.54×10⁻² | PRSS8, FOS, GOT1,
CCL2, HMGCS2, ACADS, FBP1, WFDC1, CA2, NPY1R, GHR |
| 0009719 | Response to
endogenous stimulus |
4.10×10⁻² | PRSS8, FOS, GOT1,
CCL2, HMGCS2, ACADS, FBP1, WFDC1, CA2, NPY1R, GHR |
| 0009611 | Response to
wounding |
1.02×10⁻³ | C7, CCL2, HPS5,
EPHX2, CHST4, C1R, CFP, C8B, FOS, LPA, PLSCR4, FCN3, KLKB1, IL1RAP,
PROZ, VNN1, NGFR |
| 0006959 | Humoral immune
response |
2.46×10⁻² | CFP, C8B, C7, CCL2,
FCN3, C1R |
| 0006956 | Complement
activation |
2.70×10⁻² | CFP, C8B, C7, FCN3,
C1R |
| 0006955 | Immune
response |
6.96×10⁻³ | C7, CCL2, CHST4,
C1R, VIPR1, CXCL12, CD1D, GCH1, CFP, C8B, FCN3, HAMP, IL1RAP,
VNN1 |
| 0006954 | Inflammatory
response |
5.26×10⁻³ | CFP, C8B, FOS, C7,
CCL2, FCN3, KLKB1, IL1RAP, EPHX2, VNN1, C1R, CHST4 |
| 0006952 | Defense
response |
1.98×10⁻² | C7, CCL2, EPHX2,
CHST4, C1R, CD1D, GCH1, CFP, C8B, FOS, FCN3, HAMP, KLKB1, IL1RAP,
VNN1 |
| 0006575 | Cellular amino acid
derivative metabolic process |
2.47×10⁻² | GGT5, LY6E, IDO2,
VNN1, KMO, BBOX1, GHR, GCH1 |
| 0002526 | Acute inflammatory
response |
3.37×10⁻³ | CFP, C8B, C7, FCN3,
KLKB1, EPHX2, VNN1, C1R |
|
| B,
Upregulated/hypomethylated genes |
|
| GO ID | GO term | FDR | Genes |
|
| 0051726 | Regulation of cell
cycle |
3.52×10⁻² | TP53BP2, NUSAP1,
SFN, CDKN3, UBE2C |
| 0051301 | Cell division |
4.37×10⁻² | RAD21, NUSAP1,
NDC80, PARD3B, CEP55, UBE2C, CDCA3 |
| 0022616 | DNA strand
elongation |
4.65×10⁻² | RFC4, FEN1 |
| 0022403 | Cell cycle
phase |
3.99×10⁻² | RAD21, NUSAP1,
NDC80, AURKA, CEP55, CDKN3, UBE2C, CDCA3 |
| 0022402 | Cell cycle
process |
2.27×10⁻² | RAD21, NUSAP1,
NDC80, AURKA, CEP55, CDKN3, UBE2C, CDCA3 |
| 0007067 | Mitosis |
3.63×10⁻² | RAD21, NUSAP1,
NDC80, AURKA, CEP55, UBE2C, CDCA3 |
| 0007049 | Cell cycle |
3.98×10⁻² | RAD21, TP53BP2,
E2F8, NUSAP1, NDC80, AURKA, PARD3B, CEP55, CDKN3, UBE2C, CDCA3,
MCM6 |
| 0006271 | DNA strand
elongation during DNA replication |
4.22×10⁻² | RFC4, FEN1 |
| 0006261 | DNA-dependent DNA
replication |
4.56×10⁻² | RFC4, MCM4, FEN1,
MCM6 |
| 0006260 | DNA
replication |
4.15×10⁻² | RFC4, RNASEH2A,
MCM4, FEN1, MCM6 |
|
| B,
Upregulated/hypomethylated genes |
|
| GO ID | GO term | FDR | Genes |
|
| 000028 | Nuclear
division |
3.63×10⁻² | RAD21, NUSAP1,
NDC80, AURKA, CEP55, UBE2C, CDCA3 |
| 0000279 | M phase |
4.61×10⁻² | RAD21, NUSAP1,
NDC80, AURKA, CEP55, UBE2C, CDCA3 |
| 0000278 | Mitotic cell
cycle |
3.06×10⁻² | RAD21, NUSAP1,
NDC80, AURKA, CEP55, CDKN3, UBE2C, CDCA3 |
| 0000087 | M phase of mitotic
cell cycle |
2.68×10⁻² | RAD21, NUSAP1,
NDC80, AURKA, CEP55, UBE2C, CDCA3 |
| Table II.KEGG pathway enrichment for
methylation-related differentially expressed genes. |
Table II.
KEGG pathway enrichment for
methylation-related differentially expressed genes.
| A,
Downregulated/hypermethylated genes |
|---|
|
|---|
| KEGG ID | KEGG pathway | P-value | Genes |
|---|
| hsa04610 | Complement and
coagulation cascades |
3.13×10⁻³ | C8B, C7, KLKB1,
C1R |
| hsa00250 | Alanine, aspartate
and glutamate metabolism |
3.81×10⁻³ | ASPA, GOT1,
ASS1 |
| hsa00380 | Tryptophan
metabolism |
6.04×10⁻³ | AADAT, IDO2,
KMO |
| hsa00460 | Cyanoamino acid
metabolism |
6.82×10⁻³ | GBA3, GGT5 |
| hsa00830 | Retinol
metabolism |
1.02×10⁻² | CYP4A11, CYP26A1,
RDH16 |
| hsa04060 | Cytokine-cytokine
receptor interaction |
2.67×10⁻² | CCL2, IL1RAP, NGFR,
CXCL12, GHR |
| hsa00270 | Cysteine and
methionine metabolism |
2.91×10⁻² | GOT1, BHMT |
| hsa00620 | Pyruvate
metabolism |
3.33×10⁻² | LDHD, ACOT12 |
| hsa00071 | Fatty acid
metabolism |
3.33×10⁻² | CYP4A11, ACADS |
| hsa00983 | Drug
metabolism |
3.53×10⁻² | NAT2, UPP2 |
| hsa04115 | p53 signaling
pathway |
4.98×10⁻² | GADD45B,
IGFBP3 |
|
| B,
Upregulated/hypomethylated genes |
|
|
hsa03030 | DNA
replication |
1.70×10⁻⁵ | RFC4, RNASEH2A,
MCM4, FEN1, MCM6 |
|
| hsa04110 | Cell cycle |
1.79×10⁻² | RAD21, SFN, MCM4,
MCM6 |
| hsa04120 | Ubiquitin mediated
proteolysis |
4.67×10⁻² | UBE2C, UBE2Q1 |
| hsa05200 | Pathways in
cancer |
4.79×10⁻² | LAMC1, CTNNA1 |
PPI network
The STRING database identified interaction
relationships in 105 out of the 185 methylation-related DEGs (68
downregulated and 37 upregulated). The 211 interaction relationship
pairs among the DEGs were used to construct a PPI network (Fig. 5A); seven of the previously
identified human oncogenes were included (downregulated, ID1, FOS
and EPCAM; upregulated, AURKA, CDKN3, UBE2C and ERBB3), as no
interactions with other DEGs were identified for ID2 and PLAC8.
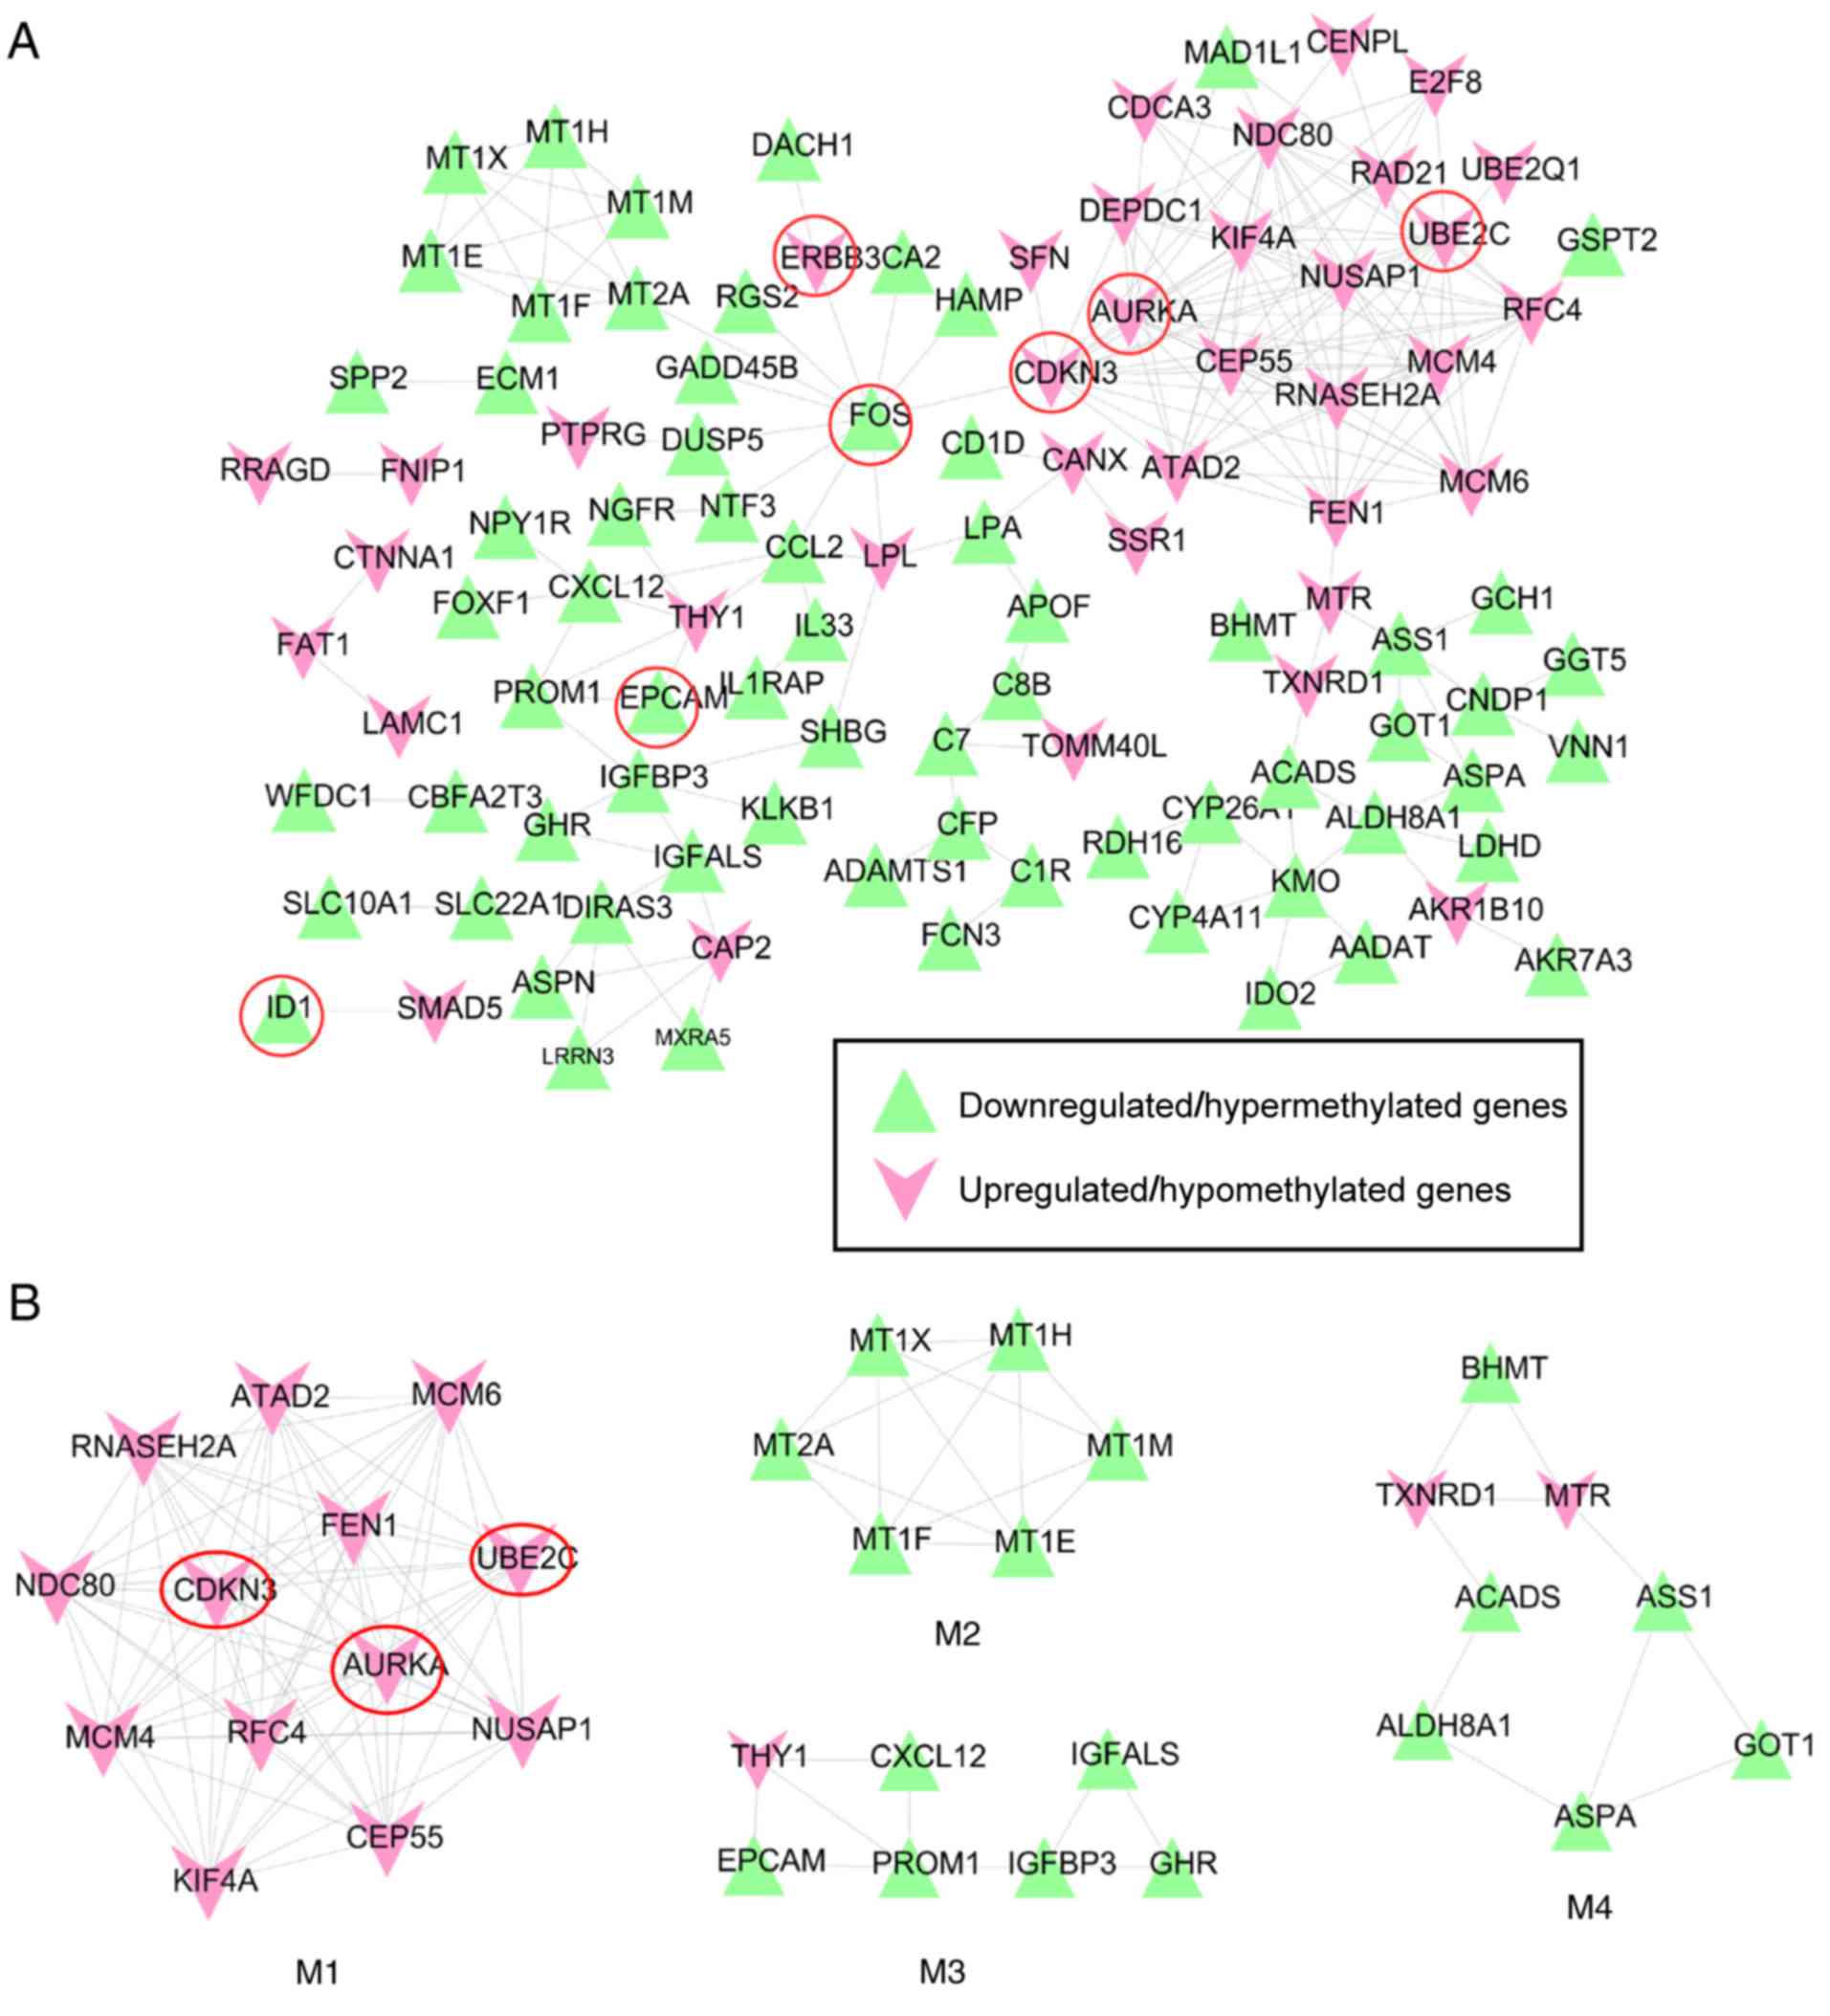 | Figure 5.PPI network of the
methylation-related differentially expressed genes. (A) An overall
PPI network constructed using the protein interaction data from the
STRING 10.0 database. (B) Functional highly connected sub-modules
extracted from the PPI network using the Molecular Complex
Detection plugin of Cytoscape software. Red, upregulated genes;
green, downregulated genes; circled genes are known human
oncogenes. AURKA, aurora kinase A; CDKN3, cyclin-dependent kinase
inhibitor 3; EPCAM, epithelial cell adhesion molecule; ERBB3,
erb-b2 receptor tyrosine kinase 3; FOS, Fos proto-oncogene, AP-1
transcription factor subunit; ID1, inhibitor of DNA binding 1, HLH
protein; M1, module 1; M2, module 2; M3, module 3; M4, module 4;
PPI, protein-protein interaction; UBE2C, ubiquitin conjugating
enzyme E2 C. |
Two human oncogenes, FOS and CDKN3, were indicated
as hub genes of the PPI network as they were shared and ranked in
the top 15 for 4 topological characteristics (Table III). In addition, AURKA and UBE2C
ranked top 5 in ‘degree’. ID1 was one of the top 10 genes in ‘CC’
and ‘APL’.
| Table III.Top 15 genes based on each
topological characteristic. |
Table III.
Top 15 genes based on each
topological characteristic.
| Node | Degree | Node | Closeness
centrality | Node | Average path
length | Node | Betweenness
Centrality |
|---|
| NDC80 | 18 | FAT1 | 1.00 | FAT1 | 1.00 | FAT1 | 1.00 |
| CDKN3a | 16 | SMAD5 | 1.00 | SMAD5 | 1.00 | FOS | 0.52 |
| AURKAa | 16 | CBFA2T3 | 1.00 | CBFA2T3 | 1.00 | CDKN3a | 0.40 |
| UBE2Ca | 15 | SPP2 | 1.00 | SPP2 | 1.00 | FEN1 | 0.36 |
| NUSAP1 | 15 | FNIP1 | 1.00 | FNIP1 | 1.00 | MTR | 0.35 |
| RFC4 | 14 | WFDC1 | 1.00 | WFDC1 | 1.00 | LPL | 0.25 |
| KIF4A | 14 | ECM1 | 1.00 | ECM1 | 1.00 | LPA | 0.18 |
| CEP55 | 14 | SLC22A1 | 1.00 | SLC22A1 | 1.00 | IGFBP3 | 0.17 |
| FEN1 | 13 | SLC10A1 | 1.00 | SLC10A1 | 1.00 | TXNRD1 | 0.16 |
| ATAD2 | 13 | ID1 | 1.00 | ID1 | 1.00 | SHBG | 0.16 |
| MCM4 | 13 | RRAGD | 1.00 | RRAGD | 1.00 | ASS1 | 0.16 |
| FOS | 11 | CTNNA1 | 0.67 | CTNNA1 | 1.50 | CCL2 | 0.15 |
| MCM6 | 11 | LAMC1 | 0.67 | LAMC1 | 1.50 | ACADS | 0.15 |
| RNASEH2A | 11 | CDKN3a | 0.28 | FOS | 3.54 | APOF | 0.14 |
| DEPDC1 | 8 | FOS | 0.28 | CDKN3a | 3.54 | CANX | 0.14 |
Subsequently, four highly connected PPI sub-modules
(Fig. 5B) were extracted from the
overall PPI network using MCODE. BinGO enrichment analysis
demonstrated that the genes in module 1 (MCODE score=12.81) were
involved in mitotic cell cycle (AURKA, CDKN3 and UBE2C); the genes
in module 2 (MCODE score=5.067) were associated with detoxification
of copper ions; the genes in module 3 (MCODE score=3.771)
participated in the regulation of cell migration; and the genes in
module 4 (MCODE score=3.41) were associated with carboxylic acid
metabolic process (Table IV).
| Table IV.GO enrichment for genes in
modules. |
Table IV.
GO enrichment for genes in
modules.
| A, Module 1 |
|---|
|
|---|
| GO ID |
Pcorr | GO term | Genes in test
set |
|---|
| 48015 |
1.86×10⁻⁶ |
Phosphoinositide-mediated signaling | FEN1, RFC4, UBE2C,
NDC80, AURKA |
| 278 |
3.01×10⁻⁵ | Mitotic cell
cycle | UBE2C, NUSAP1,
NDC80, CEP55, AURKA, CDKN3 |
| 6260 |
3.01×10⁻⁵ | DNA
replication | FEN1, RNASEH2A,
RFC4, MCM4, MCM6 |
| 22403 |
3.65×10⁻⁵ | Cell cycle
phase | UBE2C, NUSAP1,
NDC80, CEP55, AURKA, CDKN3 |
| 280 |
3.65×10⁻⁵ | Nuclear
division | UBE2C, NUSAP1,
NDC80, CEP55, AURKA |
| 7067 |
3.65×10⁻⁵ | mitosis | UBE2C, NUSAP1,
NDC80, CEP55, AURKA |
| 87 |
3.65×10⁻⁵ | M phase of mitotic
cell cycle | UBE2C, NUSAP1,
NDC80, CEP55, AURKA |
| 7049 |
4.09×10⁻⁵ | Cell cycle | UBE2C, NUSAP1,
MCM6, NDC80, CEP55, AURKA, CDKN3 |
| 51301 |
1.03×10⁻⁴ | Cell division | UBE2C, NUSAP1,
NDC80, CEP55, AURKA |
| 22402 |
1.03×10⁻⁴ | Cell cycle
process | UBE2C, NUSAP1,
NDC8, CEP55, AURKA, CDKN3 |
| 279 |
1.35×10⁻⁴ | M phase | UBE2C, NUSAP1,
NDC80, CEP55, AURKA |
| 35556 |
4.36×10⁻³ | Intracellular
signal transduction | FEN1, RFC4, UBE2C,
NDC80, AURKA |
| 6996 |
5.42×10⁻³ | Organelle
organization | UBE2C, KIF4A,
NUSAP1, NDC80, CEP55, AURKA |
| 34645 |
1.06×10⁻² | Cellular
macromolecule biosynthetic process | FEN1, RNASEH2A,
RFC4, MCM4, MCM6 |
| 9059 |
1.08×10⁻² | Macromolecule
biosynthetic process | FEN1, RNASEH2A,
RFC4, MCM4, MCM6 |
| 23034 |
1.41×10⁻² | Intracellular
signaling pathway | FEN1, RFC4, UBE2C,
NDC80, AURKA |
| 90304 |
2.84×10⁻² | Nucleic acid
metabolic process | FEN1, RNASEH2A,
RFC4, MCM4, MCM6 |
| 44249 |
4.55×10⁻² | Cellular
biosynthetic process | FEN1, RNASEH2A,
RFC4, MCM4, MCM6 |
|
| B, Module
2 |
|
| GO ID |
Pcorr | GO term | Genes in test
set |
|
| 10273 |
9.41×10⁻³ | Detoxification of
copper ion | MT2A |
| 10038 |
9.41×10⁻³ | Response to metal
ion | MT2A, MT1X |
| 10035 |
1.12×10⁻² | Response to
inorganic substance | MT2A, MT1X |
| 6882 |
1.12×10⁻² | Cellular zinc ion
homeostasis | MT2A |
| 55069 |
1.12×10⁻² | Zinc ion
homeostasis | MT2A |
| 6878 |
1.12×10⁻² | Cellular copper ion
homeostasis | MT2A |
| 55070 |
1.12×10⁻² | Copper ion
homeostasis | MT2A |
| 7263 |
1.37×10⁻² | Nitric oxide
mediated signal transduction | MT2A |
| 46688 |
1.48×10⁻² | Response to copper
ion | MT2A |
|
| C, Module
3 |
|
| GO ID |
Pcorr | GO term | Genes in test
set |
|
| 30334 |
1.28×10⁻² | Regulation of cell
migration | CXCL12, IGFBP3,
THY1 |
| 51270 |
1.28×10⁻² | Regulation of
cellular component movement | CXCL12, IGFBP3,
THY1 |
| 40012 |
1.28×10⁻² | Regulation of
locomotion | CXCL12, IGFBP3,
THY1 |
| 42325 |
3.08×10⁻² | Regulation of
phosphorylation | GHR, IGFBP3,
THY1 |
| 19220 |
3.08×10⁻² | Regulation of
phosphate metabolic process | GHR, IGFBP3,
THY1 |
| 51174 |
3.08×10⁻² | Regulation of
phosphorus metabolic process | GHR, IGFBP3,
THY1 |
| 45595 |
3.08×10⁻² | Regulation of cell
differentiation | GHR, IGFBP3,
THY1 |
| 7155 |
3.56×10⁻² | Cell adhesion | CXCL12, THY1,
IGFALS |
| 22610 |
3.56×10⁻² | Biological
adhesion | CXCL12, THY1,
IGFALS |
| 32879 |
3.64×10⁻² | Regulation of
localization | CXCL12, IGFBP3,
THY1 |
| 50793 |
3.69×10⁻² | Regulation of
developmental process | GHR, IGFBP3,
THY1 |
| 48522 |
3.81×10⁻² | Positive regulation
of cellular process | GHR, CXCL12,
IGFBP3, THY1 |
| 48518 |
4.28×10⁻² | Positive regulation
of biological process | GHR, CXCL12,
IGFBP3, THY1 |
| 51239 |
4.29×10⁻² | Regulation of
multicellular organismal process | GHR, IGFBP3,
THY1 |
| 10646 |
4.53×10⁻² | Regulation of cell
communication | GHR, IGFBP3,
THY1 |
| 7166 |
4.93×10⁻² | Cell surface
receptor linked signaling pathway | GHR, CXCL12,
THY1 |
|
| D, Module
4 |
|
| GO ID |
Pcorr | GO term | Genes in test
set |
|
| 19752 |
7.81×10⁻⁸ | Carboxylic acid
metabolic process | BHMT, GOT1, MTR,
ALDH8A1, ACADS, ASPA, ASS1 |
| 43436 |
7.81×10⁻⁸ | Oxoacid metabolic
process | BHMT, GOT1, MTR,
ALDH8A1, ACADS, ASPA, ASS1 |
| 6082 |
7.81×10⁻⁸ | Organic acid
metabolic process | BHMT, GOT1, MTR,
ALDH8A1, ACADS, ASPA, ASS1 |
| 42180 |
7.81×10⁻⁸ | Cellular ketone
metabolic process | BHMT, GOT1, MTR,
ALDH8A1, ACADS, ASPA, ASS1 |
| 6520 |
2.23×10⁻⁶ | Cellular amino acid
metabolic process | BHMT, GOT1, MTR,
ASPA, ASS1 |
| 44106 |
6.48×10⁻⁶ | Cellular amine
metabolic process | BHMT, GOT1, MTR,
ASPA, ASS1 |
| 44281 |
1.21×10⁻⁵ | Small molecule
metabolic process | BHMT, GOT1, MTR,
ALDH8A1, ACADS, ASPA, ASS1 |
| 6519 |
1.21×10⁻⁵ | Cellular amino acid
and derivative metabolic process | BHMT, GOT1, MTR,
ASPA, ASS1 |
| 9308 |
1.89×10⁻⁵ | Amine metabolic
process | BHMT, GOT1, MTR,
ASPA, ASS1 |
| 44283 |
2.33×10⁻⁵ | Small molecule
biosynthetic process | BHMT, GOT1, MTR,
ALDH8A1, ASS1 |
| 44237 |
1.82×10⁻³ | Cellular metabolic
process | BHMT, GOT1, TXNRD1,
MTR, ALDH8A1, ACADS, ASPA, ASS1 |
| 8152 |
5.73×10⁻³ | Metabolic
process | BHMT, GOT1, TXNRD1,
MTR, ALDH8A1, ACADS, ASPA, ASS1 |
| 44249 |
5.73×10⁻³ | Cellular
biosynthetic process | BHMT, GOT1, MTR,
ALDH8A1, ASS1 |
| 9058 |
6.30×10⁻³ | Biosynthetic
process | BHMT, GOT1, MTR,
ALDH8A1, ASS1 |
| 34641 |
9.55×10⁻³ | Cellular nitrogen
compound metabolic process | BHMT, GOT1, MTR,
ASPA, ASS1 |
| 6807 |
1.19×10⁻² | Nitrogen compound
metabolic process | BHMT, GOT1, MTR,
ASPA, ASS1 |
| 44238 |
1.71×10⁻² | Primary metabolic
process | BHMT, GOT1, MTR,
ALDH8A1, ACADS, ASPA, ASS1 |
Validation of the selected
methylation-mediated DEGs
Based on the enrichment and PPI analyses, it was
hypothesized that downregulated/hypermethylated FOS and ID1 and
upregulated/hypomethylated CDKN3, AURKA and UBE2C may be important
human oncogenes for HCV-positive HCC. To further confirm their
expression and methylation levels, the mRNA and methylation
sequencing data of 58 HCV-HCC tissues and 50 normal controls were
obtained from the TCGA database. The results demonstrated that the
transcriptional expression and methylation levels of FOS, CDKN3 and
AURKA in TCGA sequencing data (Fig.
6B) were consistent with the microarray data (Fig. 6A). However, the methylation level
of UBE2C was not significantly different between HCV-positive HCC
and normal control TCGA samples, although its expression level was
consistent between TCGA sequencing data and our used microarray
data (Fig. 6). The methylation
level of ID1 had a detection value of 0 in the TCGA and thus
comparison was not performed.
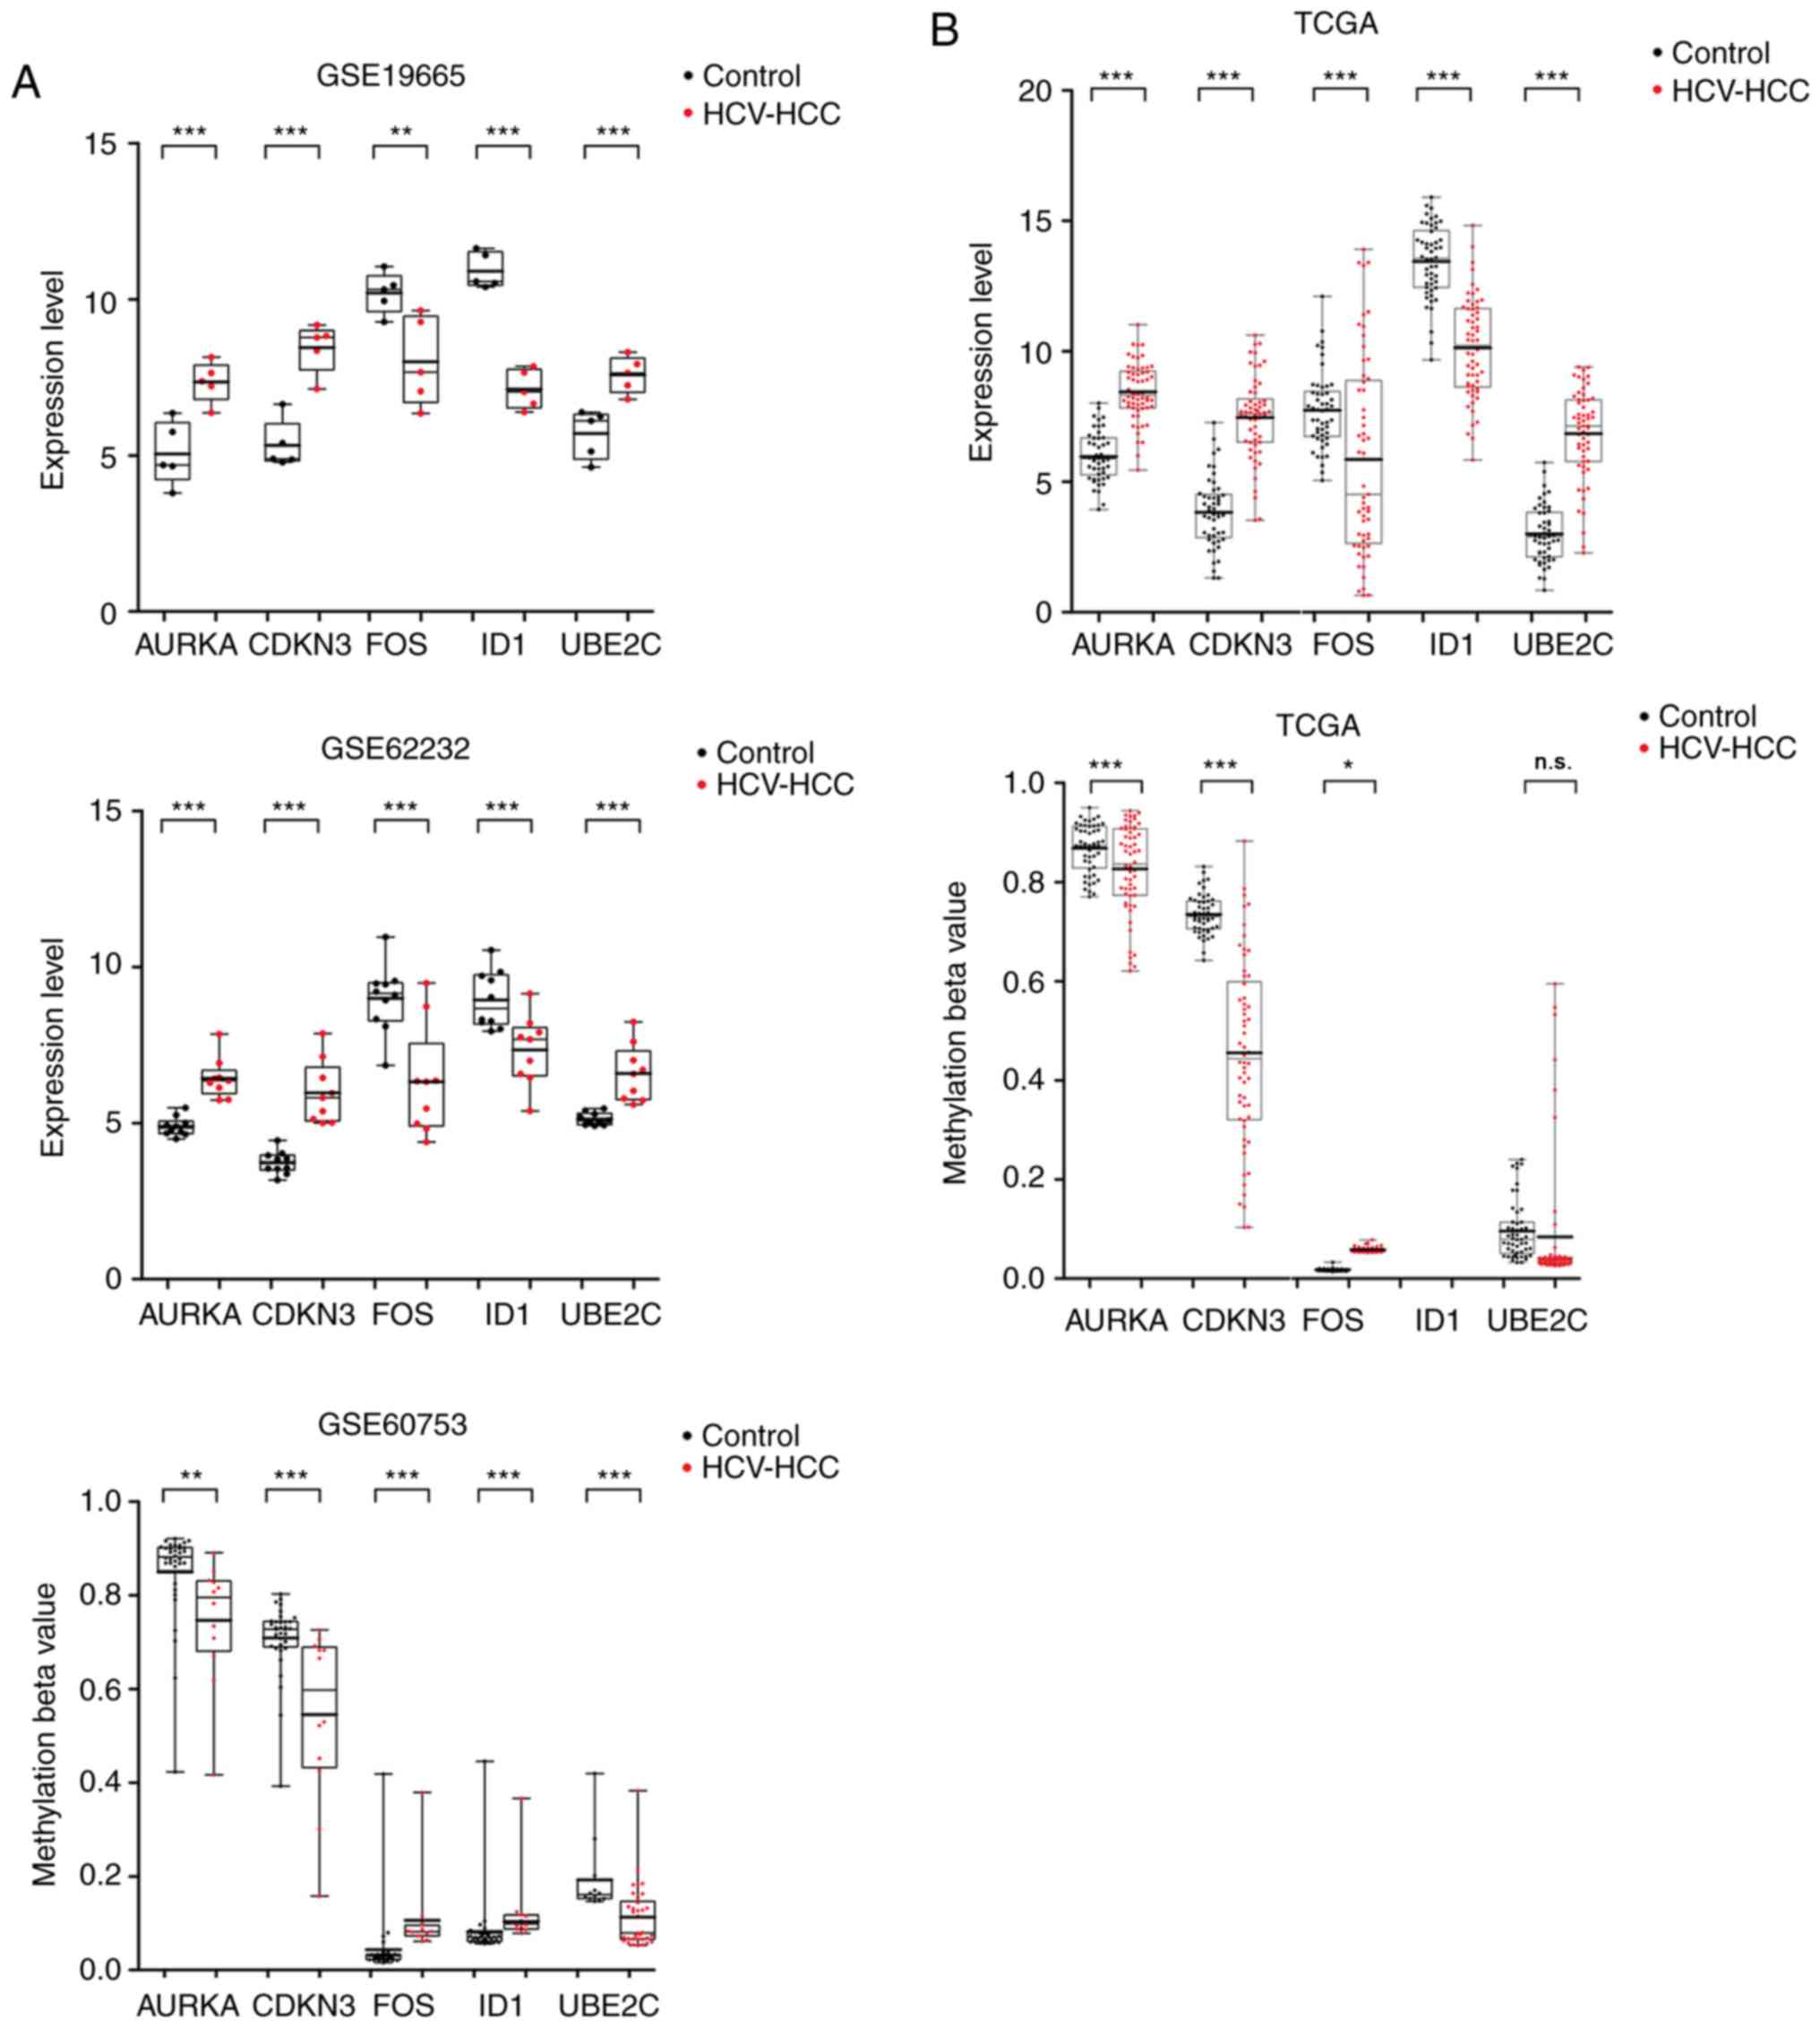 | Figure 6.Validation of the hub genes in the
samples obtained from TCGA database. (A) Gene expression and
methylation levels in samples of microarray datasets GSE19665
(HCV-positive HCC tissues, n=5; normal controls, n=5), GSE62232
(HCV-positive HCC tissues, n=9; normal controls, n=10) and GSE60753
(HCV-positive HCC tissues, n=29; normal controls, n=34). (B) Gene
expression and methylation levels in TCGA data (HCV-positive HCC
tissues, n=58; normal controls, n=50). Student's independent t-test
was used to analyze the differences between HCV-positive HCC and
normal controls. *P<0.05, **P<0.01 and ***P<0.001 vs.
control. AURKA, aurora kinase A; CDKN3, and cyclin-dependent kinase
inhibitor 3; FOS, Fos proto-oncogene, AP-1 transcription factor
subunit; HCC, hepatocellular carcinoma; HCV, hepatitis C virus;
ID1, inhibitor of DNA binding 1, HLH protein; UBE2C, ubiquitin
conjugating enzyme E2 C; n.s., not significant; TCGA, The Cancer
Genome Atlas. |
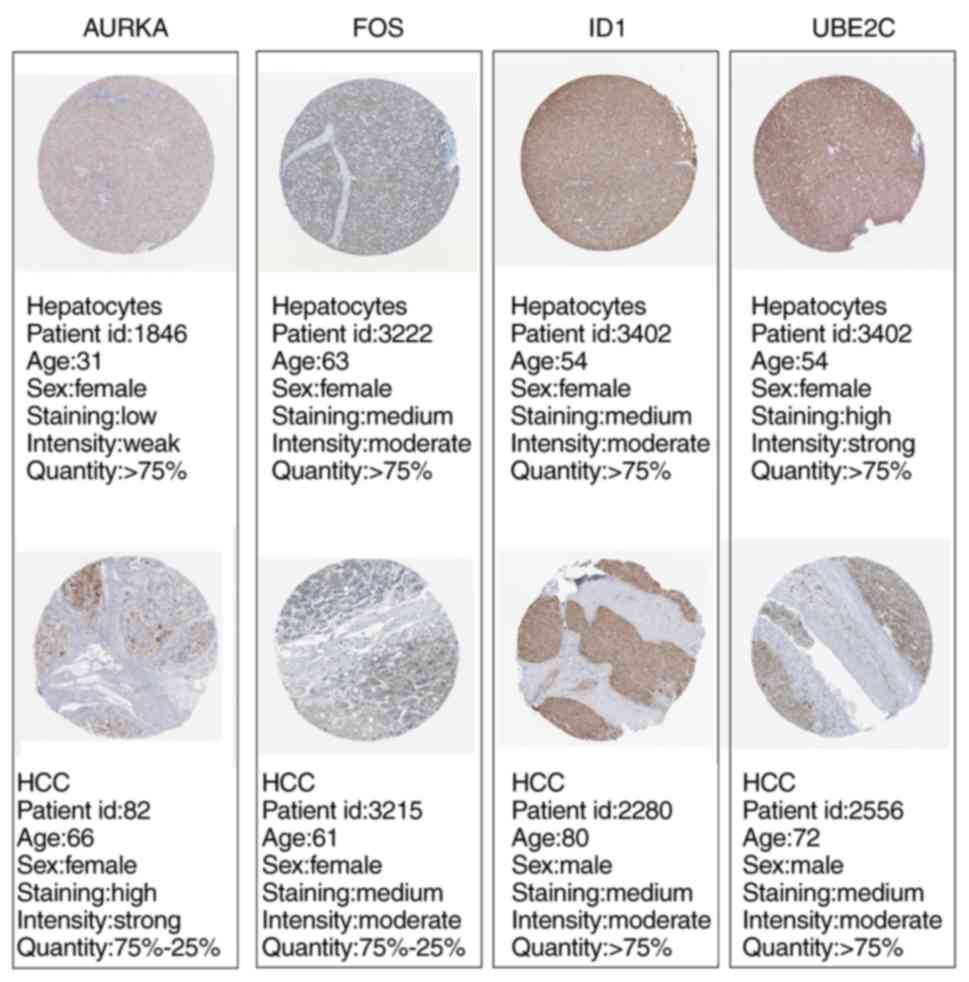
In addition, the HPA database was used to confirm
the protein expression level of the genes in HCC by
immunohistochemistry. Protein expression levels of AURKA in HCC
tissues were higher, whereas protein expression levels of FOS in
HCC tissues were lower compared with normal hepatocytes (Fig. 7). There was no immunohistochemical
result for CDKN3 in the HPA database and no difference was observed
in UBE2C and ID1 protein expression levels between HCC and normal
control tissues.
Discussion
Through comprehensive analysis and validation,
results from the present study indicated that AURKA and FOS may be
crucial genes involved in HCV-positive HCC by participating in the
cell cycle process and inflammatory response. HCV may upregulate
the expression of AURKA and downregulate FOS by changes in DNA
methylation.
HCV stimulates excessive cell proliferation in
hepatocytes by dysregulating the cell cycle, which induces the
development of HCC (25,26). Several positive cell cycle
regulators (such as cyclin D1, cyclin E and Rb/p105) have been
identified to be upregulated, whereas negative regulators [such as
cyclin-dependent kinase 4 (CDK4), CDK6, p21Cip1, p27Kip1 and
p57Kip2) are downregulated in patients with HCV-positive HCC
compared with patients with chronic hepatitis C with or without
liver cirrhosis (27). AURKA,
which is located on chromosome 20q13.2, encodes a serine/threonine
kinase involved in the assembly and maintenance of the mitotic
spindle (28). Thus, AURKA is
speculated to be a crucial gene for the regulation of cell cycle
and carcinogenesis in several cancer types, including HCC (29). Yang et al demonstrated that
knockdown of AURKA suppressed the growth of ovarian cancer cells by
reducing centrosome amplification, malformation of mitotic
spindles, and chromosome aberration (30). Additionally, restoring the
expression of p21 and pRb attenuated the effects of AURKA silencing
on cell cycle progression (30).
Using RNA microarray and reverse transcriptase-quantitative PCR
analysis, Zhou et al reported that AURKA was significantly
upregulated in human urothelial carcinoma compared with normal
urothelium (31) and demonstrated
that AURKA inhibitor MLN8237 induced cell-cycle arrest, aneuploidy,
mitotic spindle failure and apoptosis in human bladder cancer
cells, which arrested tumor growth (31). Li et al also used the
MLN8237 to demonstrate that AURKA regulated cell cycle in breast
cancer cells by modulating the p53/p21/cell division control
2/cyclin B1 pathway (32).
Similarly, the verification experiments demonstrated that AURKA
inhibitor alisertib arrested HCC cells in G2/M phase and induced an
accumulation of aneuploidy by regulating the expression of key cell
cycle regulators such as cyclin B1 (33,34).
The present study demonstrated that AURKA was highly expressed at
the mRNA and protein levels in HCV-positive HCC. In addition to the
cell cycle, a recent study has suggested that AURKA contributes to
tumor migration, invasion, epithelial mesenchymal transition and
cancer stem cell behaviors, which also have been preliminarily
validated in HCC (35), but not
HCV-related HCC. Thus, further investigation of the roles of AURKA
in HCV-related HCC remains necessary.
DNA methylation is an important mechanism for
regulating gene expression epigenetically. Hypermethylation of
genes is associated with reduced expression, whereas
hypomethylation is associated with increased expression. Thus, high
expression of AURKA in HCV-positive HCC was predicted to be due to
hypomethylation, which was validated by the microarray and TCGA
data. This conclusion agreed with a previous study on esophageal
cancer, in which AURKA methylation and human papillomavirus
infection was higher in precancer, esophagitis and normal tissues
compared with cancer tissues (36). However, further experiments are
needed to confirm the effects of HCV on the methylation of AURKA
and the development of HCC.
FOS is a member of the fos family of transcription
factors, which has been extensively demonstrated to be a
pro-oncogenic gene and promote proliferation, invasion and
metastasis of cancer through AP-1-related mechanisms, including
HCV-positive HCC (37). However,
in the present study, FOS was downregulated and hypermethylated.
This may indicate that FOS may be a dual-function gene, which has
been identified in other cancers, such as ovarian cancer (38) and pancreatic cancer (39). Alternatively, the results may be
negative due to the small sample size. Further studies with larger
sample sizes are needed to confirm role of FOS in HCV-positive
HCC.
There were certain limitations to the present study.
First, although the known microarray and TCGA sequencing data were
included to confirm the expression and methylation levels of
crucial genes, the sample size associated with HCV-positive HCC was
small. Therefore, more clinical samples need to be collected to
further confirm their expression levels. Second, although the
present study has suggested that the expression levels of AURKA and
FOS may be regulated by methylation, additional in vitro and
in vivo experiments using a methylation inhibitor, such as
5-azacytidine, are essential to verify these results. Third, HCV
infection-related in vitro and in vivo experiments
(accompanied with overexpression or knockdown of genes) are also
needed to demonstrate the functional roles of AURKA and FOS in cell
proliferation, apoptosis, migration and invasion.
The results of the present study preliminarily
indicate that aberrantly methylated AURKA and FOS may be potential
therapeutic targets for treatment of HCV-positive HCC.
Acknowledgements
Not applicable.
Funding
No funding was received.
Availability of data and materials
The sequencing datasets GSE19665 (https://www.ncbi.nlm.nih.gov/geo/query/acc.cgi?acc=GSE19665),
GSE62232 (https://www.ncbi.nlm.nih.gov/geo/query/acc.cgi?acc=GSE62232)
and GSE60753 (https://www.ncbi.nlm.nih.gov/geo/query/acc.cgi?acc=GSE60753)
were downloaded from the GEO database in NCBI. The mRNA and
microRNA sequencing data were obtained from The Cancer Genome Atlas
(https://tcga-data.nci.nih.gov).
Authors' contributions
ZM and XH conceived and designed the study; YL and
ZH performed the acquisition of data; ZM and YL conducted the
statistical analysis. WL and ZH were involved in the interpretation
of the data. ZM drafted the manuscript. XH revised the manuscript.
all authors read and approved the final manuscript.
Ethics approval and consent to
participate
Not applicable.
Patient consent for publication
Not applicable.
Competing interests
The authors declare that they have no competing
interests.
References
|
1
|
Siegel RL, Miller KD and Jemal A: Cancer
statistics, 2018. CA Cancer J Clin. 68:7–30. 2018. View Article : Google Scholar : PubMed/NCBI
|
|
2
|
Jing L, Huang L, Yan J, Qiu M and Yan Y:
Liver resection for hepatocellular carcinoma: Personal experiences
in a series of 1330 consecutive cases in China. ANZ J Surg.
88:E713–E717. 2018. View Article : Google Scholar : PubMed/NCBI
|
|
3
|
Petruzziello A: Epidemiology of Hepatitis
B Virus (HBV) and Hepatitis C Virus (HCV) related hepatocellular
carcinoma. Open Virol J. 12:26–32. 2018. View Article : Google Scholar : PubMed/NCBI
|
|
4
|
Moore MS, Bocour A, Tran OC, Qiao B,
Schymura MJ, Laraque F and Winters A: Effect of hepatocellular
carcinoma on mortality among individuals with Hepatitis B or
Hepatitis C infection in New York City, 2001–2012. Open Forum
Infect Dis. 5:ofy1442018. View Article : Google Scholar : PubMed/NCBI
|
|
5
|
Kiran M, Chawla YK and Kaur J: Methylation
profiling of tumor suppressor genes and oncogenes in hepatitis
virus-related hepatocellular carcinoma in northern India. Cancer
Genet Cytogenet. 195:112–119. 2009. View Article : Google Scholar : PubMed/NCBI
|
|
6
|
Zekri AR, Bahnasy AA, Shoeab FE, Mohamed
WS, El-Dahshan DH, Ali FT, Sabry GM, Dasgupta N and Daoud SS:
Methylation of multiple genes in hepatitis C virus associated
hepatocellular carcinoma. J Adv Res. 5:27–40. 2014. View Article : Google Scholar : PubMed/NCBI
|
|
7
|
Ramadan RA, Zaki MA, Awad AM and El-Ghalid
LA: Aberrant methylation of promoter region of SPINT2/HAI-2 gene:
An epigenetic mechanism in hepatitis C virus-induced
hepatocarcinogenesis. Genet Test Mol Biomarkers. 19:399–404. 2015.
View Article : Google Scholar : PubMed/NCBI
|
|
8
|
Takagi K, Fujiwara K, Takayama T, Mamiya
T, Soma M and Nagase H: DNA hypermethylation of zygote arrest 1
(ZAR1) in hepatitis C virus positive related hepatocellular
carcinoma. Springerplus. 2:1502013. View Article : Google Scholar : PubMed/NCBI
|
|
9
|
Tsunedomi R, Iizuka N, Yoshimura K, Iida
M, Tsutsui M, Hashimoto N, Kanekiyo S, Sakamoto K, Tamesa T and Oka
M: ABCB6 mRNA and DNA methylation levels serve as useful biomarkers
for prediction of early intrahepatic recurrence of hepatitis C
virus-related hepatocellular carcinoma. Int J Oncol. 42:1551–1559.
2013. View Article : Google Scholar : PubMed/NCBI
|
|
10
|
Mileo AM, Mattarocci S, Matarrese P,
Anticoli S, Abbruzzese C, Catone S, Sacco R, Paggi MG and Ruggieri
A: Hepatitis C virus core protein modulates pRb2/p130 expression in
human hepatocellular carcinoma cell lines through promoter
methylation. J Exp Clin Cancer Res. 34:1402015. View Article : Google Scholar : PubMed/NCBI
|
|
11
|
Quan H, Zhou F, Nie D, Chen Q, Cai X, Shan
X, Zhou Z, Chen K, Huang A, Li S and Tang N: Hepatitis C virus core
protein epigenetically silences SFRP1 and enhances HCC
aggressiveness by inducing epithelial-mesenchymal transition.
Oncogene. 33:2826–2835. 2014. View Article : Google Scholar : PubMed/NCBI
|
|
12
|
Deng YB, Nagae G, Midorikawa Y, Yagi K,
Tsutsumi S, Yamamoto S, Hasegawa K, Kokudo N, Aburatani H and
Kaneda A: Identification of genes preferentially methylated in
hepatitis C virus-related hepatocellular carcinoma. Cancer Sci.
101:1501–1510. 2010. View Article : Google Scholar : PubMed/NCBI
|
|
13
|
Yang Y, Chen L, Gu J, Zhang H, Yuan J,
Lian Q, Lv G, Wang S, Wu Y, Yang YC, et al: Recurrently deregulated
lncRNAs in hepatocellular carcinoma. Nat Commun. 8:144212017.
View Article : Google Scholar : PubMed/NCBI
|
|
14
|
Hlady RA, Tiedemann RL, Puszyk W, Zendejas
I, Roberts LR, Choi JH, Liu C and Robertson KD: Epigenetic
signatures of alcohol abuse and hepatitis infection during human
hepatocarcinogenesis. Oncotarget. 5:9425–9443. 2014. View Article : Google Scholar : PubMed/NCBI
|
|
15
|
Ritchie ME, Phipson B, Wu D, Hu Y, Law CW,
Shi W and Smyth GK: Limma powers differential expression analyses
for RNA-sequencing and microarray studies. Nucleic Acids Res.
43:e472015. View Article : Google Scholar : PubMed/NCBI
|
|
16
|
Szekely GJ and Rizzo ML: Hierarchical
clustering via Joint between-within distances: Extending Ward's
minimum variance method. J Classification. 22:151–183. 2005.
View Article : Google Scholar
|
|
17
|
Liu Y, Sun J and Zhao M: ONGene: A
literature-based database for human oncogenes. J Genet Genomics.
44:119–121. 2017. View Article : Google Scholar : PubMed/NCBI
|
|
18
|
Szklarczyk D, Franceschini A, Wyder S,
Forslund K, Heller D, Huerta-Cepas J, Simonovic M, Roth A, Santos
A, Tsafou KP, et al: STRING v10: Protein-protein interaction
networks, integrated over the tree of life. Nucleic Acids Res 43
(Database Issue). D447–D452. 2015. View Article : Google Scholar
|
|
19
|
Kohl M, Wiese S and Warscheid B:
Cytoscape: Software for visualization and analysis of biological
networks. Methods Mol Biol. 696:291–303. 2011. View Article : Google Scholar : PubMed/NCBI
|
|
20
|
Tang Y, Li M, Wang J, Pan Y and Wu FX:
CytoNCA: A cytoscape plugin for centrality analysis and evaluation
of protein interaction networks. Biosystems. 127:67–72. 2015.
View Article : Google Scholar : PubMed/NCBI
|
|
21
|
Bader GD and Hogue CW: An automated method
for finding molecular complexes in large protein interaction
networks. BMC Bioinformatics. 4:22003. View Article : Google Scholar : PubMed/NCBI
|
|
22
|
Huang DW, Sherman BT and Lempicki RA:
Systematic and integrative analysis of large gene lists using DAVID
bioinformatics resources. Nat Protoc. 4:44–57. 2009. View Article : Google Scholar : PubMed/NCBI
|
|
23
|
Maere S, Heymans K and Kuiper M: BiNGO: A
Cytoscape plugin to assess overrepresentation of Gene Ontology
categories in Biological Networks. Bioinformatics. 21:3448–3449.
2005. View Article : Google Scholar : PubMed/NCBI
|
|
24
|
Pontén F, Jirström K and Uhlen M: The
human protein atlas-a tool for pathology. J Pathol. 216:387–393.
2008. View Article : Google Scholar : PubMed/NCBI
|
|
25
|
Irshad M, Gupta P and Irshad K: Molecular
basis of hepatocellular carcinoma induced by hepatitis C virus
infection. World J Hepatol. 9:1305–1314. 2017. View Article : Google Scholar : PubMed/NCBI
|
|
26
|
Moustafa S, Karakasiliotis I and Mavromara
P: Hepatitis C virus core+1/ARF protein modulates Cyclin D1/pRb
pathway and promotes carcinogenesis. J Virol. 92(pii): e02036–17.
2018.PubMed/NCBI
|
|
27
|
Bassiouny AEE, Nosseir MM, Zoheiry MK,
Ameen NA, Abdelhadi AM, Ibrahim IM, Zada S, El-Deen AH and
El-Bassiouni NE: Differential expression of cell cycle regulators
in HCV-infection and related hepatocellular carcinoma. World J
Hepatol. 2:32–41. 2010. View Article : Google Scholar : PubMed/NCBI
|
|
28
|
Kufer TA, Silljé HH, Körner R, Gruss OJ,
Meraldi P and Nigg EA: Human TPX2 is required for targeting
Aurora-A kinase to the spindle. J Cell Biol. 158:617–623. 2002.
View Article : Google Scholar : PubMed/NCBI
|
|
29
|
Benten D, Keller G, Quaas A, Schrader J,
Gontarewicz A, Balabanov S, Braig M, Wege H, Moll J, Lohse AW and
Brummendorf TH: Aurora kinase inhibitor PHA-739358 suppresses
growth of hepatocellular carcinoma in vitro and in a xenograft
mouse model. Neoplasia. 11:934–944. 2009. View Article : Google Scholar : PubMed/NCBI
|
|
30
|
Yang G, Chang B, Yang F, Guo X, Cai KQ,
Xiao X, Wang H, Sen S, Hung MC, Mills GB, et al: Aurora Kinase A
promotes ovarian tumorigenesis through dysregulation of the cell
cycle and suppression of BRCA2. Clin Cancer Res. 16:3171–3181.
2010. View Article : Google Scholar : PubMed/NCBI
|
|
31
|
Zhou N, Singh K, Mir MC, Parker Y, Lindner
D, Dreicer R, Ecsedy JA, Zhang Z, The BT, Almasan A and Hansel DE:
The investigational Aurora kinase A inhibitor MLN8237 induces
defects in cell viability and cell cycle progression in malignant
bladder cancer cells in vitro and in vivo. Clin Cancer Res.
19:1717–1728. 2013. View Article : Google Scholar : PubMed/NCBI
|
|
32
|
Li JP, Yang YX, Liu QL, Pan ST, He ZX,
Zhang X, Yang T, Chen XW, Dong W, Qiu JX and Zhou SF: The
investigational Aurora kinase A inhibitor alisertib (MLN8237)
induces cell cycle G2/M arrest, apoptosis, and autophagy via p38
MAPK and Akt/mTOR signaling pathways in human breast cancer cells.
Drug Des Devel Ther. 9:1627–1652. 2015.PubMed/NCBI
|
|
33
|
Zhu Q, Yu X, Zhou ZW, Zhou C, Chen XW and
Zhou SF: Inhibition of Aurora A Kinase by alisertib induces
autophagy and cell cycle arrest and increases chemosensitivity in
human hepatocellular carcinoma HepG2 cells. Curr Cancer Drug
Targets. 17:386–401. 2017. View Article : Google Scholar : PubMed/NCBI
|
|
34
|
Zhu Q, Yu X, Zhou ZW, Luo M, Zhou C, He
ZX, Chen Y and Zhou SF: A quantitative proteomic response of
hepatocellular carcinoma Hep3B cells to danusertib, a pan-Aurora
kinase inhibitor. J Cancer. 9:2061–2071. 2018. View Article : Google Scholar : PubMed/NCBI
|
|
35
|
Chen C, Song G, Xiang J, Zhang H, Zhao S
and Zhan Y: AURKA promotes cancer metastasis by regulating
epithelial-mesenchymal transition and cancer stem cell properties
in hepatocellular carcinoma. Biochem Biophys Res Commun.
486:514–520. 2017. View Article : Google Scholar : PubMed/NCBI
|
|
36
|
Mohiuddin MK, Chava S, Upendrum P, Latha
M, Zubeda S, Kumar A, Ahuja YR, Hasan Q and Mohan V: Role of Human
papilloma virus infection and altered methylation of specific genes
in esophageal cancer. Asian Pac J Cancer Prev. 14:4187–4193. 2013.
View Article : Google Scholar : PubMed/NCBI
|
|
37
|
Watanabe T, Hiasa Y, Tokumoto Y, Hirooka
M, Abe M, Ikeda Y, Matsuura B, Chung RT and Onji M: Protein Kinase
R modulates c-Fos and c-Jun signaling to promote proliferation of
hepatocellular carcinoma with Hepatitis C virus infection. PLoS
One. 8:e677502013. View Article : Google Scholar : PubMed/NCBI
|
|
38
|
Oliveiraferrer L, Rößler K, Haustein V,
Schröder C, Wicklein D, Maltseva D, Khaustova N, Samatov T,
Tonevitsky A, Mahner S, et al: c-FOS suppresses ovarian cancer
progression by changing adhesion. Br J Cancer. 110:753–763. 2013.
View Article : Google Scholar : PubMed/NCBI
|
|
39
|
Guo JC, Li J, Zhao YP, Zhou L, Cui QC,
Zhou WX, Zhang TP and You L: Expression of c-fos was associated
with clinicopathologic characteristics and prognosis in pancreatic
cancer. PLoS One. 10:e01203322015. View Article : Google Scholar : PubMed/NCBI
|