Introduction
Spinal cord injury (SCI) is a specific type of
damage to the central nervous system, resulting in temporary or
permanent changes in the function of the spinal cord. SCI is
usually associated with traffic accidents (38%) (1), falls (31%) (2) and sports-associated injuries (10–17%)
(3). SCI presents an increasing
social and economic burden through its treatment and rehabilitation
costs (4). Although there are a
number of preclinical and clinical studies investigating this
disease, its underlying molecular mechanism remains unclear.
Characterization of the molecular mechanisms of
neuroplasticity following traumatic SCI may provide insight for the
identification of effective treatments for the disease. Scarisbrick
et al (5) indicated that
kallikrein-6, a member of the kallikrein protease family, affects
neural repair and regeneration in traumatic SCI. Tissue plasminogen
activator promotes endogenous type 4 disintegrin and
metalloproteinase with thrombospondin motifs-induced chondroitin
sulfate proteoglycans degradation, advancing neuroplasticity
subsequent to SCI (6). The
selective inhibition of acid-sensing ion channel 1a provides
morphological and functional neuroprotection following traumatic
SCI (7). In addition, several
studies have indicated that the abnormal expression of microRNAs
(miRNAs) may be associated with SCI progression, and may be
potential targets for the treatment of this disease (8,9).
Despite these previous studies, the molecular mechanisms of
neuroplasticity following traumatic SCI are also unclear.
Using the GSE52763 microarray dataset, Shin et
al (10) identified that a
number of inflammation-associated genes are upregulated in lumbar
spinal cord following traumatic SCI, and treadmill locomotor
training may partly improve locomotor function. Yang et al
(11) described that transforming
growth factor-β-induced factor homeobox 1, Ras-related C3 botulinum
toxin substrate 2, TYRO protein tyrosine kinase binding protein
(TYROBP), and progesterone receptor (PGR) are associated with
traumatic SCI. Liu et al (12) suggested that ATPase
sarcoplasmic/endoplasmic reticulum Ca2+ transporting 1,
Fos Proto-Oncogene, AP-1 transcription factor subunit and glycogen
synthase kinase 3β are involved in treadmill locomotor training in
locomotor recovery. However, the GSE52763 microarray dataset has
not been analyzed using comprehensive bioinformatics methods to
reveal the mechanisms of neuroplasticity following SCI. In the
present study, the GSE52763 microarray dataset was examined with
multiple bioinformatics analyses, including differentially
expressed genes (DEGs) screening, time series analysis, enrichment
analysis, protein-protein interaction (PPI) network analysis and
regulatory network analysis.
Materials and methods
Data source and data
preprocessing
The GSE52763 microarray dataset, which was deposited
by Shin et al (10), was
downloaded from the Gene Expression Omnibus (http://www.ncbi.nlm.nih.gov/geo/) database (13). From GSE52763, 15lumbar spinal cord
samples [3 sham (1 week), 4 injury only (1 week), 4 injury only (3
weeks), 4 injury + treadmill (3 weeks)] were selected.
Fragmentation was assessed with an Agilent 2100 bioanalyzer using
RNA 6000 Nano Chip (Agilent Technologies, Inc., Santa Clara, CA,
USA) and hybridized to the arrays containing >22,500 probe sets.
The sequencing data platform was [Rat230_2] Affymetrix Rat Genome
230 2.0 Array, and the data was downloaded in March 2018. The
microarray dataset was downloaded from a public database;
therefore, ethical approval was not obtained.
Data preprocessing (background correction,
normalization and expression calculation) was performed using a
robust multi-array average method in the affy R package (version
1.38.0; http://bioconductor.org/packages/release/bioc/html/oligo.html)
(14). For single genes mapped to
several probes, the mean value of the probes was used to represent
the unique expression value of this gene.
DEGs analysis
Samples were grouped according to whether injury or
motor rehabilitation was done or not. Empirical Bayes linear
regression model in the limma R package (Version 3.32.5; http://bioconductor.org/packages/release/bioc/html/limma.html)
(15) was used to identify DEGs in
injury only (1 week) vs. sham (1 week) and injury + treadmill (3
weeks) vs. injury only (3 weeks) comparison groups, and the
P-values of all genes were obtained. P<0.05 and |log2
fold change (FC)|>1 were used as the thresholds.
Time series analysis
DEGs in injury vs. sham groups and treadmill vs.
non-treadmill groups were merged and considered DEGs in the
injury/rehabilitation process. Genes that exhibited
increased/decreased expression in the injury groups compared with
the sham group, and decreased/increased expression in the injury +
treadmill group compared with the injury groups were identified as
significantly altered genes (candidate gene sets) following
treadmill rehabilitation training.
The heatmap for the candidate gene set was drawn
using R package pheatmap (16)
(Version 1.0.8; http://cran.r-project.org/web/packages/pheatmap).
Clustering distance was determined by Pearson correlation, and the
clustering method was single-linkage clustering.
Functional and pathway enrichment
analysis
Using the R package clusterProfiler (17) (Version 3.4.4; http://bioconductor.org/packages/release/bioc/html/clusterProfiler.html),
gene ontology (GO)_‘Biological Process’ (BP) (18,19)
and Kyoto Encyclopedia of Genes and Genomes (KEGG) (20) pathway enrichment analyses were
performed for the two groups of candidate genes. P<0.05 was
selected as the threshold.
PPI network analysis
PPI analysis for candidate DEGs was performed by
STRING database (21) (Version
10.0; http://www.string-db.org/). The network
was visualized by Cytoscape software (22) (Version 3.4.0; http://www.cytoscape.org/). CytoNCA plug-in (23) (Version 2.1.6; http://apps.cytoscape.org/apps/cytonca)
was used to analyze the network topology properties of nodes. The
degree of each node was calculated and nodes with the highest
degrees were determined as significant nodes (hub proteins) in the
PPI network (24).
Construction of regulatory
network
Based on WebGestalt (25) (http://www.webgestalt.org/) tool, Over-representation
Enrichment Analysis was performed to predict miRNA-target and
transcription factor (TF)-target pairs for candidate DEGs.
P<0.05 was selected as the threshold. The TF-miRNA-target loops
were obtained by integrating the results of miRNA-target and
TF-target predictions. The TF-miRNA-target network was constructed
using Cytoscape software as aforementioned (21). In addition, key network nodes were
obtained by performing network topology property analysis.
Results
DEGs analysis
The microarray dataset included 31,099 probes, and
the expression values of 14,404 genes were obtained following gene
annotation. Subsequent to pre-processing, 159 (96 upregulated and
63 downregulated) DEGs and 105 (14 upregulated and 91
downregulated) DEGs were obtained in the injury vs. sham groups and
treadmill vs. non-treadmill groups, respectively. The union of
these gene sets included 242 genes.
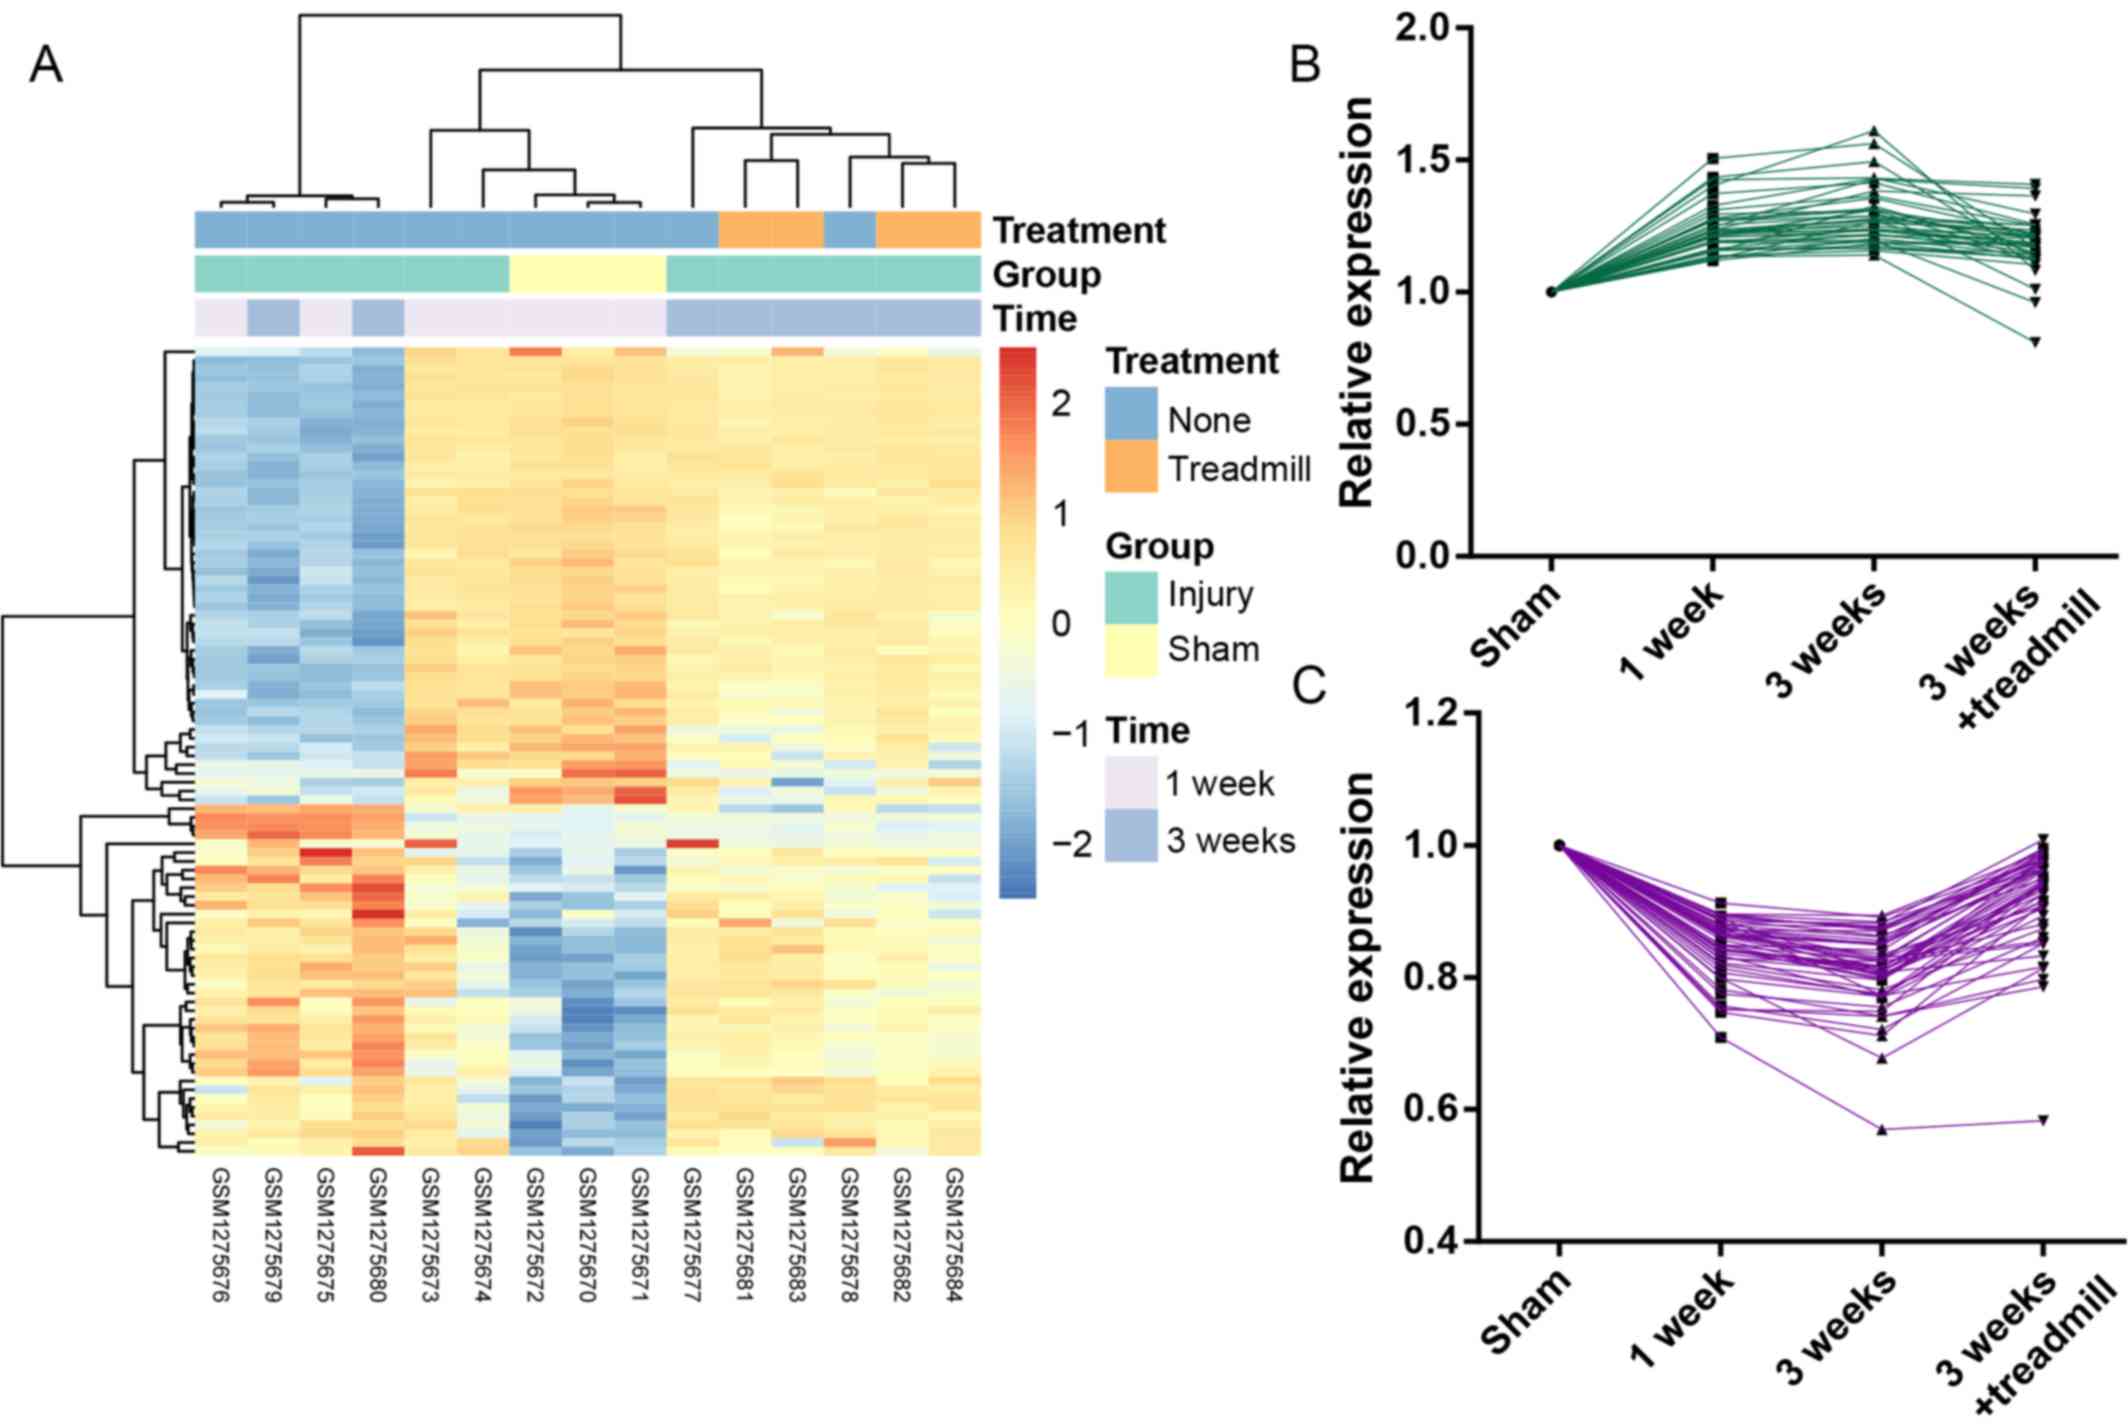
Time series analysis
A total of 40 genes in cluster 1 presented
upregulated expression in the injury (1 week/3 weeks) groups
compared with the sham group, and subsequent downregulation in the
injury + treadmill group compared with the injury only groups.
Conversely, a total of 52 genes in cluster 2 exhibited opposing
expression profiles (downregulation following injury and subsequent
upregulation following treadmill rehabilitation). The heatmap and
line charts of these genes are presented in Fig. 1.
Functional and pathway enrichment
analysis
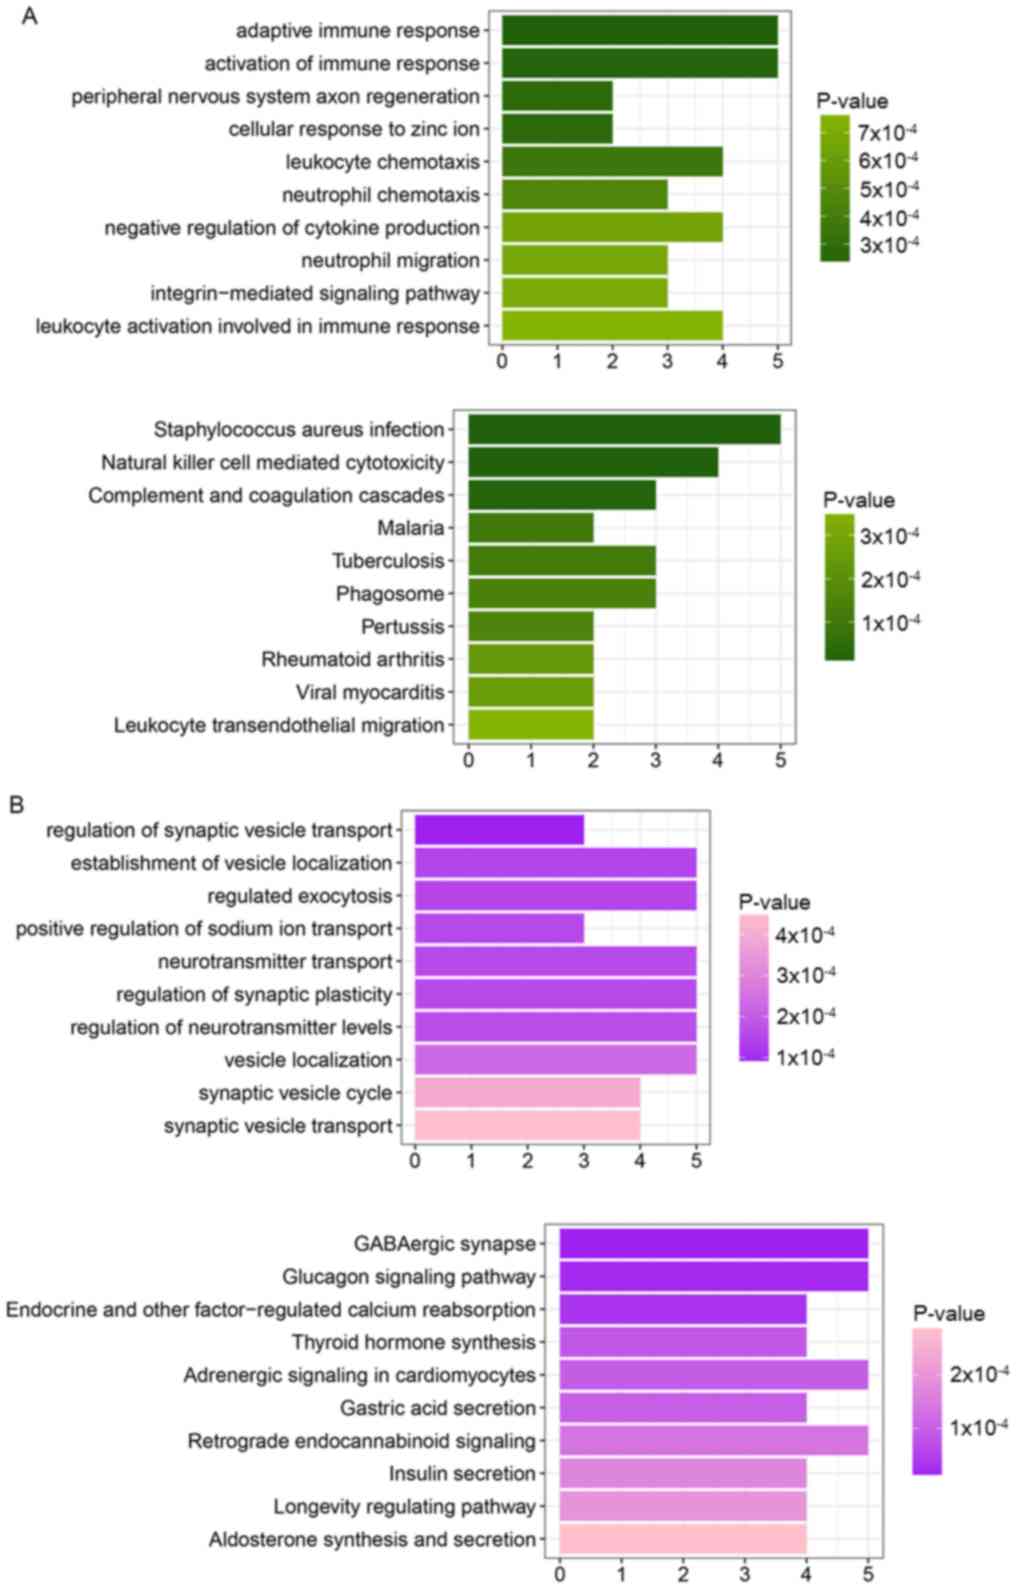
The genes in cluster 1 were significantly enriched
in certain GO_BP processes, including adaptive immune response,
activation of immune response, peripheral nervous system axon
regeneration and leukocyte chemotaxis (Table I), and specific pathways including
Staphylococcus aureus infection, natural killer cell
mediated cytotoxicity, and complement and coagulation cascades
(Fig. 2A).
 | Table I.Top 10 significantly enriched
GO-‘Biological Process’ terms for clusters 1 and 2 for
differentially expressed genes. |
Table I.
Top 10 significantly enriched
GO-‘Biological Process’ terms for clusters 1 and 2 for
differentially expressed genes.
| Terms | Description | Gene symbol | Count | P-value |
|---|
| Cluster 1 |
|
|
|
|
|
GO:0002250 | Adaptive immune
response | ADGRE1, C1QA, CD48,
FCGR2B, RSAD2 | 5 |
2.05×10⁻⁴ |
|
GO:0002253 | Activation of
immune response | C1QA, CFH, CLEC7A,
LGALS3, RSAD2 | 5 |
2.33×10⁻⁴ |
|
GO:0014012 | Peripheral nervous
system axon regeneration | TNC, TSPO | 2 |
2.61×10⁻⁴ |
|
GO:0071294 | Cellular response
to zinc ion | MT2A, TSPO | 2 |
2.61×10⁻⁴ |
|
GO:0030595 | Leukocyte
chemotaxis | CXCL13, ITGB2,
LGALS3, PF4 | 4 |
3.52×10⁻⁴ |
|
GO:0030593 | Neutrophil
chemotaxis | ITGB2, LGALS3,
PF4 | 3 |
4.58×10⁻⁴ |
|
GO:0001818 | Negative regulation
of cytokine production | CIDEA, FCGR2B,
SUZ12, TSPO | 4 |
6.61×10⁻⁴ |
|
GO:1990266 | Neutrophil
migration | ITGB2, LGALS3,
PF4 | 3 |
6.87×10⁻⁴ |
|
GO:0007229 | Integrin-mediated
signaling pathway | ITGAL, ITGB2,
TYROBP | 3 |
7.09×10⁻⁴ |
|
GO:0002366 | Leukocyte
activation involved in immune response | CLEC7A, ITGAL,
LGALS3, TYROBP | 4 |
7.70×10⁻⁴ |
| Cluster 2 |
|
|
|
|
|
GO:1902803 | Regulation of
synaptic vesicle transport | RIMS1, STXBP1,
SYT11 | 3 |
8.54×10⁻⁵ |
|
GO:0051650 | Establishment of
vesicle localization | RASGRP1, RIMS1,
SH3GL2, STXBP1, SYT11 | 5 |
1.44×10⁻⁴ |
|
GO:0045055 | Regulated
exocytosis | PI4K2A, RASGRP1,
RIMS1, STXBP1, SYT11 | 5 |
1.47×10⁻⁴ |
|
GO:0010765 | Positive regulation
of sodium ion transport | AHCYL1, ATP1B2,
CNTN1 | 3 |
1.55×10⁻⁴ |
|
GO:0006836 | Neurotransmitter
transport | KCNJ10, RIMS1,
SLC6A11, STXBP1, SYT11 | 5 |
1.59×10⁻⁴ |
|
GO:0048167 | Regulation of
synaptic plasticity | CAMK2N2, KCNJ10,
MAP−1B, RIMS1, STXBP1 | 5 |
1.59×10⁻⁴ |
|
GO:0001505 | Regulation of
neurotransmitter levels | GAD2, KCNJ10,
RIMS1, STXBP1, SYT11 | 5 |
1.67×10⁻⁴ |
|
GO:0051648 | Vesicle
localization | RASGRP1, RIMS1,
SH3GL2, STXBP1, SYT11 | 5 |
2.31×10⁻⁴ |
|
GO:0099504 | Synaptic vesicle
cycle | RIMS1, SH3GL2,
STXBP1, SYT11 | 4 |
3.93×10⁻⁴ |
|
GO:0048489 | Synaptic vesicle
transport | RIMS1, SH3GL2,
STXBP1, SYT11 | 4 |
4.54×10⁻⁴ |
Genes in cluster 2 were significantly enriched in
several GO_BP processes, including regulation of synaptic vesicle
transport, establishment of vesicle localization, regulated
exocytosis and positive regulation of sodium ion transport
(Table I), and certain pathways
including GABAergic synapse, glucagon signaling pathway, and
endocrine and other factor-regulated calcium reabsorption (Fig. 2B).
These results suggested that the majority of the
genes in cluster 1 were associated with immune response, and the
genes in cluster 2 were associated with signal transduction.
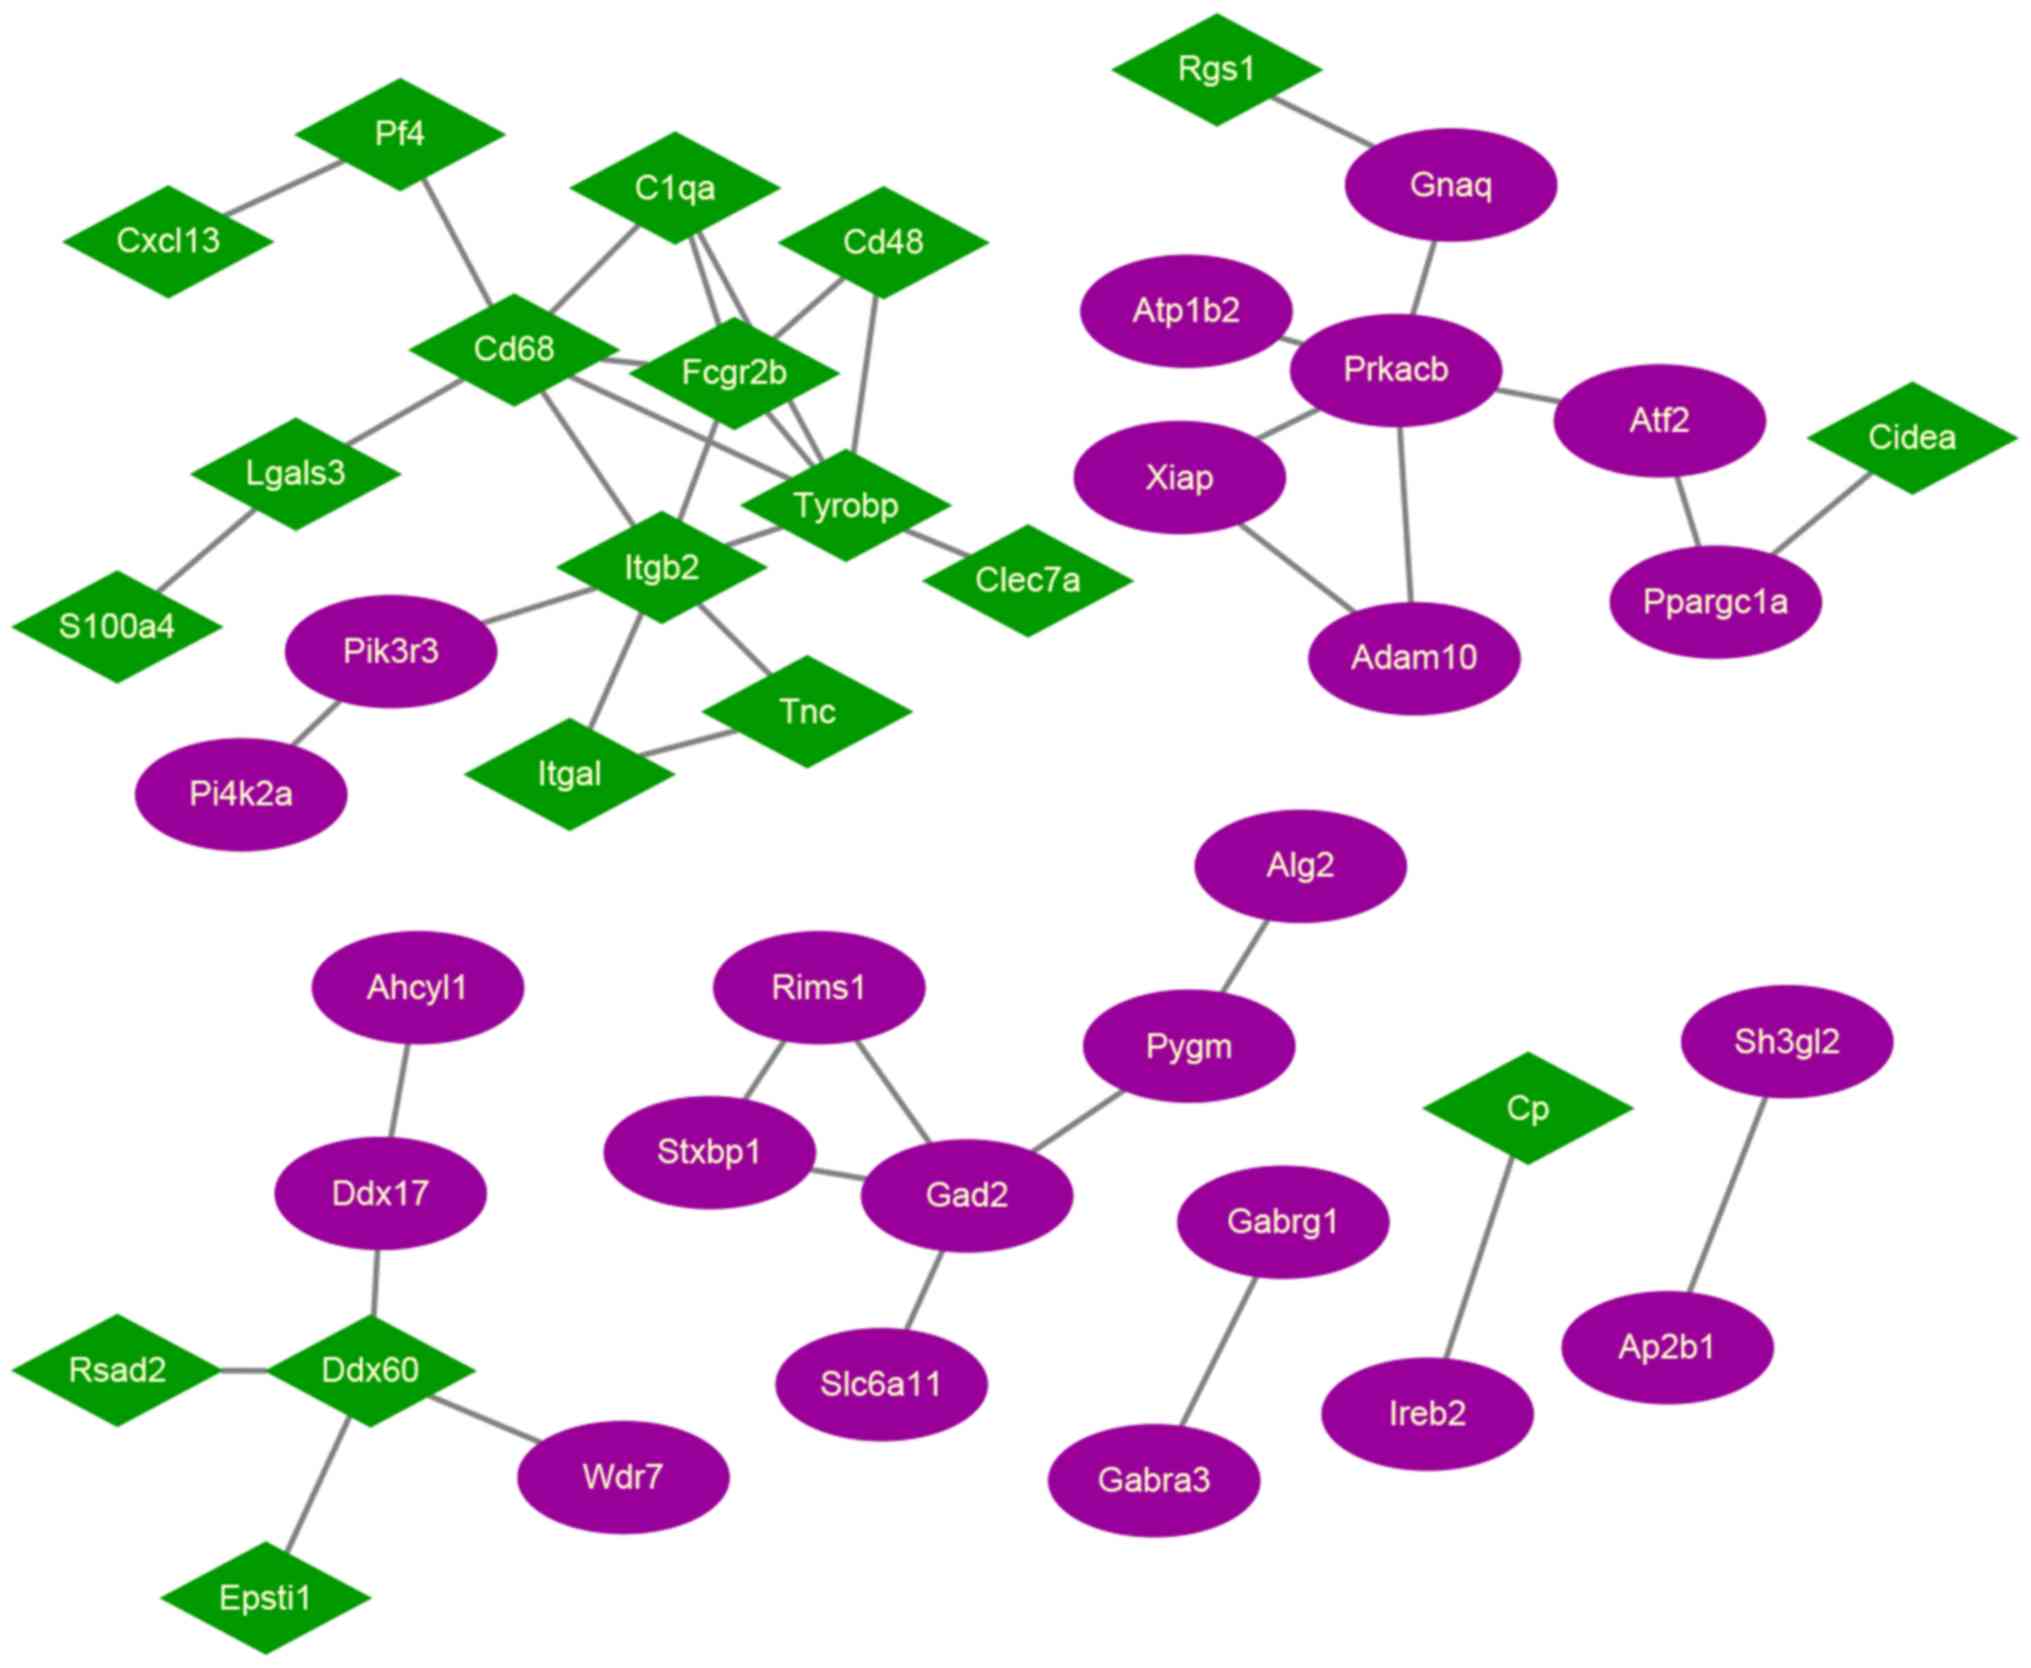
PPI network analysis
The PPI network for candidate DEGs was built, which
included a total of 42 nodes and 44 edges (Fig. 3). Among these network nodes, 19
belonged to cluster 1, and 23 belonged to cluster 2. The 3 nodes
with the highest degrees were TYROBP (degree=6), CD68 (degree=6),
and integrin subunit beta 2 (degree=6), suggesting that these may
be hub proteins in this PPI network.
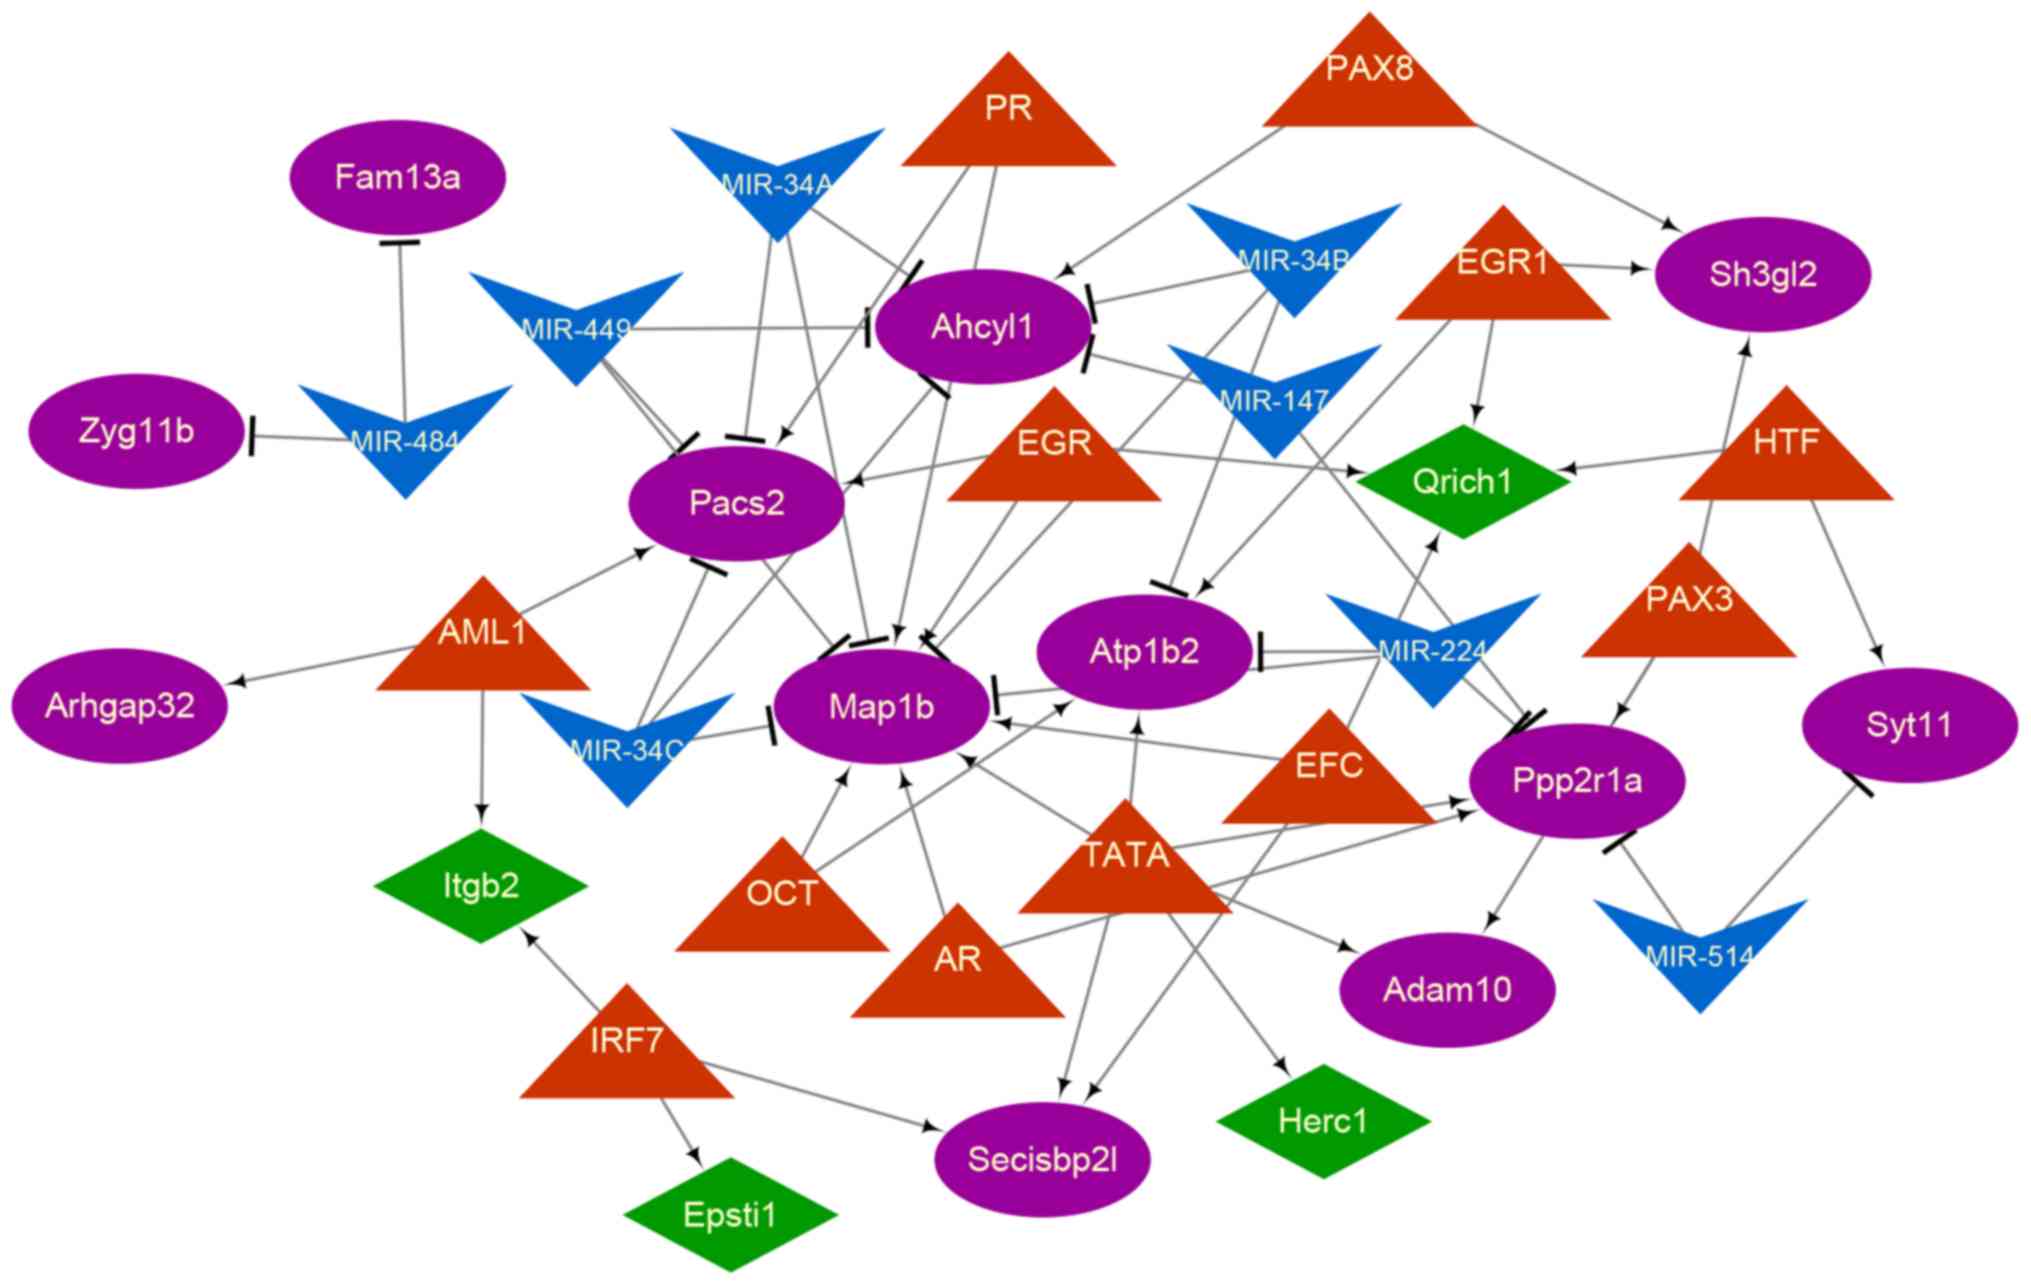
Construction of regulatory
network
A total of 7 miRNAs and 12 TFs were included in the
TF-miRNA-target network (Fig. 4).
There were 21 miRNA-mRNA and 34 TF-mRNA regulatory pairs in the
regulatory network. The results of the topological property
analysis demonstrated that microtubule associated protein 1B
(MAP-1B; degree=11), phosphofurin acidic cluster sorting
protein 2 (PACS-2; degree=6), adenosylhomocysteinase-like 1
(AHCYL1; degree=6) and protein phosphatase 2 scaffold
subunit alpha (PPP2R1A; degree=6) were regulated by more
miRNAs and TFs in comparison with other genes in the regulatory
network. PGR, early growth responsive, androgen receptor and
tyrosine aminotransferase regulated several of these 4 genes.
Discussion
In the present study, 159 (96 upregulated and 63
downregulated) DEGs and 105 (14 upregulated and 91 downregulated)
DEGs were obtained in the injury vs. sham groups and treadmill vs.
non-treadmill groups, respectively. Additionally, 40 genes in
cluster 1 were upregulated in the injury (1 week/3 weeks) groups
compared with the sham group, and downregulated in the injury +
treadmill group compared with the injury only groups. In cluster 2,
52 genes were downregulated in the injury (1 week/3 weeks) groups
compared with the sham group, and subsequently upregulated in the
injury + treadmill group compared with the injury only groups. The
results from the enrichment analysis suggested that genes in
clusters 1 and 2 were enriched in immune response and signal
transduction, respectively. In addition, a PPI network was built
for the candidate DEGs, which involved 19 genes in cluster 1 and 23
genes in cluster 2. In addition, MAP-1B, PACS-2, and
AHCYL1 exhibited higher degrees in the regulatory network,
and were regulated by miRNAs including miR-34A, miR-34B, miR-34C
and miR-449.
MAP-1B has been demonstrated to serve roles
in the progression of the nervous system (26). Ma et al (27) also indicated that the differential
regulation of MAP-1B is important for development of the
central nervous system. MAP-1B is involved in neuronal
migration, neuronal differentiation and axonal regeneration
(28), and is required for the
development of the dendritic spine and maturation of synapses
(29). Therefore, MAP-1B
may be involved in the development of the pathogenesis of traumatic
SCI by affecting synaptic maturation and dendritic spine
development, and additionally affecting neuronal migration,
neuronal differentiation and axonal regeneration.
Furthermore, Köttgen et al (30) suggested that the PACS proteins may
be associated with ion channel trafficking. Ion channel blockers
may have potential roles in SCI progression (31). Kawaai et al (32) hypothesized that AHCYL1, also
known as IP(3)Rs binding protein released with IP(3) 2 (IRBIT2),
contributed to neuronal function and interacted with synaptic
molecules, and demonstrated that mice lacking IRBIT2 exhibited an
increased locomotor activity. Therefore, PACS-2 and
AHCYL1 may be associated with traumatic SCI.
In the non-proliferative stage, the upregulated
expression of the miR-34 family is involved in maintaining mature
neurons, and miR-34A serves a significant role in neuronal
differentiation through arresting cells in G1 phase (33). Aranha et al (34) indicated that miR-34A regulated
neural stem cell differentiation in mice. Rokavec et al
(35) suggested that the miR-34
family served an important function in neuronal development.
Therefore, miR-34A/B/C may be essential in the progression of
traumatic SCI by affecting neuronal development.
Zhu et al (36) revealed that electro-acupuncture
promoted neural stem cells proliferation and neuron survival via
downregulation of miR-449a in rats with SCI. Furthermore, miR-449a
is involved in the regulation of autophagy (37), which serves a role in SCI (38). Administration of rosiglitazone may
decrease autophagy and promote recovery in experimental traumatic
SCI (39). Therefore, miR-449 may
be involved in traumatic SCI development. In the present study,
MAP-1B, PACS-2 and AHCYL1 exhibited the highest
degrees and were regulated by miRNAs including miR-34A, miR-34B,
miR-34C and miR-449 in the regulatory network. In light of the
aforementioned data, we hypothesized that miR-34A/B/C and miR-449
served roles in the development of traumatic SCI, partly by
targeting MAP-1B, PACS-2 and AHCYL1.
The present study explored the mechanisms of
neuroplasticity following SCI using comprehensive bioinformatics
methods. However, only the genes of rat samples were analyzed, and
therefore the genes and results described do not directly apply to
humans. Additionally, the lack of in vivo and in
vitro experiments was also a major limitation in the present
study. Therefore, additional verification analyses are required to
confirm the results obtained.
In conclusion, MAP-1B, PACS-2 and
AHCYL1 are key genes for the development of traumatic SCI.
Furthermore, MAP-1B, PACS-2 and AHCYL1 were regulated
by miR-34A/B/C and miR-449 in the progression of traumatic SCI.
These data improve the current understanding of the mechanisms of
neuroplasticity following traumatic SCI, and may provide promising
therapeutic targets for the disease.
Acknowledgements
Not applicable.
Funding
No funding was received.
Availability of data and materials
All data generated or analyzed during this study are
included in this published article.
Authors' contributions
HC and YZ were responsible for the conception and
design of the research, and drafting the manuscript. ZC performed
the data acquisition. BZ performed the data analysis and
interpretation. HW and LA participated in the design of the study
and performed the statistical analysis. All authors have read and
approved the manuscript.
Ethics approval and consent to
participate
Not applicable.
Patient consent for publication
Not applicable.
Competing interests
The authors declare that they have no competing
interests.
References
|
1
|
Chen Y, He Y and DeVivo MJ: Changing
demographics and injury profile of new traumatic spinal cord
injuries in the United States, 1972–2014. Arch Phys Med Rehabil.
97:1610–1619. 2016. View Article : Google Scholar : PubMed/NCBI
|
|
2
|
Lenehan B, Street J, Kwon BK, Noonan V,
Zhang H, Fisher CG and Dvorak MF: The epidemiology of traumatic
spinal cord injury in British Columbia, Canada. Spine (Phila Pa
1976). 37:321–329. 2012. View Article : Google Scholar : PubMed/NCBI
|
|
3
|
DeVivo MJ and Chen Y: Trends in new
injuries, prevalent cases, and aging with spinal cord injury. Arch
Phys Med Rehabil. 92:332–338. 2011. View Article : Google Scholar : PubMed/NCBI
|
|
4
|
Hurlbert RJ, Hadley MN, Walters BC, Aarabi
B, Dhall SS, Gelb DE, Rozzelle CJ, Ryken TC and Theodore N:
Pharmacological therapy for acute spinal cord injury. Neurosurgery.
76 (Suppl 1):S71–S83. 2015. View Article : Google Scholar : PubMed/NCBI
|
|
5
|
Scarisbrick IA, Sabharwal P, Cruz H,
Larsen N, Vandell AG, Blaber SI, Ameenuddin S, Papke LM, Fehlings
MG, Reeves RK, et al: Dynamic role of kallikrein 6 in traumatic
spinal cord injury. Eur J Neurosci. 24:1457–1469. 2010. View Article : Google Scholar
|
|
6
|
Lemarchant S, Pruvost M, Hébert M,
Gauberti M, Hommet Y, Briens A, Maubert E, Gueye Y, Féron F, Petite
D, et al: tPA promotes ADAMTS-4-induced CSPG degradation, thereby
enhancing neuroplasticity following spinal cord injury. Neurobiol
Dis. 66:28–42. 2014. View Article : Google Scholar : PubMed/NCBI
|
|
7
|
Koehn LM, Noor NM, Dong Q, Er SY, Rash LD,
King GF, Dziegielewska KM, Saunders NR and Habgood MD: Selective
inhibition of ASIC1a confers functional and morphological
neuroprotection following traumatic spinal cord injury. Version 2.
F1000Res. 5:18222016. View Article : Google Scholar : PubMed/NCBI
|
|
8
|
Liu NK, Wang XF, Lu QB and Xu XM: Altered
microRNA expression following traumatic spinal cord injury. Exp
Neurol. 219:424–429. 2009. View Article : Google Scholar : PubMed/NCBI
|
|
9
|
Ning B, Gao L, Liu RH, Liu Y, Zhang NS and
Chen ZY: microRNAs in spinal cord injury: Potential roles and
therapeutic implications. Int J Biol Sci. 10:997–1006. 2014.
View Article : Google Scholar : PubMed/NCBI
|
|
10
|
Shin HY, Kim H, Kwon MJ, Hwang DH, Lee K
and Kim BG: Molecular and cellular changes in the lumbar spinal
cord following thoracic injury: Regulation by treadmill locomotor
training. PLoS One. 9:e882152014. View Article : Google Scholar : PubMed/NCBI
|
|
11
|
Yang Z, Lv Q, Wang Z, Dong X, Yang R and
Zhao W: Identification of crucial genes associated with rat
traumatic spinal cord injury. Mol Med Rep. 15:1997–2006. 2017.
View Article : Google Scholar : PubMed/NCBI
|
|
12
|
Liu Q, Zhang B, Liu C and Zhao D:
Molecular mechanisms underlying the positive role of treadmill
training in locomotor recovery after spinal cord injury. Spinal
Cord. 55:441–446. 2017. View Article : Google Scholar : PubMed/NCBI
|
|
13
|
Barrett T, Wilhite SE, Ledoux P,
Evangelista C, Kim IF, Tomashevsky M, Marshall KA, Phillippy KH,
Sherman PM, Holko M, et al: NCBI GEO: Archive for functional
genomics data sets-update. Nucleic Acids Res. 41:D991–D995. 2013.
View Article : Google Scholar : PubMed/NCBI
|
|
14
|
Carvalho BS and Irizarry RA: A framework
for oligonucleotide microarray preprocessing. Bioinformatics.
26:2363–2367. 2010. View Article : Google Scholar : PubMed/NCBI
|
|
15
|
Ritchie ME, Phipson B, Wu D, Hu Y, Law CW,
Shi W and Smyth GK: Limma powers differential expression analyses
for RNA-sequencing and microarray studies. Nucleic Acids Res.
43:e472015. View Article : Google Scholar : PubMed/NCBI
|
|
16
|
Kolde R: pheatmap: Pretty Heatmaps. R
package version 0.6.1. 2013. http://CRAN.R-project.org/packageepheatmapOct
12–2015
|
|
17
|
Yu G, Wang LG, Han Y and He QY:
clusterProfiler: An R package for comparing biological themes among
gene clusters. OMICS. 16:284–287. 2012. View Article : Google Scholar : PubMed/NCBI
|
|
18
|
The Gene Ontology Consortium, . Expansion
of the gene ontology knowledgebase and resources. Nucleic Acids
Research. 45:D331–D338. 2017. View Article : Google Scholar : PubMed/NCBI
|
|
19
|
Mi H, Huang X, Muruganujan A, Tang H,
Mills C, Kang D and Thomas PD: PANTHER version 11: Expanded
annotation data from Gene Ontology and Reactome pathways, and data
analysis tool enhancements. Nucleic Acids Res. 45:D183–D189. 2017.
View Article : Google Scholar : PubMed/NCBI
|
|
20
|
Kanehisa M and Goto S: KEGG: Kyoto
encyclopaedia of genes and genomes. Nucleic Acids Res. 28:27–30.
2000. View Article : Google Scholar : PubMed/NCBI
|
|
21
|
Szklarczyk D, Franceschini A, Wyder S,
Forslund K, Heller D, Huerta-Cepas J, Simonovic M, Roth A, Santos
A, Tsafou KP, et al: STRING v10: Protein-protein interaction
networks, integrated over the tree of life. Nucleic Acids Res.
43:D447–D452. 2015. View Article : Google Scholar : PubMed/NCBI
|
|
22
|
Shannon P, Markiel A, Ozier O, Baliga NS,
Wang JT, Ramage D, Amin N, Schwikowski B and Ideker T: Cytoscape: A
software environment for integrated models of biomolecular
interaction networks. Genome Res. 13:2498–2504. 2003. View Article : Google Scholar : PubMed/NCBI
|
|
23
|
Tang Y, Li M, Wang J, Pan Y and Wu FX:
CytoNCA: A cytoscape plugin for centrality analysis and evaluation
of protein interaction networks. Biosystems. 127:67–72. 2015.
View Article : Google Scholar : PubMed/NCBI
|
|
24
|
He X and Zhang J: Why do hubs tend to be
essential in protein networks? PLoS Genet. 2:e882006. View Article : Google Scholar : PubMed/NCBI
|
|
25
|
Wang J, Duncan D, Shi Z and Zhang B:
WEB-based GEne SeT AnaLysis Toolkit (WebGestalt): Update 2013.
Nucleic Acids Res. 41:W77–W83. 2013. View Article : Google Scholar : PubMed/NCBI
|
|
26
|
Gonzalez-Billault C, Jimenez-Mateos EM,
Caceres A, Diaz-Nido J, Wandosell F and Avila J:
Microtubule-associated protein 1B function during normal
development, regeneration, and pathological conditions in the
nervous system. J Neurobiol. 58:48–59. 2004. View Article : Google Scholar : PubMed/NCBI
|
|
27
|
Ma D, Nothias F, Boyne LJ and Fischer I:
Differential regulation of microtubule-associated protein 1B
(MAP1B) in rat CNS and PNS during development. J Neurosci Res.
49:319–332. 1997. View Article : Google Scholar : PubMed/NCBI
|
|
28
|
Gödel M, Temerinac D, Grahammer F,
Hartleben B, Kretz O, Riederer BM, Propst F, Kohl S and Huber TB:
Microtubule associated protein 1b (MAP1B) is a marker of the
microtubular cytoskeleton in podocytes but is not essential for the
function of the kidney filtration barrier in mice. PLoS One.
10:e01401162015. View Article : Google Scholar : PubMed/NCBI
|
|
29
|
Tortosa E, Montenegro-Venegas C, Benoist
M, Härtel S, González-Billault C, Esteban JA and Avila J:
Microtubule-associated protein 1B (MAP1B) is required for dendritic
spine development and synaptic maturation. J Biol Chem.
286:40638–40648. 2011. View Article : Google Scholar : PubMed/NCBI
|
|
30
|
Köttgen M, Benzing T, Simmen T, Tauber R,
Buchholz B, Feliciangeli S, Huber TB, Schermer B, Kramer-Zucker A,
Höpker K, et al: Trafficking of TRPP2 by PACS proteins represents a
novel mechanism of ion channel regulation. EMBO J. 24:705–716.
2005. View Article : Google Scholar : PubMed/NCBI
|
|
31
|
Liu WM, Wu JY, Li FC and Chen QX: Ion
channel blockers and spinal cord injury. J Neurosci Res.
89:791–801. 2011. View Article : Google Scholar : PubMed/NCBI
|
|
32
|
Kawaai K, Mizutani A, Shoji H, Ogawa N,
Ebisui E, Kuroda Y, Wakana S, Miyakawa T, Hisatsune C and Mikoshiba
K: IRBIT regulates CaMKIIα activity and contributes to
catecholamine homeostasis through tyrosine hydroxylase
phosphorylation. Proc Natl Acad Sci USA. 112:5515–5520. 2015.
View Article : Google Scholar : PubMed/NCBI
|
|
33
|
Jauhari A, Singh T, Singh P, Parmar D and
Yadav S: Regulation of miR-34 family in neuronal development. Mol
Neurobiol. 55:936–945. 2018. View Article : Google Scholar : PubMed/NCBI
|
|
34
|
Aranha MM, Santos DM, Solá S, Steer CJ and
Rodrigues CM: miR-34a regulates mouse neural stem cell
differentiation. PLoS One. 6:e213962011. View Article : Google Scholar : PubMed/NCBI
|
|
35
|
Rokavec M, Li H, Jiang L and Hermeking H:
The p53/miR-34 axis in development and disease. J Mol Cell Biol.
6:214–230. 2014. View Article : Google Scholar : PubMed/NCBI
|
|
36
|
Zhu Y, Wu Y and Zhang R:
Electro-acupuncture promotes the proliferation of neural stem cells
and the survival of neurons by downregulating miR-449a in rat with
spinal cord injury. EXCLI J. 16:363–374. 2017.PubMed/NCBI
|
|
37
|
Han R, Ji X, Rong R, Li Y, Yao W, Yuan J,
Wu Q, Yang J, Yan W, Han L, et al: MiR-449a regulates autophagy to
inhibit silica-induced pulmonary fibrosis through targeting Bcl2. J
Mol Med (Berl). 94:1267–1279. 2016. View Article : Google Scholar : PubMed/NCBI
|
|
38
|
Kanno H, Ozawa H, Sekiguchi A and Itoi E:
The role of autophagy in spinal cord injury. Autophagy. 5:390–392.
2009. View Article : Google Scholar : PubMed/NCBI
|
|
39
|
Li H, Zhang Q, Yang X and Wang L: PPAR-γ
agonist rosiglitazone reduces autophagy and promotes functional
recovery in experimental traumaticspinal cord injury. Neurosci
Lett. 650:89–96. 2017. View Article : Google Scholar : PubMed/NCBI
|