Introduction
Intervertebral disc degeneration (IDD) is
characterized by excessive apoptosis of nucleus pulposus (NP) cells
and degradation of extracellular matrix (ECM) components, and is
considered the main contributing factor to lower back pain (LBP).
It is estimated that ~84% of people will experience LBP during
their lives worldwide, with 10% becoming chronically disabled
(1), thus seriously affecting
quality of life and imposing heavy economic burdens on families and
society. Currently, clinical interventions for IDD primarily
include conservative medication and surgery (spinal fusion or total
disc replacement); however, these treatments are only able to
temporarily relieve pain symptoms, without solving the underlying
issues in IDD and providing a permanent cure (2,3).
Therefore, it is necessary to deeply investigate the underlying
mechanisms of IDD, in order to develop more effective strategies
for preventing and treating IDD-associated LBP.
Recently, emerging evidence has suggested that
noncoding RNAs, including microRNAs (miRNAs/miRs), long noncoding
RNAs (lncRNAs) and circular RNAs (circRNAs) serve crucial roles in
various biological processes, including cell proliferation and
apoptosis (4). miRNAs function by
binding to complementary sequences in the 3′-untranslated region
(UTR) of their target mRNAs, thereby triggering either
translational inhibition or mRNA degradation of the transcript
(5). lncRNAs/circRNAs may act as
competing endogenous RNAs (ceRNAs) by competitively binding to
miRNAs through their miRNA response elements, thus regulating the
expression levels of miRNA target mRNAs (6). Therefore, lncRNA/circRNA-miRNA-mRNA
interactions may be an important mechanism underlying the
initiation and development of IDD. This hypothesis has been
verified in previous studies. Notably, Xi et al (7) demonstrated that lncRNA HLA complex
group 18 (HCG18) is significantly upregulated in patients with IDD
and its expression is positively correlated with disc degeneration
grade. Subsequently, a luciferase reporter assay was conducted,
which indicated that HCG18 may act as an endogenous sponge to
downregulate miR-146a-5p expression in NP cells, thus promoting the
upregulation of a miR-146a-5p target gene, TNF-receptor associated
factor 6, ultimately suppressing the growth of NP cells by
decreasing cell numbers in S phase of the cell cycle, inducing cell
apoptosis, recruiting macrophages and hypercalcification (7). Wang et al (8) demonstrated that lncRNA RP11-296A18.3
interacts with miR-138 to induce upregulation of the miR-138 target
gene, hypoxia inducible factor 1 subunit α (HIF1A), thus affecting
NP proliferation and ECM synthesis. The expression of RP11-296A18.3
is positively correlated with HIF1A; however, RP11-296A18.3 and
HIF1A are inversely correlated with miR-138 in IDD tissues
(8). In addition, by circRNA
microarray assay, bioinformatics analysis, RNA immunoprecipitation
and luciferase assay, Wang et al (9) provided evidence to suggest that
circRNA-4099 is able to function as a ‘sponge’ by competitively
binding miR-616-5p, which reverses the suppression of SRY-box 9 by
miR-616-5p. Cheng et al (10) revealed that circVMA21 acts as a
sponge of miR-200c, thus regulating the expression of the target
mRNA, X-linked inhibitor of apoptosis (XIAP). The decreased
expression of XIAP in inflammatory cytokines-treated NP cells and
degenerative NP tissues is directly associated with excessive
apoptosis, and an imbalance between the anabolic and catabolic
factors of ECM. Conversely, intradiscal injection of circVMA21 may
alleviate IDD in a rat model (10). These findings indicated that
targeting the regulatory effects of associated lncRNAs, circRNAs,
miRNAs and mRNAs may have a potential role in the clinical
treatment of IDD. However, to the best of our knowledge,
IDD-associated lncRNA/circRNA-miRNA-mRNA ceRNA regulatory
mechanisms remain rarely reported, until now (11).
The present study aimed to preliminarily identify
novel lncRNA/circRNA-miRNA-mRNA ceRNA-mediated regulatory
mechanisms in IDD by constructing a ceRNA regulatory network using
microarray data collected from a public database. This study may
provide targets for the development of novel therapeutic strategies
to treat IDD.
Materials and methods
Gene expression omnibus (GEO) dataset
collection
A microarray dataset was retrieved from the public
GEO database (www.ncbi.nlm.nih.gov/geo); the accession number of the
dataset used is GSE67567, which contains three sub-datasets:
GSE67566, circRNA expression profile (platform: GPL19978,
Agilent-069978 Arraystar Human CircRNA microarray V1; Agilent
Technologies, Inc., Santa Clara, CA, USA) (12,13);
GSE63492, miRNA expression profile [platform: GPL19449, Exiqon
miRCURY LNA microRNA Array, 7th generation REV-hsa, mmu & rno
(miRBase v18.0); Exiqon; Qiagen, Inc., Valencia, CA, USA] (12,13);
and GSE56081, mRNA-lncRNA expression profile [platform: GPL15314,
Arraystar Human LncRNA microarray V2.0 (Agilent_033010 Probe Name
version); Agilent Technologies, Inc.] (12,14).
These three sub-datasets included NP samples derived from five
normal control individuals and five patients with IDD.
Data preprocessing and differential
expression analysis
The raw TXT data collected from the microarray
platforms were preprocessed using the Linear Models for Microarray
data (LIMMA) method (15) (version
3.34.0; www.bioconductor.org/packages/release/bioc/html/limma.html)
in the Bioconductor R package (version 3.4.1; www.R-project.org), including base-2 logarithmic
(log2) transformation and quantile normalization. For the GSE56081
microarray data, the probe sequences were downloaded from the
annotation platforms and aligned with the human genome using
Clustal W computer program (version 2; www.clustal.org) to obtain the expression levels of
lncRNA and mRNAs.
The lists of differentially expressed genes (DEGs),
differentially expressed lncRNAs (DELs), differentially expressed
circRNAs (DECs) and differentially expressed miRNAs (DEMs) between
controls and patients with IDD were generated using the LIMMA
method (15), where statistical
significance was set as |log-fold change (logFC)|>1 and
Benjamini and Hochberg-corrected (16) false discovery rates (FDR)<0.05.
A hierarchical cluster heatmap representing expression intensity
and direction was created using pheatmap in R package (version:
1.0.8; cran.r-project.org/web/packages/pheatmap) based on
Euclidean distance.
Protein-protein interaction (PPI)
network
The PPI network of DEGs was constructed and
visualized using Cytoscape software (version 3.6.1; www.cytoscape.org) (17) based on the interaction data from
the Search Tool for the Retrieval of Interacting Genes (version
10.0; string db.org) database (18). The topological features of the PPI
network, including degree [the number of edges (interactions) of a
node (protein)], betweenness centrality (BC, the number of shortest
paths that run through a node), closeness centrality (CC, the
average length of the shortest paths to access all other proteins
in the network) and average path length, were calculated, in order
to determine the crucial genes using the CytoNCA plugin in
Cytoscape software (apps.cytoscape.org/apps/cytonca) (19).
The Molecular Complex Detection (MCODE;
version:1.4.2; apps.cytoscape.org/apps/mcode) (20) plugin in Cytoscape software was used
to identify functionally related and highly interconnected modules
from the PPI network with a degree cutoff of 2, node score cutoff
of 0.2, k-core of 2 and maximum depth of 100.
miRNA regulatory network
construction
The DEM-associated target genes were predicted using
the starBase database (version 2.0; starbase.sysu.edu.cn/index.php) (21) which provides the prediction results
of five miRNA databases (TargetScan, picTar, RNA22, PITA and
miRanda). The miRNA-target gene interaction pairs were selected if
they were predicted in ≥1 database. The target genes were then
overlapped with the DEGs, and the negative interaction pairs
between DEMs and DEGs (according to their expression levels) were
used to construct the miRNA-mRNA network using Cytoscape software
(version 3.6.1; www.cytoscape.org) (17). The known miRNAs associated with IDD
were predicted using the Human microRNA Disease Database (HMDD;
www.cuilab.cn/hmdd) (22).
CeRNA regulatory network
construction
The starBase database (version 2.0; starbase.sysu.edu.cn/index.php)
(21) database was used to screen
the interactions between DELs and DEMs, which were then integrated
with the miRNA-mRNA interactions to establish the DEL-DEM-DEG ceRNA
network using Cytoscape software (version 3.6.1; www.cytoscape.org) (17).
Human sequences of DEMs and DECs were downloaded
from the circBase (www.circbase.org) (23) and miRBase (version 21; www.mirbase.org) (24) databases, respectively. miRanda
(cbio.mskcc.org/miRNA2003/miranda.html) (25) was used to predict the interactions
between DECs and DEMs according to the following parameter
settings: Gap Open Penalty, −8; Gap Extend, −2; Score Threshold,
80%; and Energy Threshold, −20. The interaction pairs between DECs
and DEMs were then integrated with the miRNA-mRNA interactions to
establish the DEC-DEM-DEG ceRNA network using Cytoscape software
(version 3.6.1; www.cytoscape.org) (17).
The overlapped miRNA-mRNAs in the above two ceRNA
networks were also selected to construct the
lncRNA/circRNA-miRNA-mRNA network.
Functional enrichment analysis
The Kyoto Encyclopedia of Genes and Genomes (KEGG)
pathway enrichment analysis of genes in each module and network was
conducted using the Database for Annotation, Visualization and
Integrated Discovery (DAVID) online tool (version 6.8; http://david.abcc.ncifcrf.gov) (26), with P<0.05 set as the cut-off
value. In addition, all known IDD-associated pathways were
downloaded from the Comparative Toxicogenomics Database (CTD;
ctd.mdibl.org) (27), which were then overlapped with the
enriched ceRNA pathways, in order to obtain an IDD
pathway-associated ceRNA network.
Results
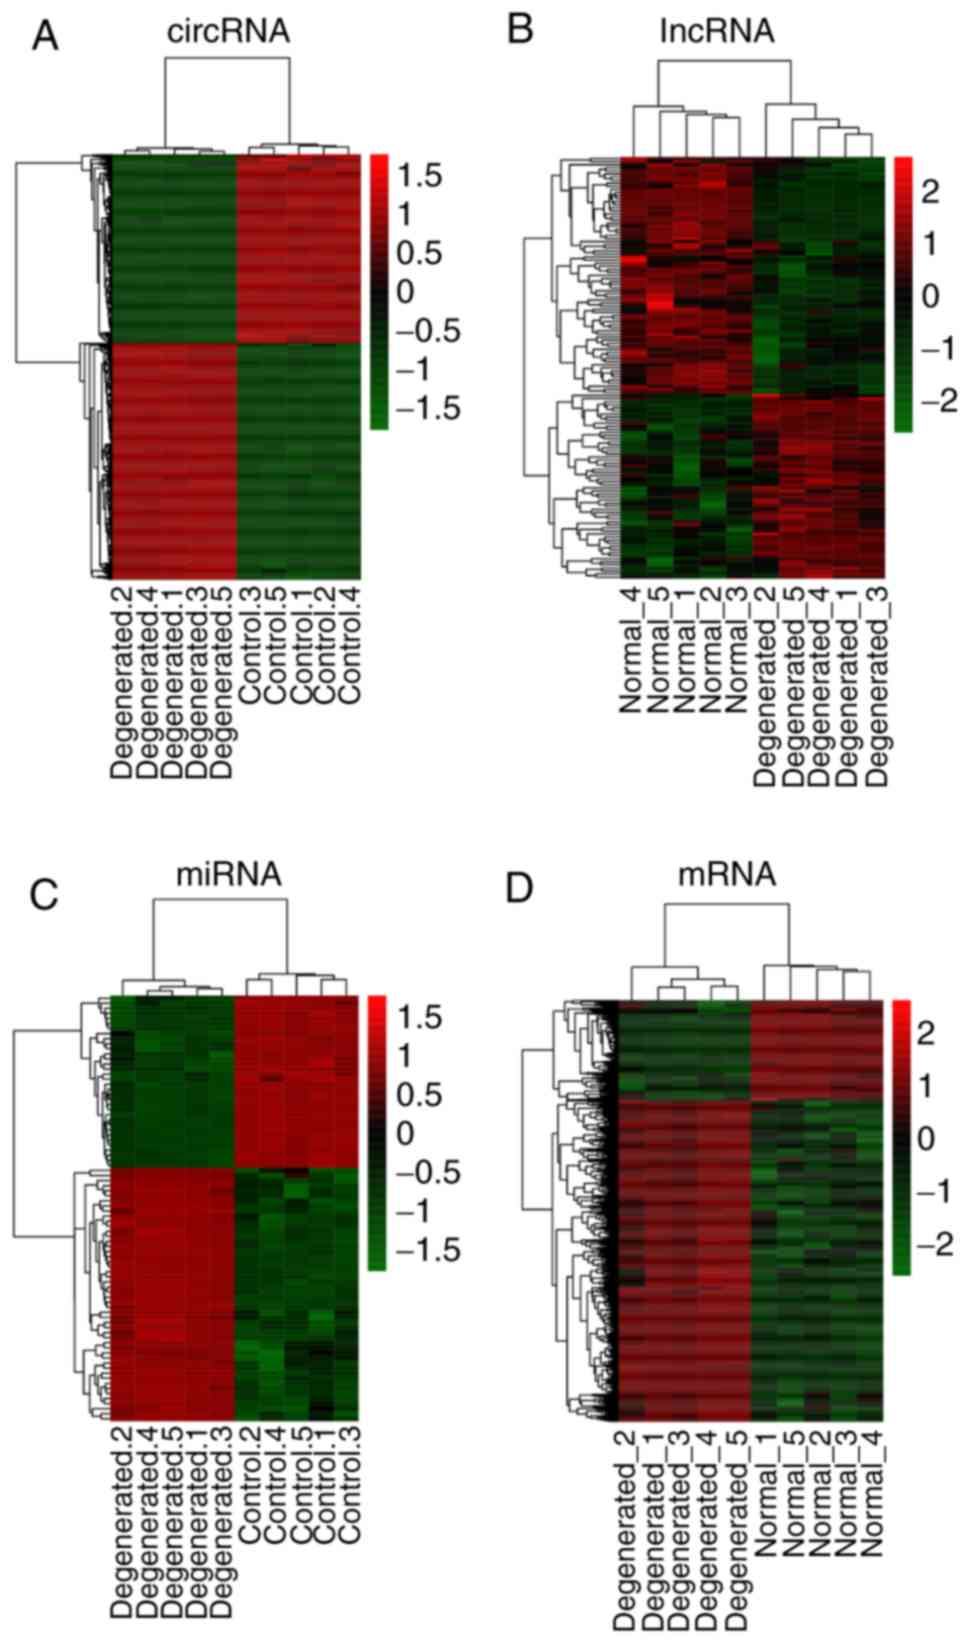
Differential expression analysis
According to the pre-set threshold (FDR<0.05 and
|logFC|>1), a total of 636 DECs were identified between IDD and
control samples, including 354 upregulated and 282 downregulated
circRNAs; 115 DELs were screened, consisting of 50 upregulated and
65 downregulated lncRNAs; 84 DEMs were obtained, containing 50
upregulated and 34 downregulated miRNAs; and 1,040 DEGs were
generated, comprising 763 upregulated and 277 downregulated genes.
The top 20 DECs, DELs, DEMs and DEGs are presented in Table I. The hierarchical cluster heat
maps indicated that these DECs (Fig.
1A), DELs (Fig. 1B), DEMs
(Fig. 1C) and DEGs (Fig. 1D) could distinguish IDD from
control samples.
 | Table I.Top upregulated and downregulated
differentially expressed circRNAs, lncRNAs, miRNAs and mRNAs
identified from Gene Expression Omnibus microarray datasets. |
Table I.
Top upregulated and downregulated
differentially expressed circRNAs, lncRNAs, miRNAs and mRNAs
identified from Gene Expression Omnibus microarray datasets.
| A, circRNAs |
|---|
|
|---|
| RNA | logFC | FDR |
|---|
|
hsa_circRNA_101852 | 2.98 |
3.92×10⁻¹⁵ |
|
hsa_circRNA_101853 | 2.93 |
6.98×10⁻¹⁶ |
|
hsa_circRNA_101139 | 2.92 |
6.98×10⁻¹⁶ |
|
hsa_circRNA_103890 | 2.86 |
1.72×10⁻¹⁵ |
|
hsa_circRNA_400019 | 2.84 |
3.87×10⁻¹⁴ |
|
hsa_circRNA_102324 | 2.78 |
1.00×10⁻¹⁵ |
|
hsa_circRNA_104703 | 2.72 |
1.24×10⁻¹⁵ |
|
hsa_circRNA_104600 | 2.68 |
7.51×10⁻¹⁵ |
|
hsa_circRNA_100604 | 2.68 |
1.57×10⁻¹⁵ |
|
hsa_circRNA_100018 | 2.61 |
1.67×10⁻¹⁵ |
|
hsa_circRNA_103410 | 2.59 |
6.98×10⁻¹⁶ |
|
hsa_circRNA_000200 | 2.56 |
2.32×10⁻¹⁴ |
|
hsa_circRNA_100086 | 2.32 |
7.03×10⁻¹⁴ |
|
hsa_circRNA_102348 | 1.95 |
9.57×10⁻¹⁴ |
|
hsa_circRNA_102399 | 1.63 |
4.92×10⁻¹² |
|
hsa_circRNA_101645 | −3.30 |
1.60×10⁻¹⁴ |
|
hsa_circRNA_104508 | −3.26 |
2.19×10⁻¹³ |
|
hsa_circRNA_102116 | −3.18 |
1.92×10⁻¹⁴ |
|
hsa_circRNA_103838 | −3.06 |
6.98×10⁻¹⁶ |
|
hsa_circRNA_101557 | −3.05 |
1.96×10⁻¹⁴ |
|
| B,
lncRNAs |
|
| RNA | logFC | FDR |
|
| TRPC7-AS1 | 6.61 |
6.55×10⁻⁸ |
| MIR4458HG | 1.40 |
5.56×10⁻³ |
| GAS5 | 1.40 |
4.30×10⁻² |
| CBR3-AS1 | 1.40 |
3.05×10⁻⁴ |
| ADPGK-AS1 | 1.40 |
2.67×10⁻³ |
| SNHG5 | 1.40 |
2.67×10⁻² |
| ADARB2-AS1 | 1.391 |
4.17×10⁻³ |
| LINC00431 | 1.39 |
4.68×10⁻⁴ |
| MCCC1-AS1 | 1.39 |
8.89×10⁻³ |
| MALAT1 | 1.07 |
6.58×10⁻⁴ |
| HOTAIR | −7.21 |
6.47×10⁻⁸ |
| LINC00957 | −6.28 |
7.33×10⁻⁹ |
| VPS13A-AS1 | −6.01 |
1.81×10⁻⁸ |
| IL10RB-AS1 | −5.54 |
9.48×10⁻⁹ |
| MAPT-AS1 | −5.12 |
6.53×10⁻⁹ |
| LINC00689 | −3.63 |
2.87×10⁻⁵ |
| EFCAB6-AS1 | −3.39 |
2.96×10⁻⁸ |
| HAND2-AS1 | −3.21 |
3.47×10⁻⁴ |
| LINC00884 | −3.12 |
5.11×10⁻⁵ |
| LINC01405 | −3.04 |
9.52×10⁻⁴ |
|
| C,
miRNAs |
|
| RNA | logFC | FDR |
|
| hsa-miR-4287 | 5.81 |
4.50×10⁻³ |
|
hsa-miR-3150a-3p | 5.03 |
1.24×10⁻⁵ |
|
hsa-miR-3157-3p | 4.90 |
1.00×10⁻² |
| hsa-miR-660-5p | 4.80 |
1.99×10⁻³⁴ |
| hsa-miR-887-3p | 4.05 |
1.05×10⁻⁴ |
|
hsa-miR-5010-5p | 4.03 |
2.66×10⁻² |
| hsa-miR-933 | 3.43 |
7.39×10⁻³ |
|
hsa-miR-3127-5p | 3.35 |
4.45×10⁻³ |
| hsa-miR-4450 | 3.24 |
2.23×10⁻³ |
|
hsa-miR-516a-5p | 3.15 |
2.29×10⁻⁴ |
| hsa-miR-1184 | −4.85 |
5.44×10⁻⁴ |
|
hsa-miR-125b-1-3p | −4.69 |
4.44×10⁻⁴ |
| hsa-miR-486-3p | −4.39 |
8.00×10⁻³ |
| hsa-miR-3648 | −3.76 |
6.14×10−46 |
|
hsa-miR-196b-5p | −3.43 |
1.00×10⁻² |
| hsa-miR-155-5p | −3.22 |
2.00×10⁻² |
|
hsa-miR-302a-3p | −1.93 |
2.00×10⁻² |
|
hsa-miR-519d-3p | −1.81 |
4.00×10⁻² |
| hsa-miR-509-3p | −1.78 |
3.00×10⁻² |
| hsa-miR-185-5p | −1.53 |
1.00×10⁻² |
|
| D,
mRNAs |
|
| RNA | logFC | FDR |
|
| HBB | 8.41 |
3.87×10⁻⁹ |
| HBA1 | 8.19 |
8.62×10⁻¹¹ |
| COL1A2 | 7.01 |
3.41×10⁻¹⁰ |
| PTP4A3 | 6.98 |
7.31×10⁻⁷ |
| RBM38 | 6.70 |
1.72×10⁻⁹ |
| MFAP4 | 6.19 |
7.41×10⁻⁹ |
| GREM1 | 5.77 |
4.49×10⁻⁸ |
| NKG7 | 5.55 |
1.13×10⁻⁹ |
| TREM1 | 5.47 |
1.12×10⁻⁹ |
| LUM | 5.36 |
3.28×10⁻⁹ |
| PHLDB2 | −7.09 |
2.99×10⁻⁸ |
| TMEM177 | −6.96 |
1.12×10⁻⁹ |
| KIAA0319 | −6.95 |
5.16×10⁻¹⁰ |
| ERLIN1 | −6.89 |
6.61×10⁻¹⁰ |
| APOD | −6.47 |
4.61×10⁻⁷ |
| SLF2 | −6.45 |
5.61×10⁻¹⁰ |
| NDRG4 | −6.44 |
4.91×10⁻¹⁰ |
| GUCY1A3 | −6.43 |
9.45×10⁻¹⁰ |
| PLAGL1 | −6.41 |
1.67×10⁻⁷ |
| ATP8B3 | −6.32 |
7.34×10⁻⁹ |
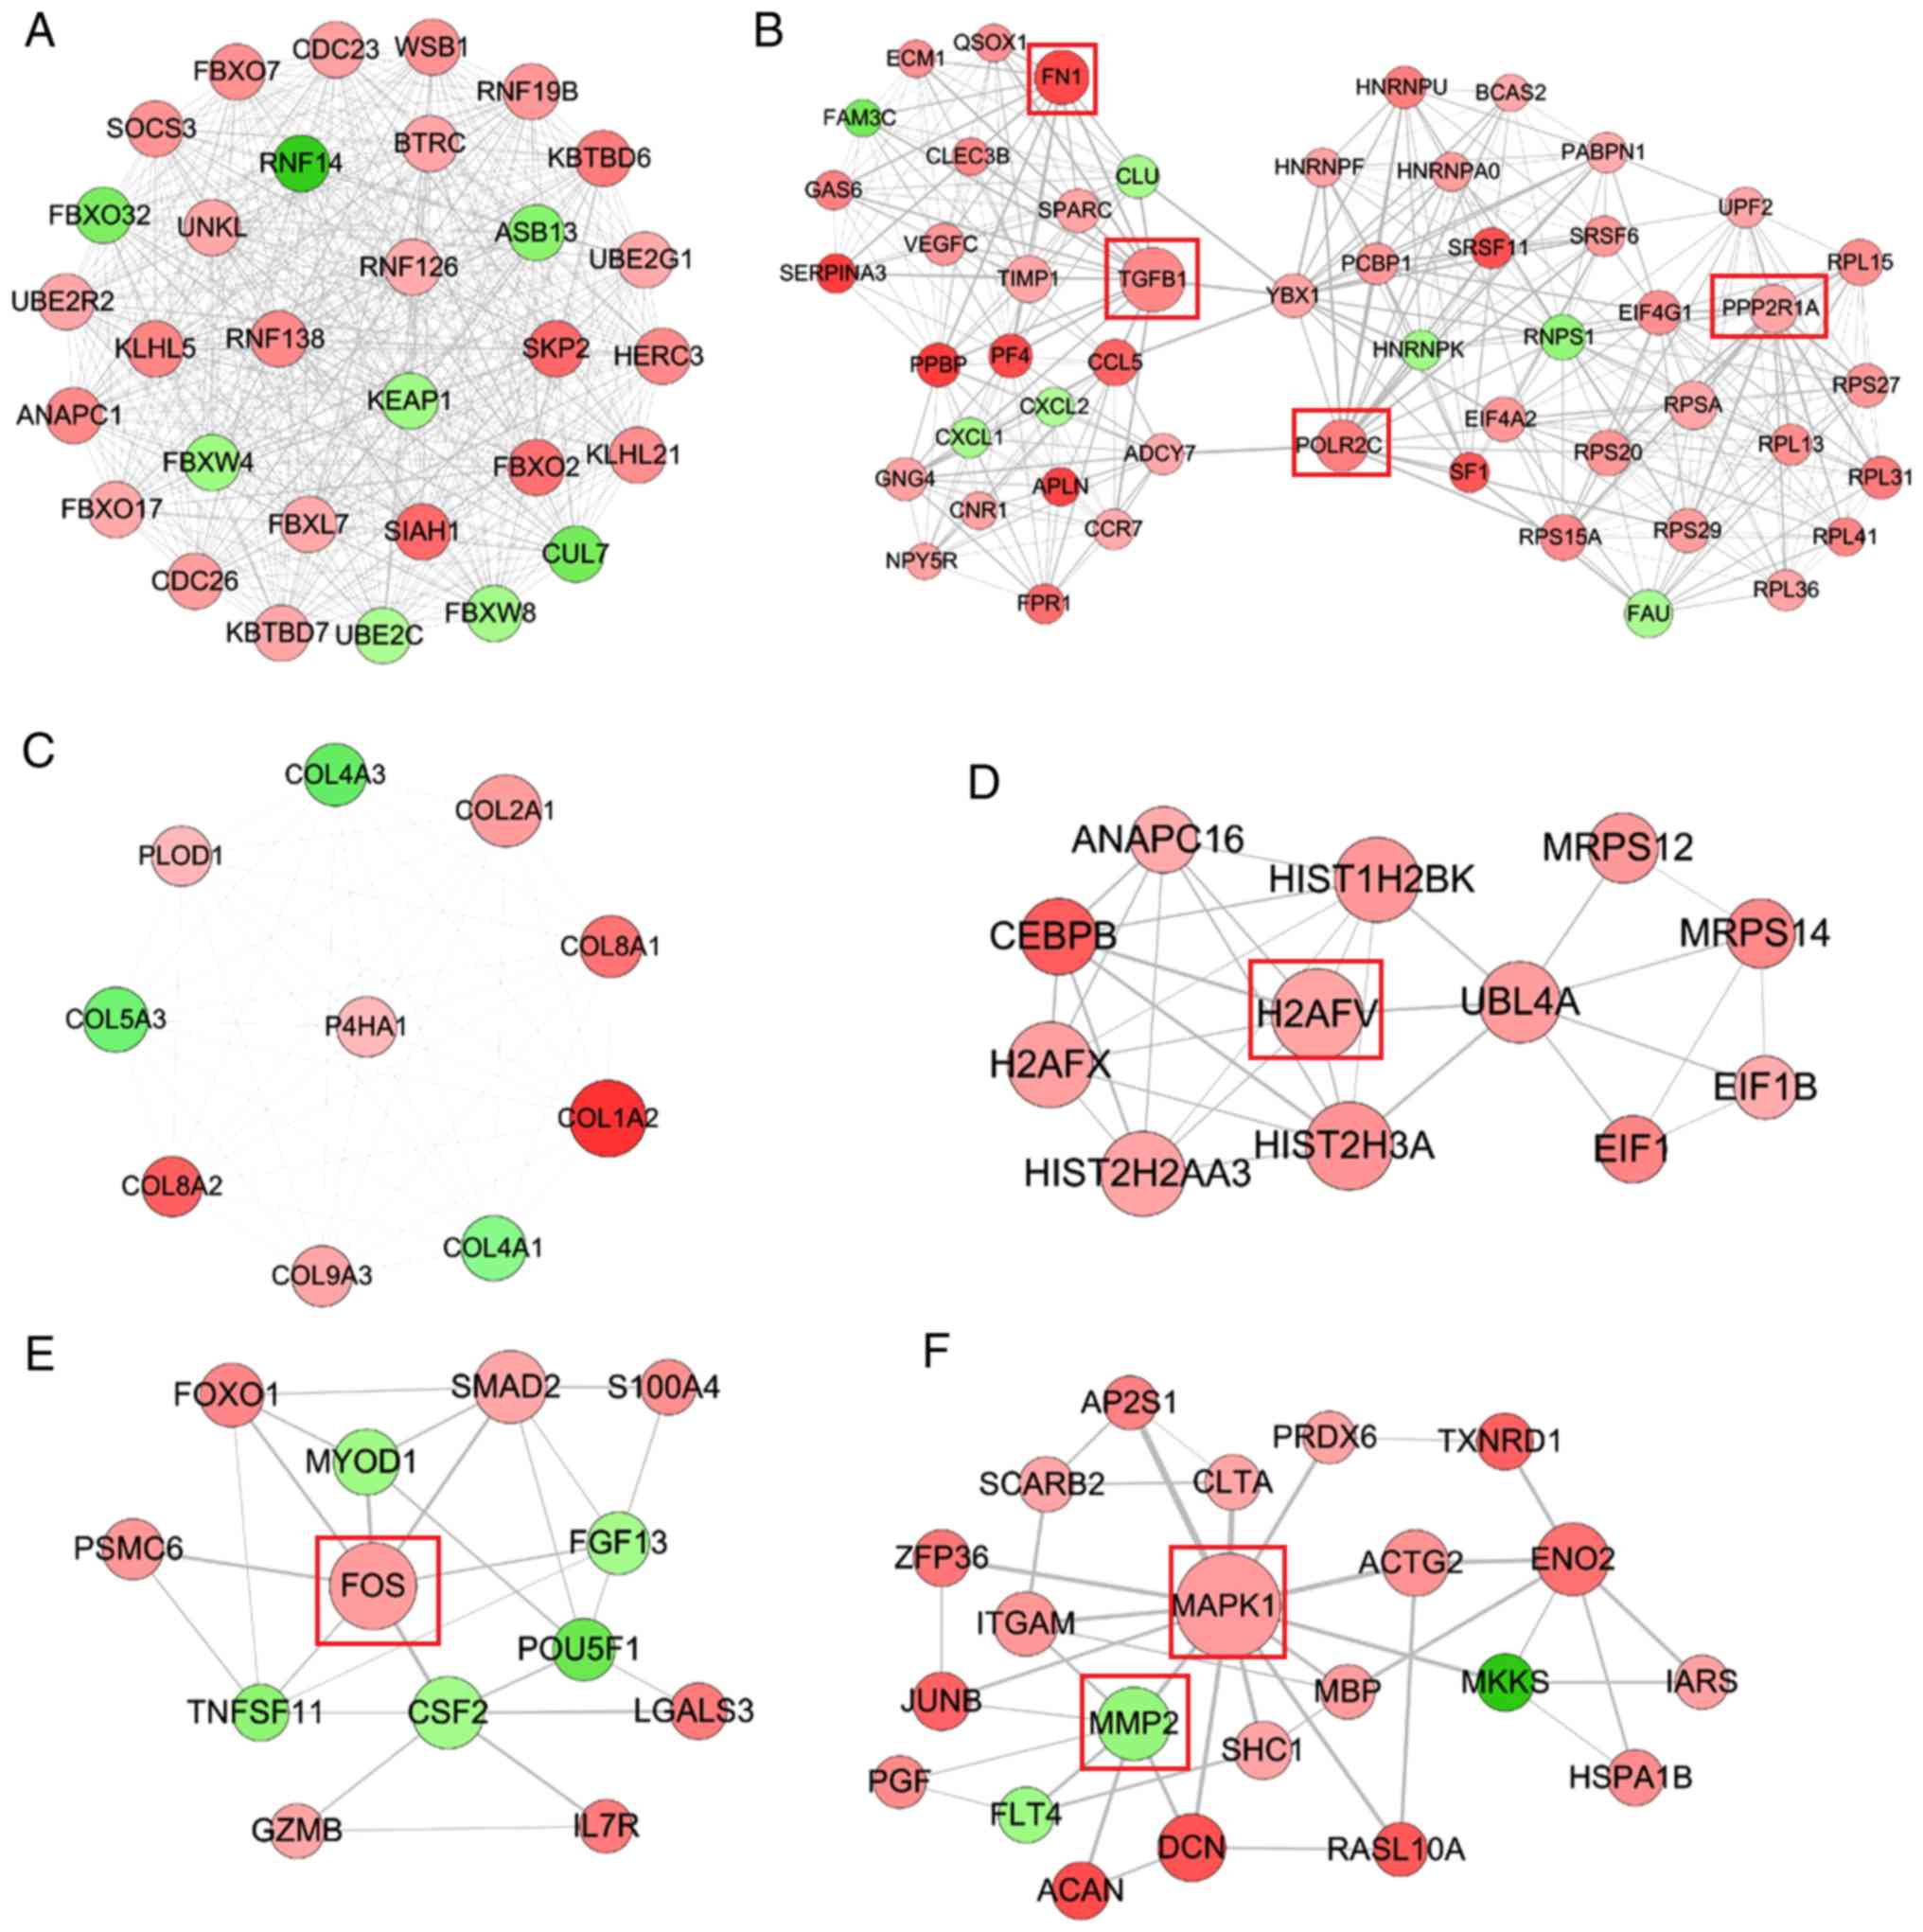
PPI network
A PPI network was constructed using the screened
DEGs, which included 721 nodes (561 upregulated and 160
downregulated) and 3,561 interaction pairs. DNA topoisomerase II β,
matrix metallopeptidase 2 (MMP2), enolase (ENO)1, Fos
proto-oncogene, AP-1 transcription factor subunit (FOS),
mitogen-activated protein kinase 1 (MAPK1), HIF1A, protein
phosphatase 2 scaffold subunit Aα (PPP2R1A), ENO2, RNA polymerase
II subunit C (POLR2C), transforming growth factor β1 (TGFB1),
fibronectin 1 (FN1), Jun proto-oncogene, AP-1 transcription factor
subunit (JUN), vimentin and H2A histone family member V (H2AFV)
were considered hub genes in the PPI network because they were
present in the top 35 genes of four topological features (Tables II and III). Six functionally related and
highly interconnected modules were subsequently extracted using
MCODE, in order to further screen crucial genes (Fig. 2). Among them, the hub genes
PPP2R1A, TGFB1, POLR2C and FN1 were included in module 2; H2AFV was
included in module 4; FOS was included in module 5; and MMP2 and
MAPK1 were contained in module 6.
| Table II.Topological features of DEGs in the
protein-protein interaction network. |
Table II.
Topological features of DEGs in the
protein-protein interaction network.
| A, Degree |
|---|
|
|---|
| DEG | Value |
|---|
| MAPK1 | 86 |
| JUN | 78 |
| TOP2B | 75 |
| TGFB1 | 70 |
| FOS | 58 |
| BTRC | 49 |
| FN1 | 49 |
| H2AFV | 44 |
| SOCS3 | 43 |
| POLR2C | 43 |
| UBE2C | 43 |
| CDC23 | 42 |
| VIM | 42 |
| KEAP1 | 41 |
| MMP2 | 40 |
| ANAPC1 | 40 |
| SKP2 | 40 |
| HIST2H3A | 40 |
| SMAD3 | 39 |
| ENO2 | 39 |
| SMAD2 | 38 |
| CDC26 | 38 |
| UBE2G1 | 37 |
| H2AFX | 37 |
| CSF2 | 37 |
| ENO1 | 37 |
| HIST2H2AA3 | 36 |
| UBE2R2 | 36 |
| HIST1H2BK | 36 |
| PPP2R1A | 36 |
| SIAH1 | 36 |
| RPSA | 36 |
| FAU | 35 |
| HERC3 | 34 |
| HIF1A | 33 |
|
| B, CC |
|
| DEG | Value |
|
| ST6GALNAC1 | 1.0000 |
| OTOP3 | 1.0000 |
| ZDHHC9 | 1.0000 |
| HID1 | 1.0000 |
| TMEM128 | 1.0000 |
| RAPH1 | 1.0000 |
| LANCL1 | 1.0000 |
| CAMTA1 | 1.0000 |
| DPP10 | 1.0000 |
| GTF2H2C | 1.0000 |
| BRD9 | 1.0000 |
| ST6GALNAC4 | 0.6667 |
| SLC25A43 | 0.6667 |
| ORMDL1 | 0.6667 |
| GALNT1 | 0.6667 |
| JUN | 0.4257 |
| MAPK1 | 0.4250 |
| FOS | 0.4001 |
| TGFB1 | 0.3967 |
| TOP2B | 0.3917 |
| VIM | 0.3842 |
| FN1 | 0.3766 |
| MMP2 | 0.3762 |
| POLR2C | 0.3760 |
| SMAD3 | 0.3752 |
| YBX1 | 0.3748 |
| ENO1 | 0.3726 |
| HIF1A | 0.3726 |
| ACTL6A | 0.3720 |
| HBA1 | 0.3714 |
| ENO2 | 0.3707 |
| H2AFV | 0.3674 |
| H2AFX | 0.3674 |
| SMAD2 | 0.3668 |
| PPP2R1A | 0.3651 |
|
| C, BC |
|
| DEG | Value |
|
| ST6GALNAC1 | 1.0000 |
| ZDHHC9 | 1.0000 |
| MAPK1 | 0.1255 |
| TOP2B | 0.0988 |
| JUN | 0.0913 |
| TGFB1 | 0.0619 |
| FOS | 0.0450 |
| NME2 | 0.0413 |
| FN1 | 0.0365 |
| PPP2R1A | 0.0319 |
| VIM | 0.0314 |
| POLR2C | 0.0310 |
| RAD51 | 0.0301 |
| HIF1A | 0.0293 |
| CTSD | 0.0272 |
| ENO2 | 0.0266 |
| ACTG2 | 0.0253 |
| ENO1 | 0.0242 |
| NDUFA4 | 0.0239 |
| H2AFV | 0.0227 |
| MMP2 | 0.0224 |
| SNCA | 0.0209 |
| SOCS3 | 0.0205 |
| CSF2 | 0.0201 |
| HBA1 | 0.0200 |
| DCN | 0.0199 |
| HLA-DRB1 | 0.0195 |
| BTRC | 0.0182 |
| TGFBR2 | 0.0182 |
| DICER1 | 0.0182 |
| COL1A2 | 0.0181 |
| HIST2H3A | 0.0180 |
| ATF4 | 0.0180 |
| ACTL6A | 0.0170 |
| GNG4 | 0.0166 |
|
| D, APL |
|
| DEG | Value |
|
| ST6GALNAC1 | 1.0000 |
| ZDHHC9 | 1.0000 |
| OTOP3 | 1.0000 |
| HID1 | 1.0000 |
| TMEM128 | 1.0000 |
| RAPH1 | 1.0000 |
| LANCL1 | 1.0000 |
| CAMTA1 | 1.0000 |
| DPP10 | 1.0000 |
| GTF2H2C | 1.0000 |
| BRD9 | 1.0000 |
| ST6GALNAC4 | 1.5000 |
| SLC25A43 | 1.5000 |
| ORMDL1 | 1.5000 |
| GALNT1 | 1.5000 |
| JUN | 2.3489 |
| MAPK1 | 2.3532 |
| FOS | 2.4993 |
| TGFB1 | 2.5206 |
| TOP2B | 2.5532 |
| VIM | 2.6028 |
| FN1 | 2.6553 |
| MMP2 | 2.6582 |
| POLR2C | 2.6596 |
| SMAD3 | 2.6652 |
| YBX1 | 2.6681 |
| HIF1A | 2.6837 |
| ENO1 | 2.6837 |
| ACTL6A | 2.6879 |
| HBA1 | 2.6922 |
| ENO2 | 2.6979 |
| H2AFV | 2.7220 |
| H2AFX | 2.7220 |
| SMAD2 | 2.7262 |
| PPP2R1A | 2.7390 |
| Table III.Overlapping DEGs according to
topological features (degree, closeness centrality, betweenness
centrality and average path length). |
Table III.
Overlapping DEGs according to
topological features (degree, closeness centrality, betweenness
centrality and average path length).
| DEG | logFC | FDR |
|---|
| TOP2B | −2.97 |
1.72×10⁻⁶ |
| MMP2 | −2.56 |
1.58×10⁻³ |
| ENO1 | 2.43 |
1.3×10⁻⁶ |
| FOS | 2.32 |
2.18×10⁻⁶ |
| MAPK1 | 2.38 |
1.45×10⁻³ |
| HIF1A | 2.97 |
4.53×10⁻⁴ |
| PPP2R1A | 2.15 |
2.3×10⁻⁷ |
| ENO2 | 3.37 |
1.04×10⁻⁵ |
| POLR2C | 3.01 |
2.00×10⁻⁷ |
| TGFB1 | 2.75 |
3.80×10⁻⁵ |
| FN1 | 4.69 |
2.90×10⁻⁵ |
| JUN | 2.22 |
1.05×10⁻⁶ |
| VIM | 5.26 |
1.13×10⁻⁹ |
| H2AFV | 2.16 |
3.41×10⁻⁴ |
The genes in each module were then subjected to
analysis using DAVID, in order to predict their functions. The
results of KEGG enrichment analysis (Table IV) demonstrated that in module 2,
PPP2R1A was enriched in ‘mRNA surveillance pathway’ and TGFB1 was
enriched in ‘Cytokine-cytokine receptor interaction’; in module 4,
H2AFV was enriched in ‘Systemic lupus erythematosus’; in module 5,
FOS was involved in ‘Rheumatoid arthritis’ and ‘Human T-cell
leukemia virus 1 infection’; and in module 6, MAPK1 and MMP2
participated in ‘Estrogen signaling pathway’. The other hub genes
were not enriched in KEGG pathways.
| Table IV.KEGG pathway analysis of genes in
modules. |
Table IV.
KEGG pathway analysis of genes in
modules.
| A, Module 1 |
|---|
|
|---|
| Term | P-value | Genes |
|---|
| hsa04120: Ubiquitin
mediated proteolysis |
1.09×10⁻²³ | ANAPC1, SOCS3,
BTRC, UBE2G1, FBXO2, SKP2, CDC23, HERC3, KEAP1, UBE2C, CDC26,
UBE2R2, FBXW8, CUL7, SIAH1 |
| hsa04114: Oocyte
meiosis |
1.51×10⁻³ | ANAPC1, BTRC,
CDC23, CDC26 |
| hsa04110: Cell
cycle |
2.19×10⁻³ | ANAPC1, SKP2,
CDC23, CDC26 |
| hsa04914:
Progesterone-mediated oocyte maturation |
1.48×10⁻² | ANAPC1, CDC23,
CDC26 |
|
| B, Module
2 |
|
| Term | P-value | Genes |
|
| hsa03010:
Ribosome |
1.39×10⁻⁹ | RPSA, RPS27, RPS29,
RPL41, RPL13, RPL31, RPL15, FAU, RPL36, RPS15A, RPS20 |
| hsa04062: Chemokine
signaling pathway |
4.75×10⁻⁵ | CXCL1, CCR7, PPBP,
ADCY7, CXCL2, PF4, CCL5, GNG4 |
| hsa03040:
Spliceosome |
5.30×10⁻³ | BCAS2, HNRNPK,
SRSF6, PCBP1, HNRNPU |
| hsa04060:
Cytokine-cytokine receptor interaction |
7.15×10⁻³ | VEGFC, CCR7, PPBP,
PF4, CCL5, TGFB1 |
| hsa03015: mRNA
surveillance pathway |
1.24×10⁻² | PABPN1, PPP2R1A,
UPF2, RNPS1 |
|
| C, Module
3 |
|
| Term | P-value | Genes |
|
| hsa04974: Protein
digestion and absorption |
6.15×10⁻⁹ | COL4A3, COL9A3,
COL4A1, COL1A2, COL2A1, COL5A3 |
| hsa04512:
ECM-receptor interaction |
7.97×10⁻⁷ | COL4A3, COL4A1,
COL1A2, COL2A1, COL5A3 |
| hsa05146:
Amoebiasis |
1.77×10⁻⁶ | COL4A3, COL4A1,
COL1A2, COL2A1, COL5A3 |
| hsa04510: Focal
adhesion |
2.50×10⁻⁵ | COL4A3, COL4A1,
COL1A2, COL2A1, COL5A3 |
| hsa04151: PI3K-Akt
signaling pathway |
1.90×10⁻⁴ | COL4A3, COL4A1,
COL1A2, COL2A1, COL5A3 |
| hsa04611: Platelet
activation |
6.93×10⁻³ | COL1A2, COL2A1,
COL5A3 |
|
| D, Module
4 |
|
| Term | P-value | Genes |
|
| hsa05322: Systemic
lupus erythematosus |
1.58×10⁻⁵ | HIST2H3A,
HIST2H2AA3, H2AFV, HIST1H2BK, H2AFX |
| hsa05034:
Alcoholism |
4.74×10⁻⁵ | HIST2H3A,
HIST2H2AA3, H2AFV, HIST1H2BK, H2AFX |
|
| E, Module
5 |
|
| Term | P-value | Genes |
|
| hsa05323:
Rheumatoid arthritis |
5.45×10⁻³ | CSF2, FOS,
TNFSF11 |
| hsa05200: Pathways
in cancer |
1.19×10⁻² | FOS, FOXO1, FGF13,
SMAD2 |
| hsa04068: FoxO
signaling pathway |
1.23×10⁻² | FOXO1, SMAD2,
IL7R |
| hsa05202:
Transcriptional misregulation in cancer |
1.89×10⁻² | CSF2, FOXO1,
GZMB |
| hsa04060:
Cytokine-cytokine receptor interaction |
3.40×10⁻² | CSF2, TNFSF11,
IL7R |
| hsa05166: Human
T-cell leukemia virus 1 infection |
4.14×10⁻² | CSF2, FOS,
SMAD2 |
|
| F, Module
6 |
|
| Term | P-value | Genes |
|
| hsa04915: Estrogen
signaling pathway |
1.68×10⁻³ | MAPK1, SHC1,
HSPA1B, MMP2 |
| hsa04510: Focal
adhesion |
1.30×10⁻² | MAPK1, PGF, FLT4,
SHC1 |
| hsa04015: Rap1
signaling pathway |
1.37×10⁻² | MAPK1, PGF, FLT4,
ITGAM |
| hsa04014: Ras
signaling pathway |
1.67×10⁻² | MAPK1, PGF, FLT4,
SHC1 |
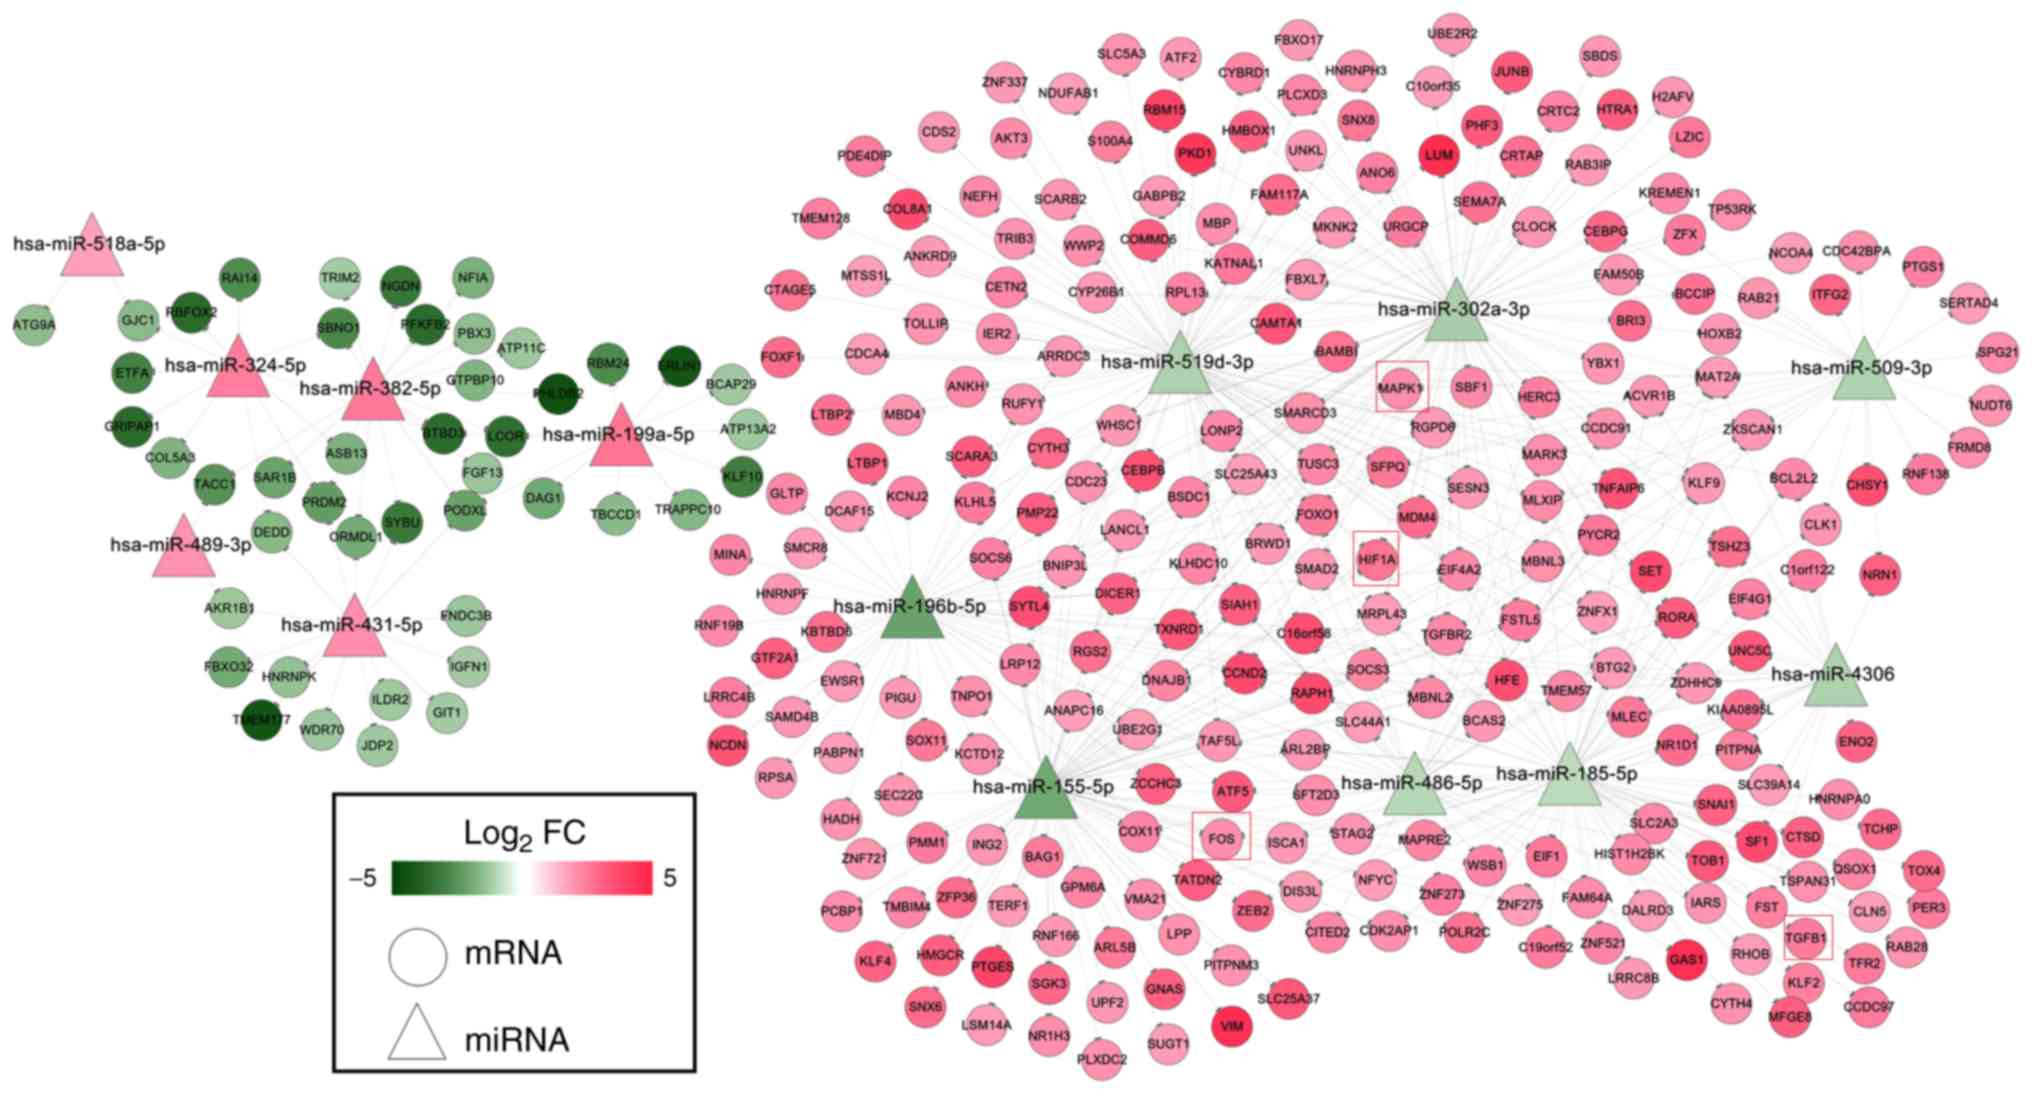
miRNA regulatory network
A total of 305 differentially expressed target genes
were predicted for 14 of the 84 DEMs, which were used to construct
the miRNA-mRNA network (Fig. 3).
This network included 522 negative interaction relationships
between 14 DEMs and 305 DEGs (six upregulated DEMs regulated 45
downregulated DEGs; eight downregulated DEMs regulated 260
upregulated DEGs, such as
hsa-miR-155-5p/hsa-miR-302a-3p/hsa-miR-519d-3p-HIF1A,
hsa-miR-185-5p-TGFB1, hsa-miR-185-5p/hsa-miR-155-5p-FOS and
hsa-miR-509-3p/hsa-miR-519d-3p-MAPK1). Among all of the DEMs in
this miRNA regulatory network, hsa-miR-155-5p was revealed to be
associated with IDD, as determined by searching the HMDD
database.
The underlying functions of the DEGs in the
miRNA-mRNA network were also analyzed by DAVID database. The
results indicated that ‘TGF-beta signaling pathway’ (MAPK1 and
TGFB1), ‘Adherens junction’ (MAPK1), ‘MAPK signaling pathway’
(MAPK1, TGFB1 and FOS), ‘Cell cycle’ (TGFB1), ‘mTOR signaling
pathway’ (MAPK1 and HIF1A), ‘Toll-like receptor signaling pathway’
(MAPK1 and FOS), ‘B cell receptor signaling pathway’ (MAPK1 and
FOS) and ‘T cell receptor signaling pathway’ (MAPK1 and FOS)
pathways were significantly enriched for genes in the miRNA-mRNA
network (Table V).
| Table V.KEGG pathway analysis of genes in
regulatory networks. |
Table V.
KEGG pathway analysis of genes in
regulatory networks.
| A, miRNA-mRNA
network |
|---|
|
|---|
| Term | P-value | Genes |
|---|
| hsa04350: TGF-beta
signaling pathway |
2.02×10⁻⁴ | MAPK1, ACVR1B,
LTBP1, FST, TGFBR2, SMAD2, TGFB1 |
| hsa04120: Ubiquitin
mediated proteolysis |
1.80×10⁻³ | WWP2, SOCS3,
UBE2G1, CDC23, SIAH1, HERC3, UBE2R2 |
| hsa04520: Adherens
junction |
2.98×10⁻³ | MAPK1, ACVR1B,
TGFBR2, SMAD2, SNAI1 |
| hsa04010: MAPK
signaling pathway |
5.07×10⁻³ | MAPK1, FOS, ACVR1B,
TGFBR2, MKNK2, FGF13, AKT3, TGFB1, ATF2 |
| hsa04115: p53
signaling pathway |
8.57×10⁻³ | CCND2, SIAH1, MDM4,
SESN3 |
| hsa00051: Fructose
and mannose metabolism |
9.51×10⁻³ | PFKFB2, AKR1B1,
PMM1 |
| hsa04110: Cell
cycle |
1.24×10⁻² | CCND2, CDC23,
SMAD2, TGFB1, STAG2 |
| hsa04150: mTOR
signaling pathway |
1.89×10⁻² | MAPK1, HIF1A,
AKT3 |
| hsa04620: Toll-like
receptor signaling pathway |
2.02×10⁻² | MAPK1, FOS, TOLLIP,
AKT3 |
| hsa04662: B cell
receptor signaling pathway |
3.20×10⁻² | MAPK1, FOS,
AKT3 |
| hsa04660: T cell
receptor signaling pathway |
4.97×10⁻² | MAPK1, FOS,
AKT3 |
|
| B, lncRNA-ceRNA
network |
|
| Term | P-value | Genes |
|
| hsa04350: TGF-beta
signaling pathway |
2.36×10⁻⁴ | ACVR1B, MAPK1,
LTBP1, FST, TGFBR2, SMAD2, BAMBI, TGFB1 |
| hsa04068: FoxO
signaling pathway |
8.21×10⁻⁴ | MAPK1, SGK3, CCND2,
TGFBR2, FOXO1, SMAD2, KLF2, TGFB1, AKT3 |
| hsa04668: TNF
signaling pathway |
2.07×10⁻² | MAPK1, FOS, CEBPB,
SOCS3, AKT3, ATF2 |
| hsa04931: Insulin
resistance |
2.22×10⁻² | SOCS3, TRIB3,
FOXO1, MLXIP, AKT3, NR1H3 |
| hsa05202:
Transcriptional misregulation in cancer |
3.90×10⁻² | CEBPB, CCND2,
TGFBR2, FOXO1, WHSC1, PBX3, EWSR1 |
|
| C, circRNA-ceRNA
network |
|
| Term | P-value | Genes |
|
| hsa04350: TGF-beta
signaling pathway |
4.18×10⁻⁴ | MAPK1, ACVR1B,
LTBP1, FST, TGFBR2, SMAD2, TGFB1 |
| hsa04520: Adherens
junction |
1.11×10⁻² | MAPK1, ACVR1B,
TGFBR2, SMAD2, SNAI1 |
| hsa04120: Ubiquitin
mediated proteolysis |
1.93×10⁻² | SOCS3, UBE2G1,
CDC23, SIAH1, HERC3, UBE2R2 |
| hsa04115: p53
signaling pathway |
4.19×10⁻² | CCND2, SIAH1, MDM4,
SESN3 |
| hsa04110: Cell
cycle |
4.53×10⁻² | CCND2, CDC23,
SMAD2, TGFB1, STAG2 |
| hsa05220: Chronic
myeloid leukemia |
4.53×10⁻² | MAPK1, ACVR1B,
TGFBR2, TGFB1 |
| hsa04010: MAPK
signaling pathway |
4.82×10⁻² | MAPK1, FOS, ACVR1B,
TGFBR2, MKNK2, FGF13, TGFB1 |
|
| D, Integrated
ceRNA network |
|
| Term | P-value | Genes |
|
| hsa04350: TGF-beta
signaling pathway |
7.61×10⁻⁴ | ACVR1B, LTBP1, FST,
TGFBR2, SMAD2, TGFB1 |
| hsa04068: FoxO
signaling pathway |
5.92×10⁻³ | CCND2, TGFBR2,
FOXO1, SMAD2, KLF2, TGFB1 |
| hsa05202:
Transcriptional misregulation in cancer |
1.49×10⁻² | CCND2, TGFBR2,
FOXO1, WHSC1, PBX3, EWSR1 |
| hsa04144:
Endocytosis |
4.72×10⁻² | TGFBR2, CYTH4,
RUFY1, SMAD2, CYTH3, TGFB1 |
| hsa04110: Cell
cycle |
4.92×10⁻² | CCND2, SMAD2,
TGFB1, STAG2 |
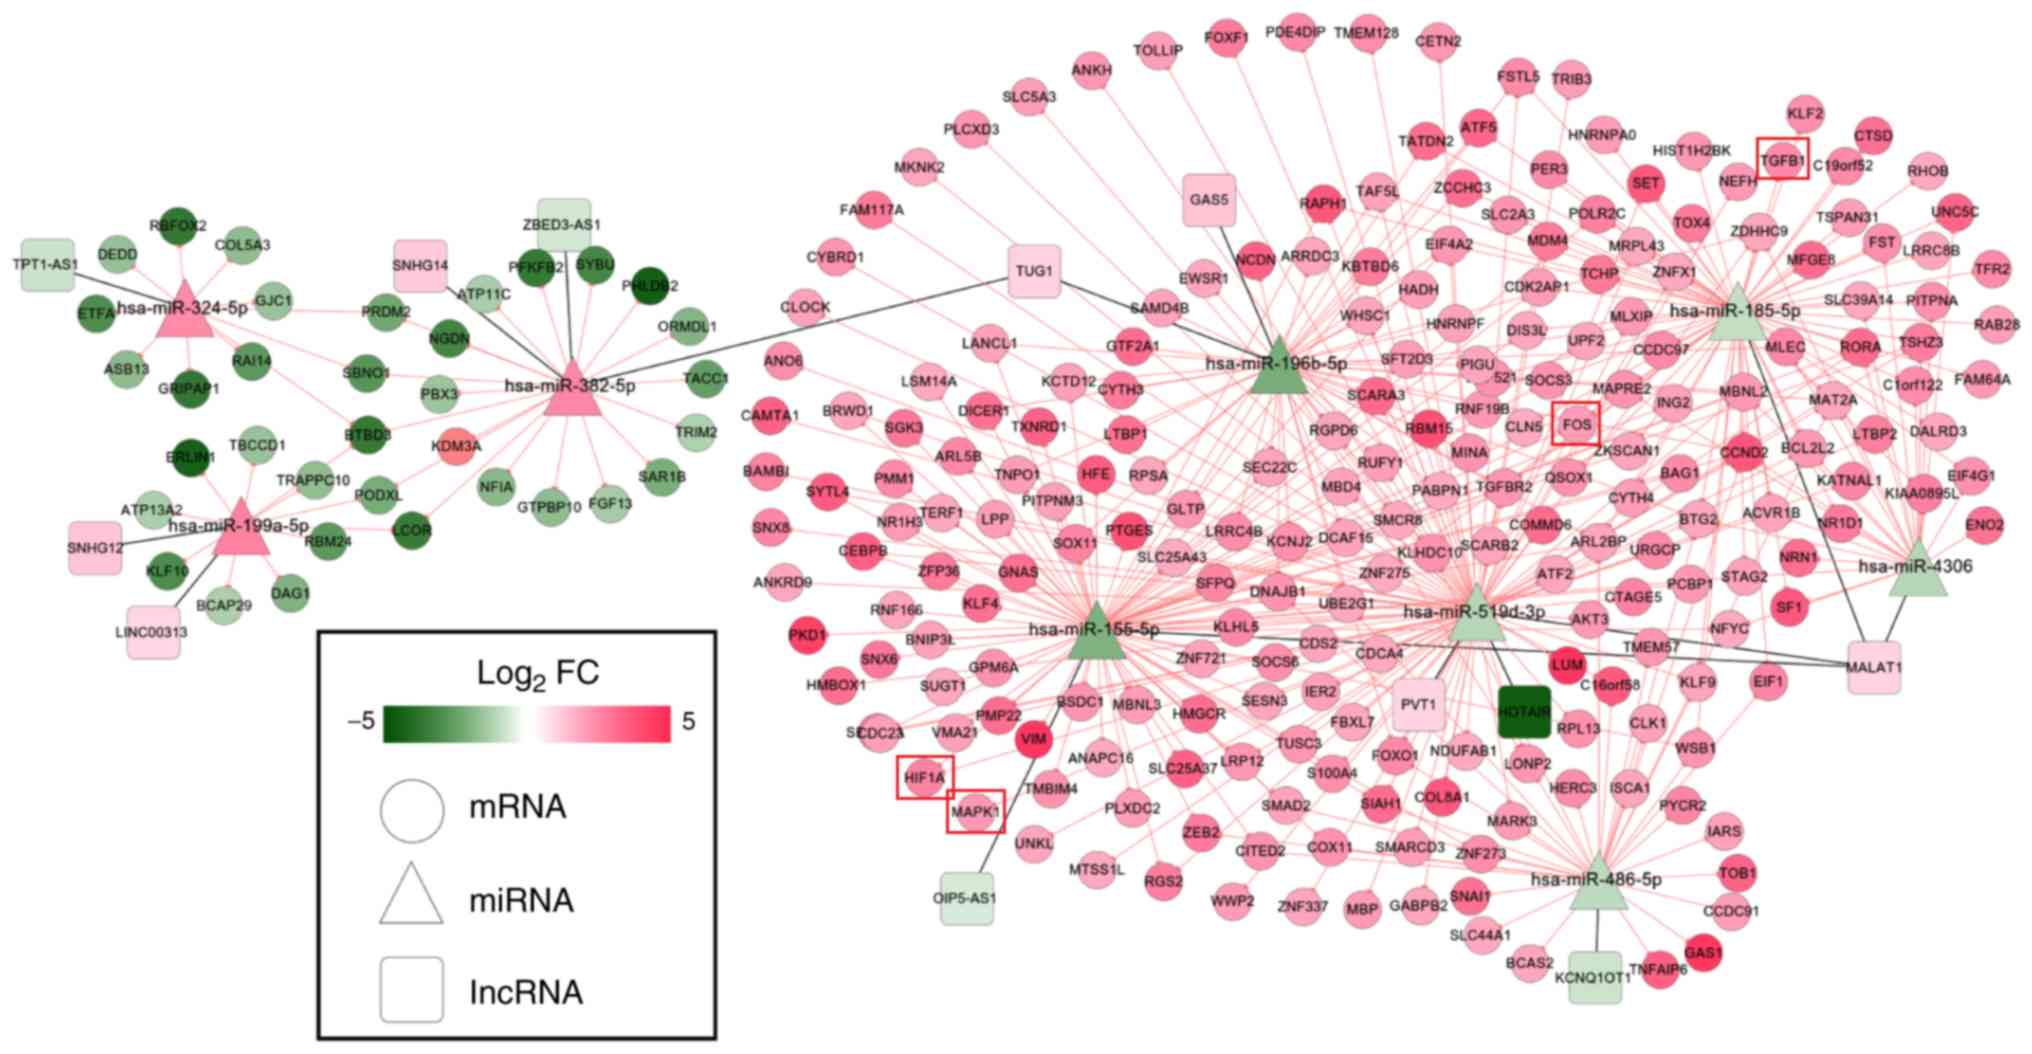
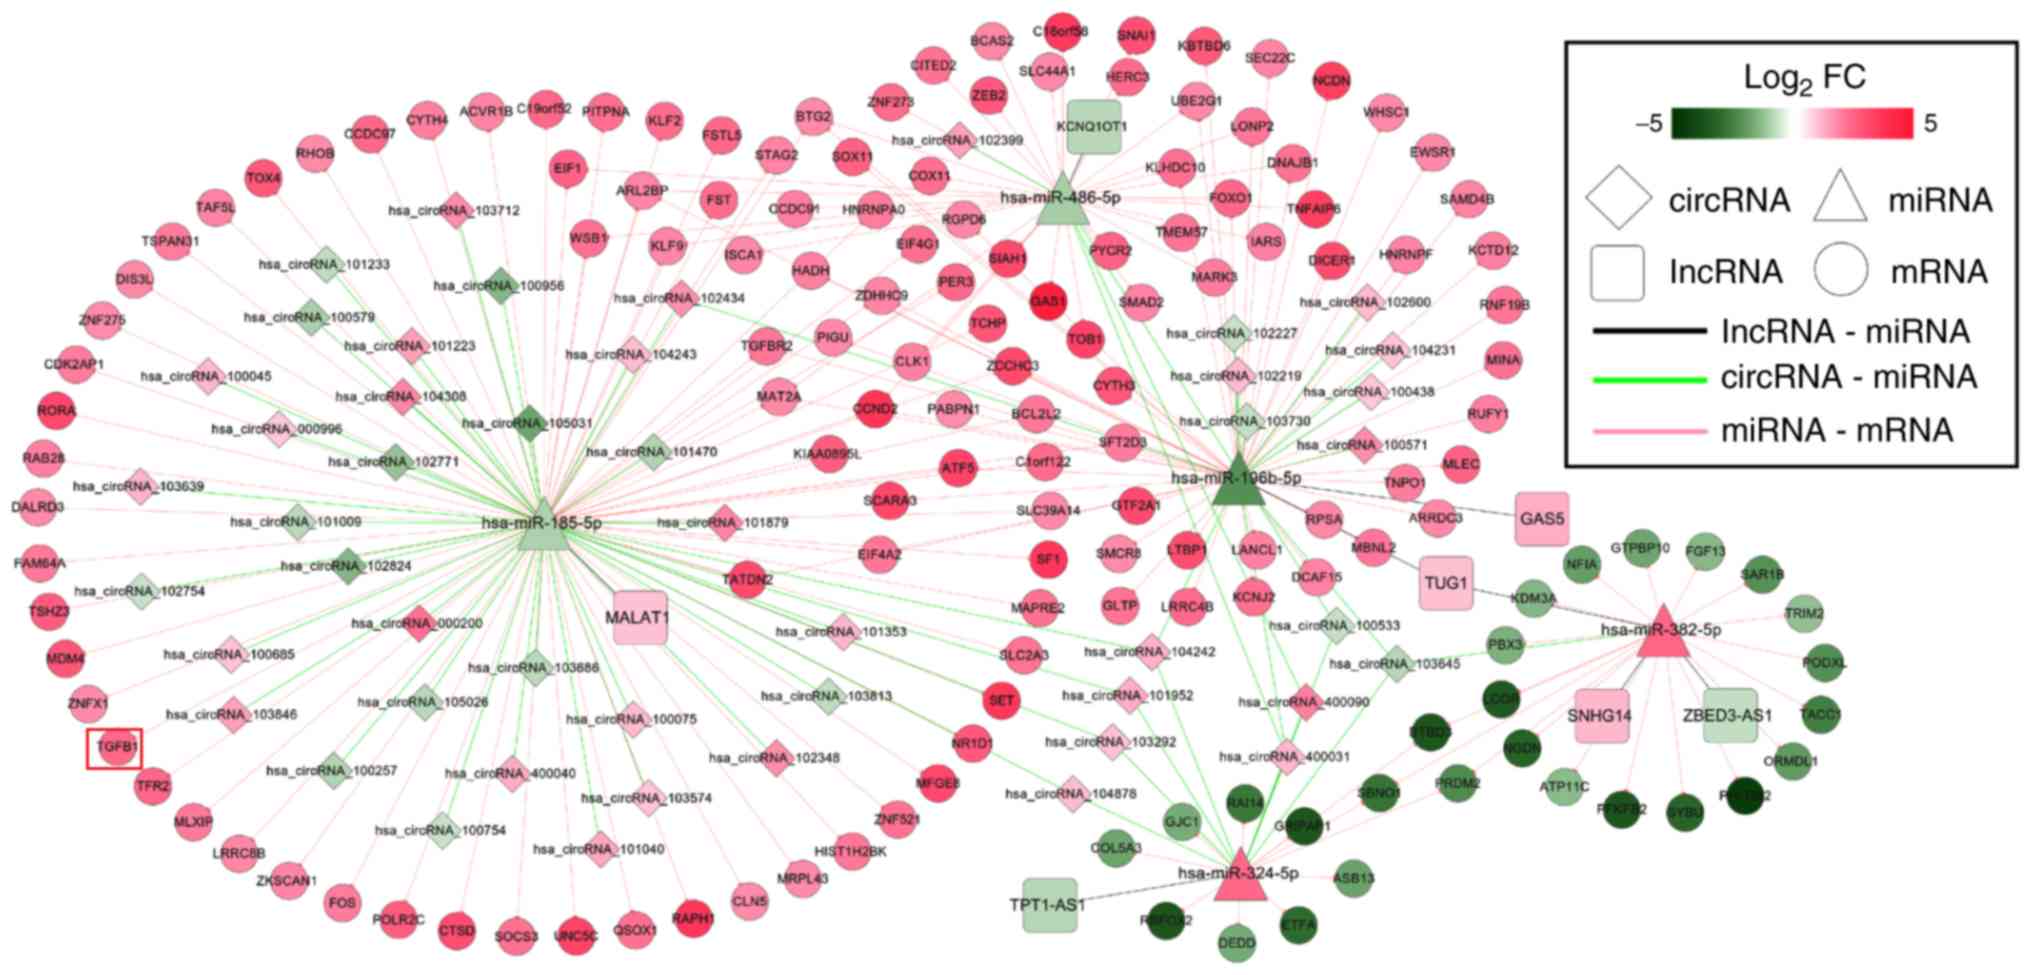
CeRNA network
Using the starBase database, nine DEMs were
predicted to regulate 12 DELs; this was used to establish the
lncRNA-miRNA-mRNA ceRNA network via integration with the miRNA-mRNA
network (Fig. 4). This network
comprised 280 nodes (nine DEMs; 12 DELs; 259 DEGs) and 407
interactions (16 DEL-DEM and 391 DEM-DEG interactions). Notably,
upregulated metastasis-associated lung adenocarcinoma transcript 1
(MALAT1) may function as a ceRNA to suppress the inhibitory effects
of hsa-miR-155-5p on HIF1A and FOS, thus leading to their
upregulated expression. Similarly, upregulated MALAT1 may regulate
the targeted effects of hsa-miR-185-5p on TGFB1 and FOS, as well as
hsa-miR-519d-3p on HIF1A and MAPK1. The functional analysis of
genes in the lncRNA-associated ceRNA network were significantly
enriched in ‘TGF-beta signaling pathway’, ‘FoxO signaling pathway’
and ‘TNF signaling pathway’ (Table
V); MAPK1, FOS and TGFB1 were each included in at least one of
these pathways.
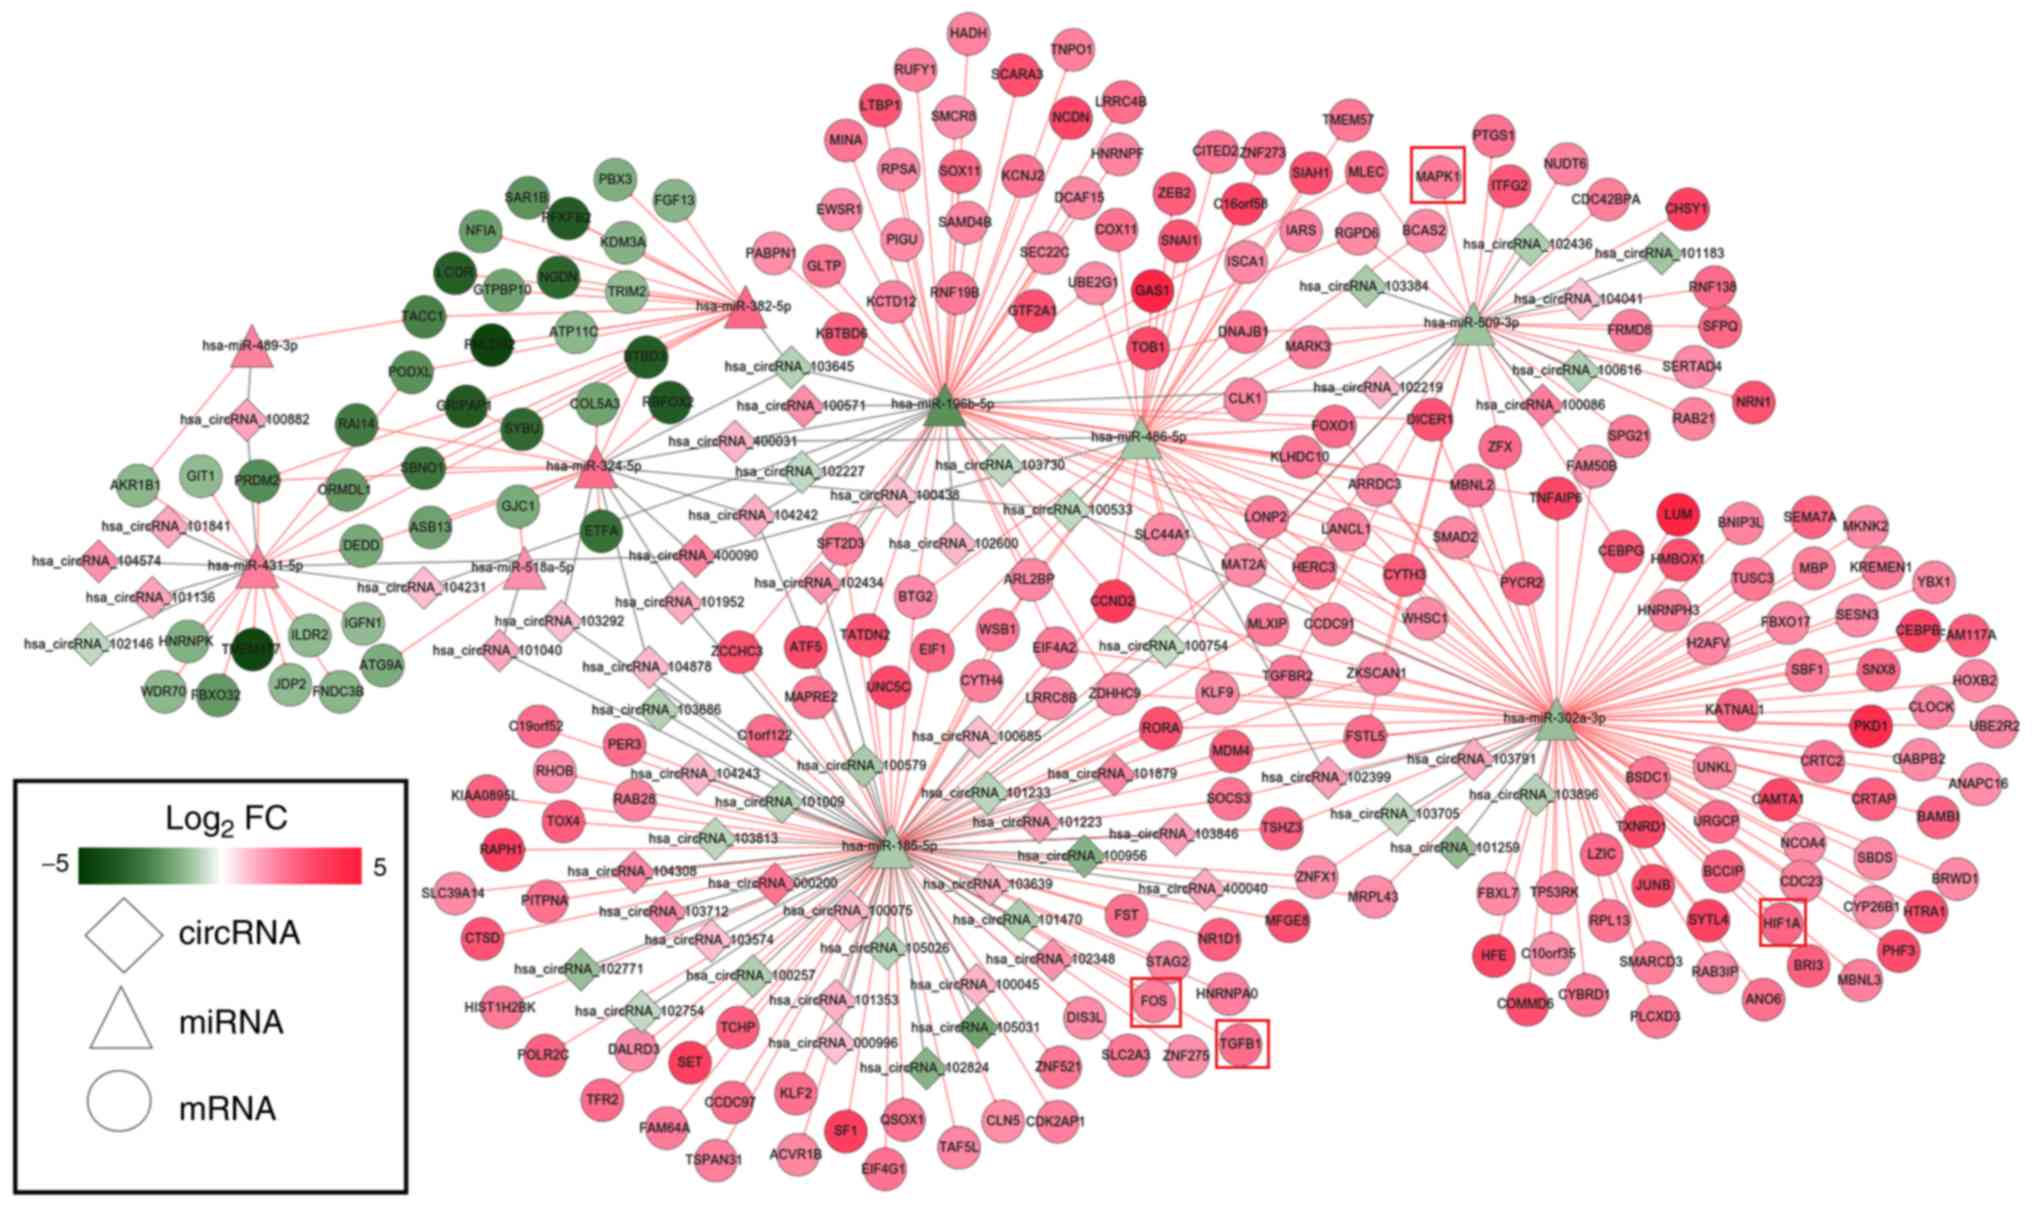
Using the miRanda database, 61 DEMs were predicted
to regulate 63 DECs; this information was used to establish the
circRNA-miRNA-mRNA ceRNA network via integration with the
miRNA-mRNA network (Fig. 5).
Notably, upregulated hsa_circRNA_102348 may function as a ceRNA to
suppress the inhibitory effects of hsa-miR-185-5p on TGFB1 and FOS,
thus resulting in their upregulated expression; upregulated
hsa_circRNA_102399 may act as a ceRNA to regulate the
hsa-miR-302a-3p-HIF1A interaction; hsa_circRNA_100086 may influence
the regulatory effect of hsa-miR-509-3p on MAPK1.
hsa_circRNA_102348 was selected because it has previously been
studied in other diseases (28).
In addition, hsa_circRNA_102399 (score threshold, 92%) and
hsa_circRNA_100086 (score threshold, 90%) may be important in IDD,
because they interacted with their miRNAs with the highest score
thresholds and the expression trend of these circRNAs was opposite
to that of their target miRNAs. Functional analysis of genes in the
circRNA-related ceRNA network revealed that they were significantly
enriched in ‘TGF-beta signaling pathway’ and ‘MAPK signaling
pathway’; MAPK1, TGFB1 and FOS were each included in at least one
of these pathways (Table V).
Through analysis of the lncRNA and circRNA ceRNA
networks, it was revealed that hsa-miR-185-5p, hsa-miR-486-5p,
hsa-miR-196b-5p, hsa-miR-382-5p and hsa-miR-324-5p were included in
both; therefore, a lncRNA/circRNA-miRNA-mRNA integrated network was
also established (Fig. 6), in
which hsa-miR-185-5p-TGFB1-associated ceRNA axes may be
particularly important because TGFB1 was enriched in most of the
KEGG pathways for this network (Table
V).
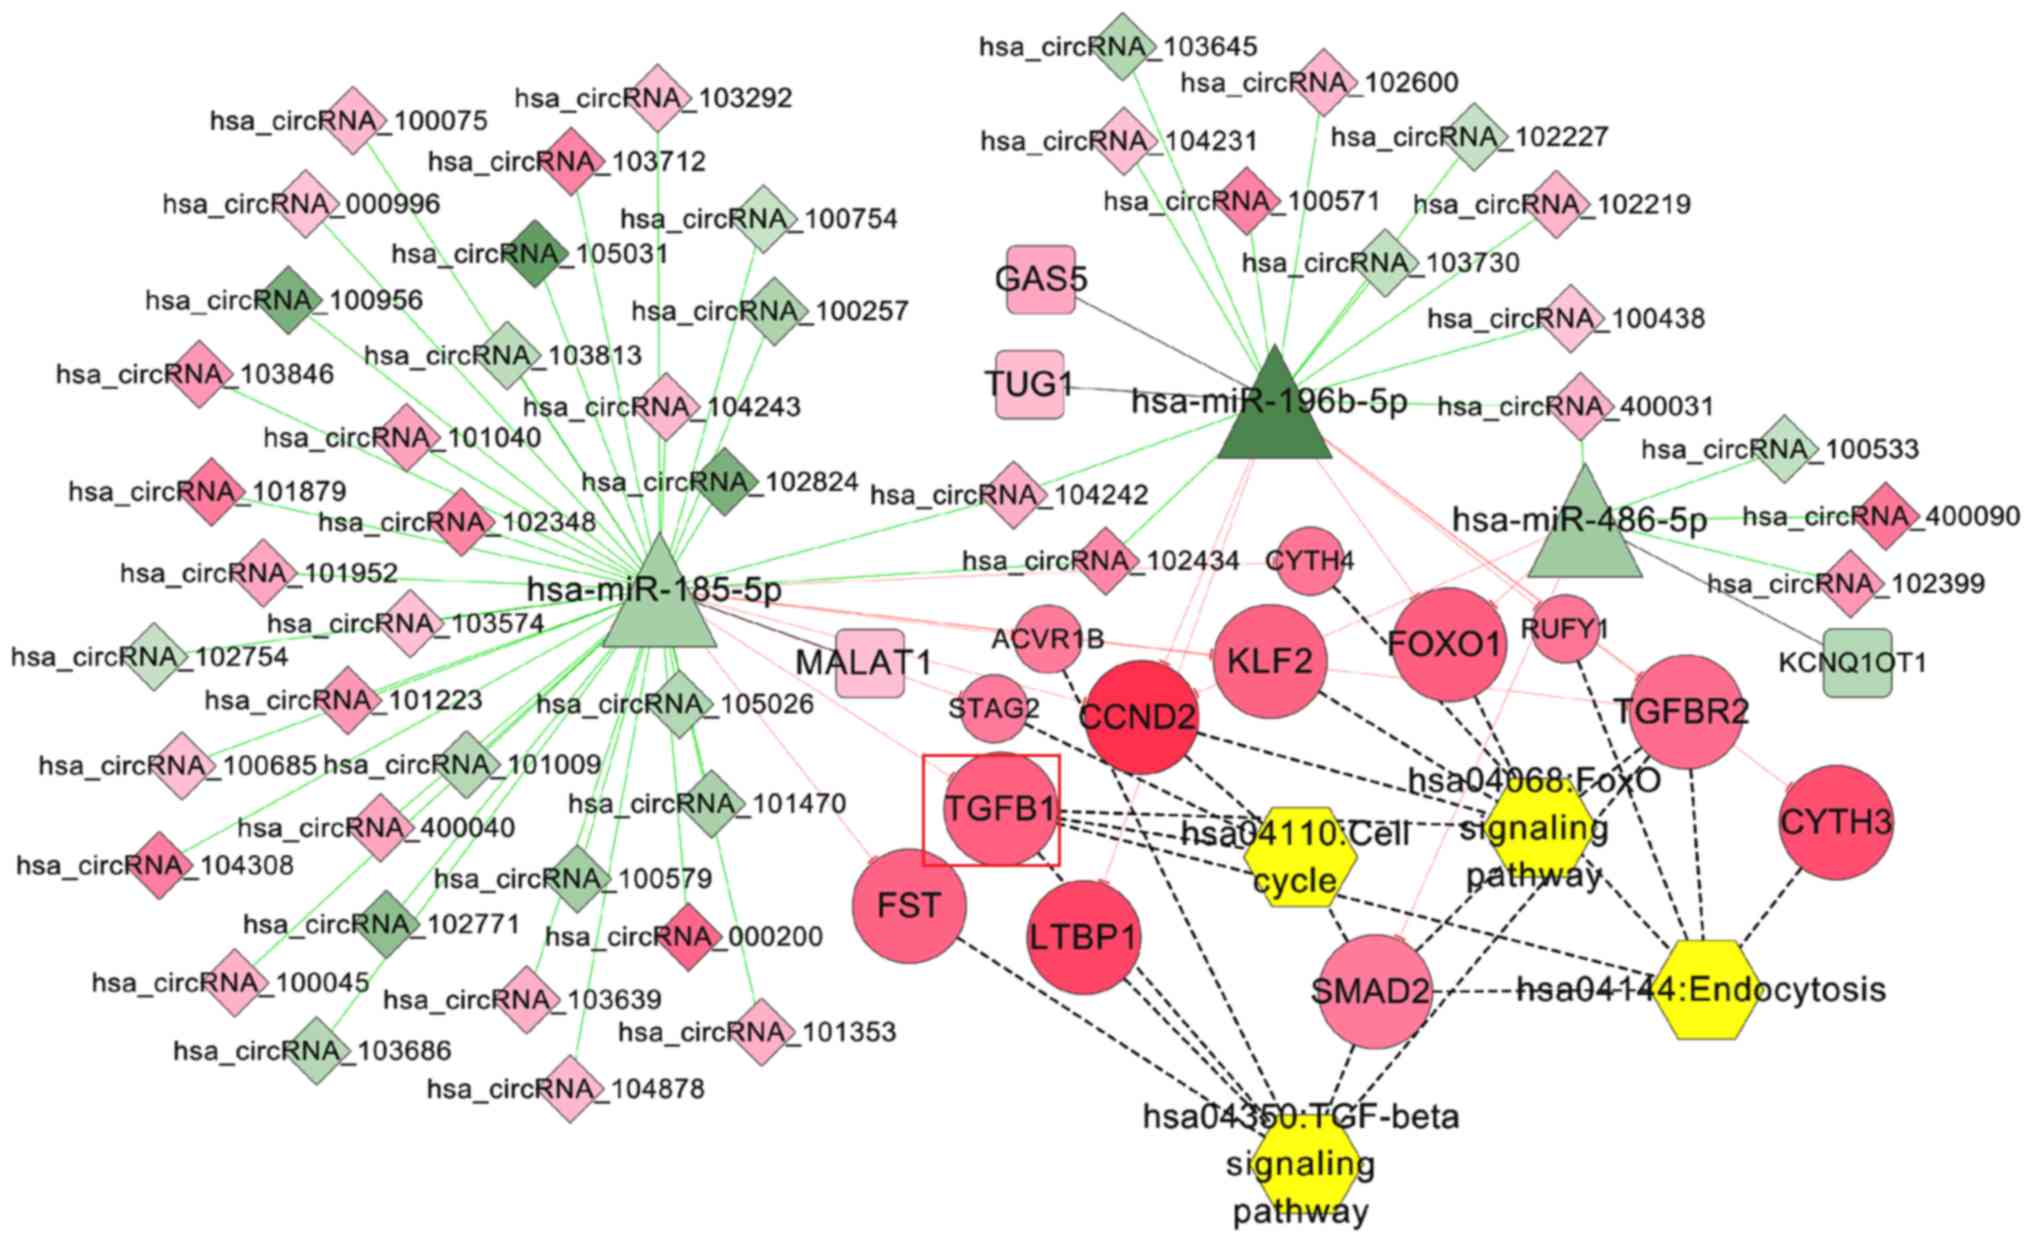
IDD pathway-related ceRNA network
Using ‘intervertebral disc degeneration’ as the key
search term, 30 KEGG pathways were screened from the CTD database;
four pathways were overlapped with those enriched for genes in the
integrated ceRNA network, including ‘TGF-beta signaling pathway’,
‘FoxO signaling pathway’, ‘Endocytosis’ and ‘Cell cycle’. The
pathway-related genes were extracted to construct the IDD
pathway-related ceRNA network (Fig.
7), in which the hsa_circRNA_102348/MALAT1-hsa-miR-185-5p-TGFB1
ceRNA axes were contained.
Discussion
The present study identified FOS, MAPK1, HIF1A and
TGFB1 as crucial genes in IDD, as determined by topological feature
analysis of genes in a PPI network and module screening.
Subsequently, by constructing a ceRNA network, it was suggested
that the upregulated lncRNA MALAT1 may be particularly important
for IDD, as it may function as a ceRNA for downregulating
hsa-miR-155-5p, hsa-miR-185-5p and hsa-miR-519d-3p expression, thus
leading to the upregulation of FOS, TGFB1, HIF1A and MAPK1,
respectively. In addition, upregulated hsa_circRNA_102348,
hsa_circRNA_102399 and hsa_circRNA_100086 may function as ceRNAs to
block the inhibitory effects of hsa-miR-185-5p, hsa-miR-302a-3p and
hsa-miR-509-3p on the expression levels of TGFB1/FOS, HIF1A and
MAPK1, respectively. MAPK1 and FOS may be involved in IDD by
influencing the MAPK pathway, thus affecting inflammatory pathways.
KEGG analysis suggested that TGFB1 participated in IDD by affecting
‘TGF-beta signaling pathway’, ‘Cell cycle’ and ‘Cytokine-cytokine
interaction’, whereas HIF1A may be associated with ‘mTOR signaling
pathway’.
It has been reported that TGFB promotes NP cell
proliferation and stimulates ECM synthesis (11). Therefore, overexpression of TGFB
may have the potential to inhibit IDD and exert therapeutic
effects; this has been demonstrated in several in vivo
studies (29,30). Further studies have indicated that
TGFB exerts anabolic effects on intervertebral discs by
antagonizing inflammation (31,32).
Furthermore, Zhang et al (33) reported that the expression levels
of TGFB1 and C-C motif chemokine ligand (CCL)3/4 are elevated in
degenerative NP tissue. TGFB1 treatment significantly inhibits CCL4
expression and prevents pain development in a rat model of IDD;
this effect is dependent on the extracellular signal-regulated
kinase 1/2 (ERK1/2) signaling pathway. Yang et al (34,35)
observed that the inflammatory cytokine tumor necrosis factor
(TNF)-α induces high expression of syndecan-4 in NP cells, which is
required for MMP3 activation to trigger the progression of IDD.
TGFB1 suppresses TNF-α-mediated upregulation of syndecan-4 and MMP3
via ERK1/2 signaling pathways. In the present study, TGFB1 was
significantly upregulated in patients with IDD compared with in
control individuals. This may be representative of the inflammatory
activity present in IDD, and TGFB1 expression may be increased as
an inflammatory stress response to antagonize inflammation
(36); this was also indirectly
reflected by the lower expression of several TGFB1-associated
inflammatory genes, including C-X-C motif chemokine ligand (CXCL)1
and CXCL2 in this study. However, to the best of our knowledge, the
regulatory mechanisms of TGFB1 in IDD have not been explored.
The present study revealed that hsa-miR-185-5p may
regulate the expression of TGFB1, whereas MALAT1 and
hsa_circRNA_102348 may function as ceRNAs to interact with
hsa-miR-185-5p. To the best of our knowledge, no previous studies
have investigated the roles of hsa-miR-185-5p, MALAT1 and
hsa_circRNA_102348 in IDD. However, their known mechanisms in
regulating cell proliferation in other diseases may indirectly
explain their roles in IDD. Notably, Cheng et al (37) demonstrated that miR-185 inhibits
cell proliferation, while promoting apoptosis and autophagy through
negative regulation of TGFB1 in nasopharyngeal carcinoma. miR-185
mimics have been observed to exert inhibitory effects on
osteoblasts through downregulating the Wnt/β-catenin axis (38). Li et al (39) demonstrated that MALAT1 promotes
proliferation of cardiac progenitor cells under hypoxic conditions
and alleviates myocardial infarction-induced heart failure.
Furthermore, Li et al (40)
revealed that MALAT1 promotes osteosarcoma cell growth and predicts
an unfavorable outcome. Hereby, it was hypothesized that miR-185
may be downregulated and MALAT1 may be upregulated in IDD; this
hypothesis was confirmed by the present results. Although, to the
best of our knowledge, no experimental study has been conducted to
validate the roles of hsa_circRNA_102348, its expression has been
demonstrated to be upregulated in idiopathic pulmonary fibrosis
(28); this is characterized by
the abnormal deposition of ECM proteins. Therefore, the expression
of hsa_circRNA_102348 may also be upregulated in IDD.
Hypoxia has been reported to promote disc cell
proliferation (41). HIF1A is an
important response gene under hypoxic and inflammatory conditions,
which is upregulated in NP cells (42). Overexpression of HIF1A has been
demonstrated to promote NP cell proliferation and lead to increased
expression levels of collagen II and aggrecan in human NP cells
(8,43). Therefore, upregulation of HIF1A may
be a protective strategy to antagonize degenerative intervertebral
discs (44). In line with Wang
et al (8), which reported
that HIF1A was highly expressed in IDD and may exert a protective
response against IDD, the mRNA expression of HIF1A was
significantly upregulated in patients with IDD compared with in
control individuals in the present study. However, whether HIF1A
also causes the damage observed in IDD remains unclear and requires
further investigation. Furthermore, the present study demonstrated
that hsa-miR-155-5p and hsa-miR-302a-3p could regulate HIF1A
expression. MALAT1 could sponge hsa- miR-155-5p, whereas
hsa_circRNA_102399 could sponge hsa-miR-302a-3p. Although their
interaction mechanisms have not been analyzed in IDD, the roles of
some miRNAs and lncRNAs have been confirmed in IDD and other
diseases. For example, Wang et al (45) and Ye et al (46) demonstrated that miR-155 is
downregulated in degenerative NP by microarray analysis; this was
confirmed by reverse transcription-quantitative polymerase chain
reaction. Zhang et al (47)
demonstrated that upregulation of MALAT1 restrains IDD through
suppressing inflammation and NP apoptosis, and promoting cell
proliferation (47). Using gain-
and loss-of-function experiments, miR-155 downregulation has been
revealed to be mediated by MALAT1 (48), whereas miR-155 has also been
demonstrated to directly target and silence HIF1A (49).
FOS is a member of the AP-1 transcription factor
family, which has been demonstrated to be associated with numerous
cellular processes, such as inhibition of chondrocyte
differentiation (50), whereas
chondrocyte transplantation has been proved to be a feasible and
biologically relevant technique to repair disc damage and retard
disc degeneration (51,52). Therefore, it was hypothesized that
upregulated expression of FOS may be a risk factor that promotes
the development of IDD. This hypothesis has been confirmed by a
recent study, which used the AP-1 selective inhibitor T-5224 to
demonstrate that inhibition of c-Fos/AP-1 prevents disc
degeneration and associated pain (53). As an inflammatory response gene
(54), FOS was revealed to be
upregulated in this study. Similar to TGFB1, hsa-miR-185-5p was
shown to regulate the expression of FOS. Furthermore, MALAT1 and
hsa_circRNA_102348 could sponge hsa-miR-185-5p.
Degeneration of the intervertebral disc can be
mediated by several pathways. Among them, the MAPK pathways
(including JNK, ERK and p38 MAPK) have garnered extensive
attention. It has been reported that blockade of p38 using Sb
202190 in NP cells can diminish the production of factors
associated with inflammation, pain, and disc catabolism, and slow
the course of IDD (55).
Furthermore, Carthamin yellow has been suggested as a promising
preventative or therapeutic drug for IDD via suppression of the
MAPK pathway (56), whereas
Resistin mediates enhanced ECM degradation in IDD by activation of
p38 MAPK (57). Accumulating
evidence has demonstrated that TGFB1 (34,35)
and FOS (58) may exert roles via
activation of the MAPK pathways in NP cells. In line with these
studies, MAPK1 was highly expressed in NP samples from patients
with IDD patients in this study. Furthermore, the present study
demonstrated that MALAT1 could sponge hsa-miR-519d-3p to promote
the expression of MAPK1, and hsa_circRNA_100086 could sponge
hsa-miR-509-3p to upregulate MAPK1. The findings of the present
study were indirectly confirmed by a previous study in osteosarcoma
cells, in which MALAT1 was reported to promote osteosarcoma cell
growth through the inhibition of miR-509, which leads to activation
of the Rac1/JNK pathway (59).
There are some limitations to the present study.
Firstly, the sample size was not large. An additional validation
cohort should be included in further studies to analyze the
expression of these identified lncRNAs, circRNAs, miRNAs and mRNAs.
Secondly, this is a preliminary screening study and further
experimental investigations are required to validate the
interactions in the identified ceRNA axes in IDD.
In conclusion, the present study identified several
lncRNA/circRNA-miRNA-mRNA interaction axes
(MALAT1/hsa_circRNA_102348-hsa-miR-185-5p- TGFB1/FOS,
MALAT1-hsa-miR-155-5p-HIF1A,
hsa_circRNA_102399-hsa-miR-302a-3p-HIF1A,
MALAT1-hsa-miR-519d-3p-MAPK1 and
hsa_circRNA_100086-hsa-miR-509-3p-MAPK1), which may be crucial for
treatment of IDD. Clinical, in vitro and in vivo
experiments will be performed in future to validate the expression
patterns and interactions identified in this study in IDD.
Acknowledgements
Not applicable.
Funding
The present study was supported by the National
Natural Science Foundation of China (grant no. 81601898).
Availability of data and materials
The datasets generated and/or analyzed during the
present study are available in the Gene Expression Omnibus
repository, https://www.ncbi.nlm.nih.gov/geo/query/acc.cgi?acc=GSE67567.
Authors' contributions
JWZ, XLZ and DJH contributed to the concept and the
design of the study. WJG acquired the data. JWZ, XLZ and HMH
conducted the statistical analysis. XDW and DJH were involved with
interpretation of the data. JWZ and XLZ drafted the manuscript. DJH
revised the manuscript. All authors read and approved the final
manuscript.
Ethics approval and consent to
participate
Not applicable.
Patient consent for publication
Not applicable.
Competing interests
The authors declare that they have no competing
interests.
References
|
1
|
Gore M, Sadosky A, Stacey BR, Tai KS and
Leslie D: The burden of chronic low back pain: Clinical
comorbidities, treatment patterns, and health care costs in usual
care settings. Spine (Phila Pa 1976). 37:E668–E677. 2012.
View Article : Google Scholar : PubMed/NCBI
|
|
2
|
Lee CK and Langrana NA: A review of spinal
fusion for degenerative disc disease: Need for alternative
treatment approach of disc arthroplasty? Spine J 4 (6 Suppl).
173S–176S. 2004.
|
|
3
|
Konovalov NA, Nazarenko AG, Asyutin DS,
Zelenkov PV, Onoprienko RA, Korolishin VA, Cherkiev IU, Martynova
MA, Zakirov BA, Timonin SY, et al: Modern treatments for
degenerative disc diseases of the lumbosacral spine. A literature
review. Zh Vopr Neirokhir Im N N Burdenko. 80:102–108. 2016.(In
Russian). View Article : Google Scholar
|
|
4
|
Santosh B, Varshney A and Yadava PK:
Non-coding RNAs: Biological functions and applications. Cell
Biochem Funct. 33:14–22. 2015. View
Article : Google Scholar : PubMed/NCBI
|
|
5
|
Hausser J and Zavolan M: Identification
and consequences of miRNA-target interactions-beyond repression of
gene expression. Nat Rev Genet. 15:599–612. 2014. View Article : Google Scholar : PubMed/NCBI
|
|
6
|
Salmena L, Poliseno L, Tay Y, Kats L and
Pandolfi PP: A ceRNA hypothesis: The Rosetta Stone of a hidden RNA
language? Cell. 146:353–358. 2011. View Article : Google Scholar : PubMed/NCBI
|
|
7
|
Xi Y, Jiang T, Wang W, Yu J, Wang Y, Wu X
and He Y: Long non-coding HCG18 promotes intervertebral disc
degeneration by sponging miR-146a-5p and regulating TRAF6
expression. Sci Rep. 7:132342017. View Article : Google Scholar : PubMed/NCBI
|
|
8
|
Wang X, Lv G, Li J, Wang B, Zhang Q and Lu
C: LncRNA-RP11-296A18.3/miR-138/HIF1A pathway regulates the
proliferation ECM synthesis of human nucleus pulposus cells
(HNPCs). J Cell Biochem. 118:4862–4871. 2017. View Article : Google Scholar : PubMed/NCBI
|
|
9
|
Wang H, He P, Pan H, Long J, Wang J, Li Z,
Liu H, Jiang W and Zheng Z: Circular RNA circ-4099 is induced by
TNF-α and regulates ECM synthesis by blocking miR-616-5p inhibition
of Sox9 in intervertebral disc degeneration. Exp Mol Med.
50:272018. View Article : Google Scholar : PubMed/NCBI
|
|
10
|
Cheng X, Zhang L, Zhang K, Zhang G, Hu Y,
Sun X, Zhao C, Li H, Li YM and Zhao J: Circular RNA VMA21 protects
against intervertebral disc degeneration through targeting miR-200c
and X linked inhibitor-of-apoptosis protein. Ann Rheum Dis.
77:770–779. 2018. View Article : Google Scholar : PubMed/NCBI
|
|
11
|
Qu Z, Quan Z, Zhang Q, Wang Z, Song Q,
Zhuang X, Fu C, Xu F, Liu Y, Wang Y, et al: Comprehensive
evaluation of differential lncRNA and gene expression in patients
with intervertebral disc degeneration. Mol Med Rep. 18:1504–1512.
2018.PubMed/NCBI
|
|
12
|
Lan PH, Liu ZH, Pei YJ, Wu ZG, Yu Y, Yang
YF, Liu X, Che L, Ma CJ, Xie YK, et al: Landscape of RNAs in human
lumbar disc degeneration. Oncotarget. 7:63166–63176. 2016.
View Article : Google Scholar : PubMed/NCBI
|
|
13
|
Liu X, Che L, Xie YK, Hu QJ, Ma CJ, Pei
YJ, Wu ZG, Liu ZH, Fan LY and Wang HQ: Noncoding RNAs in human
intervertebral disc degeneration: An integrated microarray study.
Genom Data. 5:80–81. 2015. View Article : Google Scholar : PubMed/NCBI
|
|
14
|
Wan ZY, Song F, Sun Z, Chen YF, Zhang WL,
Samartzis D, Ma CJ, Che L, Liu X, Ali MA, et al: Aberrantly
expressed long noncoding RNAs in human intervertebral disc
degeneration: A microarray related study. Arthritis Res Ther.
16:4652014. View Article : Google Scholar : PubMed/NCBI
|
|
15
|
Ritchie ME, Phipson B, Wu D, Hu Y, Law CW,
Shi W and Smyth GK: limma powers differential expression analyses
for RNA-sequencing and microarray studies. Nucleic Acids Res.
43:e472015. View Article : Google Scholar : PubMed/NCBI
|
|
16
|
Thissen D, Steinberg L and Kuang D: Quick
and easy implementation of the benjamini-hochberg procedure for
controlling the false positive rate in multiple comparisons. J Educ
Behav Stat. 27:77–83. 2002. View Article : Google Scholar
|
|
17
|
Kohl M, Wiese S and Warscheid B:
Cytoscape: Software for visualization and analysis of biological
networks. Methods Mol Biol. 696:291–303. 2011. View Article : Google Scholar : PubMed/NCBI
|
|
18
|
Szklarczyk D, Franceschini A, Wyder S,
Forslund K, Heller D, Huerta-Cepas J, Simonovic M, Roth A, Santos
A, Tsafou KP, et al: STRING v10: Protein-protein interaction
networks, integrated over the tree of life. Nucleic Acids Res 43
(Database Issue). D447–D452. 2015. View Article : Google Scholar
|
|
19
|
Tang Y, Li M, Wang J, Pan Y and Wu FX:
CytoNCA: A cytoscape plugin for centrality analysis and evaluation
of protein interaction networks. Biosystems. 127:67–72. 2015.
View Article : Google Scholar : PubMed/NCBI
|
|
20
|
Bader GD and Hogue CW: An automated method
for finding molecular complexes in large protein interaction
networks. BMC Bioinformatics. 4:22003. View Article : Google Scholar : PubMed/NCBI
|
|
21
|
Li JH, Liu S, Zhou H, Qu LH and Yang JH:
starBase v2.0: Decoding miRNA-ceRNA, miRNA-ncRNA and protein-RNA
interaction networks from large-scale CLIP-Seq data. Nucleic Acids
Res 42 (Database Issue). D92–D97. 2014. View Article : Google Scholar
|
|
22
|
Li Y, Qiu C, Tu J, Geng B, Yang J, Jiang T
and Cui Q: HMDD v2.0: A database for experimentally supported human
microRNA and disease associations. Nucleic Acids Res 42 (Database
Issue). D1070–D1074. 2014. View Article : Google Scholar
|
|
23
|
Glažar P, Papavasileiou P and Rajewsky N:
CircBase: A database for circular RNAs. RNA. 20:1666–1670. 2014.
View Article : Google Scholar : PubMed/NCBI
|
|
24
|
Kozomara A and Griffiths-Jones S: miRBase:
Annotating high confidence microRNAs using deep sequencing data.
Nucleic Acids Res 42 (Database Issue). D68–D73. 2014. View Article : Google Scholar
|
|
25
|
Betel D, Koppal A, Agius P, Sander C and
Leslie C: Comprehensive modeling of microRNA targets predicts
functional non-conserved and non-canonical sites. Genome Biol.
11:R902010. View Article : Google Scholar : PubMed/NCBI
|
|
26
|
Huang da W, Sherman BT and Lempicki RA:
Systematic and integrative analysis of large gene lists using DAVID
bioinformatics resources. Nat Protoc. 4:44–57. 2009. View Article : Google Scholar : PubMed/NCBI
|
|
27
|
Davis AP, Grondin CJ, Johnson RJ, Sciaky
D, King BL, McMorran R, Wiegers J, Wiegers TC and Mattingly CJ: The
comparative toxicogenomics database: Update 2017. Nucleic Acids
Res. 45(D1): D972–D978. 2017. View Article : Google Scholar : PubMed/NCBI
|
|
28
|
Li R, Wang Y, Song X, Sun W, Zhang J, Liu
Y, Li H, Meng C, Zhang J, Zheng Q and Lv C: Potential regulatory
role of circular RNA in idiopathic pulmonary fibrosis. Int J Mol
Med. 42:3256–3268. 2018.PubMed/NCBI
|
|
29
|
Liu Y, Yu T, Ma XX, Xiang HF, Hu YG and
Chen BH: Lentivirus-mediated TGF-β3, CTGF and TIMP1 gene
transduction as a gene therapy for intervertebral disc degeneration
in an in vivo rabbit model. Exp Ther Med. 11:1399–1404.
2016. View Article : Google Scholar : PubMed/NCBI
|
|
30
|
Yue B, Lin Y, Ma X, Xiang H, Qiu C, Zhang
J, Li L and Chen B: Survivin-TGFB3-TIMP1 gene therapy via
lentivirus vector slows the course of intervertebral disc
degeneration in an in vivo rabbit model. Spine (Phila Pa 1976).
41:926–934. 2016. View Article : Google Scholar : PubMed/NCBI
|
|
31
|
Yang H, Cao C, Wu C, Yuan C, Gu Q, Shi Q
and Zou J: TGF-βl suppresses inflammation in cell therapy for
intervertebral disc degeneration. Sci Rep. 5:132542015. View Article : Google Scholar : PubMed/NCBI
|
|
32
|
Li W, Liu T, Wu L, Chen C, Jia Z, Bai X
and Ruan D: Blocking the function of inflammatory cytokines and
mediators by using IL-10 and TGF-β: A potential biological
immunotherapy for intervertebral disc degeneration in a beagle
model. Int J Mol Sci. 15:17270–17283. 2014. View Article : Google Scholar : PubMed/NCBI
|
|
33
|
Zhang J, Li Z, Chen F, Liu H, Wang H, Li
X, Liu X, Wang J and Zheng Z: TGF-β1 suppresses CCL3/4 expression
through the ERK signaling pathway and inhibits intervertebral disc
degeneration and inflammation-related pain in a rat model. Exp Mol
Med. 49:e3792017. View Article : Google Scholar : PubMed/NCBI
|
|
34
|
Yang H, Liu H, Li X, Pan H, Li Z, Wang J
and Zheng Z: TNF-α and TGF-β1 regulate Syndecan-4 expression in
nucleus pulposus cells: Role of the mitogen-activated protein
kinase and NF-κB pathways. Connect Tissue Res. 56:281–287. 2015.
View Article : Google Scholar : PubMed/NCBI
|
|
35
|
Yang H, Gao F, Li X, Wang J, Liu H and
Zheng Z: TGF-β1 antagonizes TNF-α induced up-regulation of matrix
metalloproteinase 3 in nucleus pulposus cells: Role of the ERK1/2
pathway. Connect Tissue Res. 56:461–468. 2015. View Article : Google Scholar : PubMed/NCBI
|
|
36
|
Sobajima S, Shimer AL, Chadderdon RC,
Kompel JF, Kim JS, Gilbertson LG and Kang JD: Quantitative analysis
of gene expression in a rabbit model of intervertebral disc
degeneration by real-time polymerase chain reaction. Spine J.
5:14–23. 2005. View Article : Google Scholar : PubMed/NCBI
|
|
37
|
Cheng JZ, Chen CJ, Wang ZG and Yu D:
MicroRNA-185 inhibits cell proliferation while promoting apoptosis
and autophagy through negative regulation of TGF-β1/mTOR axis and
HOXC6 in nasopharyngeal carcinoma. Cancer Biomark. 23:107–123.
2018. View Article : Google Scholar : PubMed/NCBI
|
|
38
|
Yao CJ, Lv Y, Zhang CJ, Jin JX, Xu LH,
Jiang J, Geng B, Li H, Xia YY and Wu M: MicroRNA-185 inhibits the
growth and proliferation of osteoblasts in fracture healing by
targeting PTH gene through down-regulating Wnt/β-catenin axis: In
an animal experiment. Biochem Biophys Res Commun. 501:55–63. 2018.
View Article : Google Scholar : PubMed/NCBI
|
|
39
|
Li L, Wang Q, Yuan Z, Chen A, Liu Z, Wang
Z and Li H: LncRNA-MALAT1 promotes CPC proliferation and migration
in hypoxia by up-regulation of JMJD6 via sponging miR-125. Biochem
Biophys Res Commun. 499:711–718. 2018. View Article : Google Scholar : PubMed/NCBI
|
|
40
|
Li Q, Pan X, Wang X, Jiao X, Zheng J, Li Z
and Huo Y: Long noncoding RNA MALAT1 promotes cell proliferation
through suppressing miR-205 and promoting SMAD4 expression in
osteosarcoma. Oncotarget. 8:106648–106660. 2017.PubMed/NCBI
|
|
41
|
Hiyama A, Skubutyte R, Markova D, Anderson
DG, Yadla S, Sakai D, Mochida J, Albert TJ, Shapiro IM and Risbud
MV: Hypoxia activates the notch signaling pathway in cells of the
intervertebral disc: Implications in degenerative disc disease.
Arthritis Rheum. 63:1355–1364. 2011. View Article : Google Scholar : PubMed/NCBI
|
|
42
|
Kwon WK, Moon HJ, Kwon TH, Park YK and Kim
JH: The role of hypoxia in angiogenesis and extracellular matrix
regulation of intervertebral disc cells during inflammatory
reactions. Neurosurgery. 81:867–875. 2017.PubMed/NCBI
|
|
43
|
Liu Z, Li C, Meng X, Bai Y, Qi J, Wang J,
Zhou Q, Zhang W and Zhang X: Hypoxia-inducible factor-lα mediates
aggrecan and collagen Π expression via NOTCH1 signaling in nucleus
pulposus cells during intervertebral disc degeneration. Biochem
Biophys Res Commun. 488:554–561. 2017. View Article : Google Scholar : PubMed/NCBI
|
|
44
|
Chen S, Fang XQ, Wang Q, Wang SW, Hu ZJ,
Zhou ZJ, Xu WB, Wang JY, Qin A and Fan SW: PHD/HIF-1 upregulates
CA12 to protect against degenerative disc disease: A human sample,
in vitro and ex vivo study. Lab Invest. 96:561–569. 2016.
View Article : Google Scholar : PubMed/NCBI
|
|
45
|
Wang HQ, Yu XD, Liu ZH, Cheng X, Samartzis
D, Jia LT, Wu SX, Huang J, Chen J and Luo ZJ: Deregulated miR-155
promotes fas-mediated apoptosis in human intervertebral disc
degeneration by targeting FADD and caspase-3. J Pathol.
225:232–242. 2011. View Article : Google Scholar : PubMed/NCBI
|
|
46
|
Ye D, Dai L, Yao Y, Qin S, Han X, Wen W
and Liang W: miR-155 inhibits nucleus pulposus cells' degeneration
through targeting ERK 1/2. Dis Markers. 2016:69842702016.
View Article : Google Scholar : PubMed/NCBI
|
|
47
|
Zhang H, Li JD, Duan DP, She W, Wang LG
and Zhang FQ: The role of lncRNA MALAT1 in intervertebral
degenerative disc disease. Int J Clin Exp Patho. 10:10611–10617.
2017.
|
|
48
|
Cao S, Wang Y, Li J, Lv M, Niu H and Tian
Y: Tumor-suppressive function of long noncoding RNA MALAT1 in
glioma cells by suppressing miR-155 expression and activating FBXW7
function. Am J Cancer Res. 6:2561–2574. 2016.PubMed/NCBI
|
|
49
|
Wu X, Li J, Yang X, Bai X, Shi J, Gao J,
Li Y, Han S, Zhang Y, Han F, et al: miR-155 inhibits the formation
of hypertrophic scar fibroblasts by targeting HIF-1α via PI3K/AKT
pathway. J Mol Histol. 49:377–387. 2018. View Article : Google Scholar : PubMed/NCBI
|
|
50
|
Thomas DP, Sunters A, Gentry A and
Grigoriadis AE: Inhibition of chondrocyte differentiation in vitro
by constitutive and inducible overexpression of the c-fos
proto-oncogene. J Cell Sci. 113:439–450. 2000.PubMed/NCBI
|
|
51
|
Acosta FL Jr, Metz L, Adkisson HD, Liu J,
Carruthers- Liebenberg E, Milliman C, Maloney M and Lotz JC:
Porcine intervertebral disc repair using allogeneic juvenile
articular chondrocytes or mesenchymal stem cells. Tissue Eng Part
A. 17:3045–3055. 2011. View Article : Google Scholar : PubMed/NCBI
|
|
52
|
Ganey T, Libera J, Moos V, Alasevic O,
Fritsch KG, Meisel HJ and Hutton WC: Disc chondrocyte
transplantation in a canine model: A treatment for degenerated or
damaged intervertebral disc. Spine (Phila Pa 1976). 28:2609–2620.
2003. View Article : Google Scholar : PubMed/NCBI
|
|
53
|
Makino H, Seki S, Yahara Y, Shiozawa S,
Aikawa Y, Motomura H, Nogami M, Watanabe K, Sainoh T, Ito H, et al:
A selective inhibition of c-Fos/activator protein-1 as a potential
therapeutic target for intervertebral disc degeneration and
associated pain. Sci Rep. 7:169832017. View Article : Google Scholar : PubMed/NCBI
|
|
54
|
Li JK, Nie L, Zhao YP, Zhang Y, Wang X,
Wang SS, Liu Y, Zhao H and Cheng L: IL-17 mediates inflammatory
reactions via p38/c-Fos and JNK/c-Jun activation in an
AP-1-dependent manner in human nucleus pulposus cells. J Transl
Med. 14:772016. View Article : Google Scholar : PubMed/NCBI
|
|
55
|
Studer RK, Aboka AM, Gilbertson LG,
Georgescu H, Sowa G, Vo N and Kang JD: p38 MAPK inhibition in
nucleus pulposus cells: A potential target for treating
intervertebral disc degeneration. Spine (Phila Pa 1976).
32:2827–2833. 2007. View Article : Google Scholar : PubMed/NCBI
|
|
56
|
Chen B, Wang HT, Yu B, Zhang JD and Feng
Y: Carthamin yellow inhibits matrix degradation and inflammation
induced by LPS in the intervertebral disc via suppression of MAPK
pathway activation. Exp Ther Med. 4:1614–1620. 2017. View Article : Google Scholar
|
|
57
|
Liu C, Yang H, Gao F, Li X, An Y, Wang J
and Jin A: Resistin promotes intervertebral disc degeneration by
upregulation of ADAMTS-5 through p38 MAPK signaling pathway. Spine
(Phila Pa 1976). 41:1414–1420. 2016. View Article : Google Scholar : PubMed/NCBI
|
|
58
|
Yokoyama K, Hiyama A, Arai F, Nukaga T,
Sakai D and Mochida J: C-Fos regulation by the MAPK and PKC
pathways in intervertebral disc cells. PLoS One. 8:e732102013.
View Article : Google Scholar : PubMed/NCBI
|
|
59
|
Zhang Y, Dai Q, Zeng F and Liu H: MALAT1
promotes the proliferation and metastasis of osteosarcoma cells by
activating the Rac1/JNK pathway via targeting MiR-509. Oncol Res.
Apr 27–2018.(Epub ahead of print). View Article : Google Scholar
|