Introduction
Fentanyl is one of the most commonly used opioids in
clinical anesthesia and pain treatment. Clinical studies have
reported that the minimum effective analgesic concentration of
fentanyl ranges between 0.2 and 2.0 ng/ml, with a potential 10-fold
difference between individuals (1). Large individual differences in dosage
requirements affect the clinical efficacy of fentanyl, while also
increasing the risk of severe adverse reactions, such as
respiratory depression and coma.
The effective concentration of fentanyl in the
central nervous system (CNS) is the key to determine its analgesic
and side effects (2). As early as
1999, Henthorn et al (3)
reported that the process of fentanyl uptake into bovine brain
microvascular endothelial cells was primarily through active
transport rather than passive diffusion; however, the authors did
not further clarify which carrier mediated fentanyl transport. More
recently, in a study by Elkiweri et al (4), Sprague-Dawley rats were given an
intravenous injection of fentanyl, verapamil or pravastatin prior
to the quantification of fentanyl in the brain and plasma using
high performance liquid chromatography-tandem mass spectrometry
(HPLC-MS/MS). It was revealed that the brain/plasma partition
coefficient of fentanyl decreased slightly (57%) following the
administration of verapamil, a competitive substrate of
P-glycoprotein. However, treatment with pravastatin, the
competitive substrate of organic anion transporting polypeptide
(OATP), resulted in a 4-fold reduction in the brain/plasma
partition coefficient of fentanyl, suggesting that OATP may serve
an important role in fentanyl transport across the blood-brain
barrier (BBB) (4). Nevertheless,
whether human OATP is also capable of transporting fentanyl has not
yet been reported.
OATPs belong to the solute carrier organic anion
transporter (SLCO) subfamily. Gao et al (5) demonstrated that human OATP-A
(previously known as OATP) was localized to the BBB, and that OATP
is able to mediate the transport of the analgesic opioid peptides
DPDPE and deltorphin II across the BBB. To date, 11 OATP subtypes
have been identified in humans (6), among which only the expression of
OATP1A2 and OATP2B1 has been confirmed at the BBB (7–9). The
expression of the SLCO family member 1A2 (SLCO1A2) mRNA is most
abundant in the brain (6), while
OATP1A2 is predominantly expressed on the apical side of capillary
endothelial cells at the BBB (10,11).
OATP1A2 has the most extensive substrate spectrum and can transport
anionic, neutral and cationic compounds, including the δ-opioid
receptor agonist d-penicillamine 2,5-enkephalin (DPDPE), deltorphin
II, bile acids and steroids (12–15).
Furthermore, in vitro experiments have demonstrated that
OATP1A2 serves an important role in the transport of numerous drugs
across the BBB and into the CNS (7).
Therefore, in the present study, it was speculated
that OATP1A2 may serve an important role in the translocation and
distribution of fentanyl across the BBB. The study intended to
establish a 293 cell line that stably overexpressed OATP1A2, and to
determine whether OATP1A2 was able to transport fentanyl across the
plasma membrane of these cells.
Materials and methods
Materials
Standard grade fentanyl was gifted by the Institute
of Pharmacology, Central South University (Changsha, China).
Internal standard fentanyl-D5 and antibiotic geneticin (G418) were
purchased from Sigma-Aldrich (Merck KGaA, Darmstadt, Germany).
Fexofenadine (FEX) hydrochloride was purchased from the National
Institutes for Food and Drug Control (Beijing, China). Naringenin
was obtained from Dalian Meilun Company (Dalian, China), while
methanol, acetonitrile and formic acid (all of analytical grade)
were from Huihong Reagent Co. Ltd (Hunan, China). Fetal bovine
serum (FBS), high-glucose Dulbecco's modified Eagle's medium
(DMEM), low-serum transfection medium OPTI-MEM and Lipofectamine™
2000 were purchased from Thermo Fisher Scientific, Inc. (Waltham,
MA, USA). ReverTra Ace qPCR RT Master Mix was purchased from Toyobo
Life Science. PBS, penicillin-streptomycin and trypsin were
obtained from Hyclone (GE Healthcare Life Sciences, Little
Chalfont, UK). The OATP1A2 antibody was provided by Abcam
(ab110392), while the mouse anti-β-actin antibody (KGAA001) was
from Nanjing KeyGen Biotech Co., Ltd. and goat anti-rabbit IgG/HRP
secondary antibody (ZB-2301) from OriGene Technologies, Inc. The
RNA extraction kit was purchased from Omega Bio-Tek, Inc.
(Norcross, GA, USA), while the BCA protein assay kit and
radioimmunoprecipitation assay (RIPA) buffer were purchased from
Beyotime Institute of Biotechnology (Haimen, China). The
recombinant plasmid pIRES2-ZsGreen1-OATP1A2 and control plasmid
pIRES2-ZsGreen1 were constructed by Changsha Yingrun
Biotechnologies Inc., (Changsha, China), and OATP1A2 was amplified
from the cDNA library. The primer sequences were as follows:
OATP1A2 forward, 5′-CTAGCTAGCGCCACCATGGGAGAAACTGAGAAAAG-3′, and
reverse, 5′-CCGCTCGAGTTACAATTTAGTTTTCAATT-3′. The full-length
coding sequence of OATP1A2 was amplified, digested with
endonucleases, inserted into pIRES2-ZsGreen1 plasmid and
recombinant plasmid pIRES2-ZsGreen1-OATP1A2 was obtained. The 293
cell line was supplied by the Cell Bank of Xiangya School of
Medicine, Central South University (Changsha, China).
Cell culture
The 293 cells were cultured in high-glucose DMEM
supplemented with 10% FBS and 1% penicillin (100 U/ml)/streptomycin
(100 µg/ml) at 37°C in an atmosphere consisting of 5%
CO2 and 95% humidity. Cells were passaged at a 1:3 ratio
using 0.25% trypsin.
Determination of the optimal G418
concentration for screening
Prior to transfection, dose-response analysis of 293
cells was performed to determine the lowest lethal dose of
G418. A total of 100 µl cell suspension (5×10⁶ cells/l)
was added to each well of a 12-well plate, in addition to 900 µl
DMEM (10% FBS). To construct a concentration gradient increasing by
100 µg/ml increments, each well was supplemented with 0–11 µl G418
stock solution (100 mg/ml) to a final concentration of 0–1,100
µg/ml, and the plates were incubated in a 37°C incubator with 5%
CO2. The medium was replaced every 3 days with fresh
medium containing G418 at the corresponding concentration. After 10
days, the screening concentration of G418 was identified as 600
µg/ml, which was the minimum concentration for complete cell
death.
Transfection
On the day prior to transfection, cells in the
exponential growth phase were harvested, and seeded in 12-well
culture plates at an initial density of 1×10⁴ cells/well
in 1 ml DMEM (10% FBS). The cells were cultured at 37°C (5%
CO2, 95% humidity) until 70–80% confluence was reached.
According to the manufacturer's protocol of the Lipofectamine™ 2000
reagent, liquid A was prepared by diluting 1.6 µg purified
pIRES2-ZsGreen1-OATP1A2 or pIRES2-ZsGreen1 plasmid in 100 µl low
serum OPTI-MEM. Liquid B was then prepared by diluting 4 µl
Lipofectamine™ 2000 in 100 µl OPTI-MEM. Liquids A and B were gently
mixed and incubated for 20 min at room temperature to form a
liposome/DNA complex (liquid AB). Subsequently, the cells were
washed three times with 2 ml serum-free DMEM, the liquid AB was
slowly added to each well, and the plates were shaken well and
incubated for 4 h at 37°C with 5% CO2. Next, 1 ml DMEM
(10% FBS) was added to each well, and the plates were further
incubated for 24 h at 37°C and 5% CO2 for screening.
Screening of transfected 293
cells
On day 2 post-transfection, the cells were
trypsinized (0.25%; 100 µl/well), and cells from one of the wells
of the 12-well culture plate were transferred into two 90-mm
culture dishes. On day 3 after transfection, 600 µg/ml G418 was
added to the appropriate wells, and the medium was replaced every 3
days (DMEM with 10% FBS). Untransfected cells were used as the
control group and were cultured for 2 weeks with G148 treatment as
described earlier. When all control cells had died, G418-resistant
clones were isolated from the transfection groups. In the
transfected cell groups, 24 colonies were randomly transferred into
12-well plates. The expression of green fluorescent protein (GFP)
was then observed under a fluorescence microscope, and the survival
rate of stable OATP1A2-overexpressing cells was determined.
Verification of OATP1A2 mRNA
expression using RT-quantitative polymerase chain reaction
(RT-qPCR)
The plasmid construction was verified by PCR and
sequencing comparison. The OATP1A2 sequence of the recombinant
plasmid was first verified by PCR amplification using the
aforementioned primers. Stable OATP1A2-transfected 293 cells
(referred to as 293-OATP1A2), cells transfected with empty plasmid
serving as the control group [293-vector control (VC) cells] and
con-293 cells (negative control group without treatment) were
harvested, and the EZNA Total RNA Kit I was used to extract total
RNA, of which 2 µg was obtained, measured by a BioPhotometer
plus (Eppendorf). cDNA was synthesized using an RT kit, and
qPCR was subsequently conducted with the OATP1A2 primers and with
β-actin serving as an internal control (Table I). The 25-µl reaction consisted of
0.5 µl cDNA, 7.5 µl SYBR® Green PCR Master Mix (Thermo
Fisher Scientific, Inc.) and 75 nM each of the forward and reverse
primers. The PCR amplification procedure was as follows:
Pre-denaturation at 95°C for 5 min; denaturation at 94°C for 1 min;
annealing at 55°C for 1 min; extension at 72°C for 1 min, for 35
cycles; and final extension at 72°C for 10 min. The cycle
quantification (Cq) value of OATP1A2 was first normalized to the
internal control (∆Cq=CqOATP1A2-Cqβ-actin),
and the 2−ΔΔCq method was then used to calculate the
relative expression levels (16).
The difference between the OATP1A2 gene expression levels of the
experimental group (293-OATP1A2) and the control group (con-293 or
293-VC) was calculated using the formula 2−ΔΔCq, where
ΔΔCq=ΔCqExp-ΔCtControl. The experiment was
repeated three times.
 | Table I.Nucleotide sequences of primers used
in quantitative polymerase chain reaction. |
Table I.
Nucleotide sequences of primers used
in quantitative polymerase chain reaction.
| Gene | Sense primer
(5′-3′) | Antisense primer
(5′-3′) | Product length |
|---|
| OATP1A2 |
TACGTGGAATGGGTGAAACTC |
CACAGAATGATGCCAACAAAA | 153 bp |
| β-actin |
CATCCTGCGTCTGGACCTGG |
TAATGTCACGCACGATTTCC | 116 bp |
Identification of OATP1A2 protein
expression by Western blot analysis
Total protein was extracted from the 293-OATP1A2,
293-VC and con-293 cells using RIPA lysis buffer, and protein
concentration was quantified with the BCA protein assay kit,
according to the manufacturer's protocol. Equal amounts of protein
per sample (2 µg) were loaded and separated by 8% SDS-PAGE and
transferred to polyvinylidene fluoride membranes. The membranes
were then blocked with blocking solution (BSA, Beyotime Institute
of Biotechnology) for 2 h at room temperature (~25°C). After three
washes of 10 min each with TBST, the membranes were incubated with
primary antibody overnight at 4°C. On the second day, the membranes
were incubated with secondary antibody at 37°C for 1 h, and
proteins were visualized using an enhanced chemiluminescence
solution (Beyotime Institute of Biotechnology) with a
chemiluminescence imaging system (Quant350; GE Healthcare, Chicago,
IL, USA). The gray value was detected by ImageJ v1.8.0 software
(National Institutes of Health) to compare the protein expression
among groups. The experiment was repeated for three times.
Transport and absorption
experiments
According to the methods of Cvetkovic et al
(17), Shimizu et al
(18) and Glaeser et al
(19), the transport and
absorption efficiency of the 293-OATP1A2 cells was assessed using
FEX (Km=6), a known substrate of OATP1A2
(10). Briefly, the 293-OATP1A2
and control (293-VC) groups were seeded into 12-well plates
(5×10⁵ cells/well), and concentration assays were
performed three times with 1, 10 and 100 nM FEX. When cells reached
a density of 1×10⁶ cells/well, they were rinsed with 500
µl culture medium (PBS + 2% FBS). The cytotoxicity of fentanyl was
determined using an up-and-down sequential method with 4–6 groups.
The experiment was initiated at the dose closest to the median
lethal dose (LD50). Cells were seeded in 96-well plates, and
concentrations of 5, 10, 100, 150 and 300 µM fentanyl were used
according to those of commonly used OATP1A2 substrates. To rule out
the toxic effects of fentanyl on 293 cells, subsequent experiments
were conducted using a concentration of fentanyl below the LD50.
Under microscopic observation, the median lethal dose (LD50)
of fentanyl (indicating the dose at which almost 50% of cells were
killed) was determined to be between 100 and 150 µM. The cells were
subjected to uptake experiments for 5, 10, 15, 20 and 25 min, and
it was found the optimum duration was 15 min (with the maximum
uptake value in the linear relationship), so 15 min was selected as
the most suitable absorption time used for all absorption
experiments. The cells were then subjected to uptake experiments by
adding 100 µl medium containing 1, 10 and 100 nM FEX. Next, cells
were incubated in a rotary shaker (450 rpm) at 37°C for 15 min. The
spent medium was collected into EP tubes in triplicate for each
concentration, and the cells were washed three times with 1 ml
ice-cold PBS. Subsequent to adding 500 µl methanol to each well,
the cells were collected into EP tubes and homogenized using a cell
grinder. The homogenate was centrifuged at 1,000 × g at 4°C for 10
min, and the supernatant was stored at −20°C until analysis.
Furthermore, the OATP1A2-specific inhibitor naringenin (100 µg/ml)
was added to the absorption solution containing 100 nM FEX or 100
nM fentanyl, and a further set of absorption experiments was
performed according to the aforementioned method. The experiments
were repeated three times for each group, and the entire course of
experiments was repeated twice to obtain six samples for each
group.
Determination of drug concentration
using HPLC-MS/MS
The concentration of fentanyl and FEX was determined
using the methods reported by Verplaetse and Tytgat (20), and Mandery et al (21). Samples were processed by
deproteination, and a double volume of methanol containing the
internal standard was added. Chromatographic separation was
performed using a Phenomex analytical column [Synergi™ Polar-RP
80A; 150×2.0 mm, 4 µm; Phenomenex, Inc., Torrance, CA, USA), with
the following specifications: Mobile phase, methanol; Ammonium
acetate (containing 0.2% formic acid)=9:1 (v/v); column
temperature, 40°C; flow rate, 200 µl/min. The injection volume was
2 µl, and each sample was run for 5 min. The mass spectrometry
technique used was electrospray ionization, the detection method
involved positive ion mode and multi-ion reaction monitoring. The
ions used for quantitative analysis were fentanyl (m/z
337.1→188.2) and FEX (m/z 502.5→466.3), as well as
D5-fentanyl (m/z 342.2→188.2), which served as the internal
standard for fentanyl and FEX. The standard curve range of fentanyl
and FEX was 5–1,000 ng/ml, the intra-day precision (relative
standard deviation; RSD) of the quality control (QC) sample at each
concentration level was <15%, the daytime precision (RSD) was
<15%, and the accuracy was between 85 and 115%. Analyst software
(version 1.5.1; Shanghai AB SCIEX Analytical Instrument Trading
Co., Shanghai, China) was used to analyze the obtained data.
Statistical analysis
Comparison of the percentage of transporter-mediated
uptake between the fentanyl and FEX-treated groups was performed
using GraphPad Prism software (version 5.0; GraphPad Software,
Inc., La Jolla, CA, USA). The net transporter-mediated uptake was
obtained by subtracting the uptake into 293-VC cells from that into
transporter-expressing cells. Two-way analysis of variance and
Dunnett's multiple comparisons test were conducted to determine the
statistical significance of fentanyl and FEX accumulation between
293-OATP1A2 and 293-VC cells. The impact of naringenin on
transporter-mediated uptake was analyzed using the unpaired t-test
with Welch's correction. All data are presented as the mean ±
standard error of the mean, and P<0.05 was considered to
indicate a statistically significant difference.
Results
Verification of
pIRES2-ZsGreen1-OATP1A2 plasmid construction
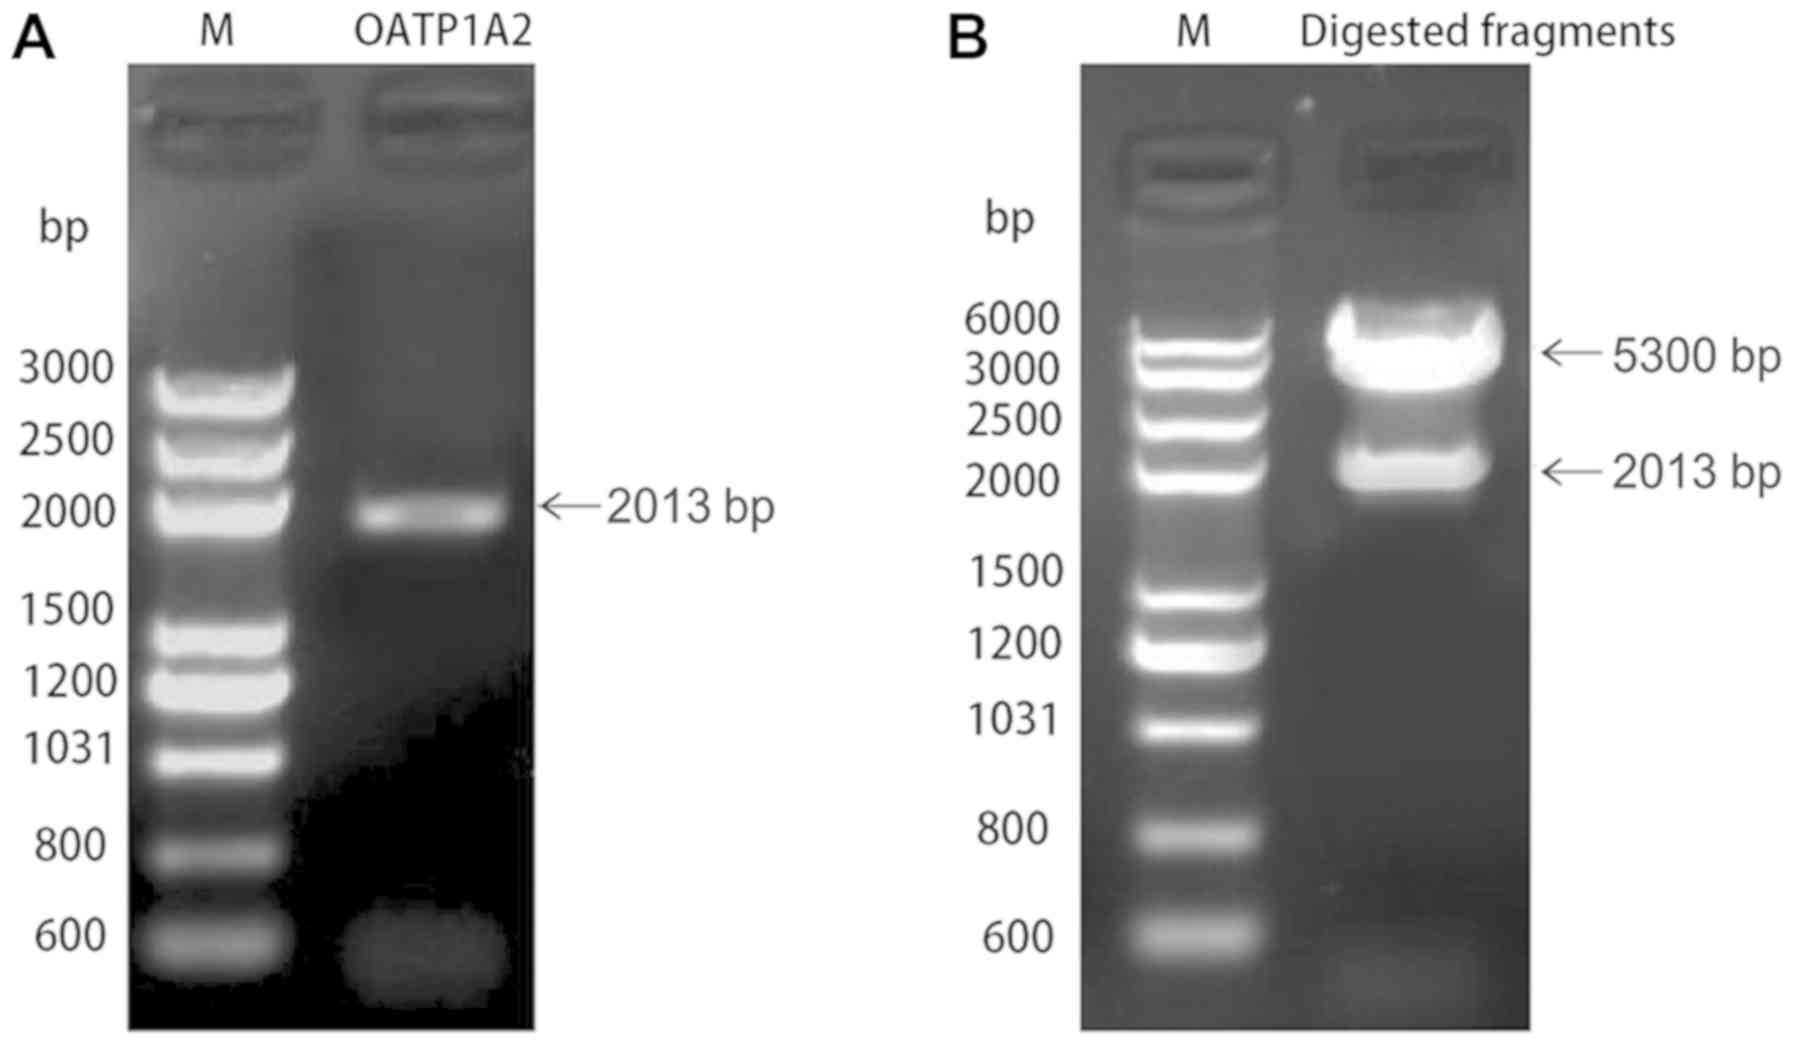
The plasmid PCR product of pIRES2-ZsGreen1-OATP1A2
was subjected to 1.0% agarose gel electrophoresis, and the results
revealed a specific band of 2,013 bp, which was consistent with the
SLCO1A2 gene (Fig. 1A). The
recombinant plasmid was digested using NheI and XhoI
endonucleases, which yielded a ~2,013 bp fragment corresponding to
OATP1A2, and a vector fragment of ~5,300 bp (Fig. 1B). At the same time,
pIRES2-ZsGreen1-OATP1A2 was sequence-aligned in NCBI. Gene
sequences of OATP were retrieved in PubMed (https://www.ncbi.nlm.nih.gov/pubmed) and compared with
PubMed Nucleotide BLAST online software. The results demonstrated
that the constructed sequence was identical to the base sequence of
the target gene, and that the amino acid sequence was 100% correct,
indicating that pIRES2-ZsGreen1-OATP1A2 was successfully
constructed.
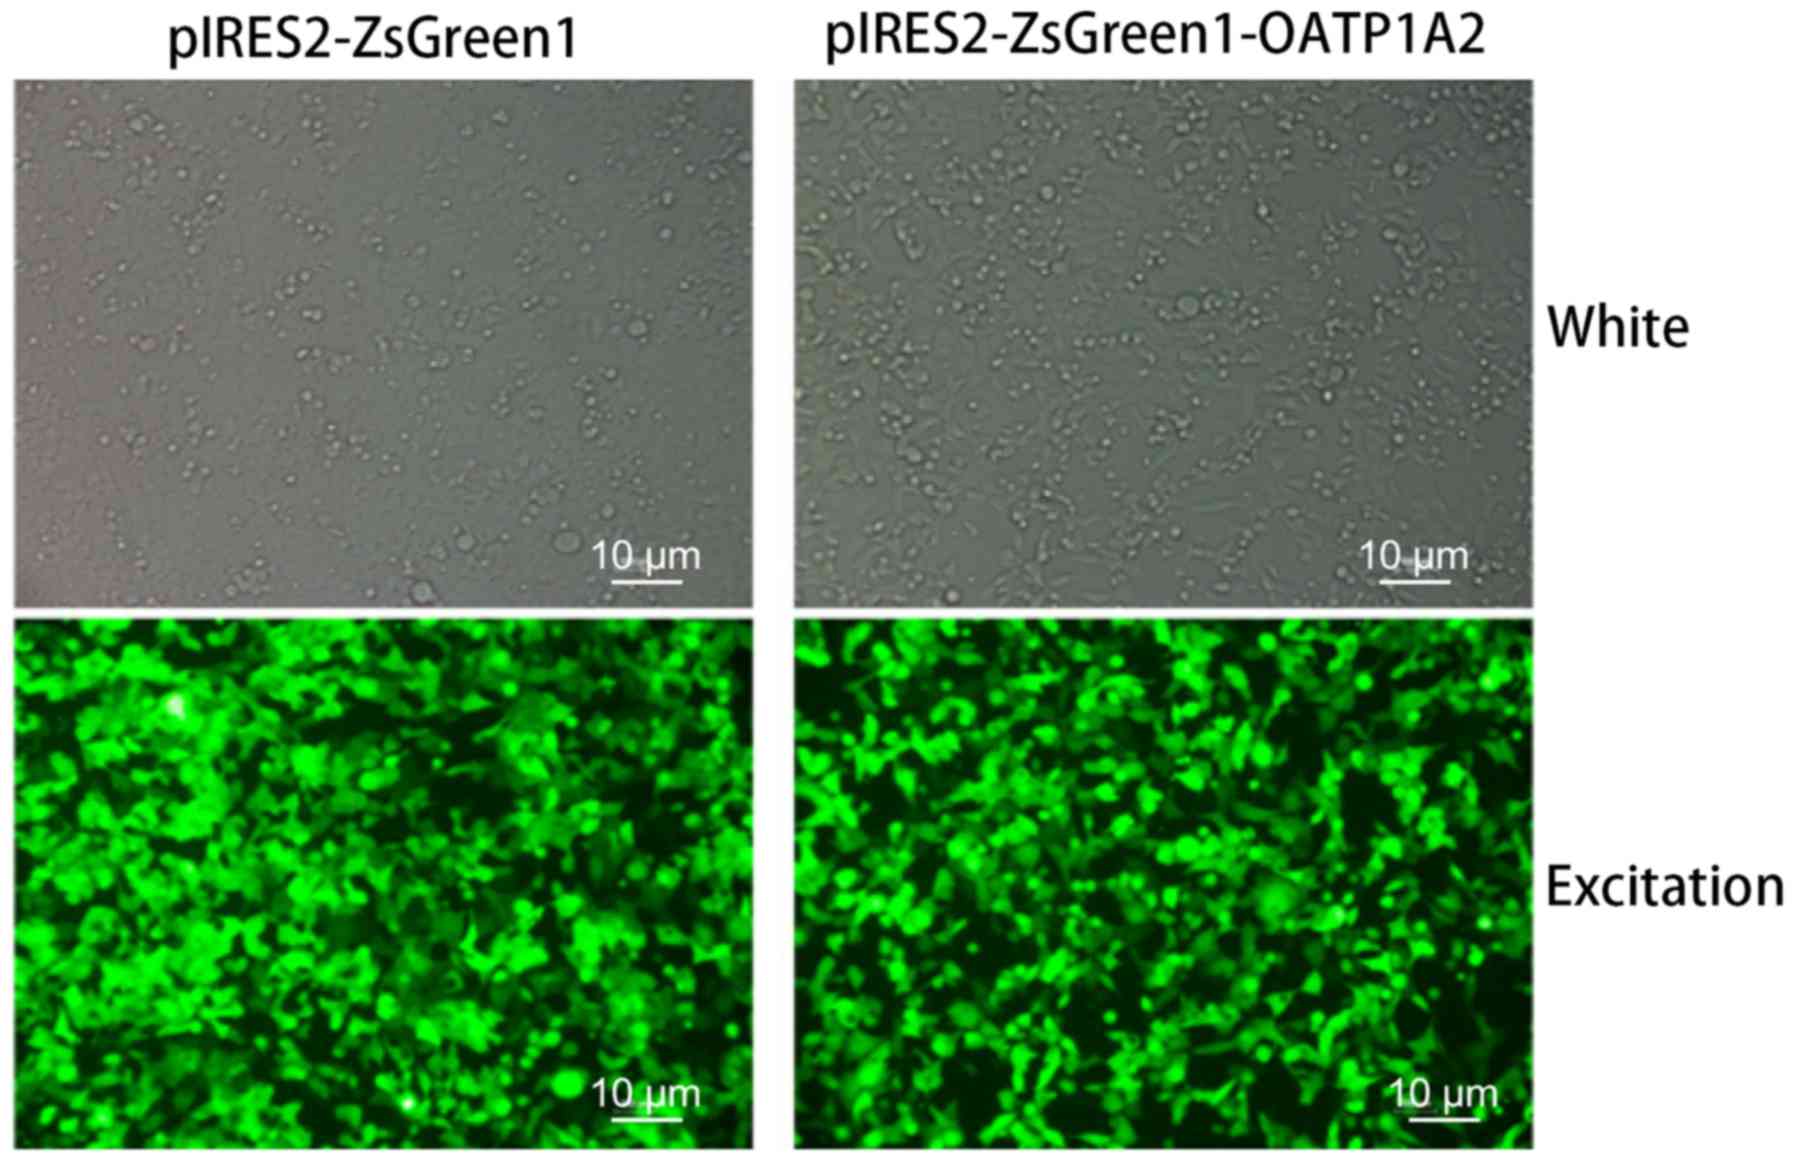
Establishment and verification of 293
cells stably-overexpressing OATP1A2
According to the methods of König et al
(12) and Taub et al
(22), 293 cells were liposomally
transfected with pIRES2-ZsGreen1-OATP1A2 and the corresponding
empty vector, and overexpressed clonal cells were selected. The
cells were then screened with geneticin (G418) to obtain
293-OATP1A2 cells that were overexpressing OATP1A2 protein, and
293-VC cells that were expressing only GFP. Fluorescence microscopy
revealed that the two groups of cells expressed GFP, confirming
that stably-transfected cell lines had been successfully
constructed (Fig. 2).
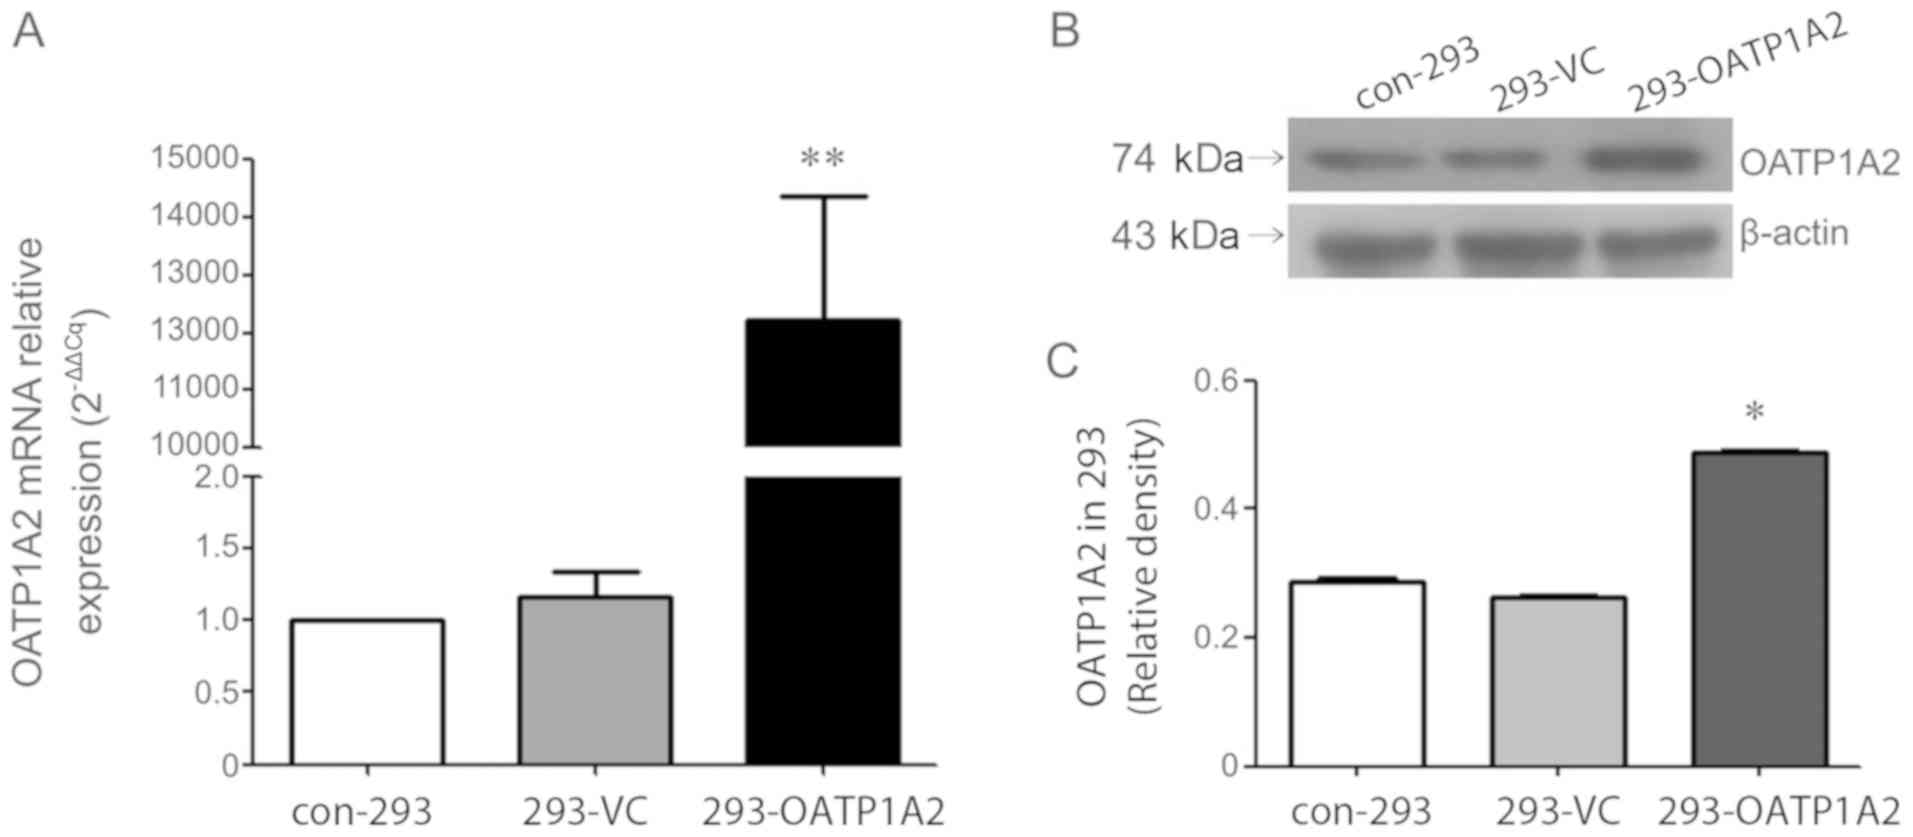
To further determine whether the target gene was
overexpressed, OATP1A2 mRNA expression was assessed in 293-OATP1A2,
293-VC and con-293 cells using RT-qPCR. The results indicated that
the relative expression of OATP1A2 mRNA in 293-OATP1A2 cells was
significantly higher compared with that in the other two cell
lines, suggesting that OATP1A2 mRNA was successfully overexpressed
in the experimental group (Fig.
3A). Western blot analysis was subsequently used to detect the
expression of OATP1A2 protein in the three groups. The results
revealed a prominent OATP1A2 protein band in the 293-OATP1A2 group
(Fig. 3B). Analysis using ImageJ
software indicated that the gray value of the 293-OATP1A2 group was
significantly higher compared with the other two groups, indicating
that 293 cells stably overexpressing OATP1A2 had been successfully
established (Fig. 3C). There was
no significant difference in the OATP1A2 mRNA and protein
expression levels between the 293-VC and con-293 groups, suggesting
that the empty vector had no significant effect on gene expression
in 293 cells.
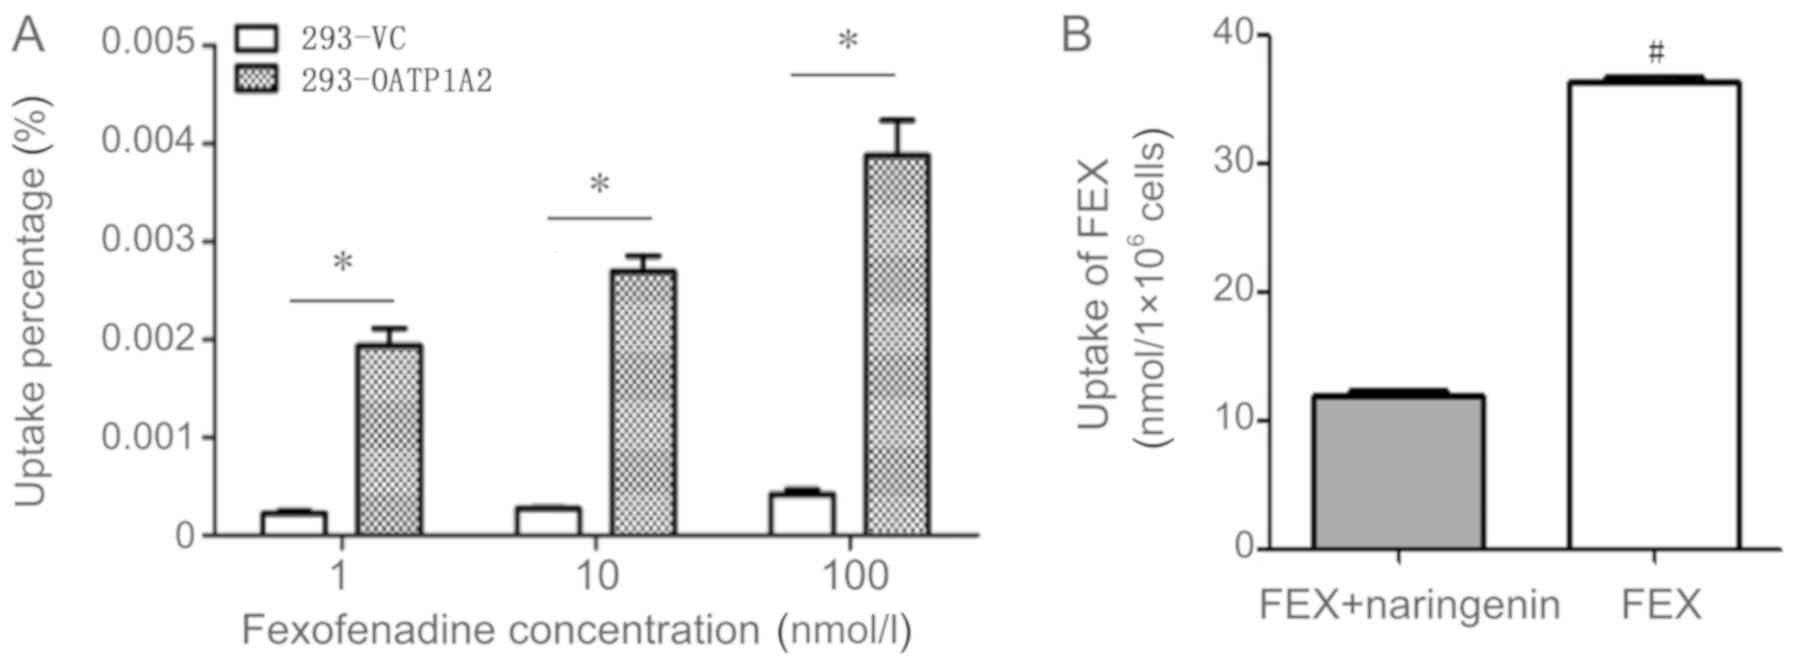
Functional verification of 293-OATP1A2
cells
The function of OATP1A2 was verified using its known
substrate, FEX, as a probe drug. The results of the uptake
experiments demonstrated significantly increased uptake of FEX into
293-OATP1A2 cells compared with the uptake into 293-VC cells
(P<0.05; F=36). In addition, the 293-OATP1A2-mediated uptake of
FEX was ~10-fold higher than that of 293-VC cells according to mass
spectrometry data, at a concentration of 100 nM FEX (Fig. 4A). The results of the inhibition
experiments revealed that the uptake of FEX in the experimental
group (treated with 100 µg/ml naringenin) was 12.03±0.14
nmol/1×106 cells, whilst that in the control group
(without naringenin) was 36.24±0.28 nmol/1×106 cells
(2.8-fold higher), representing a statistically significant
difference (P<0.05; Fig. 4B).
This confirmed that the 293-OATP1A2 cell line successfully
exhibited its transport function.
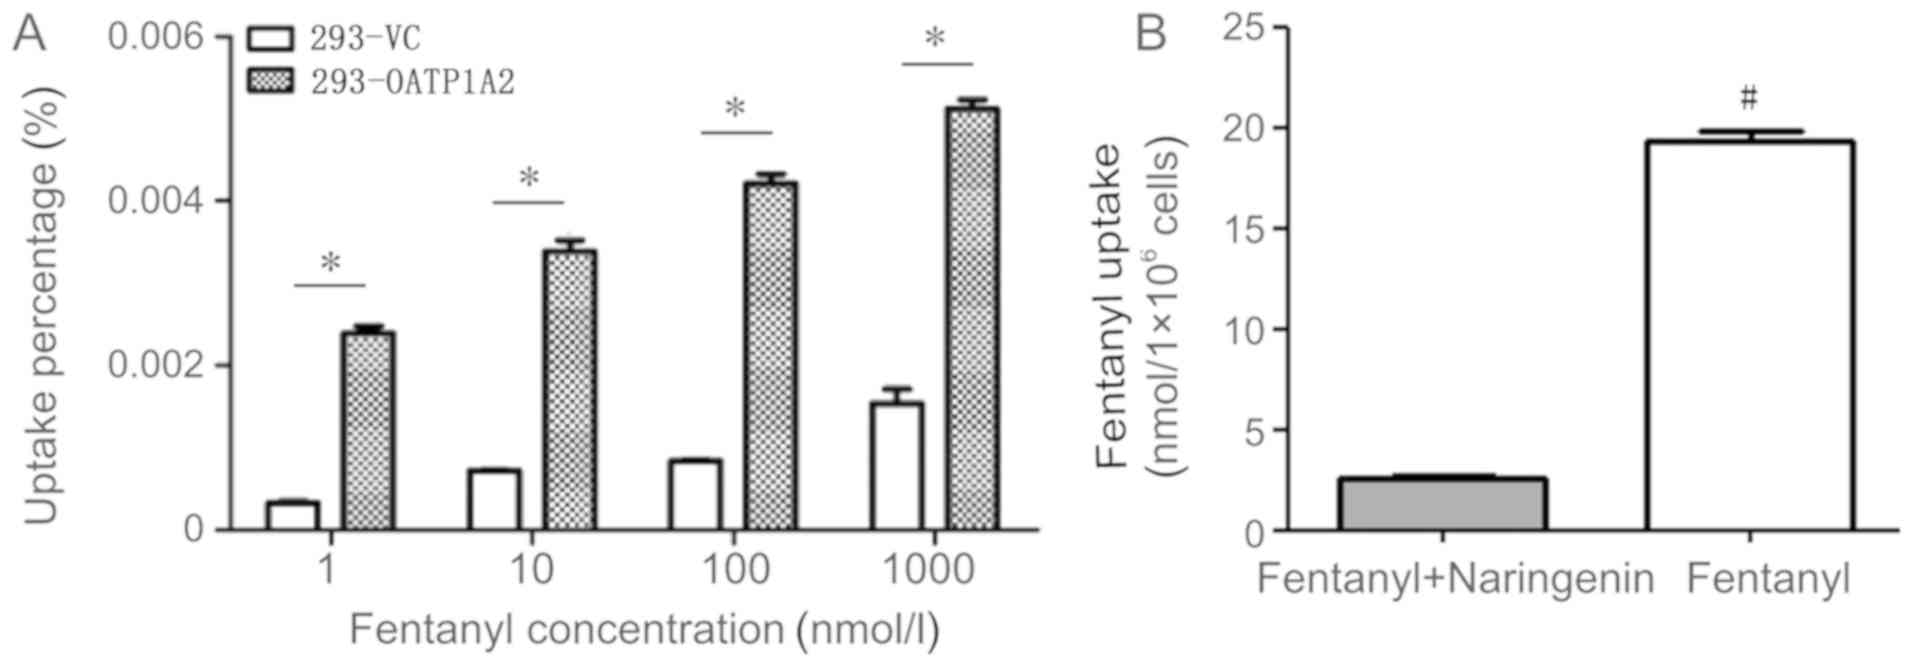
Transport of fentanyl
To verify whether fentanyl was a substrate for
OATP1A2, 293-OATP1A2 and 293-VC cells were used to conduct uptake
experiments using a fentanyl concentration gradient. According to
the methods used by Ziesenitz et al (23), 1, 10, 100 and 1,000 nM fentanyl was
used. Preliminary experiments revealed that the absorption time was
linearly correlated within 15 min; thus, the absorption time was
determined to be 15 min (Fig.
S1). The results of the present study revealed the
293-OATP1A2-mediated uptake of fentanyl (100 nM) was 5.1-fold
higher compared with that in 293-VC cells (Fig. 5A), according to mass spectrometry
data, with statistically significant difference (P<0.05).
In order to observe the uptake of fentanyl
subsequent to inhibition of OATP1A2 expression, a combination of
100 nM fentanyl and 40 µM naringenin (100 µg/ml each) was used for
inhibition experiments with 293-OATP1A2 cells. The uptake of
fentanyl was 2.62±0.06 nmol/1×106 cells in the inhibitor
group (fentanyl + naringenin) and 19.39±0.23 nmol/1×106
cells in the fentanyl group (7.3-fold higher than the inhibitor
group), with a statistically significant difference detected
between the two groups (P<0.05; Fig. 5B).
Discussion
OATP/Oatp isoforms are known to be involved in
blood-to-brain transport of opioid analgesic peptides such as
deltorphin II and DPDPE (5,24,25).
To date, 11 OATP subtypes have been identified in humans (6). Among these subtypes, the most
frequently studied subtype with high mutation rate was OATP1B1.
OATP1B1 is mainly located at the sinusoidal membrane of hepatocytes
(23). Ziesenitz et al
(23) conducted uptake assays with
fentanyl in cells overexpressing OATP1B1 and compared the
intracellular concentrations with the corresponding cell line
without OATP1B1, and they found that fentanyl is not transported by
human OATP1B1. OATP1A2, mainly localized at the blood-brain
barrier, can transport anionic, neutral and cationic compounds
(13–15). Furthermore, in vitro
functional assessment revealed that the A516C and A404T variants of
OATP1A2 had markedly reduced capacity for mediating the cellular
uptake of OATP1A2 substrates, estrone 3-sulfate and two
delta-opioid receptor agonists, deltorphin II, and DPDPE (7). Due to high expression at the BBB and
an extensive substrate spectrum of OATP1A2, it was hypothesized
that OATP1A2 may mediate fentanyl transport. According to the
recommendations of the International Transporter Consortium,
transporter substrates (including OATPs) are characterized by a
significantly greater uptake into transporter-expressing cells
compared with control cells, while this higher uptake level should
be decreased by known inhibitors (19).
The focus of the current research is whether OATP1A2
can transport fentanyl. Cells in the luminal membrane of the BBB
express OATP1A2, as well as numerous other transporters, and thus a
blank control was needed in the present study. The 293 cell line
has been widely used as an in vitro model for studying the
association between drug transporters and their substrates
(26). This cell line is easier to
obtain and expresses fewer transporters, including OATP1A2;
therefore, it can function as a better tool cell for overexpressing
this transporter in order to study its function (27). Furthermore, 293 cells are widely
used in cell biology research with reliable growth and propensity
for transfection, and they can be used in biotechnology to produce
therapeutic proteins for gene therapy (28). In order to confirm our hypothesis,
a 293 cell line stably overexpressing OATP1A2 was first established
in the present study, and the expression of GFP (the vector marker)
in the obtained 293-OATP1A2 and 293-VC cells was examined by
fluorescence microscopy. The results indicated that the
transfection rates of the two cell groups were >80%. RT-qPCR
analysis further revealed that the expression of OATP1A2 mRNA in
the 293-OATP1A2 group was significantly higher in comparison with
that in the 293-VC group. There was also a statistically
significant difference in the expression of the target protein
between the 293-OATP1A2 and 293-VC groups, as determined by Western
blot analysis. These observations confirmed the successful
establishment of a cell line stably overexpressing OATP1A2.
Using FEX (a known substrate of OATP1A2) as a probe
drug, the current study verified the transport function of the
293-OATP1A2 cell line. Subsequently, FEX uptake analyses were
performed in the 293-OATP1A2 and 293-VC groups. Uptake experiments
were also performed with the addition of the OATP1A2 inhibitor
naringenin, and the intracellular FEX concentration was determined
by HPLC-MS/MS. The results demonstrated a statistically significant
difference between the FEX/naringenin and FEX groups, which was
consistent with the findings of Shimizu et al (18), indicating that 293-OATP1A2 cells
exhibited a normal transport function. Finally, a fentanyl
concentration gradient was constructed using the 293-OATP1A2 cell
line, and the concentration of intracellular fentanyl was
determined using HPLC-MS/MS. The results revealed that the
concentration of fentanyl in 293-OATP1A2 cells was significantly
higher as compared with that in 293-VC cells, and that this
increased uptake was inhibited by naringenin, indicating that
fentanyl is a substrate for OATP1A2.
In conclusion, the present study demonstrated for
the first time the OATP1A2-mediated transport of fentanyl in
vitro, while it was also observed that naringenin, a specific
inhibitor of OATP1A2, was able to reduce fentanyl uptake into the
cells. Since the present study was restricted to in vitro
cell line experiments, the findings may not fully represent the
internal environment of the BBB. Whether the OATP1A2-mediated
uptake of fentanyl is affected by other factors remains to be
clarified. Nevertheless, the current findings provide a basis for
the further investigation of the mechanism of fentanyl, with
important significance for its use in targeted therapy and
individualized treatments plans.
Supplementary Material
Supporting Data
Acknowledgements
The authors would like to thank Professor Zhi-rong
Tan and Professor Dong-sheng Ouyang (Institute of Pharmacology,
Central South University) for their gift of standard grade
fentanyl.
Funding
The present study was supported by a grant from the
Natural Science Foundation of Hunan Province (grant no. 16JJ2158)
and the New Xiangya Talent Projects of the Third Xiangya hospital
of Central South University.
Availability of data and materials
The datasets analyzed and/or generated during the
study are available from the corresponding author on reasonable
request.
Authors' contributions
XCH and HWY performed the experiments, analyzed the
data and wrote the manuscript. LHH guided the experiments, designed
the primers and vectors, analyzed the data and revised the
manuscript. FZ contributed to the conception and design of the
study. ZYP assisted in the experiments. QL conceived and designed
the study, and revised the manuscript for important intellectual
content. All authors read and approved the final manuscript.
Ethics approval and consent to
participate
Not applicable.
Patient consent for publication
Not applicable.
Competing interests
The authors declare they have no competing
interests.
Glossary
Abbreviations
Abbreviations:
|
CNS
|
central nervous system
|
|
SLCO
|
solute carrier organic anion
|
|
OATP
|
organic anion transporting
polypeptide
|
|
BBB
|
blood-brain barrier
|
|
FEX
|
fexofenadine
|
|
DMEM
|
Dulbecco's modified Eagle's medium
|
References
|
1
|
Lane ME: The transdermal delivery of
fentanyl. Eur J Pharm Biopharm. 84:449–455. 2013. View Article : Google Scholar : PubMed/NCBI
|
|
2
|
Upton RN: Cerebral uptake of drugs in
humans. Clin Exp Pharmacol Physiol. 34:695–701. 2007. View Article : Google Scholar : PubMed/NCBI
|
|
3
|
Henthorn TK, Liu Y, Mahapatro M and Ng KY:
Active transport of fentanyl by the blood-brain barrier. J
Pharmacol Exp Ther. 289:1084–1089. 1999.PubMed/NCBI
|
|
4
|
Elkiweri IA, Zhang YL, Christians U, Ng
KY, Tissot van Patot MC and Henthorn TK: Competitive substrates for
P-glycoprotein and organic anion protein transporters
differentially reduce blood organ transport of fentanyl and
loperamide: Pharmacokinetics and pharmacodynamics in Sprague-Dawley
rats. Anesth Analg. 108:149–159. 2009. View Article : Google Scholar : PubMed/NCBI
|
|
5
|
Gao B, Hagenbuch B, Kullak-Ublick GA,
Benke D, Aguzzi A and Meier PJ: Organic anion-transporting
polypeptides mediate transport of opioid peptides across
blood-brain barrier. J Pharmacol Exp Ther. 294:73–79.
2000.PubMed/NCBI
|
|
6
|
Roth M, Obaidat A and Hagenbuch B: OATPs,
OATs and OCTs: The organic anion and cation transporters of the
SLCO and SLC22A gene superfamilies. Br J Pharmacol. 165:1260–1287.
2012. View Article : Google Scholar : PubMed/NCBI
|
|
7
|
Lee W, Glaeser H, Smith LH, Roberts RL,
Moeckel GW, Gervasini G, Leake BF and Kim RB: Polymorphisms in
human organic anion-transporting polypeptide 1A2 (OATP1A2):
Implications for altered drug disposition and central nervous
system drug entry. J Biol Chem. 280:9610–9617. 2005. View Article : Google Scholar : PubMed/NCBI
|
|
8
|
Obaidat A, Roth M and Hagenbuch B: The
expression and function of organic anion transporting polypeptides
in normal tissues and in cancer. Annu Rev Pharmacol Toxicol.
52:135–151. 2012. View Article : Google Scholar : PubMed/NCBI
|
|
9
|
Bronger H, König J, Kopplow K, Steiner HH,
Ahmadi R, Herold-Mende C, Keppler D and Nies AT: ABCC drug efflux
pumps and organic anion uptake transporters in human gliomas and
the blood-tumor barrier. Cancer Res. 65:11419–11428. 2005.
View Article : Google Scholar : PubMed/NCBI
|
|
10
|
Zhou Y, Yuan J, Li Z, Wang Z, Cheng D, Du
Y, Li W, Kan Q and Zhang W: Genetic polymorphisms and function of
the organic anion-transporting polypeptide 1A2 and its clinical
relevance in drug disposition. Pharmacology. 95:201–208. 2015.
View Article : Google Scholar : PubMed/NCBI
|
|
11
|
Gong IY and Kim RB: Impact of genetic
variation in OATP transporters to drug disposition and response.
Drug Metab Pharmacokinet. 28:4–18. 2013. View Article : Google Scholar : PubMed/NCBI
|
|
12
|
König J, Glaeser H, Keiser M, Mandery K,
Klotz U and Fromm MF: Role of organic anion-transporting
polypeptides for cellular mesalazine (5-aminosalicylic acid)
uptake. Drug Metab Dispos. 39:1097–1102. 2011. View Article : Google Scholar : PubMed/NCBI
|
|
13
|
Forster S, Thumser AE, Hood SR and Plant
N: Characterization of rhodamine-123 as a tracer dye for use in in
vitro drug transport assays. PLoS One. 7:e332532012. View Article : Google Scholar : PubMed/NCBI
|
|
14
|
Iusuf D, Hendrikx JJ, van Esch A, van de
Steeg E, Wagenaar E, Rosing H, Beijnen JH and Schinkel AH: Human
OATP1B1, OATP1B3 and OATP1A2 can mediate the in vivo uptake and
clearance of docetaxel. Int J Cancer. 136:225–233. 2015. View Article : Google Scholar : PubMed/NCBI
|
|
15
|
Durmus S, Naik J, Buil L, Wagenaar E, van
Tellingen O and Schinkel AH: In vivo disposition of doxorubicin is
affected by mouse Oatp1a/1b and human OATP1A/1B transporters. Int J
Cancer. 135:1700–1710. 2014. View Article : Google Scholar : PubMed/NCBI
|
|
16
|
Livak KJ and Schmittgen TD: Analysis of
relative gene expression data using real-time quantitative PCR and
the 2(-Delta Delta C(T)) method. Methods. 25:402–408. 2001.
View Article : Google Scholar : PubMed/NCBI
|
|
17
|
Cvetkovic M, Leake B, Fromm MF, Wilkinson
GR and Kim RB: OATP and P-glycoprotein transporters mediate the
cellular uptake and excretion of fexofenadine. Drug Metab Dispos.
27:866–871. 1999.PubMed/NCBI
|
|
18
|
Shimizu M, Fuse K, Okudaira K, Nishigaki
R, Maeda K, Kusuhara H and Sugiyama Y: Contribution of OATP
(organic anion-transporting polypeptide) family transporters to the
hepatic uptake of fexofenadine in humans. Drug Metab Dispos.
33:1477–1481. 2005. View Article : Google Scholar : PubMed/NCBI
|
|
19
|
Glaeser H, Bujok K, Schmidt I, Fromm MF
and Mandery K: Organic anion transporting polypeptides and organic
cation transporter 1 contribute to the cellular uptake of the
flavonoid quercetin. Naunyn Schmiedebergs Arch Pharmacol.
387:883–891. 2014. View Article : Google Scholar : PubMed/NCBI
|
|
20
|
Verplaetse R and Tytgat J: Development and
validation of a sensitive ultra performance liquid chromatography
tandem mass spectrometry method for the analysis of fentanyl and
its major metabolite norfentanyl in urine and whole blood in
forensic context. J Chromatogr B Analyt Technol Biomed Life Sci.
878:1987–1996. 2010. View Article : Google Scholar : PubMed/NCBI
|
|
21
|
Mandery K, Bujok K, Schmidt I, Keiser M,
Siegmund W, Balk B, Konig J, Fromm MF and Glaeser H: Influence of
the flavonoids apigenin, kaempferol, and quercetin on the function
of organic anion transporting polypeptides 1A2 and 2B1. Biochem
Pharmacol. 80:1746–1753. 2010. View Article : Google Scholar : PubMed/NCBI
|
|
22
|
Taub ME, Mease K, Sane RS, Watson CA, Chen
L, Ellens H, Hirakawa B, Reyner EL, Jani M and Lee CA: Digoxin is
not a substrate for organic anion-transporting polypeptide
transporters OATP1A2, OATP1B1, OATP1B3, and OATP2B1 but is a
substrate for a sodium-dependent transporter expressed in HEK293
cells. Drug Metab Dispos. 39:2093–2102. 2011. View Article : Google Scholar : PubMed/NCBI
|
|
23
|
Ziesenitz VC, König SK, Mahlke N, Jantos
R, Skopp G, Weiss J, Haefeli WE and Mikus G: Fentanyl
pharmacokinetics is not dependent on hepatic uptake by organic
anion-transporting polypeptide 1B1 in human beings. Basic Clin
Pharmacol Toxicol. 113:43–48. 2013. View Article : Google Scholar : PubMed/NCBI
|
|
24
|
Ose A, Kusuhara H, Endo C, Tohyama K,
Miyajima M, Kitamura S and Sugiyama Y: Functional characterization
of mouse organic anion transporting peptide 1a4 in the uptake and
efflux of drugs across the blood-brain barrier. Drug Metab Dispos.
38:168–176. 2010. View Article : Google Scholar : PubMed/NCBI
|
|
25
|
Ronaldson PT, Finch JD, Demarco KM,
Quigley CE and Davis TP: Inflammatory pain signals an increase in
functional expression of organic anion transporting polypeptide 1a4
at the blood-brain barrier. J Pharmacol Exp Ther. 336:827–839.
2011. View Article : Google Scholar : PubMed/NCBI
|
|
26
|
Lin YC, Boone M, Meuris L, Lemmens I, Van
Roy N, Soete A, Reumers J, Moisse M, Plaisance S, Drmanac R, et al:
Genome dynamics of the human embryonic kidney 293 lineage in
response to cell biology manipulations. Nat Commun. 5:47672014.
View Article : Google Scholar : PubMed/NCBI
|
|
27
|
Thomas P and Smart TG: HEK293 cell line: A
vehicle for the expression of recombinant proteins. J Pharmacol
Toxicol Methods. 51:187–200. 2005. View Article : Google Scholar : PubMed/NCBI
|
|
28
|
Stepanenko AA and Dmitrenko VV: HEK293 in
cell biology and cancer research: Phenotype, karyotype,
tumorigenicity, and stress-induced genome-phenotype evolution.
Gene. 569:182–190. 2015. View Article : Google Scholar : PubMed/NCBI
|