Introduction
Gastric cancer (GC) occurs in the inner lining of
stomach, and 60% of GC cases are caused by Helicobacter
pylori infection (1). Patients
with GC are usually characterized by epigastric pain, heartburn,
inappetence, nausea, vomiting, weight loss and dysphagia (2). In patients with advanced GC, tumor
cells may migrate from the stomach to other tissues and organs,
such as liver, lymph nodes, lung and bone (3). As the disease is often diagnosed
late, its prognosis is usually unfavorable with a 5-year survival
rate <10% worldwide in 2016 (4). Globally, stomach cancer ranks fifth
in terms of incidence and third in terms of tumor mortality,
affecting 950,000 new patients and resulting in 723,000 cases of
mortality in 2012 (5,6). In order to improve the therapies for
GC, the molecular mechanisms of GC should be further
elucidated.
Astrocyte-elevated gene 1 is involved in the
progression of GC and predicts the prognosis of patients with GC,
and thus its targeted inhibition may be a promising strategy for
treating the tumor (7). Decreased
mRNA and protein expression levels of liver kinase B1 are detected
in patients with GC with low survival rate, and are independent
prognostic factors of GC (8,9).
Nicotinamide adenine dinucleotide phosphate oxidases (NOX)
family genes act as possible prognostic indicators in GC,
indicating that NOX inhibitor may be useful for the
treatment of patients with GC (10). Ataxia telangiectasia mutated
(ATM) expression is decreased among patients with GC in
Xinjiang, and thus ATM may be a potential marker of
prognosis in patients with GC (11). Overexpression of fibulin-1
(FBLN1) inhibits GC cell growth and promotes apoptosis by
elevating the expression of cleaved caspase-3; thus, FBLN1
is a tumor suppressor and prognostic factor in patients with GC
(12). Despite these findings, the
genes implicated in the pathogenesis of GC have not been thoroughly
revealed.
Early diagnosis, reasonable prognostic evaluation,
and timely and appropriate intervention are important for improving
the outcomes of patients with GC (13). The study of prognostic markers can
guide the close monitoring and further treatment of patients at
high risk of recurrence and improve their survival rate (14,15).
Increasing studies have identified prognostic gene signatures and
developed a prognostic score model for patients with GC (16–26).
However, the recurrence-associated prognostic genes in GC have not
been comprehensively examined. Since recurrence is experienced in
25–40% of all patients with GC treated with surgical resection
(27,28), the identification of
recurrence-associated genes is significant for survival prediction
in these patients. Therefore, using microarray datasets of GC
samples downloaded from The National Center for Biotechnology
Information (NCBI) Gene Expression Omnibus (GEO) database,
differentially expressed genes (DEGs) between recurrence and
non-recurrence samples were identified. Subsequently, from the
selected DEGs, the present study screened the feature genes
associated with the recurrence of GC. This was followed by the
construction of a classifier that could accurately identify the
recurrence of GC. Combined with the clinical prognostic
information, the risk score system was built based on the
expression level of feature genes.
Materials and methods
Data source and preliminary screening
of clinical factors
Using ‘gastric cancer’ and ‘Homo sapiens’ as key
words, microarray data were searched for in the NCBI GEO database
(http://www.ncbi.nlm.nih.gov/geo/). The
selected datasets met the following criteria: i) Recurrence
information was available; ii) recurrence-free survival (RFS) time
information was available; and iii) sample size was ≥200. Finally,
GSE62254 (platform, GP570, Affymetrix Human Genome U133 Plus 2.0
Array; Thermo Fisher Scientific, Inc.) (26,29)
and GSE26253 (platform, GPL8432 Illumina HumanRef-8 WG-DASL v3.0;
Illumina, Inc.) (30) were
selected. GSE62254 contained 300 GC tissue samples, 282 of which
had recurrence information, including 125 recurrent samples and 157
non-recurrent samples. The 282 samples were used as the training
set of the present study. GSE26253 (n=432) included 177 recurrent
and 255 non-recurrent samples, and was used as a validation set
(validation set 2).
Furthermore, in order to obtain another validation
set, gene expression profiles of GC samples were downloaded from
The Cancer Genome Atlas (TCGA; https://gdc-portal.nci.nih.gov/; TGCA STAD project)
database based on the Illumina HiSeq 2000 RNA Sequencing platform.
As a result, 421 GC tissue samples were acquired, 298 of which had
corresponding recurrence information, comprising of 242 samples
without recurrence and 56 samples with recurrence (validation set
1).
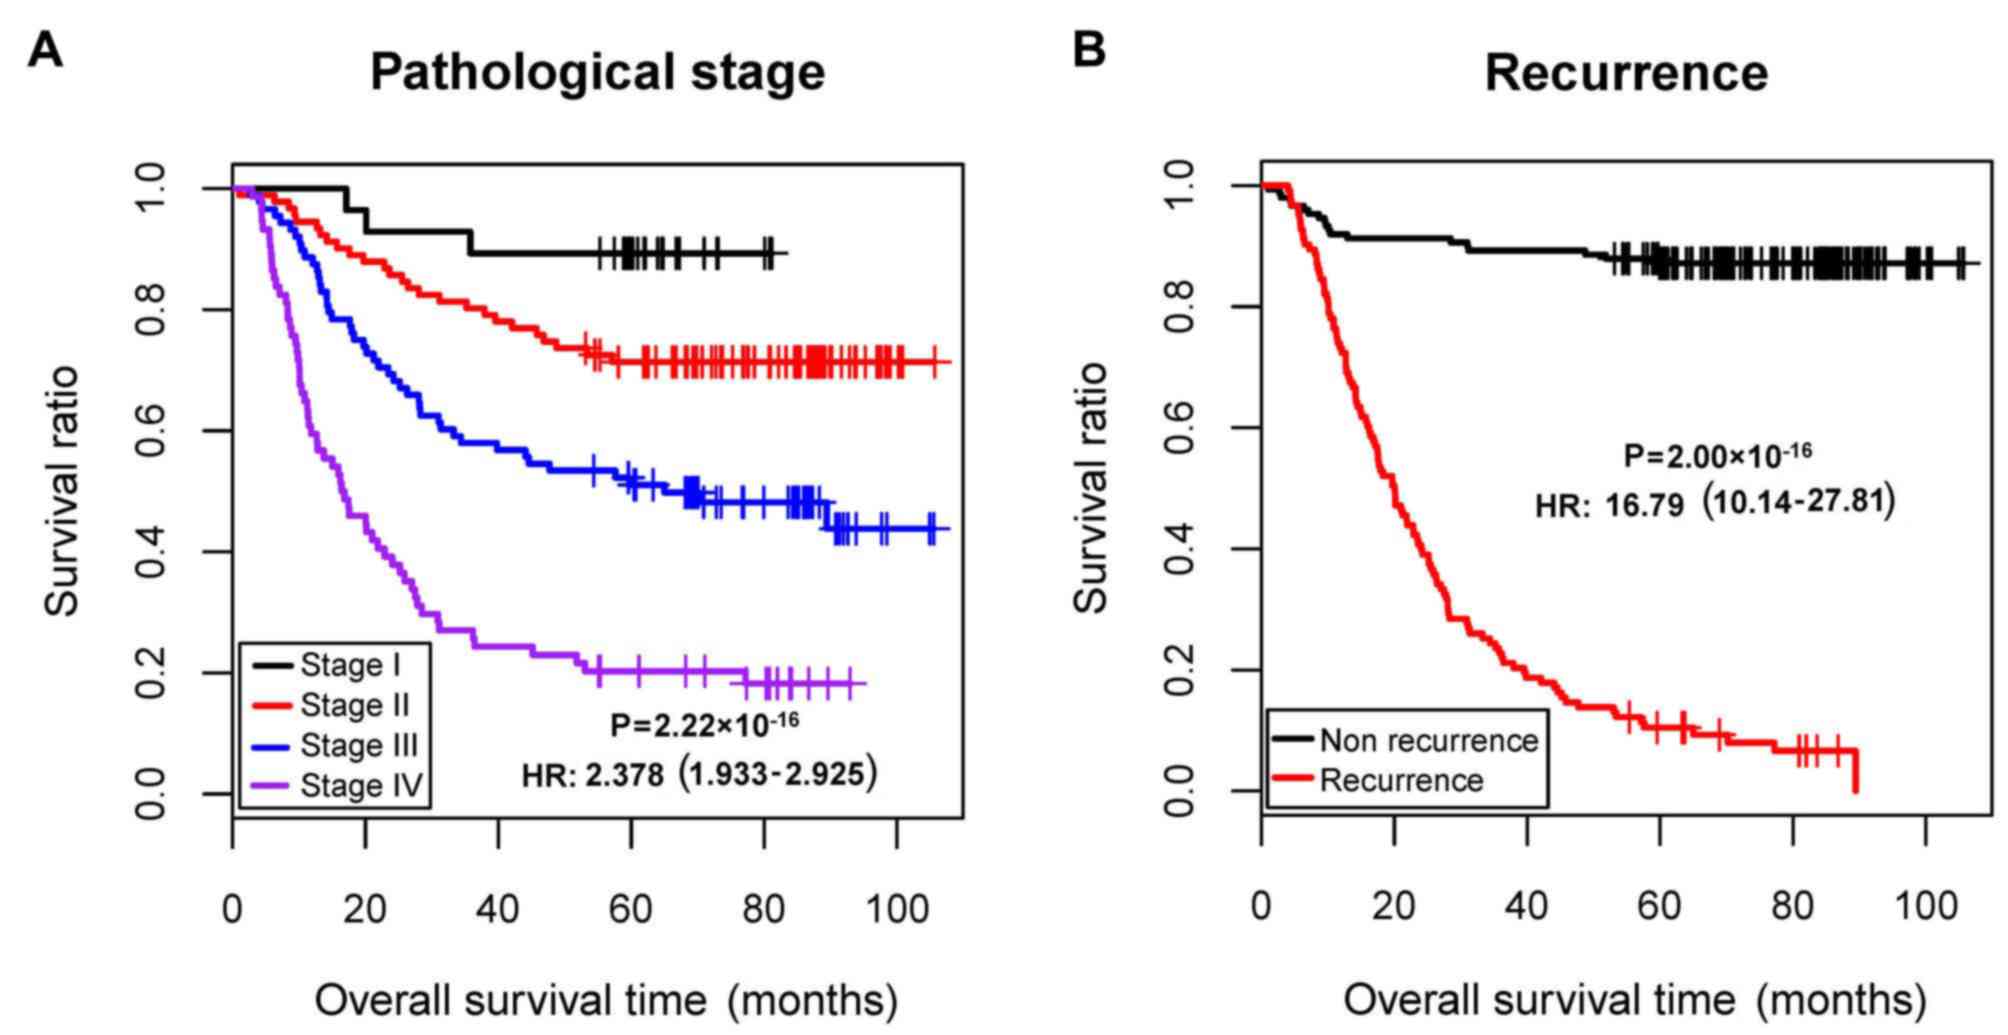
Using the training dataset (GSE62254), univariate
and multivariate Cox regression analyses were conducted to evaluate
the association of clinical factors with prognosis, using the
survival package (version 2.41-1; http://bioconductor.org/packages/survivalr/) (31) in R (version 3.4.1; http://www.r-project.org/). P<0.05 was set as the
threshold for significant association. The pathological stage and
recurrence were identified to be independent prognostic clinical
factors (Table I; Fig. 1). Therefore, samples of the
training set were divided into recurrence and non-recurrence groups
for further analysis in the present study.
 | Table I.Preliminary screening of independent
prognostic clinical factors. |
Table I.
Preliminary screening of independent
prognostic clinical factors.
|
|
| Univariate cox | Multivariate
cox |
|---|
|
|
|
|
|
|---|
| Clinical
characteristics | GSE62254
(n=300) | HR | 95% CI | P-value | HR | 95% CI | P-value |
|---|
| Age (years, mean ±
SD) | 61.94±11.36 | 1.009 | 0.993–1.025 |
2.71×10⁻¹ | – | – | – |
| Sex
(male/female) | 199/101 | 0.869 | 0.612–1.234 |
4.33×10⁻¹ | – | – | – |
| MLH1 IHC
(positive/negative/-) | 234/64/2 | 2.206 | 1.326–3.670 |
1.78×10⁻³ | 1.533 | 0.859–2.733 |
1.48×10⁻¹ |
| EBV ISH
(positive/negative/-) | 18/257/25 | 1.037 | 0.507–2.123 |
9.20×10⁻¹ | – | – | – |
| Lymphovascular
invasion (yes/no/-) | 205/73/22 | 2.642 | 1.602–4.357 |
7.67×10⁻⁵ | 1.659 | 0.972–2.832 |
6.34×10⁻² |
| Pathologic M
(M0/M1/-) | 273/27 | 3.971 | 2.517–6.266 |
1.58×10⁻¹⁰ | 1.609 | 0.912–2.839 |
1.01×10⁻¹ |
| Pathologic N
(N0/N1/N2/N3) | 38/131/80/51 | 2.052 | 1.698–2.480 |
2.03×10⁻¹⁴ | 1.206 | 0.851–1.708 |
2.92×10⁻¹ |
| Pathologic T
(T1/T2/T3/T4/-) | 2/186/91/21 | 1.847 | 1.469–2.323 |
8.37×10⁻⁸ | 1.120 | 0.809–1.550 |
4.94×10⁻¹ |
| Pathologic stage
(I/II/III/IV/-) | 30/96/95/77/2 | 2.378 | 1.933–2.925 |
2.22×10⁻¹⁶ | 1.660 | 1.056–2.611 |
2.81×10⁻² |
| Lauren
classification (diffuse/intestinal/mixed) | 135/146/17/2 | 0.828 | 0.704–0.974 |
2.19×10⁻² | 0.988 | 0.829–1.177 |
8.92×10⁻¹ |
| Recurrence
(yes/no) | 125/157/18 | 16.790 | 10.14–27.81 |
2.00×10⁻¹⁶ | 13.61 | 7.704–24.041 |
2.00×10⁻¹⁶ |
| Mortality
(dead/alive/-) | 135/148//17 | – | – | – | – | – | – |
| Overall survival
time (months, mean ± SD) | 50.59±31.42 | – | – | – | – | – | – |
Data normalization
The expression matrices of the three datasets were
stacked, and each matrix was scaled based on expression levels. The
unit specification was scaled and a sample vector was given as
follows:
v=(v1,…,vn),vnormed=vx1‖v‖22
In the formula, ||v||22
stands for the 2-norm of vector (norm).
Combined with the sqrt [sum(data2)]
function (32) in R, the square
root of the eigenvalue of matrix B=A*AT was extracted to
acquire the samples scaled to 1. Based on the median and median
absolute deviation (MAD) of each gene, the gene expression level
was centralized and normalized using median scaling. The details
were shown as follows: Giving an eigenvector x=(x1, …,
xn); and defining median scale normalization as:
xscaled=(x-median(x))x1MAD(x).
Identification of DEGs between
recurrence and non-recurrence samples
As aforementioned, the GSE62254 dataset was
classified into recurrent and non-recurrent groups. The DEGs
between the two groups were analyzed using the limma package
(version 3.34.7; http://bioconductor.org/packages/release/bioc/html/limma.html)
(33) in R. The strict cut-off was
a false discovery rate (FDR) <0.05 and |log2 fold
change (FC)|>0.263. Subsequently, bidirectional hierarchical
clustering based on centered Pearson correlation algorithm was
performed on the DEGs using the pheatmap package (version 1.0.8;
http://cran.r-project.org/web/packages/pheatmap/index.html)
(34) in R.
Construction of the Support Vector
Machine (SVM) classifier
Using Cox regression analysis in the survival
package (31), the DEGs that were
significantly associated with RFS time and overall survival (OS)
time were selected from the GSE62254 dataset. P<0.05 was set as
the threshold. The DEGs significantly associated with both RFS time
and OS time were used for subsequent analysis.
The recursive feature elimination algorithm in the
Caret package (version 6.0–76; http://cran.r-project.org/web/packages/caret)
(35) in R was used to identify
the optimal combination of feature genes. During the 100-fold cross
validation, the gene combination corresponding to the highest
accuracy and the smallest Root Mean Square Error (RMSE) was
considered as the optimal combination of feature genes.
Combined with the eigenvalues in each sample, the
supervised classification algorithm SVM evaluates the probability
of a sample belonging to one type (36). Using the SVM algorithm (Cross,
100-fold cross validation; Core, Sigmoid Kernel) in the e1071
package (version 1.6–8; http://cran.r-project.org/web/packages/e1071)
(37) in R, an SVM classifier was
built on account of the feature gene combination.
In GSE62254, GSE26253 and the TCGA dataset, the
classification efficiency of the SVM classifier was assessed based
on Concordance index (C-index), Brier score, log-rank P-value of
Cox-proportional hazard (Cox-PH) regression and area under the
receiver operating characteristic (AUROC) curve. Using the survcomp
package (version 1.30.0; http://www.bioconductor.org/packages/release/bioc/html/survcomp.html)
(38) in R, the C-index (the score
of all individual pairs that predicted the correct order of
survival time) (39) and the Brier
score (a scoring function for measuring the accuracy of probability
prediction) (40) were
calculated.
Using the Kaplan-Meier (KM) curve analysis of the
survival package (31), KM curves
were drawn for the two groups predicted using the SVM classifier,
and the log-rank P-value was calculated. Combined with the pROC
package (version 1.12.1; http://cran.r-project.org/web/packages/pROC/index.html)
(41) in R, the indexes including
sensitivity, specificity, positive prediction value and negative
prediction value were calculated for ROC curves.
Construction of risk score system
Using the Cox-PH model of the penalized package
(version 0.9–50; http://bioconductor.org/packages/penalized/) (42) in R, the optimal combination of
prognosis-associated genes was further screened from the selected
combination of feature genes. The optimized parameter ‘lambda’ in
the screening model was calculated through 1,000 cross-validation
likelihood (cvl).
Combined with prognostic coefficients of the
prognosis-associated DEGs in the optimal combination, a risk score
system was constructed based on gene expression level. Furthermore,
the risk score was calculated for each sample using the following
formula:
Riskscore=∑coefDEGsxExpDEGs
CoefDEG and ExpDEG represent
regression coefficient and the corresponding gene expression level,
respectively.
With the median of risk scores as the demarcation
point, the samples in GSE62254 were classified into high- and
low-risk groups. Using the KM curve analysis of the survival
package (31), correlation
analysis for the risk score system and prognosis was carried out.
Additionally, the risk score system was further validated in the
GSE26253 and TCGA datasets.
Stratification analysis of clinical
factors
Combined with the univariate and multivariate Cox
regression analysis of the survival package (31), the independent prognostic clinical
factors in GSE62254 were selected. Combined with the high- and
low-risk samples determined by the risk score system,
stratification analysis was further carried out.
Pathway enrichment analysis
According to the risk scores of the samples in
GSE62254, the samples were divided into high-risk and low-risk
groups. Under FDR<0.05 and |log2 FC|>0.263, the
DEGs between the two groups were identified using the limma package
(33). Using Gene Set Enrichment
Analysis (http://software.broadinstitute.org/gsea/index.jsp)
(43), pathway enrichment analysis
was conducted for the DEGs, with the screening criterion of nominal
P<0.05.
Results
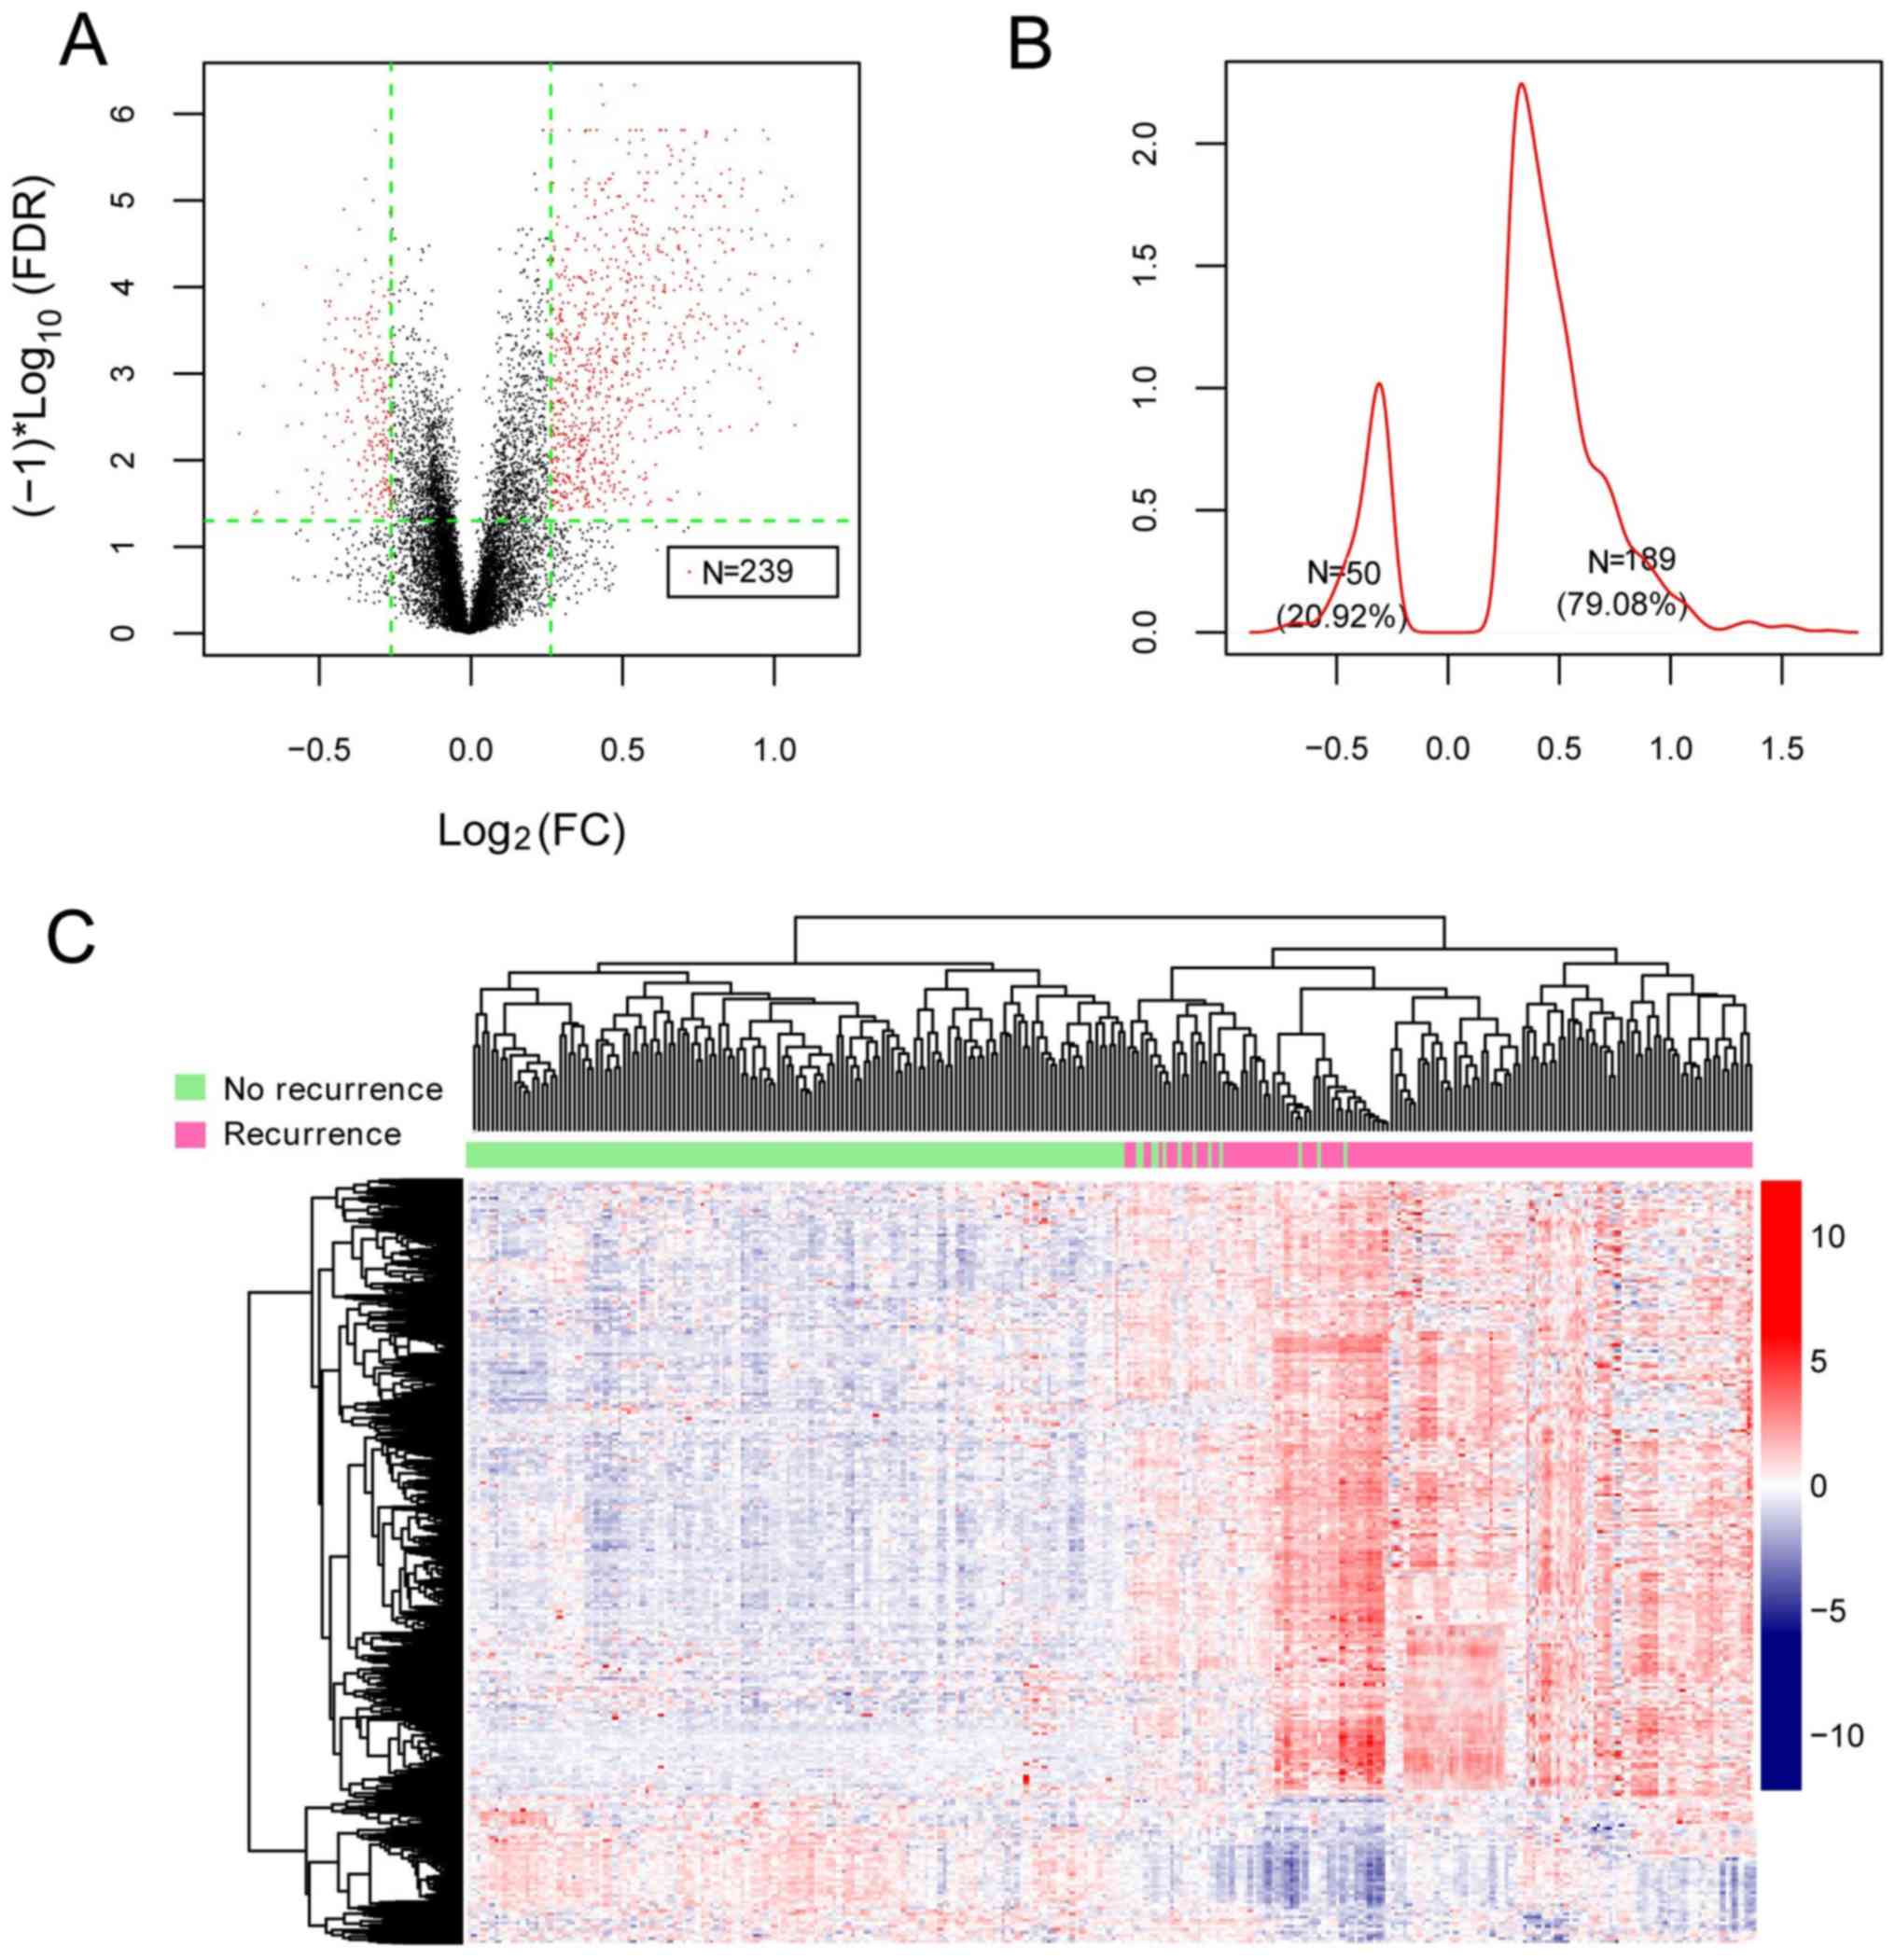
Identification of DEGs
Following data normalization, 239 DEGs between
recurrent and non-recurrent samples in the GSE62254 dataset were
identified (Fig. 2A). The Kernel
density curve of the DEGs revealed that 79.08% (189/239) of the
DEGs were upregulated and 20.92% (50/239) of the DEGs were
downregulated in recurrent samples (Fig. 2B). A bidirectional hierarchical
clustering heatmap, based on the expression levels of the
identified DEGs, indicated that the samples clustered into two
groups (Fig. 2C).
Construction of SVM classifier
A total of 124 recurrence-associated DEGs and 127
overall survival-associated DEGs were screened in GSE62254.
Following comparison of the two sets of DEGs, 114 DEGs were found
to be significantly associated with both RFS time and OS time.
The 114 DEGs were further screened for feature
genes. When min RMSE=0.148 and max Accuracy=0.842, the gene
combination involving 21 genes was considered as the optimal one.
Based on the 21 feature genes, an SVM classifier was built in
GSE62254.
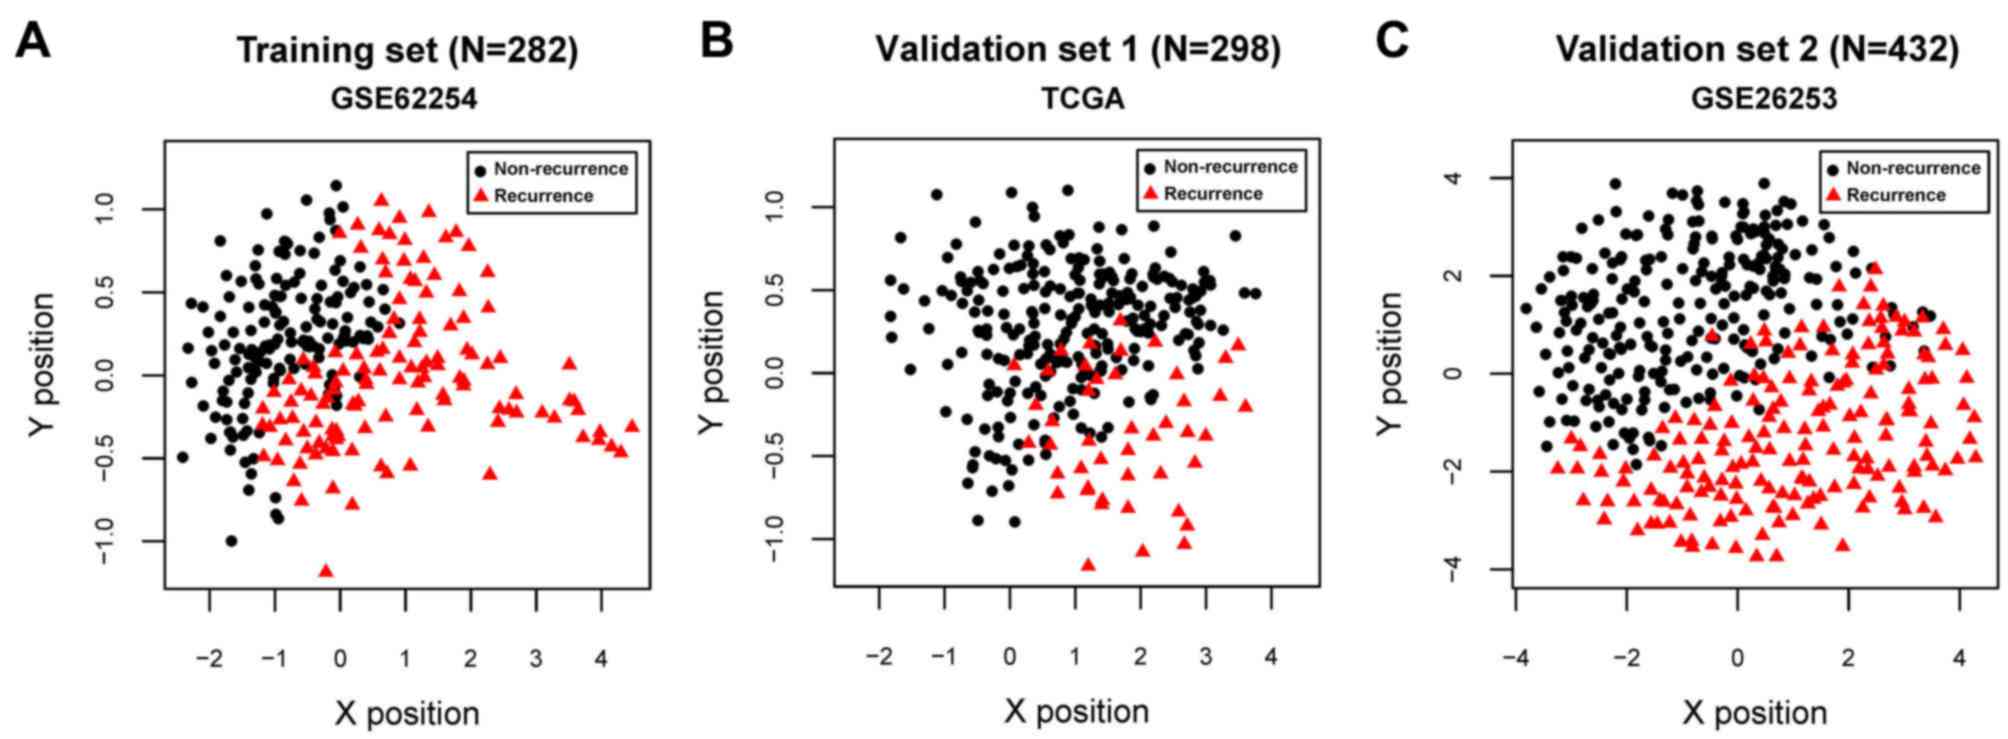
For GSE62254, GSE26253 and the TCGA datasets, all
C-index values were >0.80 and all Brier scores were <0.30 for
RFS time and OS time. The classification results of the samples,
based on the SVM classifier, are presented in scatter diagrams
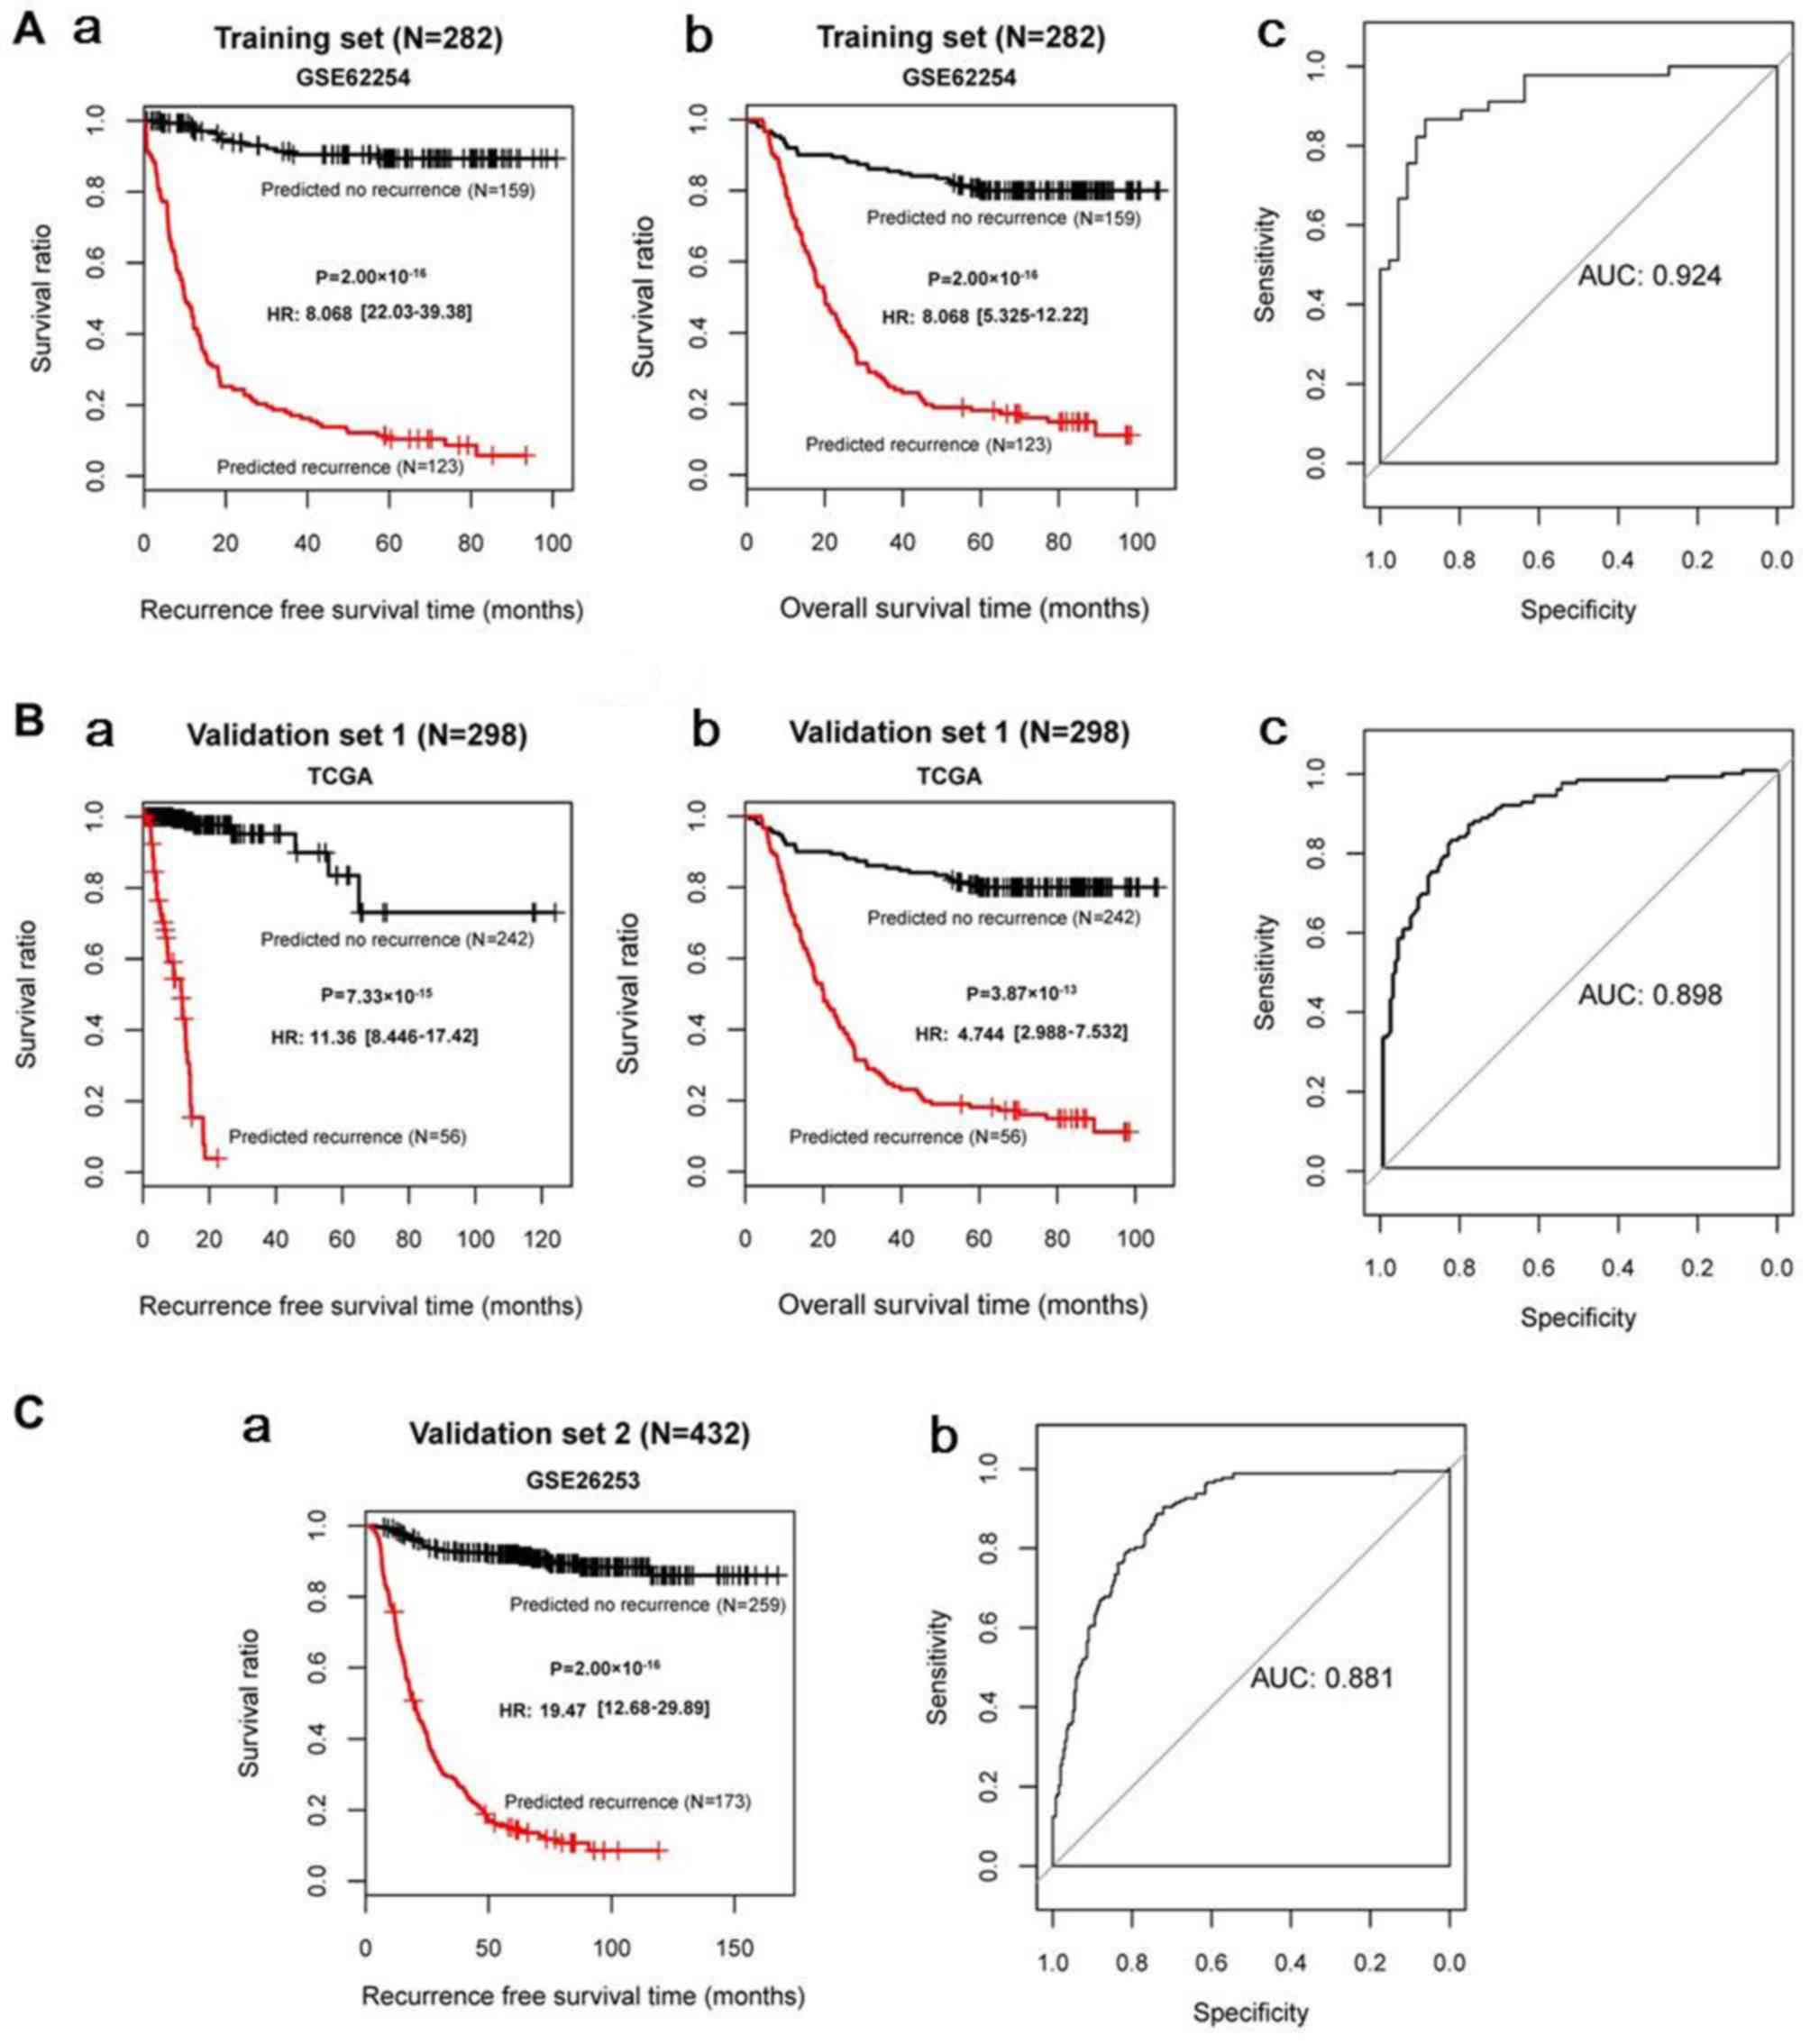
(Fig. 3). KM survival curves
demonstrated that the log-rank P-values for RFS time and OS time in
the training and validation sets were all <0.05 (Fig. 4), suggesting significantly
different RFS time and OS time between predicted recurrence and
non-recurrence samples in the GSE62254 and TCGA datasets, and
significantly different RFS time in GSE26253 (the samples in
GSE26253 had no OS information). The predicted results of the SVM
classifier were consistent with the actual outcomes of patients
with GC in these datasets. The AUROC curves revealed that all AUROC
values for the training and validation sets were >0.8 (Table II; Fig. 4). These results suggested that the
SVM classifier based on the 21 feature genes could accurately
determine the recurrence type of GC samples.
| Table II.Assessment indexes for the SVM
classifier in the GSE62254, GSE26253 and TCGA datasets. |
Table II.
Assessment indexes for the SVM
classifier in the GSE62254, GSE26253 and TCGA datasets.
|
| RFS/OS | ROC |
|---|
|
|
|
|
|---|
| Datasets | C-index | Brier score | Log rank
P-value | AUROC | Sensitivity | Specificity | PPV | NPV |
|---|
| Training set
(GSE62254; n=282) | 0.966/0.871 | 0.0108/0.0255 |
2.00×10⁻¹⁶/2.00×10−16 | 0.924 | 0.896 | 0.929 | 0.911 | 0.918 |
| Validation set 1
(TCGA; n=295) | 0.929/0.807 | 0.0272/0.0283 |
7.33×10⁻¹⁵/3.87×10−13 | 0.898 | 0.844 | 0.929 | 0.779 | 0.871 |
| Validation set 2
(GSE26253; n=432) | 0.950 | 0.0115 |
2.00×10⁻¹⁶ | 0.881 | 0.853 | 0.914 | 0.873 | 0.899 |
Construction of risk score system
Using the Cox-PH model, the optimal combination of
prognostic genes was further screened from the 21 feature genes.
When the optimized parameter ‘lambda’ was 2.2604, the cvl value was
largest (−757.1749; Fig. 5A). When
‘lambda’=2.2604, 10 optimal genes were obtained [A-kinase anchoring
protein 12 (AKAP12), angiopoietin-like protein
(ANGPTL) 1, cysteine-rich sequence 1 (CYS1),
myeloid/lymphoid or mixed-lineage leukemia, translocated to
chromosome 11 (MLLT11), neuron navigator 3 (NAV3),
neurobeachin (NBEA), nephroblastoma overexpressed
(NOV), pleiotrophin (PTN), tumor suppressor candidate
3 (TUSC3), zinc finger and SCAN domain containing 18
(ZSCAN18); Fig. 5B;
Table III].
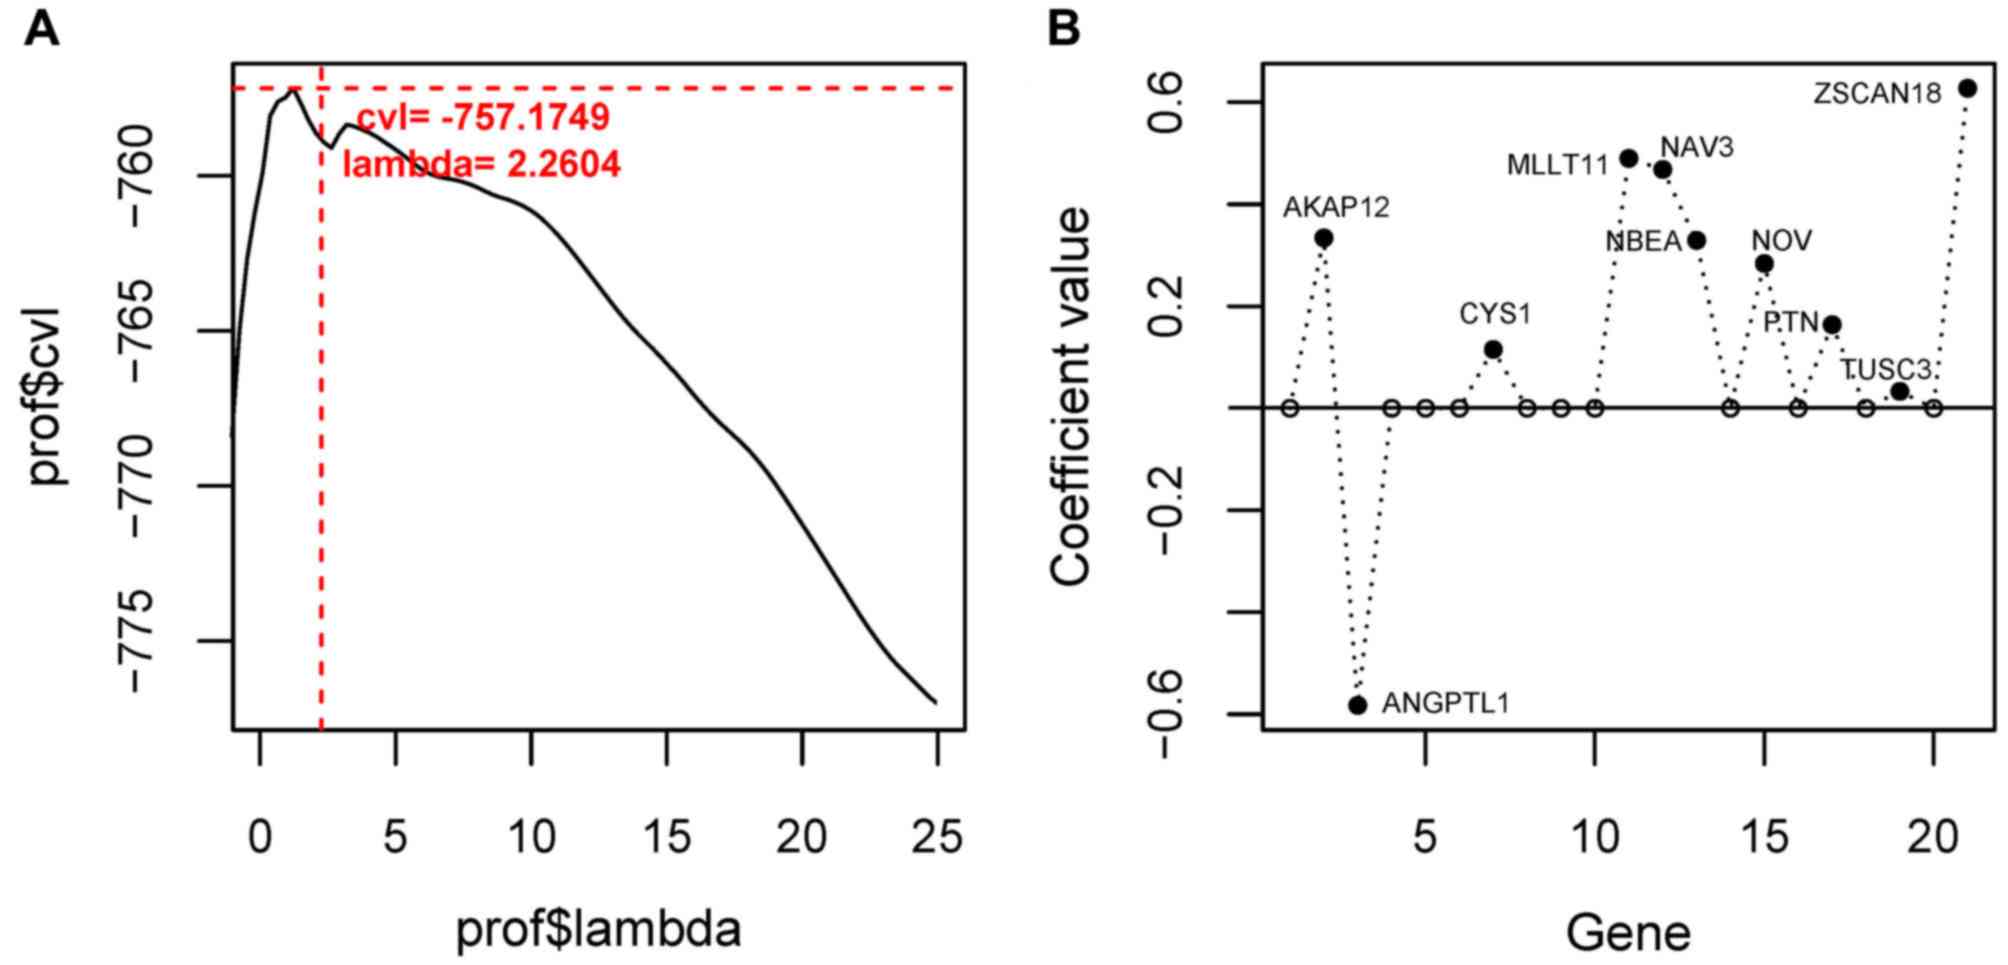 | Figure 5.Selection of the optimal gene
combination. (A) Curve for selecting the optimized parameter
‘lambda’. The horizontal and vertical axes represent values of
‘lambda’ and cvl, respectively. The crossing of red dashed lines
represents the value of ‘lambda’ parameter (2.2604), where cvl
takes the maximum value (−757.1749). (B) Coefficient distribution
diagram of the 10 optimal genes. AKAP12, A-kinase anchoring
protein 12; ANGPTL1, angiopoietin-like protein 1;
CYS1, cysteine-rich sequence 1; MLLT11,
myeloid/lymphoid or mixed-lineage leukemia; translocated to
chromosome 11; NAV3, neuron navigator 3; NBEA,
neurobeachin; NOV, nephroblastoma overexpressed; PTN,
pleiotrophin; TUSC3, tumor suppressor candidate 3;
ZSCAN18, zinc finger and SCAN domain containing 18; cvl,
cross-validation likelihood. |
| Table III.Top 10 optimal genes selected for
building the risk score system. |
Table III.
Top 10 optimal genes selected for
building the risk score system.
| Gene | Coef | HR (95% CI) | P-value |
|---|
| AKAP12 | 0.3340 | 1.559
(1.278–3.112) |
2.07×10⁻² |
| ANGPTL1 | −0.5826 | 0.256
(0.121–0.541) |
3.53×10⁻⁴ |
| CYS1 | 0.1153 | 1.466
(1.149–3.311) |
3.58×10⁻² |
| MLLT11 | 0.4899 | 1.623
(1.537–3.498) |
2.16×10⁻² |
| NAV3 | 0.4681 | 2.243
(1.007–4.996) |
4.79×10⁻² |
| NBEA | 0.3292 | 1.706
(1.361–3.379) |
1.26×10⁻² |
| NOV | 0.2839 | 1.317
(1.187–2.525) |
4.07×10⁻² |
| PTN | 0.1638 | 1.563
(1.215–3.418) |
2.63×10⁻² |
| TUSC3 | 0.0332 | 1.188
(1.053–1.711) |
3.76×10⁻² |
| ZSCAN18 | 0.6275 | 2.308
(1.107–4.812) |
2.56×10⁻² |
Based on prognostic coefficients of the 10 optimal
genes, a risk score system was built and risk scores were
calculated using the following formula:
Risk score=(0.3340) × ExpAKAP12 +
(−0.5826) × ExpANGPTL1 + (0.1153) × ExpCYS1 +
(0.4899) × ExpMLLT11 + (0.4681) × ExpNAV3 +
(0.3292) × ExpNBEA + (0.2839) × ExpNOV +
(0.1638) × ExpPTN + (0.0332) × ExpTUSC3 +
(0.6275) × ExpZSCAN18
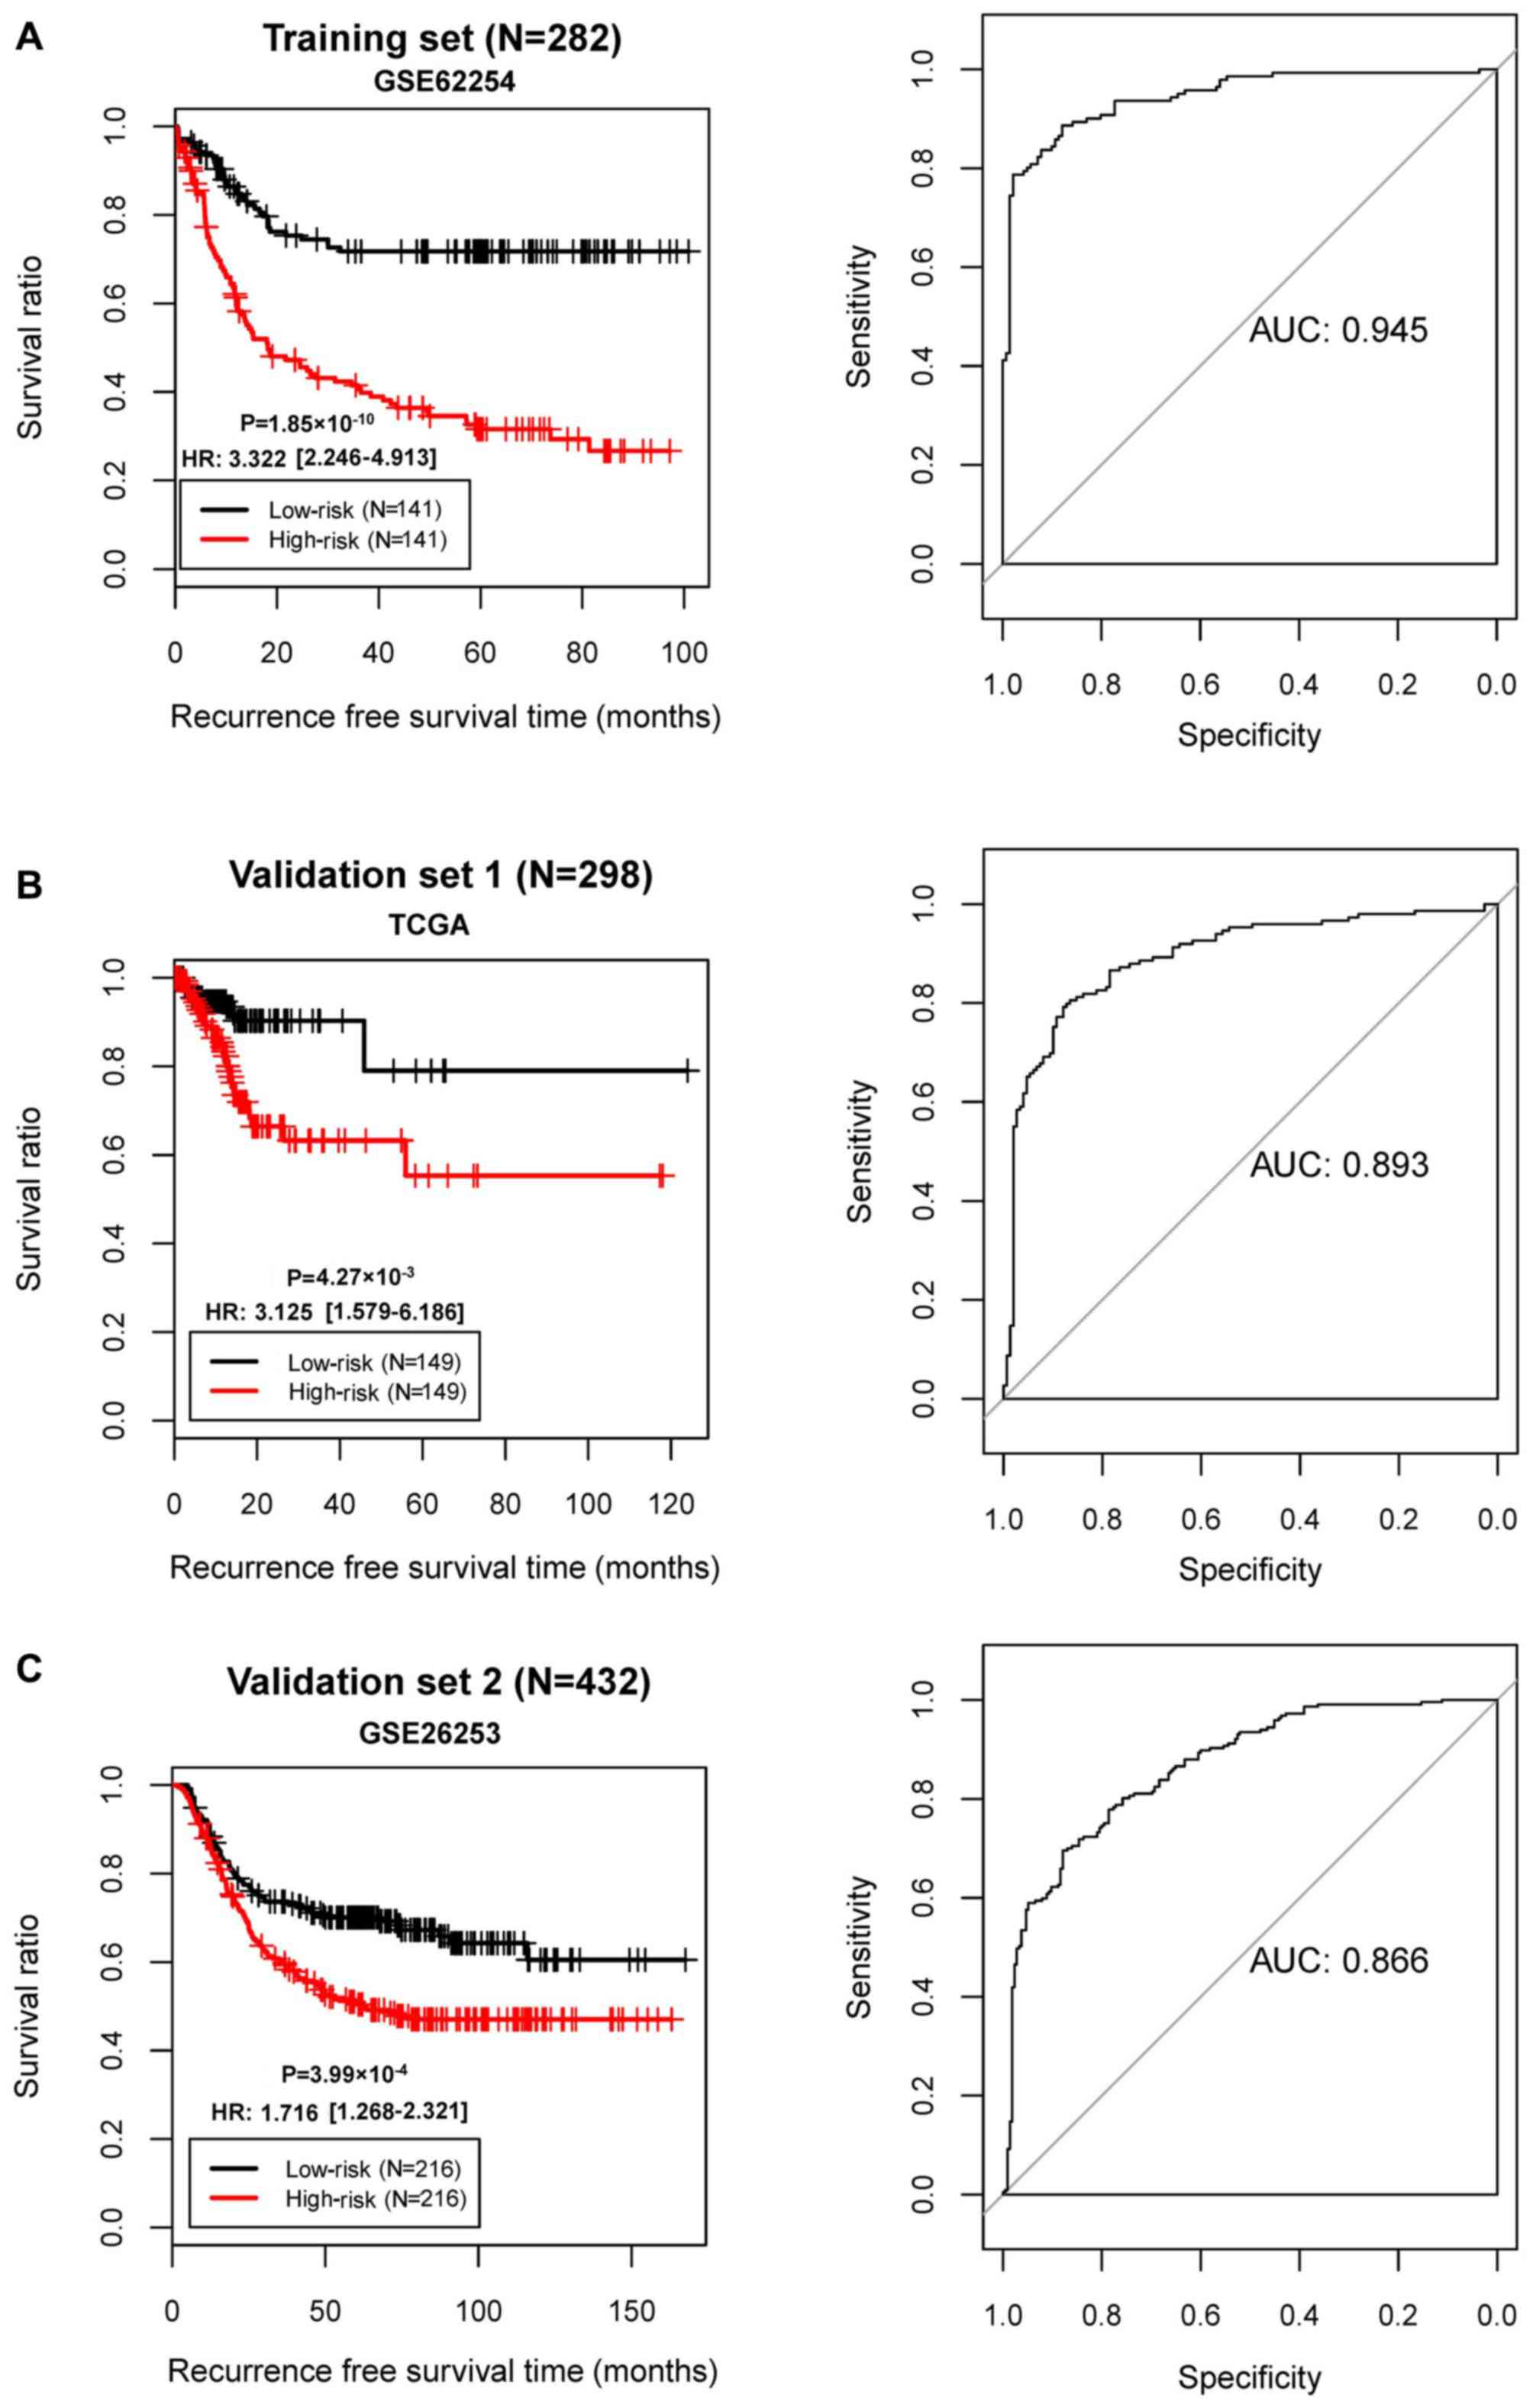
The samples in GSE62254 were divided into high- and
low-risk groups. KM survival curves revealed that the high- and
low-risk groups determined by the risk score system had
significantly different RFS time in all three datasets (GSE62254,
P=1.85×10⁻¹⁰; AUC=0.945; TCGA set,
P=4.27×10⁻³, AUC=0.893; GSE26253,
P=3.99×10⁻⁴, AUC=0.866; Fig. 6). These results revealed robust
prognostic power of the 10-gene risk score.
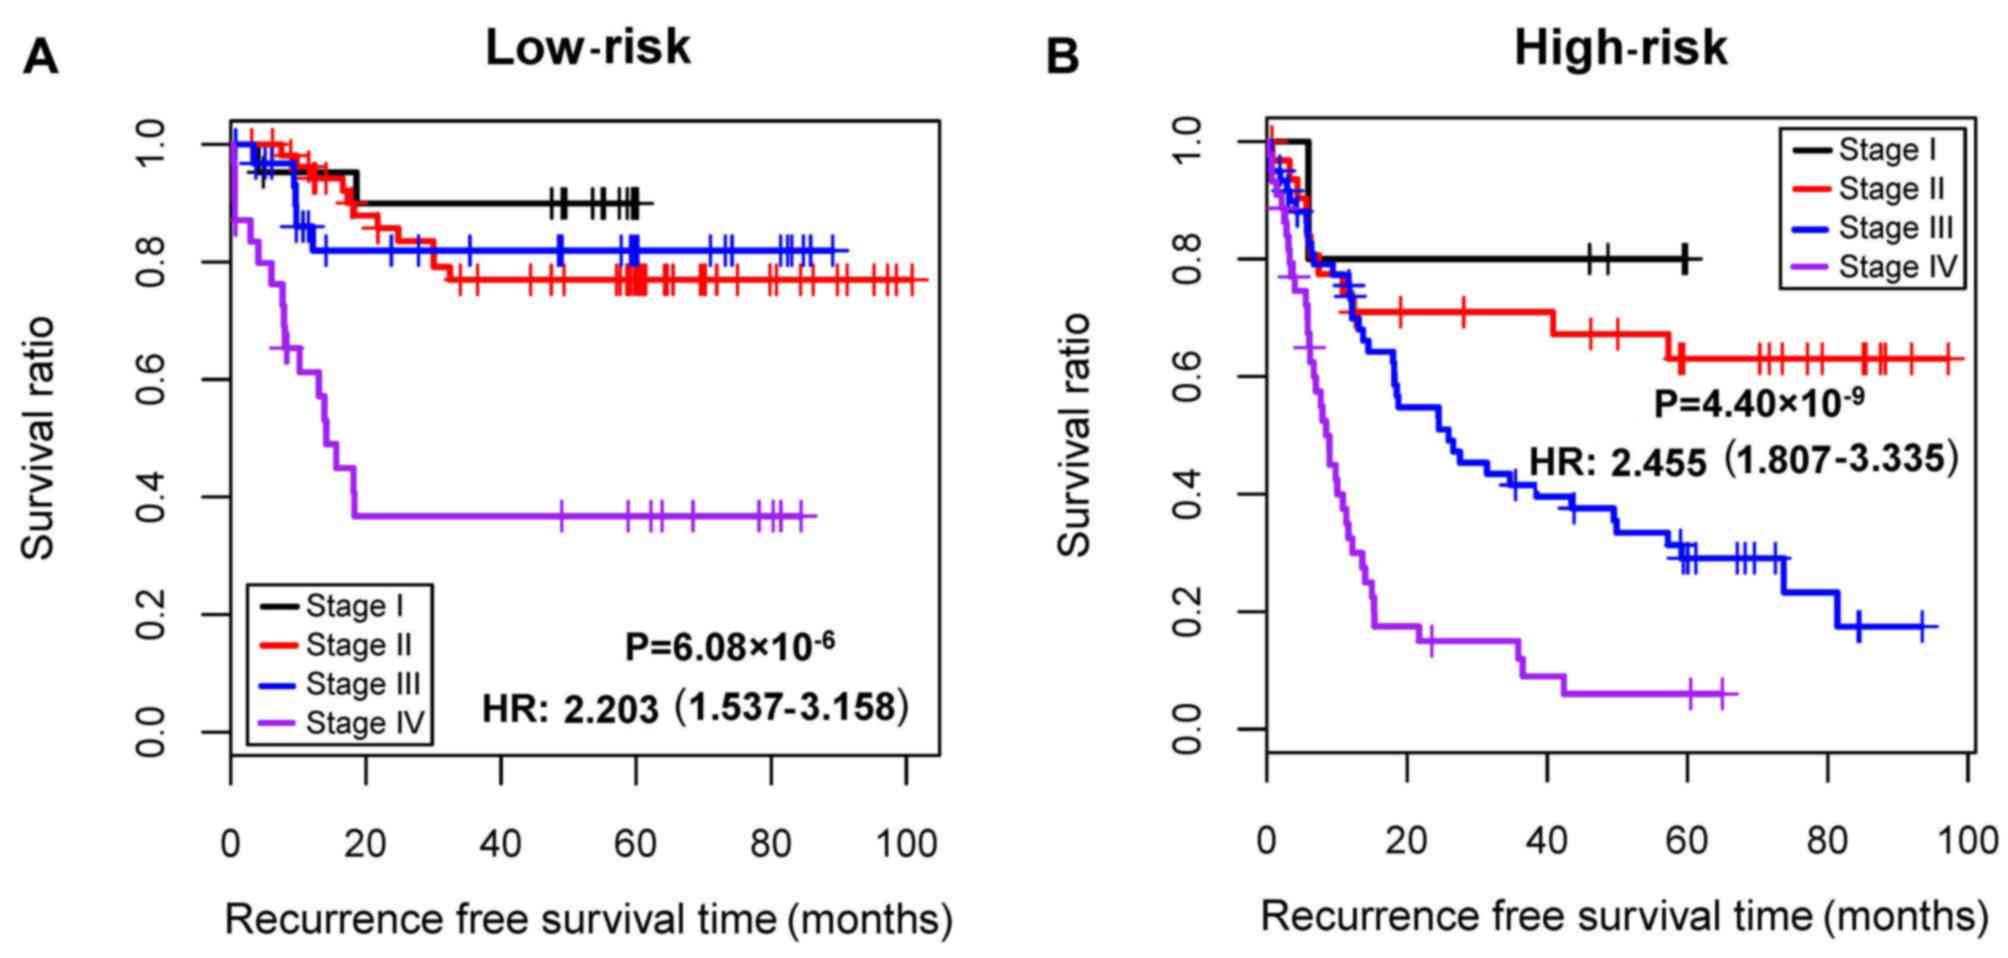
Stratification analysis
Cox regression analysis demonstrated that
pathological stage and risk status were independent prognostic
clinical factors in GSE62254 (Table
IV). Consequently, all samples were stratified into high- and
low-risk groups. Furthermore, stratification analysis revealed that
pathological stage was an independent prognostic clinical factor in
the high-risk group (Table V). In
addition, patients at different pathological stages in the
high-risk group had significantly different RFS time
(P=4.40×10⁻⁹; hazard ratio, 2.455; 95% confidence
interval, 1.807–3.335; Fig.
7).
| Table IV.Results of Cox regression analysis
for the GSE62254 dataset. |
Table IV.
Results of Cox regression analysis
for the GSE62254 dataset.
|
| Univariate Cox | Multivariate
Cox |
|---|
|
|
|
|
|---|
| Clinical
characteristics | HR | 95% CI | P-value | HR | 95% CI | P-value |
|---|
| Age (years, mean ±
SD) | 1.003 | 0.987–1.02 |
6.76×10⁻¹ | – | – | – |
| Sex
(male/female) | 0.967 | 0.669–1.401 |
8.61×10⁻¹ | – | – | – |
| MLH1 IHC
(positive/negative/-) | 2.096 | 1.241–3.544 |
4.72×10⁻³ | 1.023 | 0.564–1.855 |
9.39×10⁻¹ |
| EBV ISH
(positive/negative/-) | 1.044 | 0.509–2.141 |
9.07×10⁻¹ | – | – | – |
| Lymphovascular
invasion (yes/no/-) | 2.409 | 1.456–3.987 |
4.15×10⁻⁴ | 1.552 | 0.899–2.680 |
1.15×10⁻¹ |
| Pathologic M
(M0/M1/-) | 3.839 | 2.364–6.236 |
5.01×10⁻⁹ | 1.293 | 0.719–2.324 |
3.91×10⁻¹ |
| Pathologic N
(N0/N1/N2/N3) | 2.024 | 1.661–2.465 |
5.82×10⁻¹³ | 1.049 | 0.733–1.503 |
7.93×10⁻¹ |
| Pathologic T
(T1/T2/T3/T4/-) | 1.816 | 1.435–2.298 |
4.06×10⁻⁷ | 0.867 | 0.599–1.252 |
4.46×10⁻¹ |
| Pathologic stage
(I/II/III/IV/-) | 2.414 | 1.939–3.005 |
2.22×10⁻¹⁶ | 2.082 | 1.270–3.415 |
3.65×10⁻³ |
| Lauren
classification (diffuse/intestinal/mixed) | 0.874 | 0.739–1.033 |
1.14×10⁻¹ | – | – | – |
| Risk status
(high/low) | 3.322 | 2.246–4.913 |
1.85×10⁻¹⁰ | 2.535 | 1.656–3.882 |
1.86×10⁻⁵ |
| Table V.Results of stratification analysis of
clinical factors. |
Table V.
Results of stratification analysis of
clinical factors.
| A, Low risk |
|---|
|
|---|
|
| Univariate cox | Multivariate
cox |
|---|
|
|
|
|
|---|
| Clinical
characteristics | HR | 95% CI | P-value | HR | 95% CI | P-value |
|---|
| Age (years, mean ±
SD) | 1.029 | 0.992–1.067 |
1.21×10⁻¹ | – | – | – |
| Sex
(male/female) | 1.374 | 0.644–2.933 |
4.09×10⁻¹ | – | – | – |
| MLH1 IHC
(positive/negative/-) | 2.59 | 1.075–6.241 |
2.77×10⁻² | 2.297 | 0.779–6.775 |
1.32×10⁻¹ |
| EBV ISH
(positive/negative/-) | 2.399 | 0.926–6.218 |
6.29×10⁻² | – | – | – |
| Lymphovascular
invasion (yes/no/-) | 3.796 | 1.333–10.81 |
7.19×10⁻³ | 2.782 | 0.965–8.022 |
5.82×10⁻² |
| Pathologic M
(M0/M1/-) | 5.649 | 2.167–14.73 |
6.48×10⁻⁵ | 2.256 | 0.787–6.471 |
1.30×10⁻¹ |
| Pathologic N
(N0/N1/N2/N3) | 2.39 | 1.675–3.41 |
4.15×10⁻⁷ | 1.977 | 0.845–4.623 |
1.16×10⁻¹ |
| Pathologic T
(T1/T2/T3/T4/-) | 1.34 | 0.816–2.2 |
2.45×10⁻¹ | – | – | – |
| Pathologic stage
(I/II/III/IV/-) | 2.203 | 1.537–3.158 |
6.08×10⁻⁶ | 0.961 | 0.397–2.326 |
9.30×10⁻¹ |
| Lauren
classification (diffuse/intestinal/mixed) | 0.869 | 0.628–1.205 |
4.01×10⁻¹ | – | – | – |
|
| B, High
risk |
|
|
| Uni-variate
cox | Multi-variate
cox |
|
|
|
|
| Clinical
characteristics | HR | 95% CI | P-value | HR | 95% CI | P-value |
|
| Age (years, mean ±
SD) | 1.009 | 0.991–1.028 |
3.31×10⁻¹ | – | – | – |
| Sex
(male/female) | 0.868 | 0.566–1.33 |
5.15×10⁻¹ | – | – | – |
| MLH1 IHC
(positive/negative/-) | 0.727 | 0.376–1.406 |
3.42×10⁻¹ | – | – | – |
| EBV ISH
(positive/negative/-) | 0.539 | 0.170–1.711 |
2.87×10⁻¹ | – | – | – |
| Lymphovascular
invasion (yes/no/-) | 1.787 | 1.003–3.183 |
4.58×10⁻² | 1.297 | 0.676–2.487 |
4.34×10⁻¹ |
| Pathologic M
(M0/M1/-) | 2.847 | 1.612–5.027 |
1.63×10⁻⁴ | 1.115 | 0.555–2.239 |
7.59×10⁻¹ |
| Pathologic N
(N0/N1/N2/N3) | 1.706 | 1.332–2.186 |
1.85×10⁻⁵ | 0.987 | 0.666–1.463 |
9.48×10⁻¹ |
| Pathologic T
(T1/T2/T3/T4/-) | 1.722 | 1.262–2.348 |
5.21×10⁻⁴ | 0.977 | 0.630–1.513 |
9.15×10⁻¹ |
| Pathologic stage
(I/II/III/IV/-) | 2.455 | 1.807–3.335 |
4.40×10⁻⁹ | 2.245 | 1.241–4.062 |
7.48×10⁻³ |
| Lauren
classification (diffuse/intestinal/mixed) | 1.018 | 0.841–1.232 |
8.59×10⁻¹ | – | – | – |
Pathway enrichment analysis
Based on the risk score system, the samples in
GSE62254 were divided into high- and low-risk groups. A total of
671 DEGs were identified between the two groups, including 656
upregulated genes and 15 downregulated genes. Pathway enrichment
analysis revealed that eight significant pathways were enriched for
the DEGs (Table VI). According to
the nominal P-value, the top three significant pathways were
‘vascular smooth muscle contraction’, ‘regulation of actin
cytoskeleton’ and ‘tyrosine metabolism’.
| Table VI.Significant pathways enriched for the
differentially expressed genes between high- and low-risk
groups. |
Table VI.
Significant pathways enriched for the
differentially expressed genes between high- and low-risk
groups.
| Pathway | Gene count, n | ES | NES | Nominal
P-value |
|---|
| Vascular smooth
muscle contraction | 9 | 0.5535 | 1.7480 |
8.30×10⁻³ |
| Regulation of actin
cytoskeleton | 8 | 0.4851 | 1.6408 |
1.45×10⁻² |
| Tyrosine
metabolism | 3 | 0.6451 | 1.6072 |
1.72×10⁻² |
| Metabolism of
xenobiotics by cytochrome p450 | 2 | 0.6845 | 1.5654 |
1.80×10⁻² |
| Leukocyte
transendothelial migration | 5 | 0.5237 | 1.5113 |
3.04×10⁻² |
| Tight junction | 9 | 0.4560 | 1.4869 |
3.37×10⁻² |
| Adherens
junction | 2 | 0.6969 | 1.4027 |
3.78×10⁻² |
| Cytokine-cytokine
receptor interaction | 10 | 0.3808 | 1.4334 |
4.29×10⁻² |
Discussion
In the present study, 239 DEGs (189 upregulated and
50 downregulated) were identified between the recurrent and
non-recurrent samples in the GSE62254 dataset. From the 114 DEGs
that were significantly associated with both RFS and OS, 21 feature
genes were further screened. Subsequently, an SVM classifier was
built in GSE62254, which could accurately determine the recurrence
type of GC samples. Additionally, the optimal set of 10 prognostic
genes (AKAP12, ANGPTL1, CYS1, MLLT11, NAV3, NBEA, NOV, PTN,
TUSC3 and ZSCAN18) was obtained, followed by the
construction of a risk score system. The stratification analysis
demonstrated that pathological stage was an independent prognostic
clinical factor in the high-risk group.
AKAP12A expression decreases colony formation
and causes apoptotic cell death; thus, AKAP12A may be a
critical mediator of survival in patients with GC (44). AKAP12 is usually inactivated
in patients with GC and several other types of cancer, serves a
role in regulating cytokinesis progression and functions as a tumor
suppressor (45). The expression
of ANGPTL2 is associated with GC progression, and the
overexpression of ANGPTL2 at both the invasive margin and
tumor center is an independent marker of prognosis in patients with
GC (46,47). Elevated expression of cytoplasmic
ANGPTL2 has been associated with invasion, metastasis and
unfavorable survival in patients with GC, and thus ANGPTL2
may be used as a promising indicator for predicting postoperative
recurrence of GC (48). Therefore,
AKAP12 and ANGPTL1 may be associated with the
outcomes of patients with GC.
The oncogenic factor MLLT11 is associated
with tumor progression and adverse survival, exhibiting
pro-tumorigenic activity in patients with ovarian cancer (49). Signal transducer and activator of
transcription 3 (STAT3) is involved in tumor formation,
development, migration and motility, and MLLT11
overexpression promotes pYSTAT3 expression in invasive
carcinoma cells through activating the Src kinase (50). Copy number changes of NAV3
are often detected in adenomas and colorectal cancer (CRC), and
NAV3 acts in connecting colon inflammation with CRC
development (51). NOV and
cysteine-rich protein 61 (CYR61) are upregulated in GC, and
elevated CYR61 levels are responsible for unfavorable
outcome (52). Additionally,
increased NOV contributes to cell proliferation and invasion
in GC (52). These findings
indicate that MLLT11, NAV3 and NOV may also act in
the development and progression of GC.
Increased PTN is significantly associated
with poor OS time and RFS time of patients with GC, and may serve
as an independent prognostic indicator (53). TUSC3 serves an oncogenic
role in CRC, and may affect proliferation, aggression, invasion and
metastasis of CRC via mediating PI3K/Akt, p38 mitogen-activated
protein kinase and Wnt/β-catenin signaling pathways (54). Decreased levels of TUSC3
contribute to cell proliferation, invasion and metastasis in
pancreatic cancer (PC), which predicts unfavorable outcomes in
patients with PC (55,56). Gene expression and promoter
methylation of ZSCAN18, cysteine dioxygenase 1 and
zinc-finger protein 331 are negatively associated, and these genes
have epigenetic similarity and may be potential biomarkers of
gastrointestinal cancer (57).
Therefore, PTN, TUSC3 and ZSCAN18 may be implicated
in the pathogenesis of GC.
In order to unveil possible biological functions of
the 10 prognostic genes in GC, the present study screened the DEGs
between the two risk groups, classified by the 10-gene risk score.
Pathway enrichment analysis revealed that the resulting DEGs were
significantly enriched with several pathways, including ‘vascular
smooth muscle contraction’, ‘regulation of actin cytoskeleton’ and
‘tyrosine metabolism’. The ‘vascular smooth muscle contraction’ and
‘regulation of actin cytoskeleton’ pathways serve critical roles in
cancer cell migration and invasion (58,59).
Tyrosine phosphorylation enhances the Warburg effect and promotes
tumor growth (60). Therefore, it
can be inferred that the 10 prognostic genes may affect GC
prognosis by modulating cancer migration and growth.
The present study was a secondary analysis based on
282 samples with recurrence information in the GSE62254 dataset. A
study by Cristescu et al (29) used GSE62254 to investigate the
molecular alterations in four subtypes of GC by using targeted
sequencing and genome-wide copy number microarrays. Wang et
al (26) determined a six-gene
signature (RNA binding protein, MRNA processing factor 2, Hes
related family BHLH transcription factor with YRPW motif like,
nestin, thiopurine S-Methyltransferase, SWI/SNF related, matrix
associated, actin dependent regulator of chromatin, subfamily D,
member 3 and family with sequence similarity 127, member A), based
on GSE62254, as a prognostic biomarker in patients with GC. The six
survival-associated genes were selected using a robust
likelihood-based survival model from the prognosis-associated genes
identified by univariate survival analysis (26). By contrast, the present study
focused on recurrence-associated DEGs to identify prognostic genes
and acquired a prognostic 10-gene signature. The application of
different analysis methods, analysis processes and screening
thresholds is another underlying factor of the different results
obtained by the two studies.
Although complex bioinformatics analyses were
conducted for the gene expression profile of GC, the limitations of
the present study should not be neglected. The primary limitation
of the present study was the lack of experiments. In subsequent
studies, experiments such as quantitative PCR and western blotting
should be performed to validate the findings of the present
study.
In conclusion, 239 DEGs were identified between the
recurrent and non-recurrent samples of GSE62254. Furthermore, the
SVM classifier may be applied for distinguishing recurrent from
non-recurrent patients with GC. Additionally, the risk score system
involving 10 optimal genes may be used for predicting the prognosis
of patients with GC.
Acknowledgements
Not applicable.
Funding
No funding was received.
Availability of data and materials
The datasets used and/or analyzed during the current
study are available from the corresponding author on reasonable
request.
Authors' contributions
HJ performed data analyses and wrote the manuscript.
JG, JD, XQ and CQ contributed significantly in data analyses and
manuscript revision. BF conceived and designed the study. All
authors read and approved the final manuscript.
Ethics approval and consent to
participate
Not applicable.
Patient consent for publication
Not applicable.
Competing interests
The authors declare that they have no competing
interests.
Glossary
Abbreviations
Abbreviations:
|
GC
|
gastric cancer
|
|
SVM
|
Support Vector Machine
|
|
DEGs
|
differentially expressed genes
|
|
NOX
|
nicotinamide adenine dinucleotide
phosphate oxidases
|
|
ATM
|
ataxia telangiectasia mutated
|
|
FBLN1
|
fibulin-1
|
|
KM
|
Kaplan-Meier
|
References
|
1
|
Forman D: Helicobacter pylori and gastric
cancer. Scand J Gastroenterol Suppl. 215:48–51. 1996. View Article : Google Scholar : PubMed/NCBI
|
|
2
|
Nunobe S, Sasako M, Saka M, Fukagawa T,
Katai H and Sano T: Symptom evaluation of long-term postoperative
outcomes after pylorus-preserving gastrectomy for early gastric
cancer. Gastric Cancer. 10:167–172. 2007. View Article : Google Scholar : PubMed/NCBI
|
|
3
|
Araya M, Terashima M, Takagane A, Abe K,
Nishizuka S, Yonezawa H, Irinoda T, Nakaya T and Saito K:
Microvessel count predicts metastasis and prognosis in patients
with gastric cancer. J Surg Oncol. 65:232–236. 1997. View Article : Google Scholar : PubMed/NCBI
|
|
4
|
Liu S, Feng F, Xu G, Liu Z, Tian Y, Guo M,
Lian X, Cai L, Fan D and Zhang H: Clinicopathological features and
prognosis of gastric cancer in young patients. BMC Cancer.
16:4782016. View Article : Google Scholar : PubMed/NCBI
|
|
5
|
de Martel C, Forman D and Plummer M:
Gastric cancer: Epidemiology and risk factors. Gastroenterol Clin
North Am. 42:219–240. 2013. View Article : Google Scholar : PubMed/NCBI
|
|
6
|
Mcguire S: World Cancer Report 2014.
Geneva, Switzerland: World health organization, international
agency for research on cancer, WHO Press, 2015. Adv Nutr.
7:418–419. 2016. View Article : Google Scholar : PubMed/NCBI
|
|
7
|
Jian-bo X, Hui W, Yu-long H, Chang-hua Z,
Long-juan Z, Shi-rong C and Wen-hua Z: Astrocyte-elevated gene-1
overexpression is associated with poor prognosis in gastric cancer.
Med Oncol. 28:455–462. 2011. View Article : Google Scholar : PubMed/NCBI
|
|
8
|
Sun J, Ling B, Xu X, Ma R, Li G, Cao X,
Ling W, Yang Z, Hoffman RM and Lu J: Decreased expression of
tumor-suppressor gene LKB1 correlates with poor prognosis in human
gastric cancer. Anticancer Res. 36:869–875. 2016.PubMed/NCBI
|
|
9
|
Ma LG, Bian SB, Cui JX, Xi HQ, Zhang KC,
Qin HZ, Zhu XM and Chen L: LKB1 inhibits the proliferation of
gastric cancer cells by suppressing the nuclear translocation of
Yap and β-catenin. Int J Mol Med. 37:1039–1048. 2016. View Article : Google Scholar : PubMed/NCBI
|
|
10
|
You X, Ma M, Hou G, Hu Y and Shi X: Gene
expression and prognosis of NOX family members in gastric cancer.
Onco Targets Ther. 11:3065–3074. 2018. View Article : Google Scholar : PubMed/NCBI
|
|
11
|
Han M, Ma L, Qu Y and Tang Y: Decreased
expression of the ATM gene linked to poor prognosis for gastric
cancer of different nationalities in Xinjiang. Pathol Res Pract.
213:908–914. 2017. View Article : Google Scholar : PubMed/NCBI
|
|
12
|
Feng L, Yao C, Li P, Feng Y, Wang F, Liu
YF, Guo YB, Mao QS and Xue WJ: Low expression of fibulin-1
correlates with unfavorable prognosis in gastric cancer. Tumor
Biol. 37:9399–9410. 2016. View Article : Google Scholar
|
|
13
|
Baĭramov RB and Abdullaeva RT: The impact
of early gastric cancer diagnosis on indices of survival in
patients after radical surgical intervention. Klin Khir. 18–21.
2013.(In Russian).
|
|
14
|
Kim JW, Hwang I, Kim MJ and Jang SJ:
Clinicopathological characteristics and predictive markers of early
gastric cancer with recurrence. J Korean Med Sci. 24:1158–1164.
2009. View Article : Google Scholar : PubMed/NCBI
|
|
15
|
Liu X, Cai H and Wang Y: Prognostic
significance of tumor markers in T4a gastric cancer. World J Surg
Oncol. 10:682012. View Article : Google Scholar : PubMed/NCBI
|
|
16
|
Cho JY, Lim JY, Cheong JH, Park YY, Yoon
SL, Kim SM, Kim SB, Kim H, Hong SW, Park YN, et al: Gene expression
signature-based prognostic risk score in gastric cancer. Clin
Cancer Res. 17:1850–1857. 2011. View Article : Google Scholar : PubMed/NCBI
|
|
17
|
Wang Z, Yan Z, Zhang B, Rao Z, Zhang Y,
Liu J, Yu L, Zhao Y, Yang B, Wu T and Gao J: Identification of a
5-gene signature for clinical and prognostic prediction in gastric
cancer patients upon microarray data. Med Oncol. 30:6782013.
View Article : Google Scholar : PubMed/NCBI
|
|
18
|
Shen J, Wei J, Wang H, Yue G, Yu L, Yang
Y, Xie L, Zou Z, Qian X, Ding Y, et al: A three-gene signature as
potential predictive biomarker for irinotecan sensitivity in
gastric cancer. J Transl Med. 11:732013. View Article : Google Scholar : PubMed/NCBI
|
|
19
|
Wang P, Wang Y, Hang B, Zou X and Mao JH:
A novel gene expression-based prognostic scoring system to predict
survival in gastric cancer. Oncotarget. 7:55343–55351.
2016.PubMed/NCBI
|
|
20
|
Zhao X, Cai H, Wang X and Ma L: Discovery
of signature genes in gastric cancer associated with prognosis.
Neoplasma. 63:239–245. 2016.PubMed/NCBI
|
|
21
|
Hou JY, Wang YG, Ma SJ, Yang BY and Li QP:
Identification of a prognostic 5-Gene expression signature for
gastric cancer. J Cancer Res Clin Oncol. 143:619–629. 2017.
View Article : Google Scholar : PubMed/NCBI
|
|
22
|
Wang Z, Chen G, Wang Q, Lu W and Xu M:
Identification and validation of a prognostic 9-genes expression
signature for gastric cancer. Oncotarget. 8:73826–73836.
2017.PubMed/NCBI
|
|
23
|
Li Y, Yu Q, Zhu R, Wang Y, Li J, Wang Q,
Guo W, Fu S and Zhu L: A six-gene signature predicts clinical
outcome of gastric adenocarcinoma. Comb Chem High Throughput
Screen. 21:444–452. 2018. View Article : Google Scholar : PubMed/NCBI
|
|
24
|
Deng X, Xiao Q, Liu F and Zheng C: A gene
expression-based risk model reveals prognosis of gastric cancer.
PeerJ. 6:e42042018. View Article : Google Scholar : PubMed/NCBI
|
|
25
|
Min L, Zhao Y, Zhu S, Qiu X, Cheng R, Xing
J, Shao L, Guo S and Zhang S: Integrated analysis identifies
molecular signatures and specific prognostic factors for different
gastric cancer subtypes. Transl Oncol. 10:99–107. 2017. View Article : Google Scholar : PubMed/NCBI
|
|
26
|
Wang J, Gao P, Sun J and Shi J: A six-gene
prognostic predictor for patients with gastric cancer. Oncotarget.
5:2018.
|
|
27
|
Kim S, Lim DH, Lee J, Kang WK, MacDonald
JS, Park CH, Park SH, Lee SH, Kim K, Park JO, et al: An
observational study suggesting clinical benefit for adjuvant
postoperative chemoradiation in a population of over 500 cases
after gastric resection with D2 nodal dissection for adenocarcinoma
of the stomach. Int J Radiat Oncol Biol Phys. 63:1279–1285. 2005.
View Article : Google Scholar : PubMed/NCBI
|
|
28
|
Yoo CH, Noh SH, Shin DW, Choi SH and Min
JS: Recurrence following curative resection for gastric carcinoma.
Br J Surg. 87:236–242. 2000. View Article : Google Scholar : PubMed/NCBI
|
|
29
|
Cristescu R, Lee J, Nebozhyn M, Kim KM,
Ting JC, Wong SS, Liu J, Yue YG, Wang J, Yu K, et al: Molecular
analysis of gastric cancer identifies subtypes associated with
distinct clinical outcomes. Nat Med. 21:449–456. 2015. View Article : Google Scholar : PubMed/NCBI
|
|
30
|
Lee J, Sohn I, Do IG, Kim KM, Park SH,
Park JO, Park YS, Lim HY, Sohn TS, Bae JM, et al: Nanostring-based
multigene assay to predict recurrence for gastric cancer patients
after surgery. PLoS One. 9:e901332014. View Article : Google Scholar : PubMed/NCBI
|
|
31
|
Therneau TM: A Package for Survival
Analysis in S. R package version 2.41–3. http://cran.nexr.com/web/packages/survival/index.html
|
|
32
|
Kouznetsov D and Trappmann H:
Superfunctions and sqrt of factorial. Moscow Univ Phys Bull.
65:6–12. 2010. View Article : Google Scholar
|
|
33
|
Ritchie ME, Phipson B, Wu D, Hu Y, Law CW,
Shi W and Smyth GK: limma powers differential expression analyses
for RNA-sequencing and microarray studies. Nucleic Acids Res.
43:e472015. View Article : Google Scholar : PubMed/NCBI
|
|
34
|
He X, Tan X, Wang X, Jin H, Liu L, Ma L,
Yu H and Fan Z: C-Myc-activated long noncoding RNA CCAT1 promotes
colon cancer cell proliferation and invasion. Tumor Biol.
35:12181–12188. 2014. View Article : Google Scholar
|
|
35
|
Kuhn M: Building predictive models in R
using the caret package. J Stat Software. 28:1–26. 2008. View Article : Google Scholar
|
|
36
|
Mavroforakis ME and Theodoridis S: Support
Vector Machine (SVM) classification through geometry. Proceedings
of the 2005 13th European Signal Processing Conference. IEEE;
Antalya: pp. 1–4. 2013
|
|
37
|
Meyer D: Support vector machines the
interface to libsvm in package e1071. R News. 1:1–3. 2013.
|
|
38
|
Schröder MS, Culhane AC, Quackenbush J and
Haibe-Kains B: Survcomp: An R/Bioconductor package for performance
assessment and comparison of survival models. Bioinformatics.
27:3206–3208. 2011. View Article : Google Scholar : PubMed/NCBI
|
|
39
|
Kalderstam J, Edén P, Bendahl PO, Strand
C, Fernö M and Ohlsson M: Training artificial neural networks
directly on the concordance index for censored data using genetic
algorithms. Artif Intell Med. 58:125–132. 2013. View Article : Google Scholar : PubMed/NCBI
|
|
40
|
Ferro CAT and Fricker TE: A bias-corrected
decomposition of the Brier score. Quarterly J Royal Meteorological
Soc. 138:1954–1960. 2012. View Article : Google Scholar
|
|
41
|
Robin X, Turck N, Hainard A, Tiberti N,
Lisacek F, Sanchez JC and Müller M: pROC: An open-source package
for R and S+ to analyze and compare ROC curves. BMC Bioinformatics.
12:772011. View Article : Google Scholar : PubMed/NCBI
|
|
42
|
Ripatti S and Palmgren J: Estimation of
multivariate frailty models using penalized partial likelihood.
Biometrics. 56:1016–1022. 2000. View Article : Google Scholar : PubMed/NCBI
|
|
43
|
Alexeyenko A, Lee W, Pernemalm M, Guegan
J, Dessen P, Lazar V, Lehtiö J and Pawitan Y: Network enrichment
analysis: Extension of gene-set enrichment analysis to gene
networks. BMC Bioinformatics. 13:2262012. View Article : Google Scholar : PubMed/NCBI
|
|
44
|
Choi MC, Jong HS, Kim TY, Song SH, Lee DS,
Lee JW, Kim TY, Kim NK and Bang YJ: AKAP12/Gravin is inactivated by
epigenetic mechanism in human gastric carcinoma and shows growth
suppressor activity. Oncogene. 23:7095–7103. 2004. View Article : Google Scholar : PubMed/NCBI
|
|
45
|
Choi MC, Lee YU, Kim SH, Park JH, Kim HA,
Oh DY, Im SA, Kim TY, Jong HS and Bang YJ: A-kinase anchoring
protein 12 regulates the completion of cytokinesis. Biochem Biophys
Res Commun. 373:85–89. 2008. View Article : Google Scholar : PubMed/NCBI
|
|
46
|
Shimura T, Tanaka K, Saigusa S, Kondo S,
Kitajima T, Toiyama Y, Okugawa Y, Inoue Y, Araki TH, Uchida K, et
al: Abstract 1139: Prognostic value of angiopoietin-like protein 2
(ANGPTL2) at the tumor margins in patients with gastric cancer.
Cancer Res. 73:11392013.
|
|
47
|
Sheng WZ, Chen YS, Tu CT, He J, Zhang B
and Gao WD: ANGPTL2 expression in gastric cancer tissues and cells
and its biological behavior. World J Gastroenterol. 22:10364–10370.
2016. View Article : Google Scholar : PubMed/NCBI
|
|
48
|
Shimura T, Toiyama Y, Tanaka K, Saigusa S,
Kitajima T, Kondo S, Okigami M, Yasuda H, Ohi M, Araki T, et al:
Angiopoietin-like protein 2 as a predictor of early recurrence in
patients after curative surgery for gastric cancer. Anticancer Res.
35:4633–4639. 2015.PubMed/NCBI
|
|
49
|
Tiberio P, Lozneanu L, Angeloni V,
Cavadini E, Pinciroli P, Callari M, Carcangiu ML, Lorusso D,
Raspagliesi F, Pala V, et al: Involvement of AF1q/MLLT11 in the
progression of ovarian cancer. Oncotarget. 8:23246–23264. 2017.
View Article : Google Scholar : PubMed/NCBI
|
|
50
|
Park J, Kim S, Joh J, Remick SC, Miller
DM, Yan J, Kanaan Z, Chao JH, Krem MM, Basu SK, et al: MLLT11/AF1q
boosts oncogenic STAT3 activity throughSrc-PDGFR tyrosine kinase
signaling. Oncotarget. 7:43960–43973. 2016.PubMed/NCBI
|
|
51
|
Carlsson E, Ranki A, Sipilä L, Karenko L,
Abdel-Rahman WM, Ovaska K, Siggberg L, Aapola U, Ässämäki R, Häyry
V, et al: Potential role of a navigator gene NAV3 in colorectal
cancer. Br J Cancer. 106:517–524. 2012. View Article : Google Scholar : PubMed/NCBI
|
|
52
|
Li J, Gao X, Ji K, Sanders AJ, Zhang Z,
Jiang WG, Ji J and Ye L: Differential expression of CCN family
members CYR611, CTGF and NOV in gastric cancer and their
association with disease progression. Oncol Rep. 36:2517–2525.
2016. View Article : Google Scholar : PubMed/NCBI
|
|
53
|
Hu H, Li C, Cai S, Zhu C, Tian Y, Zheng J,
Hu J, Chen C and Liu W: Increased expression of pleiotrophin is a
prognostic marker for patients with gastric cancer.
Hepatogastroenterology. 61:1478–1482. 2014.PubMed/NCBI
|
|
54
|
Gu Y, Wang Q, Guo K, Qin W, Liao W, Wang
S, Ding Y and Lin J: TUSC3 promotes colorectal cancer progression
and epithelial-mesenchymal transition (EMT) through WNT/β-catenin
and MAPK signalling. J Pathol. 239:60–71. 2016. View Article : Google Scholar : PubMed/NCBI
|
|
55
|
Fan X, Zhang X, Shen J, Zhao H, Yu X, Chen
Y, Zhuang Z, Deng X, Feng H, Wang Y and Peng L: Decreased TUSC3
promotes pancreatic cancer proliferation, invasion and metastasis.
PLoS One. 11:e01490282016. View Article : Google Scholar : PubMed/NCBI
|
|
56
|
Vašíčková K, Horak P and Vaňhara P: TUSC3:
Functional duality of a cancer gene. Cell Mol Life Sci. 75:849–857.
2017. View Article : Google Scholar : PubMed/NCBI
|
|
57
|
Vedeld HM, Andresen K, Eilertsen IA,
Nesbakken A, Seruca R, Gladhaug IP, Thiis-Evensen E, Rognum TO,
Boberg KM and Lind GE: The novel colorectal cancer biomarkers CDO1,
ZSCAN18 and ZNF331 are frequently methylated across
gastrointestinal cancers. Int J Cancer. 136:844–853. 2015.
View Article : Google Scholar : PubMed/NCBI
|
|
58
|
Louis SF and Zahradka P: Vascular smooth
muscle cell motility: From migration to invasion. Exp Clin Cardiol.
15:e75–e85. 2010.PubMed/NCBI
|
|
59
|
Yamaguchi H and Condeelis J: Regulation of
the actin cytoskeleton in cancer cell migration and invasion.
Biochim Biophys Acta. 1773:642–652. 2007. View Article : Google Scholar : PubMed/NCBI
|
|
60
|
Hitosugi T, Fan J, Chung TW, Lythgoe K,
Wang X, Xie J, Ge Q, Gu TL, Polakiewicz RD, Roesel JL, et al:
Tyrosine phosphorylation of mitochondrial pyruvate dehydrogenase
kinase 1 is important for cancer metabolism. Mol Cell. 44:864–877.
2011. View Article : Google Scholar : PubMed/NCBI
|